 Flavia Savi1*Eiko Nemitz2*
 Mhairi Coyle2,3
 Matt Aitkenhead3Kfa Frumau4
 Giacomo Gerosa5Angelo Finco5Carten Gruening6Ignacio Goded6Benjamin Loubet7
 Patrick Stella8Taaina Ruuskanen9T. Weidinger10L. Horvath11,12Terenzio Zenone13
 Silvano Fares1,14*
- 1Council for Agricultural Research and Economics (CREA) – Research Centre for Forestry and Wood, Rome, Italy
- 2Centre for Ecology and Hydrology (CEH), Bush Estate, Penicuik, United Kingdom
- 3The James Hutton Institute, Aberdeen, United Kingdom
- 4Energy Research Centre of the Netherlands, Petten, Netherlands
- 5Department of Mathematics and Physics “Niccolò Tartaglia”, Università Cattolica del Sacro Cuore, Brescia, Italy
- 6European Commission, Joint Research Centre, Ispra, Italy
- 7INRA, UMR INRA-AgroParisTech ECOSYS, Université Paris-Saclay, Thiverval-Grignon, France
- 8UMR SAD-APT, AgroParisTech, INRA, Université Paris-Saclay, Paris, France
- 9Institute for Atmospheric and Earth System Research/Physics, Faculty of Science, University of Helsinki, Helsinki, Finland
- 10Department of Meteorology, Eötvös Loránd University, Budapest, Hungary
- 11Hungarian Meteorological Service, Budapest, Hungary
- 12MTA-SZIE Plant Ecology Research Group, Szent István University, Gödöllõ, Hungary
- 13College of Life and Environmental Sciences, University of Exeter, Exeter, United Kingdom
- 14National Research Council, Institute for BioEconomy, Rome, Italy
Tropospheric ozone (O3) is probably the air pollutant most damaging to vegetation. Understanding how plants respond to O3 pollution under different climate conditions is of central importance for predicting the interactions between climate change, ozone impact and vegetation. This work analyses the effect of O3 fluxes on net ecosystem productivity (NEP), measured directly at the ecosystem level with the eddy covariance (EC) technique. The relationship was explored with artificial neural networks (ANNs), which were used to model NEP using environmental and phenological variables as inputs in addition to stomatal O3 uptake in Spring and Summer, when O3 pollution is expected to be highest. A sensitivity analysis allowed us to isolate the effect of O3, visualize the shape of the O3-NEP functional relationship and explore how climatic variables affect NEP response to O3. This approach has been applied to eleven ecosystems covering a range of climatic areas. The analysis highlighted that O3 effects over NEP are highly non-linear and site-specific. A significant but small NEP reduction was found during Spring in a Scottish shrubland (−0.67%), in two Italian forests (up to −1.37%) and during Summer in a Californian orange orchard (−1.25%). Although the overall seasonal effect of O3 on NEP was not found to be negative for the other sites, with episodic O3 detrimental effect still identified. These episodes were correlated with meteorological variables showing that O3 damage depends on weather conditions. By identifying O3 damage under field conditions and the environmental factors influencing to that damage, this work provides an insight into O3 pollution, climate and weather conditions.
Introduction
Tropospheric ozone (O3) is a harmful air pollutant which affects human health (Ainsworth et al., 2012), damages vegetation, including natural ecosystems and crops (The Royal Society, 2008), and contributes to climate change, being a greenhouse gas with a radiative forcing of 0.35–0.37 W m–2 (Shindell et al., 2009). It is a secondary pollutant, mainly produced through photochemical reactions of methane, carbon monoxide and volatile organic compounds in the presence of nitrogen oxides (Monks et al., 2015).
Although O3 is a natural component of the troposphere, its concentration has been increasing since the pre-industrial era as a result of anthropogenic emission of its precursors (Ainsworth et al., 2012). Nowadays, the background O3 mixing ratio of the northern hemisphere is 30 to 40 ppb (Parrish et al., 2012), although large regional differences are recorded due to the strong influence of weather, which promotes O3 formation in warm, dry and sunny conditions (see Table 2 for mean O3 mixing ratio at our study sites).
Following chemical destruction, the second most important sink of tropospheric O3 is the dry deposition on land surfaces, primarily controlled by vegetation, which contributes to O3 removal through stomatal uptake, deposition onto the surface, and in-canopy chemistry (Stevenson et al., 2006). Major O3 uptake occurs at leaf level, controlled by stomatal absorption (Cieslik, 2004; Fowler et al., 2009). Entering the leaves through stomata, O3 sets off a chain of oxidative reactions within the apoplast, damaging cell metabolism (Wohlgemuth et al., 2002). The main detrimental effect is a reduction in carbon assimilation, which represents the first evidence of O3 impact over vegetation, before the occurrence of visible injuries.
Manipulation experiments have been widely used to assess the impact of O3 over vegetation carbon assimilation capacity (Karlsson et al., 2000; Manning, 2005; Gerosa et al., 2015). While this approach has been useful in understanding vegetation behavior in standard conditions and to derive dose-response functions, it may be inadequate to provide the complete picture, since plants are often exposed to unrealistic concentrations, the approach is often limited to young plants, and the experimental facilities alter the microclimate.
An ecosystem approach is thus of primary importance for understanding how O3 pollution affects CO2 uptake by vegetation and to assess the validity of extrapolating the effect (Sitch et al., 2007). Eddy covariance (EC) towers, from which the carbon flux is measured with a wide range of meteorological variables at high temporal resolution, provide large datasets which can be used to extrapolate information about ecosystem responses to O3 pollution (Fares et al., 2018).
A useful tool for investigating functional relationships between site characteristics and environmental factors such as climate and other atmospheric conditions is Artificial Neural Network (ANN) modeling (Aitkenhead and Coull, 2016). ANNs are very powerful in analyzing and modeling non-linear relationships owing to their capacity to learn from examples and generalize, allowing them to explore relationships without making assumptions about the shape of these relations (such as are made by other approaches such as multiple linear regression) (Olden and Jackson, 2002; Moffat et al., 2010). Although ANNs are primarily used in the building of predictive models, methods for quantifying the independent variable contributions within networks have also been developed (Olden et al., 2004), allowing researchers to use them to understand how climate variables drive ecosystem responses (Moffat et al., 2010).
In this work, feed-forward ANNs were used to test the hypothesis that current O3 concentration affect vegetation photosynthetic CO2 assimilation under field condition by isolating the effect of O3 on the net ecosystem productivity (NEP) of eleven ecosystems, characterized by different climatic condition and O3 concentration, taking into account the influence of other NEP climatic drivers (solar radiation, air temperature, vapor pressure deficit, soil water content) and stomatal conductance. This approach is fully empirical and avoids a priori assumption on the functional relationships between the study variables, which are measured directly. The analysis was conducted using daytime eddy covariance (EC) data directly measured over: eight northern hemisphere open tree canopies; one moorland; one grassland and one cropland. We had the following aims: (1) to determine if current O3 concentrations affect vegetation photosynthetic CO2 assimilation under field condition; (2) to quantify potential CO2 assimilation decrease due to O3; (3) to evaluate how O3 effects change according to other environmental factors variations. Understanding how O3 effect over NEP is linked to environmental factors variation would help understanding vegetation behavior in the context of a changing climate.
Materials and Methods
Study Sites
Eleven sites from three eddy covariance flux measurement networks were selected to test the effect of O3 pollution on NEP different type of vegetation: four semi-natural forests, three planted forests, one orange orchard, one moorland, one grassland and one cropland. The study sites are spread across five different Köppen climatic areas: Oceanic (Auchencorth Moss, Grignon, Lochristi, Speulderbos), Semi-arid-Continental (Bugac), Subartic (Hyytiälä), Humid-Subtropical (Bosco Fontana, Ispra) and Mediterranean (Castelporziano, Blodgett, Lindcove). Information about site location and ecosystem type can be found in Table 1 and a map showing the ECLAIRE site locations can be found in Fares et al. (2018).
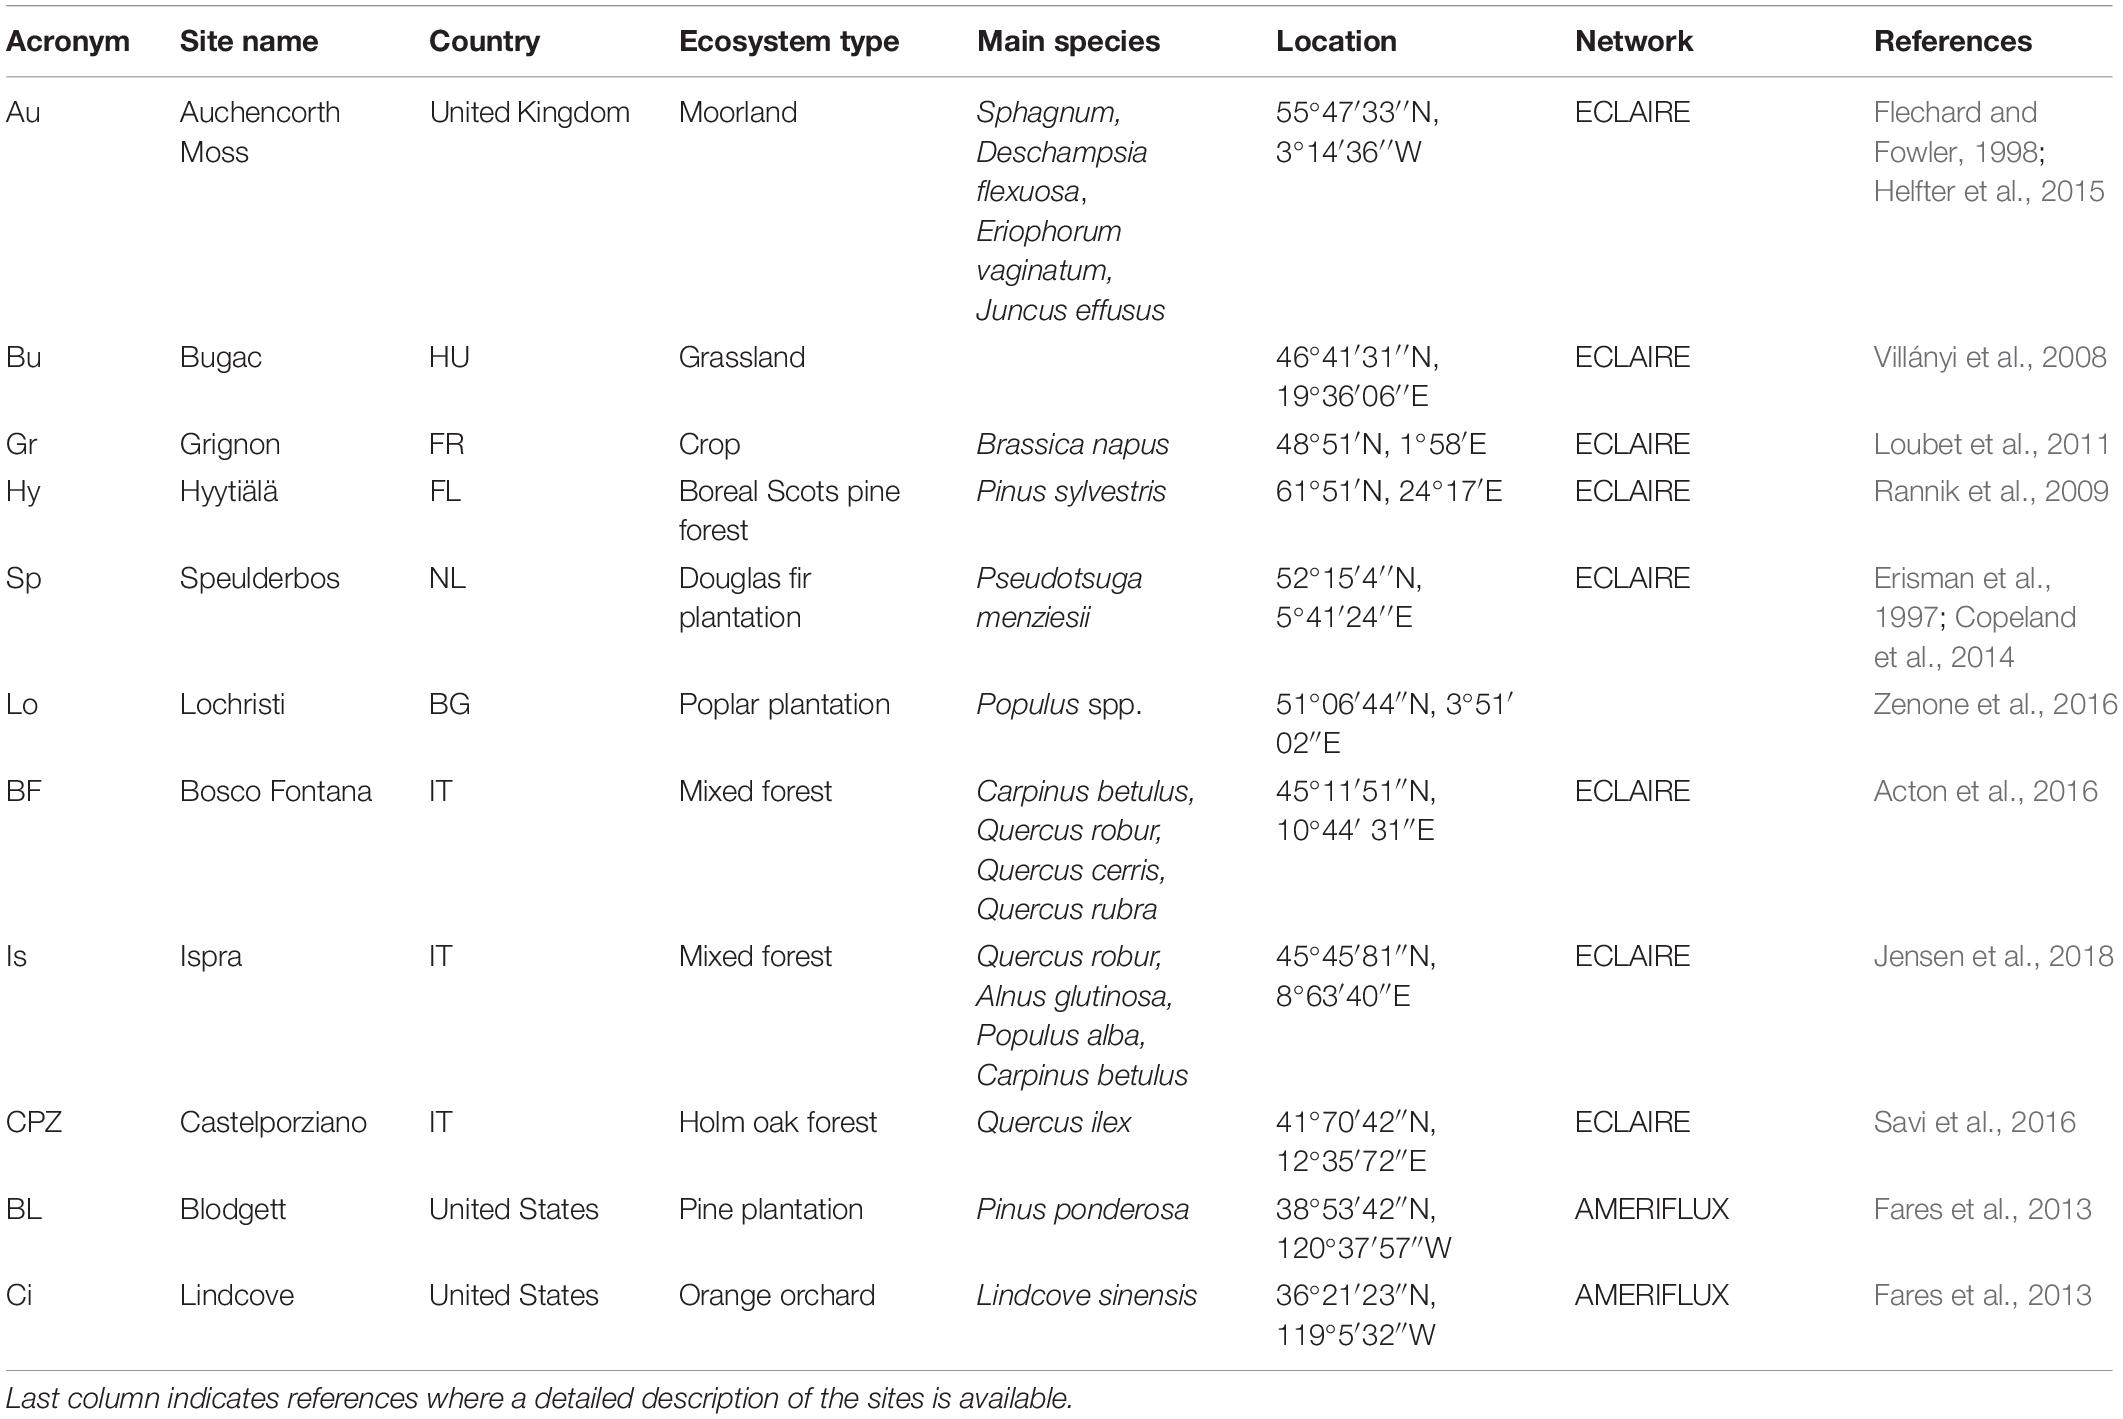
Table 1. Brief description of location and ecosystem type for the study sites.
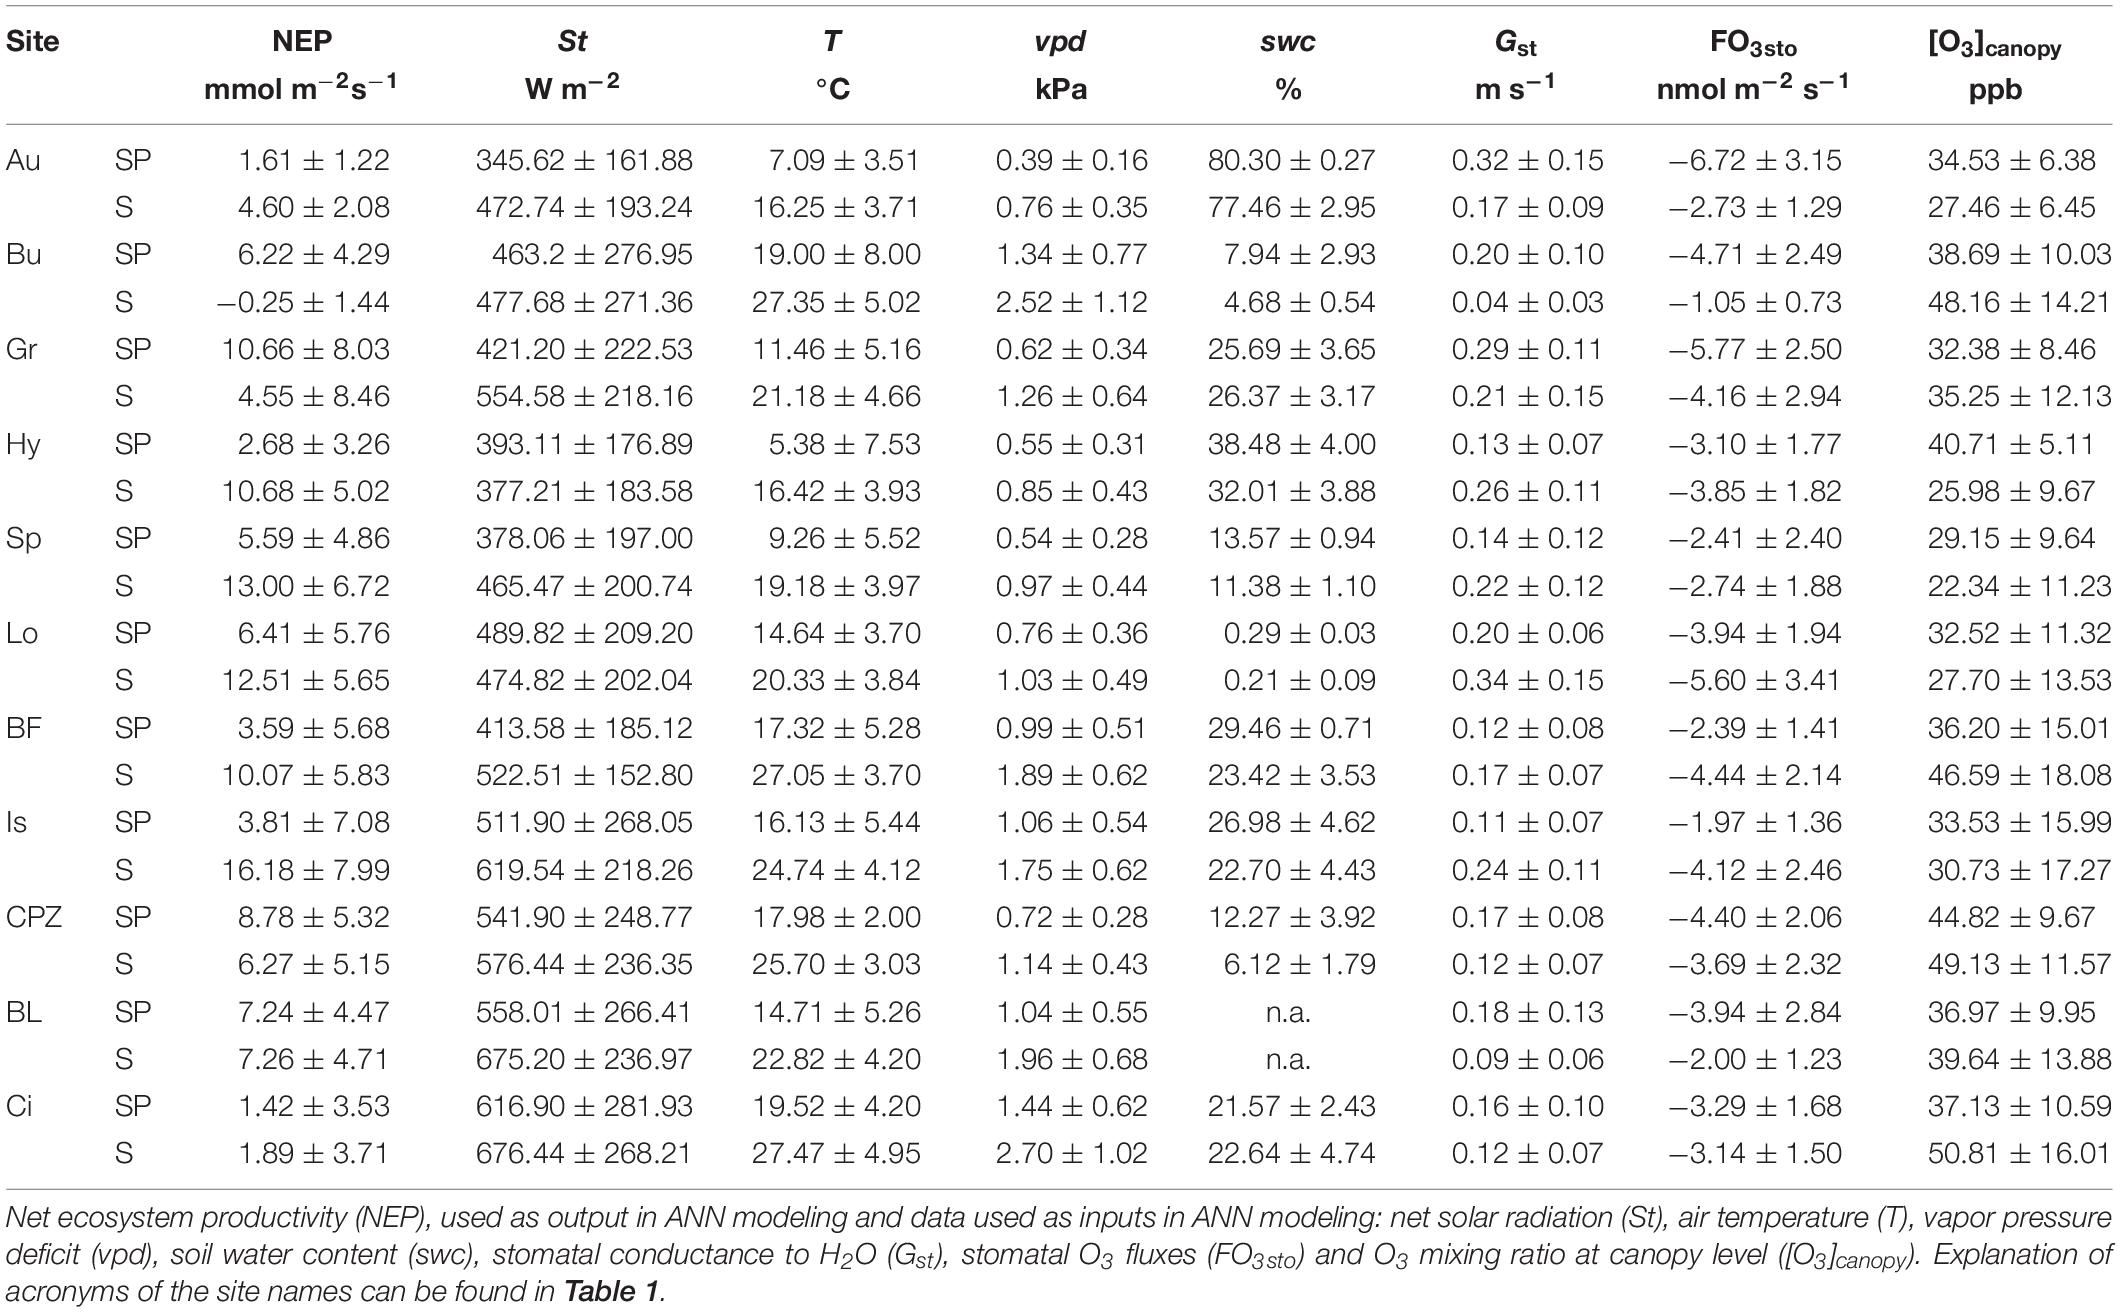
Table 2. Mean ± standard deviation of the data recorded during daytime (10:00 – 18:00) of Spring and Summer seasons.
Datasets
Data used in the development of the ANNs was recorded continuously from EC towers, at half-hour intervals, from January 2012 to December 2013 for all sites, except for: (1) Blodgett where data was collected from January 2001 to December 2007; (2) Lindcove which operated from 2009 to 2010; (3) Castelporziano for which data were collected from 2013 to 2015 and (4) Grignon, where only the dataset with rapeseed was used (31 August 2012 to 15 August 2013). Only relevant data for detecting O3 effect over NEP were considered in the study. Since damage occurs due to O3 stomatal absorption (Reich and Amundson, 1985; Biswas et al., 2007; Broschè et al., 2010), we reduced the dataset to daytime data (10:00 – 18:00 UTC time) from the Spring and Summer seasons, when stomata are open and O3 levels in the atmosphere are high. A summary of data used in this study is given in Table 2.
Although data coverage was incomplete over the measured period at each site, interpolation of large gaps was avoided in order to make sure that the functional relationships captured by ANNs were unbiased. Small gaps (less of 50% of missing data over 10:00–18:00 period in a day) were replaced by the mean of correspondent half-hour data of adjacent days (Falge et al., 2001).
Stomatal conductance to H2O (Gst, m s–1) was calculated as the inverse of stomatal resistance (Rs), derived from measured latent heat flux (E, kg m–2 s–1) using the evaporative/resistance method (Monteith, 1981):
where cp is the specific heat capacity of air (J kg–1 K–1), ρ is the density of the dry air (kg m–3) qa is the vapor pressure at measurement height (Pa), qs is the saturation mass fraction (Pa) of H2O at air temperature and roughness length z0, γ is the psychrometric constant (67 Pa K–1) and λ is the vaporization heat for H2O (2.5 × 10⁶ J kg–1).
The use of E to calculate Rs is valid only if transpiration is the only significant source of water vapor from the ecosystem and thus only data recorded during dry-daylight conditions were used. Data were discarded if they met any of the following criteria: net solar radiation <20 W m–2, relative humidity > 80%, rainy days (daily rainfall > 2 mm day–1) or the day after a rain event. Discarded data are mainly located when Rs is also large, hence little influence on overall dose is expected. Percentages of data discarded by this procedure are as follow: 25% for Auchencorth Moss (Au), 11% for Bugac (Bu), 24% for Grignon (Gr), 18% for Hyytiälä (Hy), 19% for Speulderbos (Sp), 31% for Lochristi (Lo), 15% for Bosco Fontana (BF), 18% for Ispra (Is), 15% for Castelporziano (CPZ), 6% for Blodgett (BL) and 11% for Lindcove (Ci).
O3 stomatal uptake (FO3sto, nmol m–2 s–1) was calculated as:
where 0.61 is the ratio of diffusivity between O3 and H2O (Marrero and Mason, 1972) and [O3]canopy is the O3 concentration at the canopy level. The latter was calculated following the standard resistance analogy (Hicks et al., 1987). A detailed explanation of the calculation can be found in Supplementary Appendix 1.
Artificial Neural Network Modeling
Artificial neural networks (ANNs) were used to model the NEP. An ANN can be defined as a large series of simultaneous equations with each variable equivalent to a simple processing element (node) connected to each other by connection weights. Appropriate values within the connection weights provide the network with the ability to store knowledge about some modeled system. A supervised learning algorithm (i.e. with predefine input and output values within the training data) adjusts the connection weights, randomly assigned at the beginning, to approximate relationships that are present in the data.
Three ANN model runs were conducted, trained using three different groups of input variables. The three cases were used to test the hypothesis that O3 influences NEP:
Case 1. ANNs were trained using solar radiation (St, W m–2), air temperature (T,°C), vapor pressure deficit (vpd, kPa), soil water content measured between 10 and 30 cm depth (swc,%, not available for BL) and stomatal conductance to H2O (Gst, m s–1).
Case 2. Included all Case 1 input variables plus O3 stomatal uptake (FO3sto, nmol m–2 s–1). The latter was included in the analysis under the assumption that, if O3 has a detrimental effect on vegetation (and thus on NEP), it would be caused by the O3 entering the leaves. If O3 absorbed through stomata affects NEP, the ANN model’s ability to predict NEP would be improved.
Case 3. consisted of Case 1 input variables plus the O3 dose absorbed through stomata integrated over 3 h before the measure time (FO3cum, μmol s m–2). This case was used to test if accumulated O3 entering the stomata was a better predictor of NEP damage than instantaneous O3 stomatal uptake, under the assumption that antioxidants are consumed by O3 during the day and a longer exposition to high O3 level reduces the leaf capacity to detoxify O3 entering the stomata due to fast scavenging of antioxidant defense in the intercellular spaces. The 3-h interval was chosen because it was the longest interval which permitted us to not include the night-time data (i.e. at 10 am, FO3cum integrated measurements between 7 am and 9 am).
In Case 1, O3 variables were not considered so that, if the model performance was better using Case 1 rather than Case 2 or 3, O3 had no effect on NEP.
All input variables and NEP values within the dataset were normalized by scaling between 0 and 1, to ensure that no variables had an inherently greater effect than others. The dataset was split into two subsets, Spring (from 21st of March to 20th of June) and Summer (from 21st of June to 22nd of September), and ANNs were trained separately for each subset, with the aim of highlighting the seasonal variability of the response of NEP to O3. Feed forward ANNs with a sigmoid activation function were used.
The feed-forward ANN was made of three layers: one input layer, a single hidden layer and an output layer. In a feed-forward ANN the information flows only in a forward direction, from the input to the output through the hidden layer. Layers are composed of nodes, with nodes in adjacent layers fully interconnected by weights which are determined by a supervised learning algorithm appropriate for non-linear regression (backpropagation algorithm, Rumelhart, 1986). In this work, the hidden layer consisted of 8 nodes. The number of nodes of the hidden layer war chosen by comparing the performance of different networks, with 1 to 10 hidden nodes, and choosing the number that produced the best network performance (Gevrey et al., 2003; Olden et al., 2004).
For each group, ANN training was repeated 100 times, because different ANNs trained with the same dataset may return different connection weights, depending on the training procedure and initially randomized connection weights. A common criticism of ANN modeling is “overfitting,” which is the case that ANN memorizes the training data but may fail to fit new data (Chan et al., 2006). Overfitting occurs when the model is parameterized to give the best possible fit to the training data, rather than to the “global dataset” possible from all possible examples of the system being studied. While this is a risk of all data mining or statistical regression approaches, the same solution can be applied as here: datasets were split randomly into three subsets: training (70% of dataset), test (15% of dataset) and validation (15% of dataset). The training subset was used to compute the weights of the network’s nodes and the test subset for stopping the training process and checking the model generalization ability. The validation subset was used to validate the model and prove the ANN’s ability to generalize beyond the training dataset.
Artificial neural network development and training was carried out using Neural Network Toolbox (Matlab 2010, Natick, MA, United States).
Performance of ANNs
One-way analysis of variance (ANOVA, confidence interval 95%) was used to determine whether there were any statistically significant differences between the means of the original measured NEP and the 100 modeled NEP values derived from ANN simulations of each case. If a statistical difference was found, a post hoc test was performed to detect which specific simulation differed from measured NEP, in order to discard that simulation and train the ANN again. The coefficient of determination (r2) was used as a measure of goodness of fit, and as an indicator to evaluate if the inclusion of O3 parameters into ANN models improved the model ability to simulate NEP, thus suggesting an effect of O3 over NEP.
Artificial neural network model was compared with a linear statistical approach, Multiple Linear Regression (MLR). MLR model is used to explore the relationship between a dependent variable and independent variables, under the assumption that each independent variable has a linear relationship with the dependent variable (Civelekoglu et al., 2008). In this work, MLR was used to model the linear relationship between NEP and the three groups of input variables (case 1, case 2 and case 3, see above) which were the same input variables of ANN modeling. The MLR r2 was calculated and compared with ANN r2, in order to evaluate if the ANN approach better performed than the linear approach in predicting NEP behavior.
Analysis Tools for Quantifying O3 Contributions as NEP Driver in ANN Modeling
The integrated information gathered from ANNs can be decomposed to disentangle the effects of different inputs on the output values, to improve understanding of how each input variable affects the predictions. Gevrey et al. (2003) and Olden et al. (2004) provided a comparison of the different existing methods for estimating variables importance in ANN applications. In this work, the partial derivative method (Dimopoulos et al., 1995) was used to isolate the effect of O3 over NEP estimated by ANN modeling.
The partial derivative method produces a profile of the output variations for unit change of selected input variable. The link between the modification of the input, xj, and the variation of the output, yj = f(xj), is the partial derivative of each activation function with respect to its input (dj), with j = 1,…,N and N the total number of observations.
Given an ANN with n inputs i (i = 1,…,n), one hidden layer with mh nodes h (h = 1,…,mh) where the logistic sigmoid function is used for activation, the partial derivative of yj with respect to xi is dji (Dimopoulos et al., 1999; Gevrey et al., 2003):
where Sj is the derivative of the output with respect to its input, Ihj is the response of the h hidden node, who is the weight between the output node and h, wih is the weight between h and the input node (ni).
Partial derivatives were calculated for each of the ANN runs and averaged to calculate the mean absolute change of NEP associated with O3. To get information about positive and negative change of NEP, positive and negative fraction of the partial derivatives were averaged separately (Moffat et al., 2010).
The weather influence on O3 down-regulating effect was tested using Spearman partial correlation. This is a non-parametric measure of rank correlation that assesses monotonic relationships of two variables whilst controlling for other, potentially confounding variables. The negative fraction of partial derivative associated with O3 (FO3st or FO3cum) was correlated with environmental factors such as solar radiation, air temperature, vapor pressure deficit, soil water content and O3 concentration at canopy level. The latter was included in the analysis with the aim of controlling the confounding effect it may have on correlation coefficients, since O3 concentration strongly depends on weather (Monks et al., 2015). All environmental factors were transformed between 0 and 1 to avoid scale effects.
Results
Performance of ANNs
The ANOVA test highlighted that there are no statistically significant differences between the means of the original measured NEP and the 100 modeled NEP derived from ANN simulations (confidence interval 95%). The r2 values (Table 3) attested the data mining capability of the ANNs: the best performances were obtained for the northern sites, especially Grignon and Hyytiälä (0.93 and 0.94, respectively), while the lowest r2 values were from the Blodgett and Bosco Fontana sites (0.39 and 0.40, respectively).
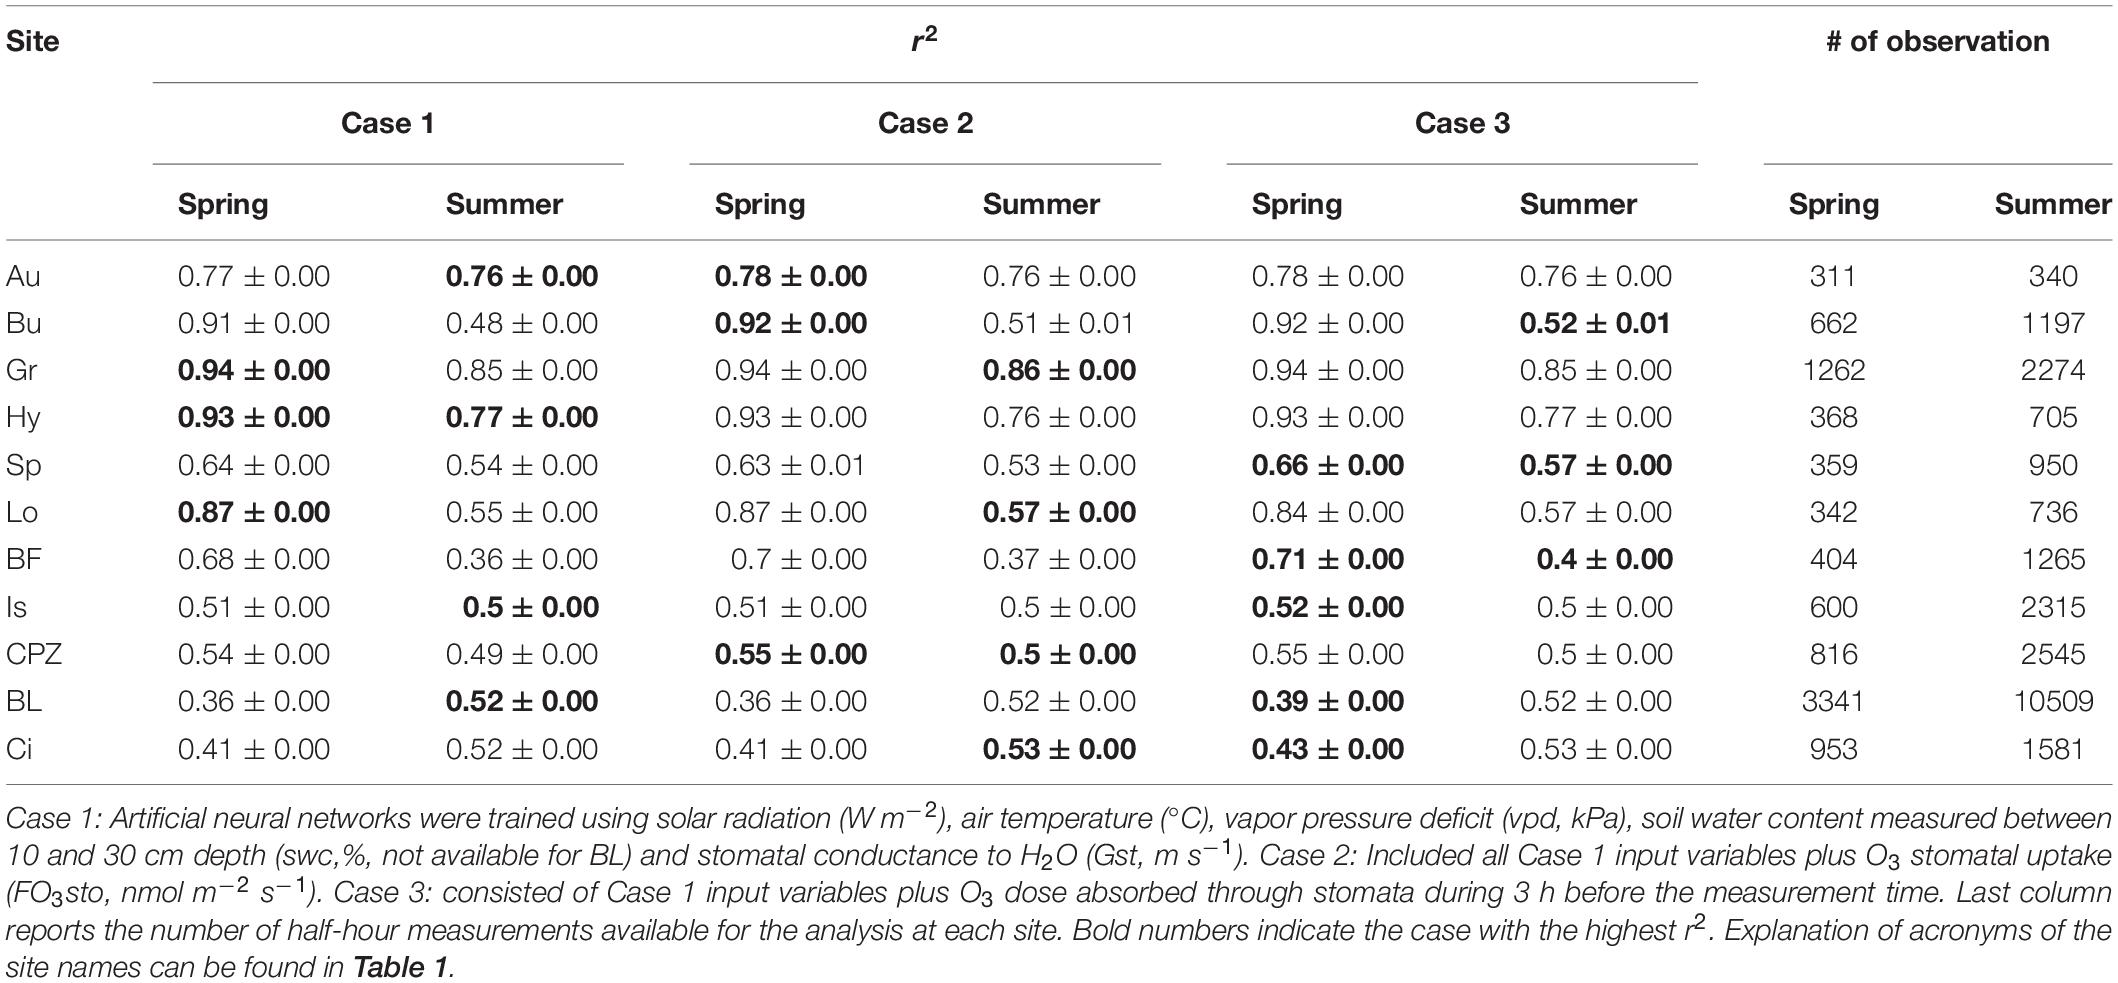
Table 3. Mean r2 ± standard deviation of the 100 ANN simulations trained with Spring and Summer data.
Multiple linear regression modeling produced poorer r2 values (Table 4) in comparison to ANN modeling (Table 3) in every single case. MLR modeling r2 are on average 0,16 ± 0,06 points lower that ANN r2.
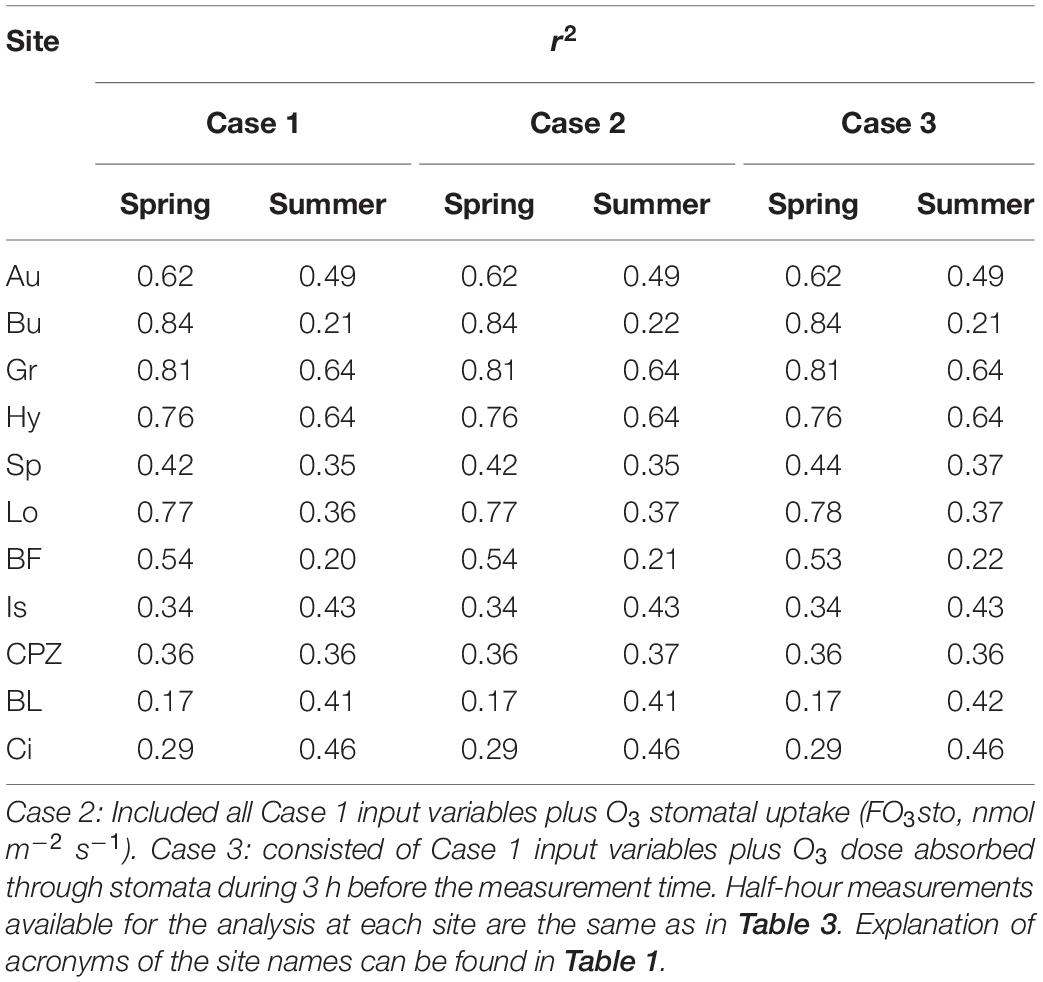
Table 4. r2 derived from MLR modeling of NEP calculated separately for Spring and Summer from three combination of independent variables: Case 1: solar radiation (W m–2), air temperature (°C), vapor pressure deficit (vpd, kPa), soil water content measured between 10 and 30 cm depth (swc,%, not available for BL) and stomatal conductance to H2O (Gst, m s–1).
Do Current O3 Levels Affect NEP?
The inclusion of O3 stomatal uptake in the ANN simulation did not change ANN performance (i.e. no impact of O3) in some cases, and in others it improved the ANN performance (i.e. O3 had an impact). In particular, the results suggest that O3 damage does not occur in most of the northern sites which are less exposed to O3 pollution, while in the other ecosystems a limited effect was observed.
Artificial neural networks trained with Spring data (Table 3) showed no O3 effect on NEP for Hyytiälä, Grignon and Lochristi sites, where the Case 1 model run returned the highest r2. For the same period, we detected an effect of O3 on NEP for Auchencorth Moss, Bugac and Castelporziano sites, where the inclusion of O3 stomatal flux in the model (Case 2) resulted in an r2 increase compared with the Case 1 model. For Speulderbos, Bosco Fontana, Ispra, Blodgett and Lindcove the best ANN performance was achieved for Case 3, (inclusion in the model of 3-h O3 dose), indicating that the preceding O3 dose to which vegetation is exposed is the best predictor of O3 effects over NEP for these sites.
Different results were achieved by training the ANNs with Summer data (Table 3). No O3 effect was found for Hyytiälä, Auchencorth Moss, Ispra and Blodgett, while an O3 effect was detected for Grignon, Lochristi, Castelporziano and Lindcove, where the instantaneous stomatal O3 flux was the better predictor for the O3 effect on NEP. For Bugac, Speulderbos and Bosco Fontana, the cumulative O3 dose was the best predictor.
Since the 3-h O3 dose was calculated from cumulated instantaneous O3 stomatal fluxes, r2 between the two parameters was calculated at each site to verify the degree of independence of the two variables. They were shown to be fully independent (r2 = 0.00) for Lindcove, Blodgett, Castelporziano, Bosco Fontana, Speulderbos and Hyytiälä. An r2 value of 0.00 was also found for Auchencorth Moss and Ispra in Summer, while in Spring r2 were 0.10 and 0.25, respectively. Higher r2 were found for Grignon (0.45 and 0.73 for Spring and Summer, respectively), Bugac (0.37 and 0.42 for Spring and Summer, respectively), and Lochristi (0.25 and 0.48 for Spring and Summer, respectively).
Assessing the Sensitivity of NEP to Current O3 Levels
Partial derivatives represent NEP rate of change with respect to O3 (FO3st or FO3cum). If this rate is negative, then the NEP will tend to decrease as FO3st or FO3cum increases while if the rate is positive, NEP will tend to increase. Partial derivatives were calculated for each half hour observation. Partial derivatives calculated with respect to one predictor can be positive for some half hours and negative for other half hours. This means that a predictor has not always a positive or negative effect on NEP, and that it depends on the combination of all ANN predictors values occurring at that time.
Averaging separately positive and negative partial derivatives helps to discern when O3 has a negative effect over NEP. Figure 1 shows that, although the O3 variables were significant factors for predicting NEP in the ANN model runs, they did not always lead to a reduction in NEP. Reduction of NEP related to O3 was detected at Auchencorth Moss, Bugac, Grignon, Bosco Fontana, Castelporziano, Blodgett and Lindcove in Spring, Grignon, Bosco Fontana and Lindcove in Summer (Figure 1), with values ranging from 0.15 to 2.64% average NEP loss due to O3 (Table 5).
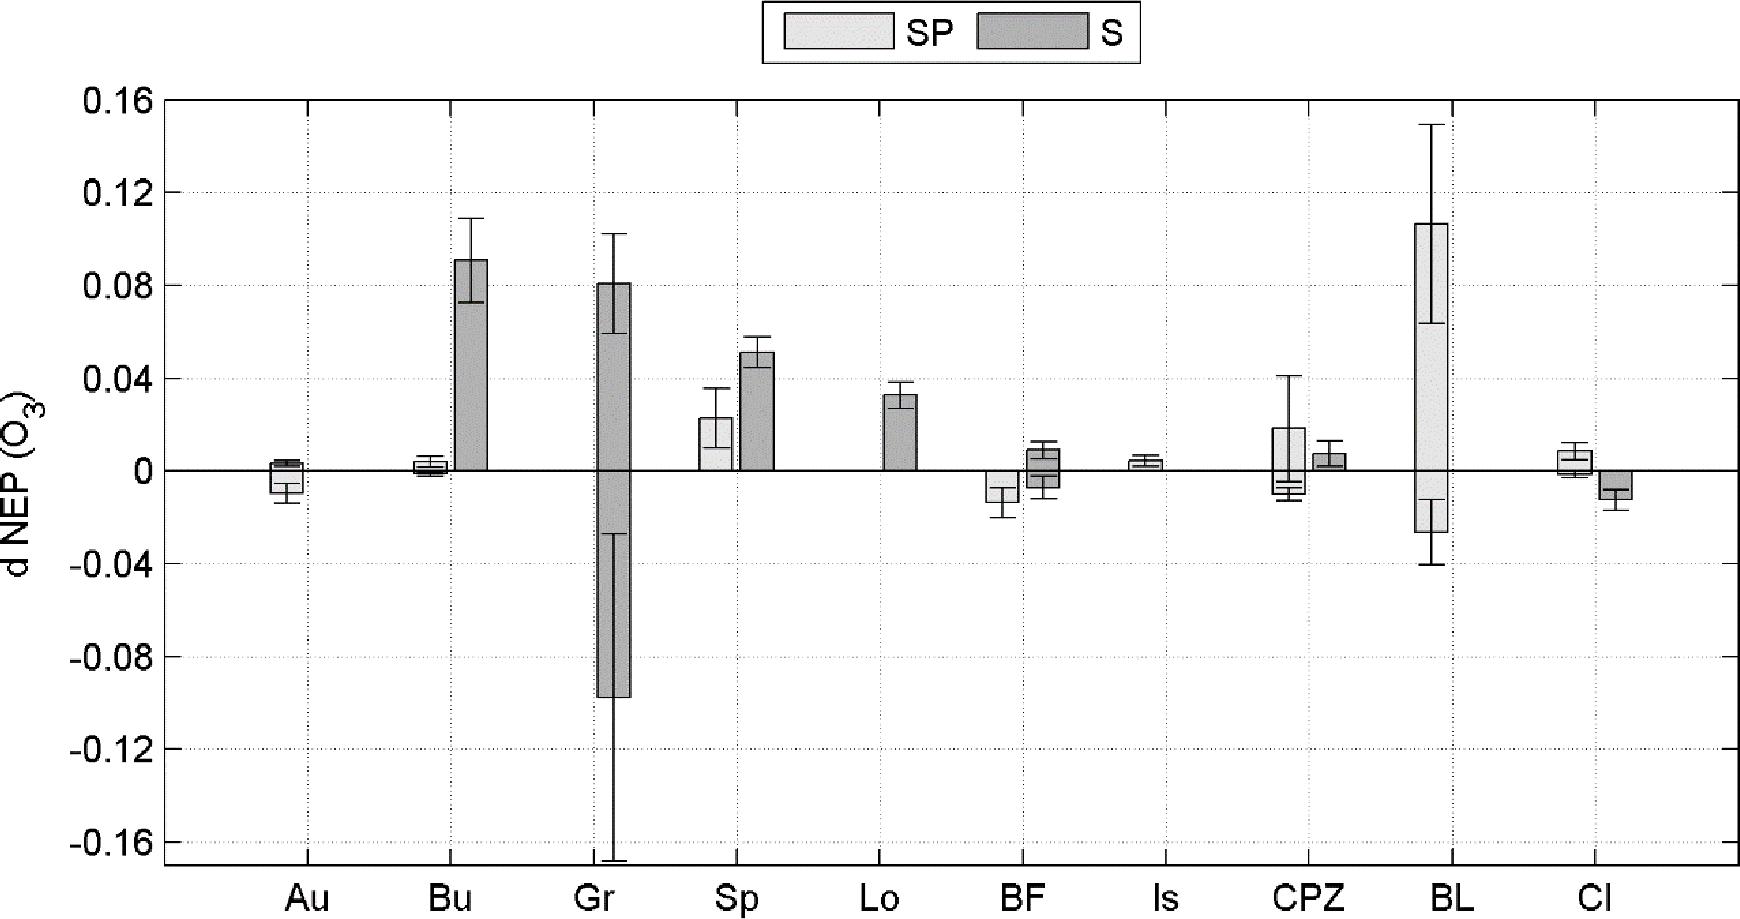
Figure 1. Positive and negative sensitivity of the NEP response to FO3st or FO3CUM (d NEP (O3), presented separately for Spring (SP) and Summer (S) seasons. Bars represent standard deviations.
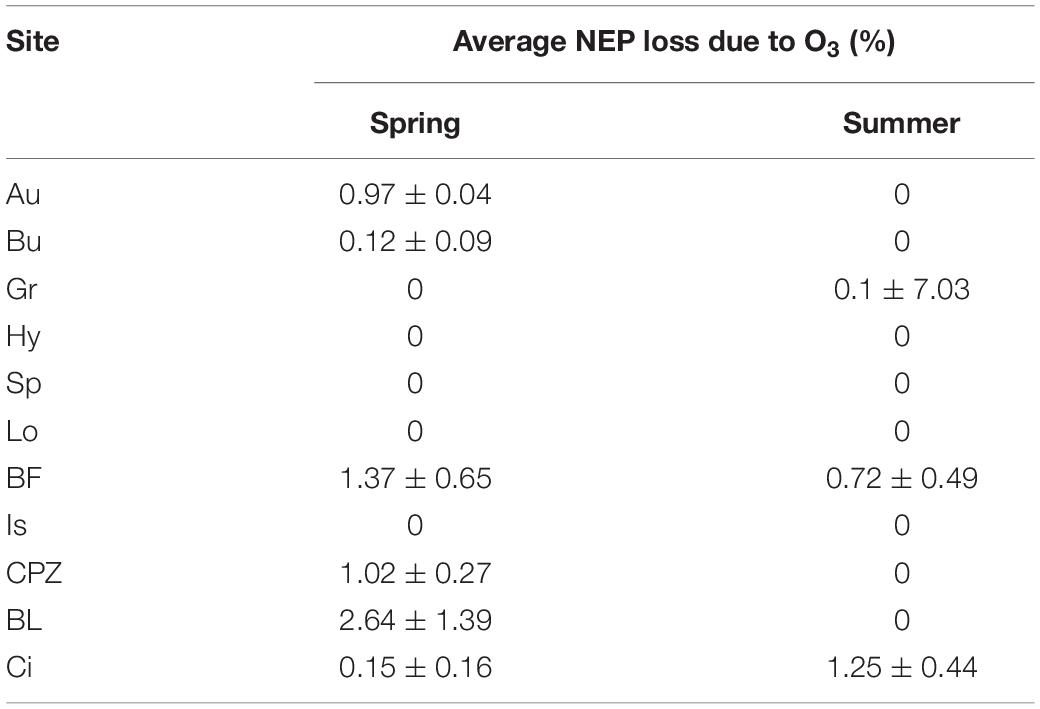
Table 5. Average NEP loss due to O3 in Spring and Summer seasons. Explanation of acronyms of the site names can be found in Table 1.
In a few cases the response is only negative, indicating that current O3 concentration level consistently reduces NEP during Spring or Summer, for all combinations of the other predictors. This is the case of Bosco Fontana in Spring and Lindcove in Summer. In other cases, the ANN did not always determine O3 to be a damaging factor for NEP. To highlight how the rate of change of NEP responds to different levels of O3 entering the stomata, a profile of the NEP partial derivative versus O3 input (FO3st or FO3cum depending on the case) was plotted (Figures 2, 3).
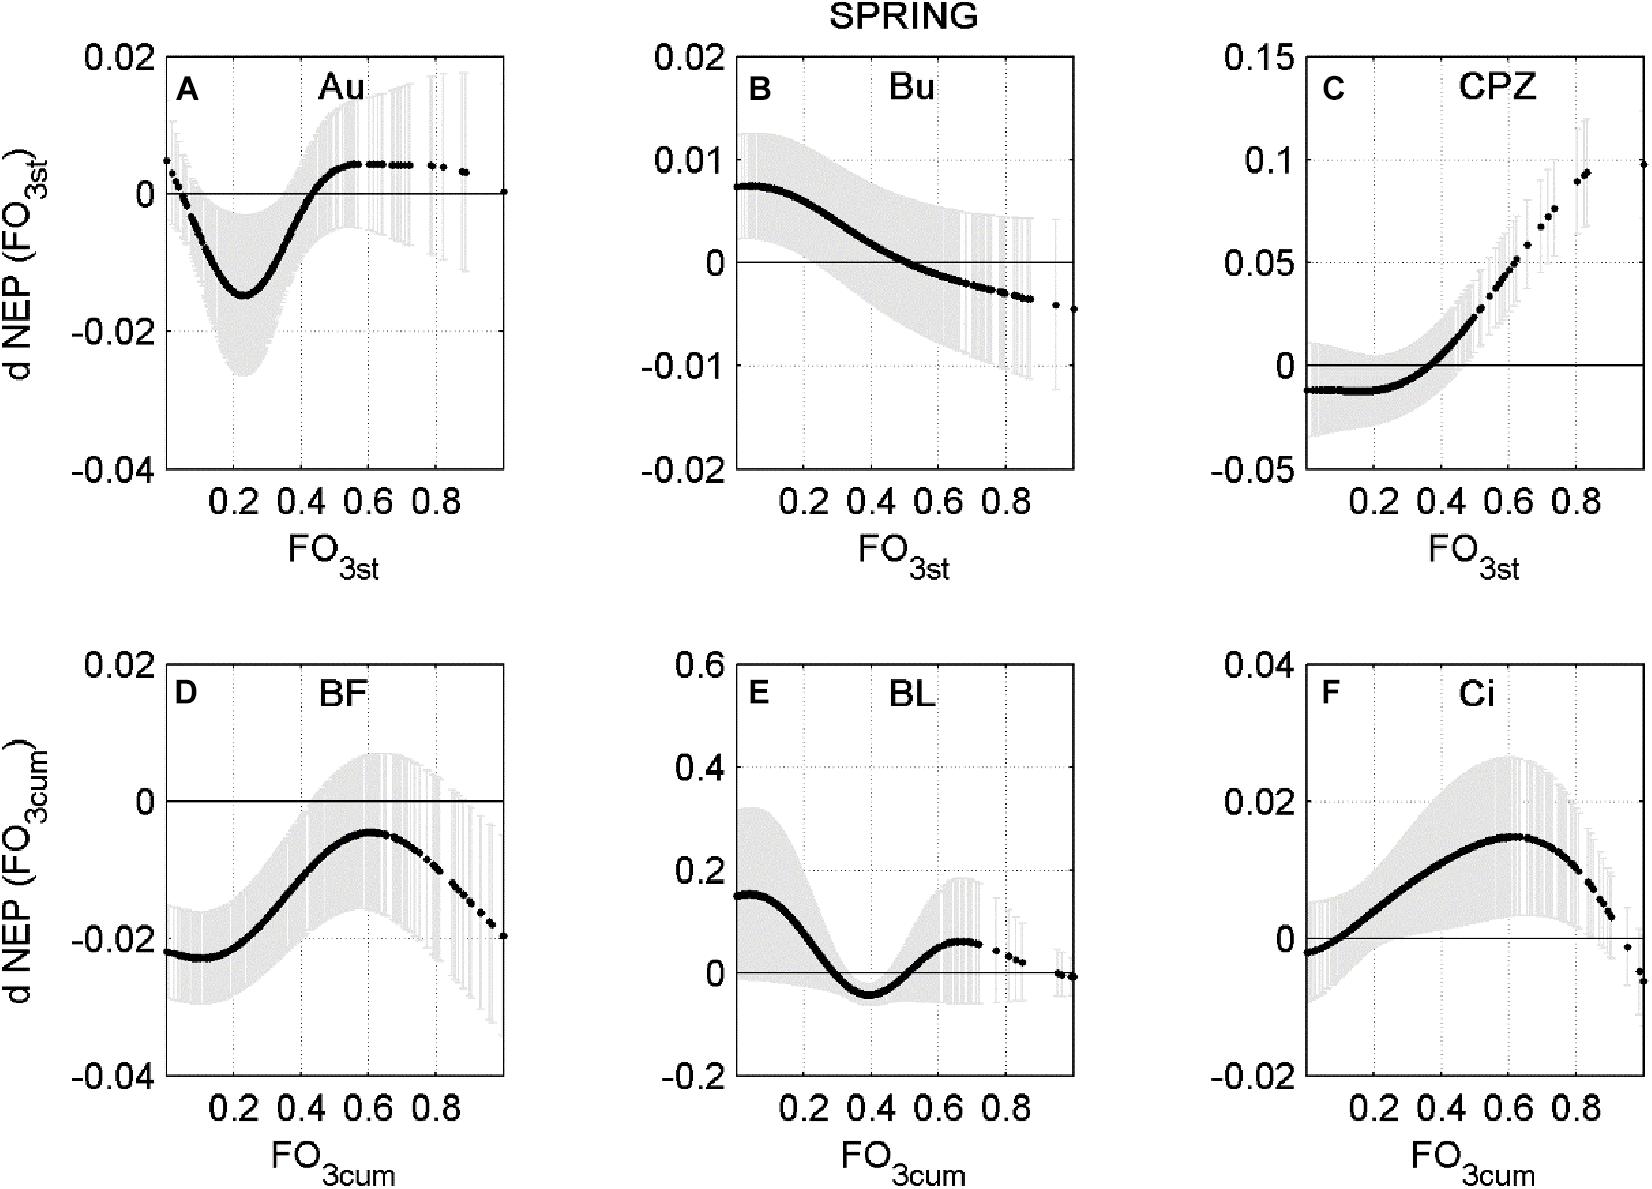
Figure 2. Averaged partial derivative of NEP (dNEP) with respect to the corresponding input variable (FO3st or FO3CUM) ± standard deviation, calculated using Spring data. (A) Auchencorth Moss (Au), (B) Bugac (Bu), (C) Castelporziano (CPZ), (D) Bosco Fontana (BF), (E) Blodgett (BL), (F) Lindcove (Ci).
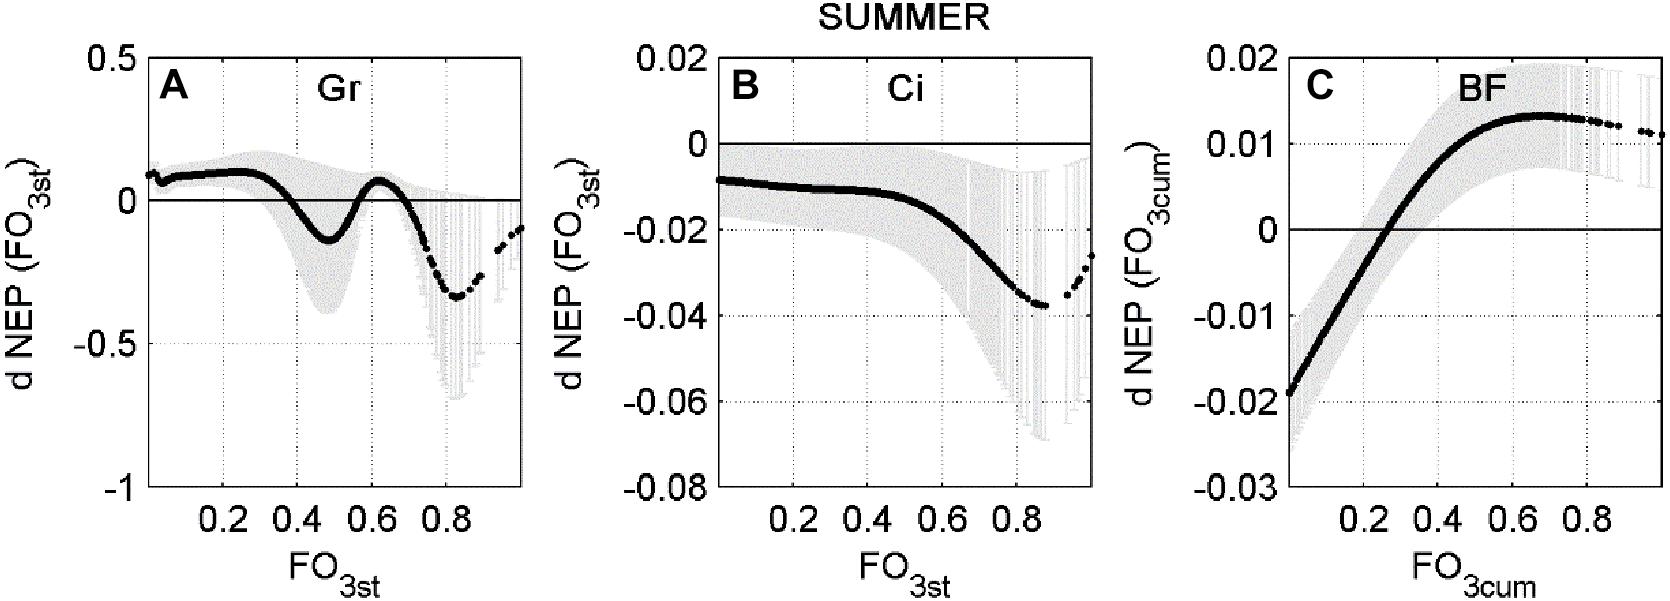
Figure 3. Average partial derivative of NEP (dNEP) with respect to the corresponding input variable (FO3st or FO3CUM) ± standard deviation, calculated using Summer data. (A) Grignon (Gr), (B) Lindcove (Ci), (C) Bosco Fontana (BF).
The relationships shown in Figures 2, 3 are highly non-linear and present different behaviors at each site: at Auchencorth Moss site (Figure 2A) a down-regulating effect was found in Spring for FO3sto below the 40th percentile (−0.27 nmol m2 s–1), peaking around 23rd percentile (−0.20 nmol m2 s–1). The same trend was observed at the Castelporziano site (Figure 2C) during Spring, where FO3sto below the 33rd percentile (−0.13 nmol m2 s–1) negatively affected NEP. At the Bugac site (Figure 2B), the FO3sto effect on NEP was almost linear, and the effect turned negative above the 52nd percentile (−0.19 nmol m2 s–1). At the Blodgett site, during Spring (Figure 2E), FO3cum negatively affected NEP in a range between 29th (68.33 μmol m–2) and 49th (91.23 μmol m–2 percentile, peaking at the 40th (80.67 μmol m–2) percentile.
At the Bosco Fontana site the ANN analysis predicted a consistently negative effect of FO3cum flux for the Spring data (Figure 2D), although the largest effect was recorded for the smallest doses (below 20th percentile, 43.68 μmol m–2). During Summer (Figure 3C), a depressing effect of FO3cum over NEP was observed only below the 26th percentile (70.72 μmol m–2). At the Lindcove site, during Spring (Figure 2F), only low doses of FO3cum had a negative effect on NEP (below 7th, 45.42 μmol m–2, and above 95th percentile, 151.02 μmol m–2), whilst during Summer (Figure 3A), all FO3st values induced a decrease in NEP, peaking at 88th percentile (0.19 nmol m–2 s–1). At the Grignon site, the FO3st effect on NEP during Summer seemed to fluctuate, peaking at 48th and 82st percentiles (nmol m–2 s–1 and nmol m–2 s–1, respectively).
The negative fraction of dNEP(O3) was transformed between 0 and 1 (where 1 is the maximum negative effect of O3 over NEP) and averaged as a function of time of day. This was done with the aim of identifying diurnal dynamics in the NEP decrease due to O3 (Figures 4, 5). During the Spring season, the average dNEP(O3) followed a pronounced bell-shape curve at the Lindcove site, where the maximum effect of O3 was observed during the middle hours of the day, coinciding with FO3cum peak (Figure 4F). The same pattern was found for Bugac (Figure 4B) sites, although the bell-shape was slightly accentuated. At Auchencorth (Figure 4A) and Castelporziano (Figure 4C) larger effects of FO3st were recorded at the end of the afternoon. The damaging effect of instantaneous O3 followed an exponential decrease during the day at Bosco Fontana site (Figure 4D), opposite to the shape of the response to FO3cum. The damaging effect of O3 peaked at 10:00 h, when FO3cum was still low. At Blodgett (Figure 4E) no significant variations were found during the day.
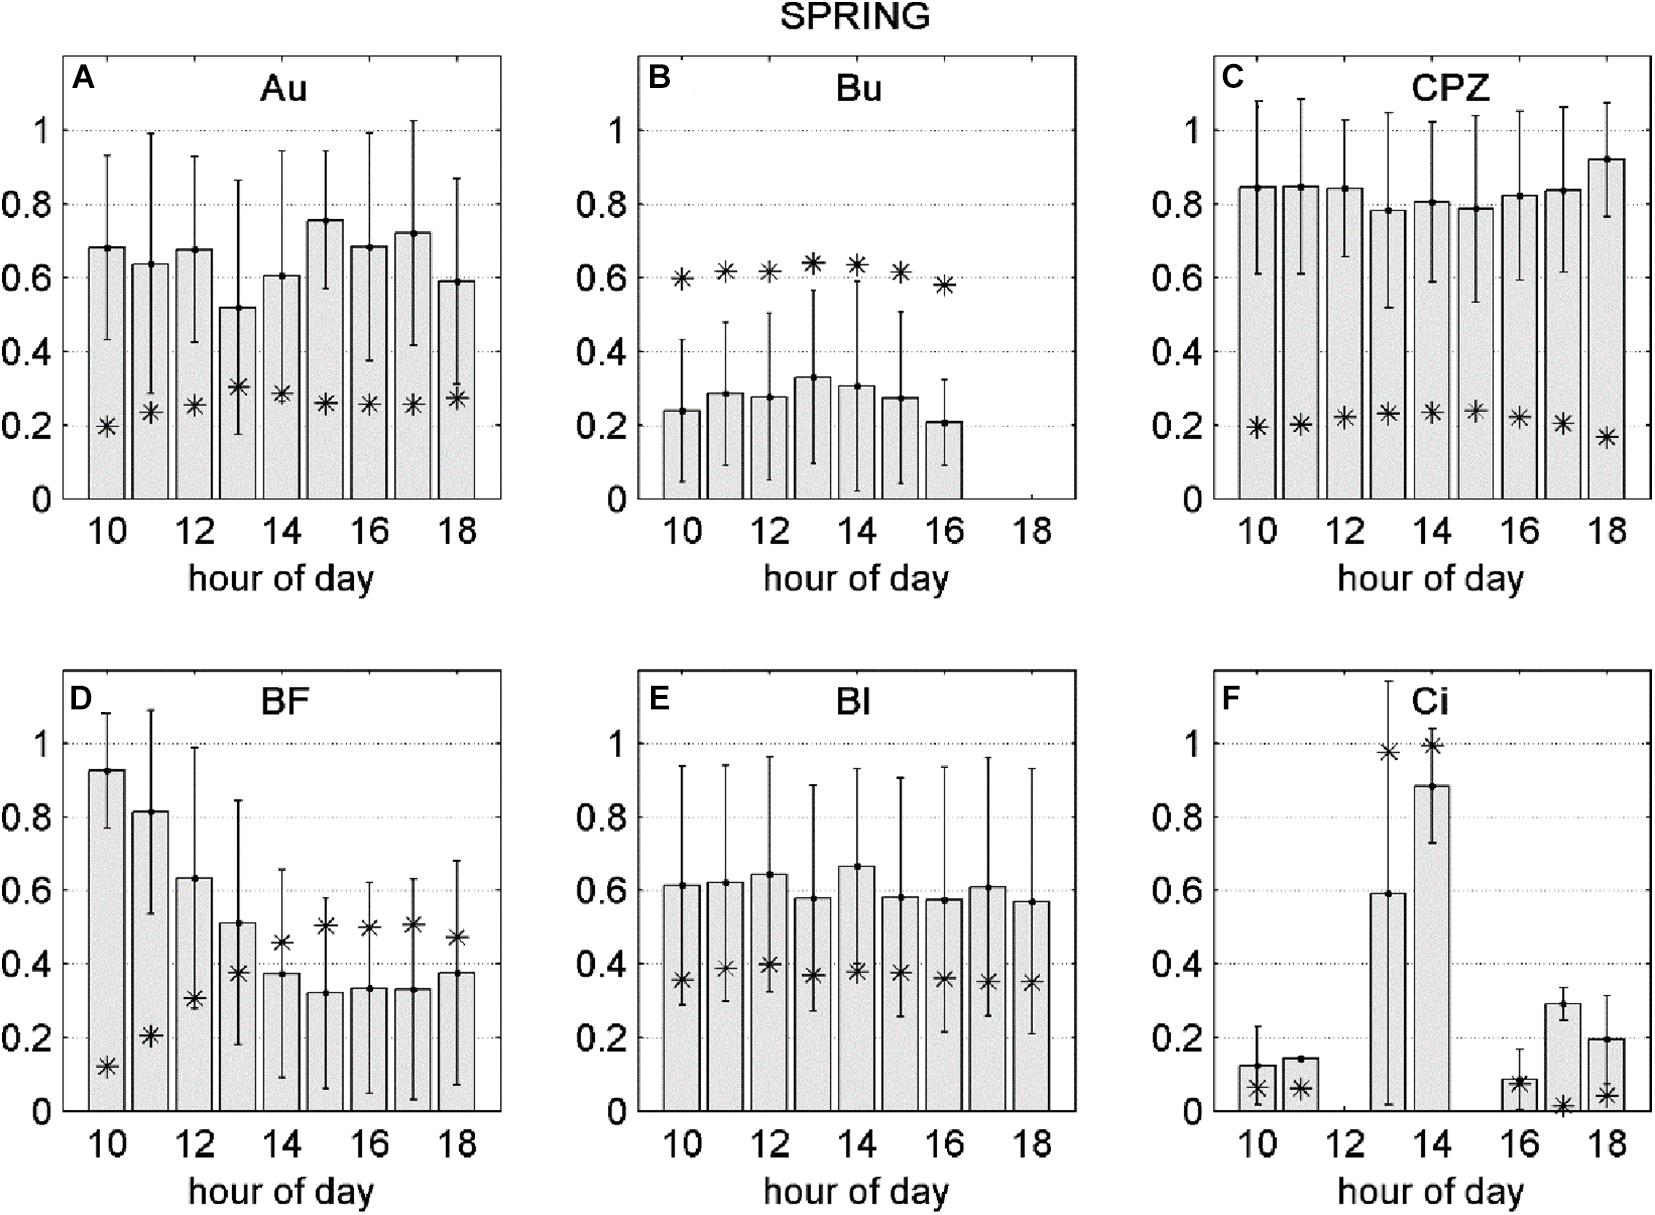
Figure 4. Gray bars: negative fraction of partial derivative of NEP with respect to FO3st (A–C) or FO3CUM (D–F) averaged over hours of day, ± standard deviations. Asterisks: FO3st (A–C) or FO3CUM (D–F) averaged over hours of day. All variables presented in this figure were transformed between 0 and 1.
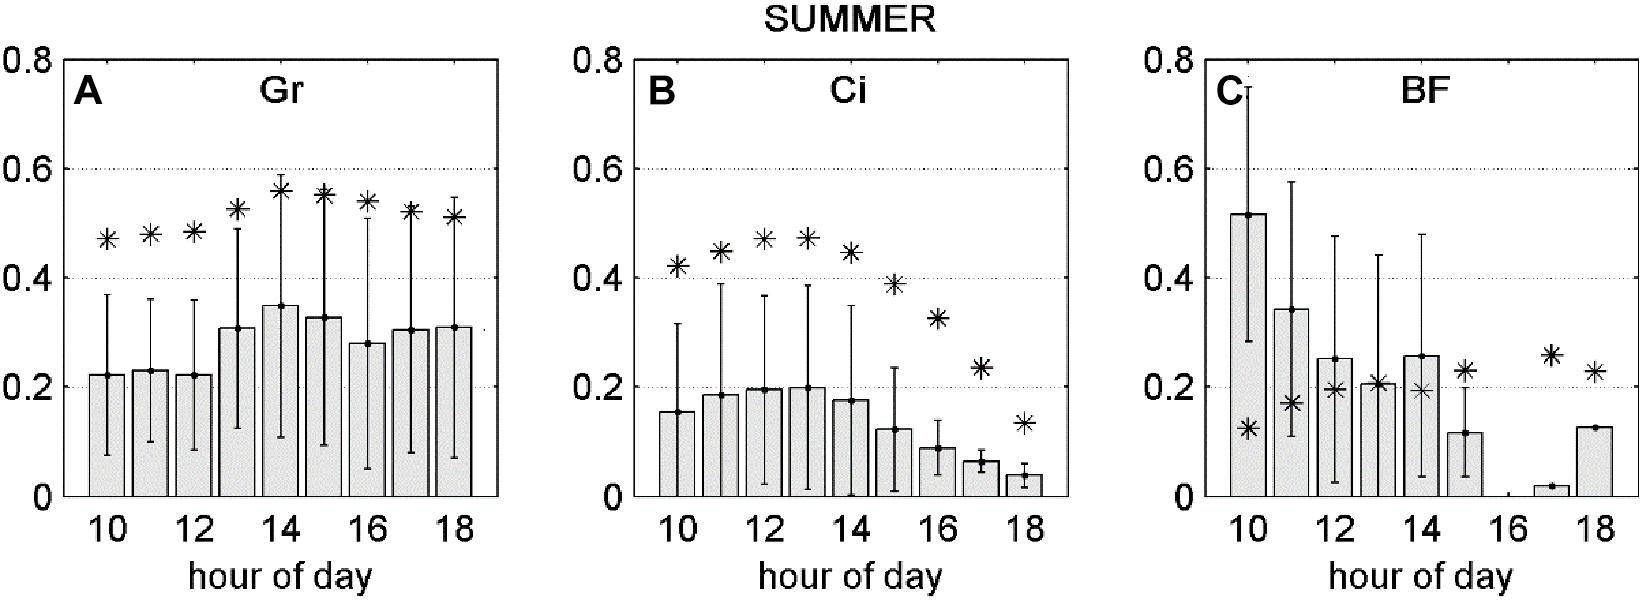
Figure 5. Gray bars: negative fraction of partial derivative of NEP with respect to FO3st (A,B) or FO3CUM (C) averaged over hours of day, ±standard deviations. Asterisks: FO3st (A,B) or FO3CUM (C) averaged over hours of day. All variables presented in this figure were transformed between 0 and 1.
For the Summer season, average dNEP(O3) showed a bell-shape curve which follows the FO3st trend at Grignon and Lindcove (Figures 5A,B, respectively), while at Bosco Fontana (Figure 5C) the dNEP (FO3cum) presents the same pattern as during the Spring season.
How O3 Reduces NEP According to Other Environmental Factors
For the sites where a negative effect of O3 over NEP was found (Au, Bu, Gr, BF, CPZ, Bl and Ci), the correlation between the negative fraction of dNEP(FO3st) or dNEP(FO3cum) and the other environmental variables was tested through Spearman partial correlation (Table 6).
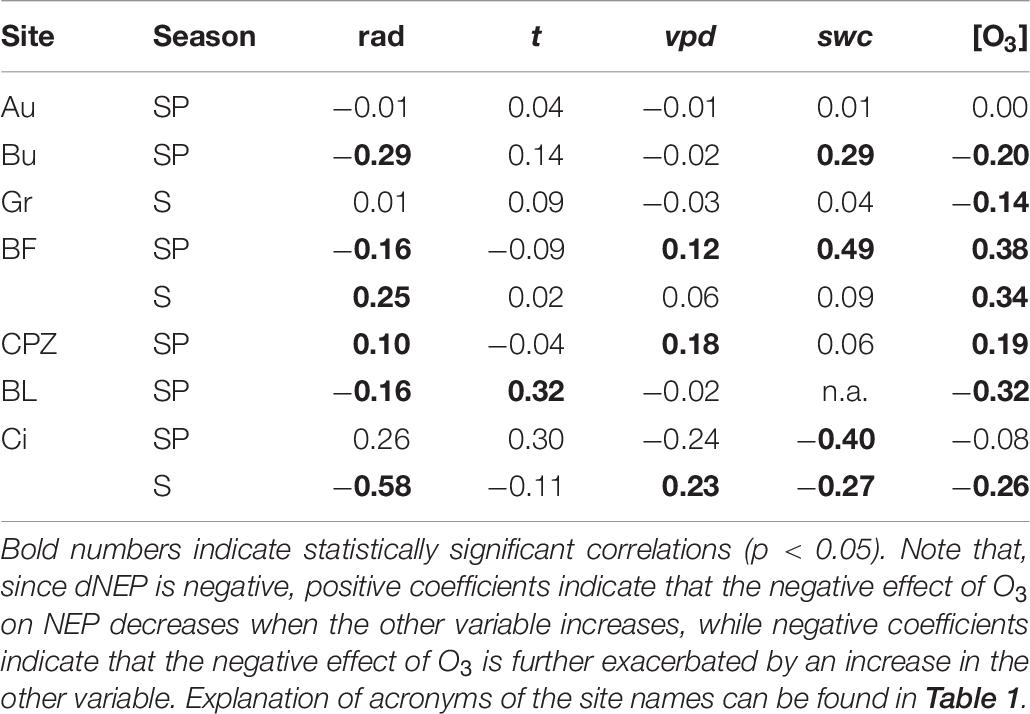
Table 6. Spearman partial correlation coefficients of the negative partial derivative of dNEP(O3) (FO3sto for Au, Bu, Gr, CPZ and Ci in Summer; FO3cum for BF, Bl and Ci in Spring) with respect to solar radiation (rad), air temperature (t), vapor pressure deficit (vpd), soil water content (swc) and O3 concentration at canopy level([O3]).
No correlation was found for Auchencorth Moss, where no values were statistically significant. Solar radiation enhanced O3 detrimental effect at Bugac, Bosco Fontana and Blodgett during Spring and at Lindcove during Summer, while it had the opposite effect at Castelporziano during Spring and at Bosco Fontana during Summer. The correlation between air temperature and dNEP(O3) was significant only at Blodgett, where air temperature decreased O3 damage during Spring. The increase of vpd depressed O3 damage at Bosco Fontana and Castelporziano during Spring, and at Lindcove during Summer. Increasing swc reduced O3 damage at Bugac and Bosco Fontana during Spring, and increased O3 damage at Lindcove during both Spring and Summer. The O3 concentration at canopy level increased O3 damage at Bugac, Grignon, Blodgett and Lindcove whilst it had an opposite effect on Castelporziano and Bosco Fontana vegetation.
Discussion
How O3 pollution alters vegetation carbon sequestration capacity is considered an important component of global change (Ashmore and Bell, 1991), but few studies have quantified its impact over ecosystems. Some of them confirm a detrimental effect of O3 over vegetation occurring in sites where ambient O3 concentrations are typically high (Zapletal et al., 2011; Fares et al., 2013), while others did not find any effect of high levels of tropospheric ozone concentrations (Zona et al., 2014; Verryckt et al., 2017). Results of these studies are difficult to interpret in the context of ozone/plant interactions because of the great variability among site characteristics, vegetation type and methodological approaches (Cailleret et al., 2018).
This work demonstrates that ANN modeling is a useful tool to understand O3 – NEP correlation considering other co-varying environmental factors. r2 values produced by ANN were found higher than r2 values produced by MLR, indicating that a non-linear statistical data modeling approach as ANN is more appropriate in modeling complex relationships such the dependence of NEP from co-varying environmental factors. Our results are in line with other ecological studies in literature which compared the two methods and found ANN models more accurate than MLR (e.g. Lek et al., 1996; Paruelo and Tomasel, 1997; Brion et al., 2005). The strength of ANN lies in its fully inductive approach, which allows multidimensional relationships to be investigated without a priori knowledge of the shape of these relations. Coupling ANN analysis with EC provided a picture of the current status of O3 pollution effects over ecosystems.
Although overfitting was controlled in this work, high r2 values calculated between simulations and measured data (Table 3) indicates that the possibility of overfitting from ANN exists.
We did not carry out an assessment of whether the model accuracy was significantly better for the training or test subsets than for the final validation subset in each case, and so cannot provide an indication of whether or not the model was actually overfitted to the training data. However, in this work, the power and flexibility of ANN in fitting the data is an advantage and not a limitation, indeed the aim was not to find a general model for NEP, but to evaluate the influence of a variable (O3) in each single study site.
Artificial neural network performance analysis found that both FO3st and FO3cum are suitable indicators for predicting NEP reduction, depending on season and type of vegetation. Since FO3cum is obtained from cumulated values of FO3st, an analysis of correlation between the two variables was performed with the aims of verifying the degree of dependence of the two variables. None or low correlation was found for most of the study sites. That may suggest that the O3 dose entering the stomata is discontinuous and that vegetation is subjected to O3 pulses rather than a constant flux. However, we did not find any relation between the degree of correlation between the two variables and the selection of ANN model best predictor, which means that the most suitable predictor was selected for each site and season regardless of how discontinuous the O3 fluxes were, and it probably depends on vegetation type and climate conditions.
Of the eleven sites tested, four ecosystems were free from O3 damage. These sites were the Finnish Scots pine forest (Hyytiälä), the Dutch Douglas fir plantation (Speulderbos), the Belgian poplar plantation (Lochristi) and the Italian mixed forest (Ispra). These results are in line with Zona et al. (2014), who did not find a negative relationship between O3 and net ecosystem exchange at Lochristi. All of these ecosystems are located in northern areas with the exception of Ispra, where O3 concentrations are not particularly high compared with typical high ozone-prone Mediterranean sites (Table 2) and this may support the hypothesis that low to moderate ozone concentrations and therefore lower stomatal ozone fluxes may generate cumulative exposure to ozone far below possible critical levels in northern ecosystems.
Seven ecosystems showed a significant but limited NEP loss due to O3 entering the stomata: the United Kingdom shrubland (Auchencorth Moss), the Hungarian grassland (Bugac), the Italian Holm oak forest (Castelporziano), the Californian pine plantation (Blodgett) during the Spring season, the French cropland (Grignon) during Summer, the Italian mixed forest (Bosco Fontana) and the Californian Citrus orchard (Lindcove) during both Spring and Summer seasons. Mean NEP loss was estimated at between 0.15 and 2.64%.
These values are low compared with other studies: for example Fares et al. (2013) adopted more traditional statistical methods based on step-wise regression analysis and multivariate analysis and found up to 12–19% of the carbon assimilation reduction in Blodgett and Lindcove sites explained by O3 entering the stomata. Such results suggest that either our approach is extremely conservative and does not appropriately attribute O3 effect, or statistical methods adopted in earlier studies may have overestimated O3 effects by including the effects of covariates in the predictive model of NEP. It should be noted, however, that both approaches focus on the quantification of the instantaneous or near-instantaneous effect of O3 on NEP, and capture neither the effect of this NEP reduction on biomass reduction which may further reduce NEP in the future nor the long-term effects of leaf injury.
Among the northern sites affected by O3, Auchencorth Moss showed higher sensitivity to O3 damage. This was despite non-stomatal deposition being the principal sink of O3 at this site, representing 70% of the overall O3 flux (Fowler et al., 2001), and where moorland mosses like Sphagnum are relatively tolerant to elevated O3 concentrations (Rinnan et al., 2003). The reason of the depression of NEP linked to O3 entering the stomata can be attributed to the increase of the plant respiration rate, as already observed by Niemi et al. (2002) for moorland vegetation, as a result of the plants repairing O3 damaged tissues (Williamson et al., 2015).
Partial derivative results indicate that the O3 effects on NEP are highly non-linear and site-specific. In almost all study sites, positive relationships between stomatal O3 flux and NEP were found. Both are controlled by stomatal conductance and thus, in the absence of O3 damage, stomatal O3 fluxes positively correlated with NEP, as already observed by Proietti et al. (2016). This also implies that a limited effect of ozone on stomatal closure may still take place, as this matches with a moderate reduction in NEP.
Episodes in which O3 detrimental effect occurred were identified from the models using partial derivative analysis. These episodes were correlated to climatic variables showing that O3 damage dependence on weather varies with the climate. O3 damage occurred primarily during Spring, especially for those sites where stomatal conductance decreases in Summer as affected by water availability (see Table 2). Partial correlation analysis showed that swc decreases the O3 negative effect for those sites where no drought stress occurred (Blodgett and Bosco Fontana).
In Mediterranean regions, drought periods (which coincide with high O3 levels) limit stomatal conductance, protecting vegetation from O3 oxidative stress (Paoletti, 2006). At Lindcove, a well irrigated Mediterranean citrus plantation as previously reported by Fares et al. (2012), O3 detrimental effects were observed both during Spring and Summer and positively correlate with swc. In these warm periods, with O3 concentrations often exceeding 80 ppb, the mean stomatal O3 fluxes were 3.29 and 3.19 nmol m–2s–1 during the central hours of the day during Spring and Summer, respectively. swc was not a significant predictor of O3 damage at Castelporziano, a Mediterranean Holm oak forest, where the high water table (Bucci, 2006) protected trees from water stress, although during Spring high stomatal fluxes were associated with high levels of precipitations (Savi and Fares, 2014).
The inclusion of O3 concentration at canopy level in the partial correlation analysis showed that NEP damage does not always occur at peak O3 concentrations, as the case of the Italian sites of Bosco Fontana and Castelporziano. It must be noted that being photochemically produced, O3 concentrations tend to peak when solar radiation is high and that BVOC emitted by some tree species can contribute to ozone formation (Monks et al., 2015). When radiation increases, vpd also increases, causing stomatal closure and leading to a protective effect against O3 entering the leaves (Mereu et al., 2009; Fares et al., 2010b, 2014). For the same sites, partial correlation analysis highlights that when solar radiation and vpd increase, O3 impact on NEP decreases. We do not exclude that to some minor extend high reactive terpenoid emissions at Castelporziano and Bosco Fontana in the central hours of the day [documented by Fares et al. (2013) and Acton et al. (2016)] may be responsible for ozone scavenging in the gas phase, thus reducing the amount of ozone entering stomata. This phenomenon of mid-day exclusion of O3 damage does not happen in the Mediterranean Ponderosa pine plantation at Blodgett, this species being relatively insensitive to vpd when drought is not a limiting factor (Panek and Goldstein, 2001). At this site, air temperature was found to be a limiting factor for O3 damage during Spring, when high temperature constrained gas exchange (Panek and Goldstein, 2001) and helped reduce O3 oxidative stress.
At Auchencorth Moss, the relation of O3 damage to weather remains unclear, although a significant negative effect of O3 on NEP was found. O3 damage estimates were averaged over the course of the day, with the aim of highlighting hourly patterns. For some sites (Lindcove, Bugac and Grignon), the detrimental effect of O3 followed a bell-shaped curve, thus suggesting that most of damage to photosynthetic apparatus occurred rapidly during hours of maximum O3 absorption. Interestingly, for Auchencorth Moss and Castelporziano, major damage was observed at the end of the afternoon, indicating that: (1) high vpd reduces stomatal conductance, and therefore O3 damage, during the central hours of the day; and (2) to some extent plants may be able to detoxify O3 during hours of maximum exposure to the pollutant, while at the end of the day detoxification capacity of leaves decreases. While there is evidence of a mid-day depression of stomatal conductance in those sites (Fares et al., 2010a, 2014), the second hypothesis is highly speculative and deserves further investigation. However, the possibility of changes in reducing power during the day has been previously described by Dizengremel et al. (2008) who showed decreasing foliar level of antioxidants during the afternoon hours in response to oxidative stress. Conversely, O3 damaging effect and O3 absorption were completely decoupled at Bosco Fontana, where the O3 damaging effect peaks in the morning, under low O3 concentrations, suggesting the occurrence of species-specific acclimatization phenomena along the day which we cannot explain in this study.
Conclusion
This work clearly suggests that long-term datasets are required to identify O3 damage to vegetation under field conditions. We found that O3 has a detrimental effect on NEP, although damage can be sporadic and is driven by specific weather conditions and in general, has lower magnitude compared with observations carried out through manipulative experiments or in the field using traditional statistical methods. Our results suggest that vegetation response to O3 depends not only on pollution level but also on how the ecosystems respond to climate variables. Future climate changes may therefore either expose ecosystems to further O3 damage by increasing temperatures or rather lead to a reduction in ozone damage in drought-prone ecosystems.
Data Availability Statement
The datasets generated for this study are available on request to the corresponding author.
Author Contributions
All authors contributed providing experimental data and/or supporting the preparation of the manuscript.
Funding
We want to thank the ÉCLAIRE project (Effects of Climate Change on Air Pollution and Response Strategies for European Ecosystems) funded by the EU’s Seventh Framework Program for Research and Technological Development (FP7), which supported the flux measurements at the sites Au, Bu, Gr, Hy, Sp, Lo, BF, and Is. The CREA team wants to acknowledge the LIFE financial instruments of the European Union (LIFE15 ENV/IT/000183 – LIFE18 PRE IT 003) in the framework of the projects MOTTLES (“Monitoring ozone injury for setting new critical levels”) and VEG-GAP (“Vegetation for Urban Green Air Quality Plans”) LIFE18 PRE IT 003 and the General Secretariat of the Presidency of Italian Republic for financing the CASTEL4 project and the Directorate of Castelporziano Estate. The CEH measurement sites were supported by National Capability funding from the United Kingdom Natural Environment Research Council. The ECOSYS team acknowledge INGOS (grant agreement 284274), the French ANR project ANAEE, and ICOS France.
Conflict of Interest
The authors declare that the research was conducted in the absence of any commercial or financial relationships that could be construed as a potential conflict of interest.
Acknowledgments
We acknowledge the director of the AgroParsiTech Farm Dominique Tristan for allowing access to the field. We also thanks to K. Pintér and Z. Nagy, Szent István University, Gödöllõ, Hungary for contribution in EC measurements.
Supplementary Material
The Supplementary Material for this article can be found online at: https://www.frontiersin.org/articles/10.3389/ffgc.2020.00042/full#supplementary-material
References
Acton, W. J. F., Schallhart, S., Langford, B., Valach, A., Rantala, P., Fares, S., et al. (2016). Canopy-scale flux measurements and bottom-up emission estimates of volatile organic compounds from a mixed oak and hornbeam forest in northern Italy. Atmos. Chem. Phys. 16, 7149–7170. doi: 10.5194/acp-16-7149-2016
Ainsworth, E. A., Yendrek, C. R., Sitch, S., Collins, W. J., and Emberson, L. D. (2012). The effects of tropospheric ozone on net primary productivity and implications for climate change. Annu. Rev. Plant Biol. 63, 637–661. doi: 10.1146/annurev-arplant-042110-103829
Aitkenhead, M. J., and Coull, M. C. (2016). Mapping soil carbon stocks across Scotland using a neural network model. Geoderma 262, 187–198. doi: 10.1016/j.geoderma.2015.08.034
Biswas, D. K., Xu, H., Li, Y. G., Sun, J. Z., Wang, X. Z., Han, X. G., et al. (2007). Genotypic differences in leaf biochemical, physiological and growth responses to ozone in 20 winter wheat cultivars released over the past 60 years. Glob. Chang. Biol. 14, 46–59. doi: 10.1111/j.1365-2486.2007.01477.x
Brion, G., Viswanathan, C., Neelakantan, T. R., Lingireddy, S., Girones, R., Lees, D., et al. (2005). Artificial neural network prediction of viruses in shellfish. Appl. Environ. Microbiol. 71, 5244–5253. doi: 10.1128/AEM.71.9.5244-5253.2005
Broschè, M., Merilo, E., Mayer, F., Pechter, P., Puzõrjova, I., Brader, G., et al. (2010). Natural variation in ozone sensitivity among Arabidopsis thaliana accessions and its relation to stomatal conductance. Plant. Cell Environ. 33, 914–925. doi: 10.1111/j.1365-3040.2010.02116.x
Bucci, M. (2006). The state of Water Resources, in: Ricerche Sulla Complessità Di Un Ecosistema Forestale Costiero Mediterraneo. Rome: Accademia Nazionale delle Scienze detta dei XL.
Cailleret, M., Ferretti, M., Gessler, A., Rigling, A., and Schaub, M. (2018). Ozone effects on European forest growth-Towards an integrative approach. J. Ecol. 106, 1377–1389. doi: 10.1111/1365-2745.12941
Chan, Z. S. H., Ngan, H. W., Rad, A. B., David, A. K., and Kasabov, N. (2006). Short-term ANN load forecasting from limited data using generalization learning strategies. Neurocomputing 70, 409–419. doi: 10.1016/J.NEUCOM.2005.12.131
Cieslik, S. A. (2004). Ozone uptake by various surface types: a comparison between dose and exposure. Atmos. Environ. 38, 2409–2420. doi: 10.1016/j.atmosenv.2003.10.063
Civelekoglu, G., Yigit, N. O., Diamadopoulos, E., and Kitis, M. (2008). Prediction of bromate formation using multi-linear regression and artificial neural networks. J. Int. Oz. Assoc. 29, 353–362. doi: 10.1080/01919510701549327
Copeland, N., Cape, J. N., Nemitz, E., and Heal, M. R. (2014). Volatile organic compound speciation above and within a Douglas fir forest. Atmos. Environ. 94, 86–95. doi: 10.1016/J.ATMOSENV.2014.04.035
Dimopoulos, I., Chronopoulos, J., Chronopoulou-Sereli, A., and Lek, S. (1999). Neural network models to study relationships between lead concentration in grasses and permanent urban descriptors in Athens city (Greece). Ecol. Modell. 120, 157–165. doi: 10.1016/S0304-3800(99)00099-X
Dimopoulos, Y., Bourret, P., and Lek, S. (1995). Use of some sensitivity criteria for choosing networks with good generalization ability. Neural Process. Lett. 2, 1–4. doi: 10.1007/BF02309007
Dizengremel, P., Le Thiec, D., Bagard, M., and Jolivet, Y. (2008). Ozone risk assessment for plants: central role of metabolism-dependent changes in reducing power. Environ. Pollut. 156, 11–15. doi: 10.1016/J.ENVPOL.2007.12.024
Erisman, J. W., Draaijers, G., Duyzer, J., Hofschreuder, P., Leeuwen, N., Van Römer, F., et al. (1997). The aerosol project: introduction and some background information. Atmos. Environ. 31, 315–319. doi: 10.1016/S1352-2310(96)00186-0
Falge, E., Baldocchi, D., Olson, R., Anthoni, P., Aubinet, M., Bernhofer, C., et al. (2001). Gap filling strategies for defensible annual sums of net ecosystem exchange. Agric. For. Meteorol. 107, 43–69. doi: 10.1016/S0168-1923(00)00225-2
Fares, S., Conte, A., and Chabbi, A. (2018). Ozone flux in plant ecosystems: new opportunities for long-term monitoring networks to deliver ozone-risk assessments. Environ. Sci. Pollut. Re. 25, 8240–8248. doi: 10.1007/s11356-017-0352-0
Fares, S., Goldstein, A., and Loreto, F. (2010a). Determinants of ozone fluxes and metrics for ozone risk assessment in plants. J. Exp. Bot. 61, 629–633. doi: 10.1093/jxb/erp336
Fares, S., McKay, M., Holzinger, R., and Goldstein, A. H. (2010b). Ozone fluxes in a Pinus ponderosa ecosystem are dominated by non-stomatal processes: evidence from long-term continuous measurements. Agric. For. Meteorol. 150, 420–431. doi: 10.1016/j.agrformet.2010.01.007
Fares, S., Savi, F., Muller, J., Matteucci, G., and Paoletti, E. (2014). Simultaneous measurements of above and below canopy ozone fluxes help partitioning ozone deposition between its various sinks in a Mediterranean Oak Forest. Agric. For. Meteorol 198–199, 181–191. doi: 10.1016/j.agrformet.2014.08.014
Fares, S., Vargas, R., Detto, M., Goldstein, A. H., Karlik, J., Paoletti, E., et al. (2013). Tropospheric ozone reduces carbon assimilation in trees: estimates from analysis of continuous flux measurements. Glob. Chang. Biol. 19, 2427–2443. doi: 10.1111/gcb.12222
Fares, S., Weber, R., Park, J.-H., Gentner, D., Karlik, J., and Goldstein, A. H. (2012). Ozone deposition to an orange orchard: partitioning between stomatal and non-stomatal sinks. Environ. Pollut. 169, 258–266. doi: 10.1016/j.envpol.2012.01.030
Flechard, C. R., and Fowler, D. (1998). Atmospheric ammonia at a moorland site. I: the meteorological control of ambient ammonia concentrations and the influence of local sources. Q. J. R. Meteorol. Soc. 124, 733–757. doi: 10.1002/qj.49712454705
Fowler, D., Flechard, C., Cape, J. N., Storeton-West, R. L., and Coyle, M. (2001). Measurements of ozone deposition to vegetation quantifying the flux, the stomatal and non-stomatal components. Water. Air. Soil Pollut. 130, 63–74. doi: 10.1023/A:1012243317471
Fowler, D., Pilegaard, K., Sutton, M. A., Ambus, P., Raivonen, M., Duyzer, J., et al. (2009). Atmospheric composition change: ecosystems-atmosphere interactions. Atmos. Environ. 43, 5193–5267. doi: 10.1016/j.atmosenv.2009.07.068
Gerosa, G., Fusaro, L., Monga, R., Finco, A., Fares, S., Manes, F., et al. (2015). A flux-based assessment of above and below ground biomass of Holm oak (Quercus ilex L.) seedlings after one season of exposure to high ozone concentrations. Atmos. Environ. 113, 41–49. doi: 10.1016/J.ATMOSENV.2015.04.066
Gevrey, M., Dimopoulos, I., and Lek, S. (2003). Review and comparison of methods to study the contribution of variables in artificial neural network models. Ecol. Modell. 160, 249–264. doi: 10.1016/S0304-3800(02)00257-0
Helfter, C., Campbell, C., Dinsmore, K. J., Drewer, J., Coyle, M., Anderson, M., et al. (2015). Drivers of long-term variability in CO2 net ecosystem exchange in a temperate peatland. Biogeosciences 12, 1799–1811. doi: 10.5194/bg-12-1799-2015
Hicks, B. B., Baldocchi, D. D., Meyers, T. P., Hosker, R. P., and Matt, D. R. (1987). A preliminary multiple resistance routine for deriving dry deposition velocities from measured quantities. Water. Air. Soil Pollut. 36, 311–330. doi: 10.1007/BF00229675
Jensen, N. R., Gruening, C., Goded, I., Müller, M., Hjorth, J., and Wisthaler, A. (2018). Eddy-covariance flux measurements in an Italian deciduous forest using PTR-ToF-MS, PTR-QMS and FIS. Int. J. Environ. Anal. Chem. 98, 758–788. doi: 10.1080/03067319.2018.1502758
Karlsson, P. E., Pleijel, H., Pihl Karlsson, G., Medin, E. L., and Skärby, L. (2000). Simulations of stomatal conductance and ozone uptake to Norway spruce saplings in open-top chambers. Environ. Pollut. 109, 443–451. doi: 10.1016/S0269-7491(00)00047-6
Lek, S., Delacoste, M., Baran, P., Dimopoulus, I., Lauga, J., and Aulagnier, S. (1996). Application of neural networks to modellingnon-linear relationship in ecology. Ecol. Modell. 90, 39–52.
Loubet, B., Laville, P., Lehuger, S., Larmanou, E., Fléchard, C., Mascher, N., et al. (2011). Carbon, nitrogen and Greenhouse gases budgets over a four years crop rotation in northern France. Plant Soil 343:109–137. doi: 10.1007/s11104-011-0751-9
Manning, W. J. (2005). Establishing a cause and effect relationship for ambient ozone exposure and tree growth in the forest: progress and an experimental approach. Environ. Pollut. 137, 443–454. doi: 10.1016/j.envpol.2005.01.031
Marrero, T. R., and Mason, E. A. (1972). Gaseous diffusion coefficients. J. Phys. Chem. Ref. Data 1, 3–118. doi: 10.1063/1.3253094
Mereu, S., Salvatori, E., Fusaro, L., Gerosa, G., Muys, B., and Manes, F. (2009). An integrated approach shows different use of water resources from Mediterranean maquis species in a coastal dune ecosystem. Biogeosciences 6, 2599–2610. doi: 10.5194/bg-6-2599-2009
Moffat, A. M., Beckstein, C., Churkina, G., Mund, M., and Heimann, M. (2010). Characterization of ecosystem responses to climatic controls using artificial neural networks. Glob. Chang. Biol. 16, 2737–2749. doi: 10.1111/j.1365-2486.2010.02171.x
Monks, P. S., Archibald, A. T., Colette, A., Cooper, O., Coyle, M., Derwent, R., et al. (2015). Tropospheric ozone and its precursors from the urban to the global scale from air quality to short-lived climate forcer. Atmos. Chem. Phys. 15, 8889–8973. doi: 10.5194/acp-15-8889-2015
Monteith, J. L. (1981). Evaporation and surface temperature. Q. J. R. Meteorol. Soc. 107, 1–27. doi: 10.1002/qj.49710745102
Niemi, R., Martikainen, P. J., Silvola, J., and Holopainen, T. (2002). Ozone effects on Sphagnum mosses, carbon dioxide exchange and methane emission in boreal peatland microcosms. Sci. Total Environ. 289, 1–12. doi: 10.1016/S0048-9697(01)01012-9
Olden, J. D., and Jackson, D. A. (2002). Illuminating the “black box”: a randomization approach for understanding variable contributions in artificial neural networks. Ecol. Modell. 154, 135–150. doi: 10.1016/S0304-3800(02)00064-9
Olden, J. D., Joy, M. K., and Death, R. G. (2004). An accurate comparison of methods for quantifying variable importance in artificial neural networks using simulated data. Ecol. Modell. 178, 389–397. doi: 10.1016/j.ecolmodel.2004.03.013
Panek, J. A., and Goldstein, A. H. (2001). Response of stomatal conductance to drought in ponderosa pine: implications for carbon and ozone uptake. Tree Physiol. 21, 337–344. doi: 10.1093/treephys/21.5.337
Paoletti, E. (2006). Impact of ozone on mediterranean forests: a review. Environ. Pollut. 144, 463–474. doi: 10.1016/j.envpol.2005.12.051
Parrish, D. D., Law, K. S., Staehelin, J., Derwent, R., Cooper, O. R., Tanimoto, H., et al. (2012). Long-term changes in lower tropospheric baseline ozone concentrations at northern mid-latitudes. Atmos. Chem. Phys. 12, 11485–11504. doi: 10.5194/acp-12-11485-2012
Paruelo, J. M., and Tomasel, F. (1997). Prediction of functional charac-teristics of ecosystems: a comparison of artificial neural net-works and regression models. Ecol. Modell. 98, 173–186. doi: 10.1016/s0304-3800(96)01913-8
Proietti, C., Anav, A., Marco, A., De, Sicard, P., and Vitale, M. (2016). A multi-sites analysis on the ozone effects on gross primary production of European forests. Sci. Total Environ. 556, 1–11. doi: 10.1016/j.scitotenv.2016.02.187
Rannik, U., Mammarella, I., Keronen, P., and Vesala, T. (2009). Vertical advection and nocturnal deposition of ozone over a boreal pine fores. Atmos. Chem. Phys. 9, 2089–2095. doi: 10.5194/acp-9-2089-2009
Reich, P., and Amundson, R. (1985). Ambient levels of ozone reduce net photosynthesis in tree and crop species. Science 230, 566–570. doi: 10.1126/science.230.4725.566
Rinnan, R., Impio, M., Silvola, J., Holopainen, T., and Martikainen, P. J. (2003). Carbon dioxide and methane fluxes in boreal peatland microcosms with different vegetation cover?effects of ozone or ultraviolet-B exposure. Oecologia 137, 475–483. doi: 10.1007/s00442-003-1366-5
Rumelhart, D. (1986). “Learning by error backpropagation,” in Parallel Distributed Processing, eds D. E. Rumelhart and J. L. McClelland (Chicago, IL: Encyclopædia Britannica, Inc.).
Savi, F., and Fares, S. (2014). Ozone dynamics in a Mediterranean Holm oak forest : comparison among transition periods characterized by different amounts of precipitation. Ann. Silvicultural Res. 38, 1–6. doi: 10.12899/asr-801
Savi, F., Di Bene, C., Canfora, L., Mondini, C., and Fares, S. (2016). Environmental and biological controls on CH4 exchange over an evergreen mediterranean forest. Agric. For. Meteorol. 226–227, 67–79. doi: 10.1016/j.agrformet.2016.05.014
Shindell, D. T., Faluvegi, G., Koch, D. M., Schmidt, G. A., Unger, N., and Bauer, S. E. (2009). Improved attribution of climate forcing to emissions. Science 326, 716–718. doi: 10.1126/science.1174760
Sitch, S., Cox, P. M., Collins, W. J., and Huntingford, C. (2007). Indirect radiative forcing of climate change through ozone effects on the land-carbon sink. Nature 448, 791–794. doi: 10.1038/nature06059
Stevenson, D. S., Dentener, F. J., Schultz, M. G., Ellingsen, K., van Noije, T. P. C., Wild, O., et al. (2006). Multimodel ensemble simulations of present-day and near-future tropospheric ozone. J. Geophys. Res. 111:D08301. doi: 10.1029/2005JD006338
The Royal Society (2008). Ground-Level Ozone in the 21st Century: Future Trends, Impacts and Policy Implications. London: The Royal Society, 132.
Verryckt, L. T., Op, De Beeck, M., Neirynck, J., Gielen, B., Roland, M., et al. (2017). No impact of tropospheric ozone on the gross primary productivity of a Belgian pine forest. Biogeosciences 14, 1839–1855. doi: 10.5194/bg-14-1839-2017
Villányi, V., Ürmös, Z., Balogh, J., Horváth, L., Csintalan, Z., and Tuba, Z. (2008). Ozone biomonitoring at mountainous and lowland areas in Hungary. Acta Biol. Szeged 52, 209–212.
Williamson, J. L., Mills, G., Hayes, F., Jones, T., and Freeman, C. (2015). How do increasing background concentrations of tropospheric ozone affect peatland 1 plant growth and carbon gas exchange? Atmos. Environ. 127, 133–138. doi: 10.1016/j.atmosenv.2015.12.004
Wohlgemuth, H., Mittelstrass, K., Kschieschan, S., Bender, J., Weigel, H.-J., Overmyer, K., et al. (2002). Activation of an oxidative burst is a general feature of sensitive plants exposed to the air pollutant ozone. Plant, Cell Environ. 25, 717–726. doi: 10.1046/j.1365-3040.2002.00859.x
Zapletal, M., Cudlin, P., Chroust, P., Urban, O., Pokorny, R., Edwards-Jonsova, M., et al. (2011). Ozone flux over a Norway spruce forest and correlation with net ecosystem production. Environ. Pollut. 159, 1024–1034. doi: 10.1016/j.envpol.2010.11.037
Zenone, T., Zona, D., Gelfand, I., Gielen, B., Camino-Serrano, M., and Ceulemans, R. (2016). CO2 uptake is offset by CH4 and N2O emissions in a poplar short-rotation coppice. GCB Bioenergy 8, 524–538. doi: 10.1111/gcbb.12269
Keywords: net ecosystem exchange, european forest, stomatal deposition, tropospheric ozone, artificial neural networks, climate change
Citation: Savi F, Nemitz E, Coyle M, Aitkenhead M, Frumau K, Gerosa G, Finco A, Gruening C, Goded I, Loubet B, Stella P, Ruuskanen T, Weidinger T, Horvath L, Zenone T and Fares S (2020) Neural Network Analysis to Evaluate Ozone Damage to Vegetation Under Different Climatic Conditions. Front. For. Glob. Change 3:42. doi: 10.3389/ffgc.2020.00042
Received: 15 January 2020; Accepted: 20 March 2020;
Published: 09 April 2020.
Edited by:
Alex B. Guenther, University of California, Irvine, United StatesReviewed by:
Lina Fusaro, Sapienza University of Rome, ItalySteffen M. Noe, Estonian University of Life Sciences, Estonia
Copyright © 2020 Savi, Nemitz, Coyle, Aitkenhead, Frumau, Gerosa, Finco, Gruening, Goded, Loubet, Stella, Ruuskanen, Weidinger, Horvath, Zenone and Fares. This is an open-access article distributed under the terms of the Creative Commons Attribution License (CC BY). The use, distribution or reproduction in other forums is permitted, provided the original author(s) and the copyright owner(s) are credited and that the original publication in this journal is cited, in accordance with accepted academic practice. No use, distribution or reproduction is permitted which does not comply with these terms.
*Correspondence: Flavia Savi, Zmxhdi5zYXZpQGdtYWlsLmNvbQ==; ZmxhdmlhLnNhdmlAY3JlYS5nb3YuaXQ=; Eiko Nemitz, ZW5AY2VoLmFjLnVr; Silvano Fares, c2lsdmFuby5mYXJlc0BjbnIuaXQ=