 Stefan J. Forstner1*
 Viktoria Wechselberger1Stefan Stecher1Stefanie Müller1
 Katharina M. Keiblinger1
 Wolfgang Wanek2
 Patrick Schleppi3
 Per Gundersen4Michael Tatzber1,5Martin H. Gerzabek1
 Sophie Zechmeister-Boltenstern1
- 1Institute of Soil Research, Department of Forest and Soil Sciences, University of Natural Resources and Life Sciences Vienna (BOKU), Vienna, Austria
- 2Division of Terrestrial Ecosystem Research, Department of Microbiology and Ecosystem Science, Center for Microbiology and Environmental Systems Science, University of Vienna, Vienna, Austria
- 3Department of Forest Soils and Biogeochemistry, Swiss Federal Institute for Forest, Snow and Landscape Research (WSL), Birmensdorf, Switzerland
- 4Department of Geosciences and Natural Resource Management, University of Copenhagen, Frederiksberg, Denmark
- 5Unit of Air Pollution and Plant Analysis, Department of Forest Protection, Austrian Research Centre for Forests (BFW), Vienna, Austria
Forest soils harbor diverse microbial communities responsible for the cycling of elements including carbon (C), nitrogen (N), and phosphorus (P). Conversely, anthropogenic N deposition can negatively feed back on soil microbes and reduce soil organic matter (SOM) decomposition. Mechanistically, this can include reductions of decomposer biomass, especially fungi, and decreases in activities of lignin-modifying enzyme (LMEs). Moreover, N inputs can lower resource C:N and thus decrease the C:N imbalance between microbial decomposers and their resources. As a result, microbially-mediated decomposition might slow down, resulting in larger SOM pools with consequences for ecosystem nutrition and climate regulation. Here, we studied the long-term impact of experimental N addition on soil microbes and microbially-mediated decomposition in two coniferous forests in Switzerland and Denmark. We measured microbial biomass C and N, phospholipid fatty acid (PLFA) biomarkers and potential enzyme activities related to C, N, and P acquisition along the topsoil profile (0–30 cm). In particular, we investigated shifts in microbial C:N homeostasis and relative C:N:P limitation. Contrary to prevailing theory, microbial biomass and community composition were remarkably resistant against two decades of 750 and 1,280 kg ha−1 of cumulative N inputs at the Swiss and Danish site, respectively. While N reduced fungal-specific PLFAs and lowered fungi-to-bacteria (F:B) ratios in some (mainly organic) horizons where soil organic carbon (SOC) has accumulated, it increased F:B ratios in other (mainly mineral) horizons where SOC has declined. We did not find a consistent reduction of LME activities in response to N. Rather, relationships between LME activities and SOC concentrations were largely unaffected by N addition. This questions prevalent theories of lignin decomposition and SOC storage under elevated N inputs. By using C:N stoichiometry, we further show that microbial communities responded in part non-homeostatically to decreasing resource C:N, in addition to a likely increase in their carbon use efficiency and a decrease in nitrogen use efficiency. While the expected increased allocation to C- and decreased allocation to N-acquiring enzymes was not found, microbial investment in P acquisition (acid phosphatase activity) increased in the nutrient-poor Podzol (but not in the nutrient-rich Gleysol). Enzyme vector analysis showed decreasing C but increasing P limitation of soil microbial communities at both sites. We conclude that simulated N deposition led to physiological adaptations of soil microbial communities across the topsoil profile in two independent experiments, with long-term implications for tree nutrition and SOC sequestration. However, we expect that microbial adaptations are not endless and may reach a tipping point when ecosystems experience nitrogen saturation.
Introduction
The cycles of carbon (C), nitrogen (N), and phosphorus (P) are intimately linked in forest ecosystems as a result of biological control over accumulation and decomposition of organic matter. However, this biological control is increasingly overridden by human activities causing climate change, biodiversity loss, and elemental imbalances (e.g., enhanced deposition of reactive N; Vitousek et al., 1997; Crutzen, 2006; Rockström et al., 2009). Atmospheric N deposition onto terrestrial systems has increased 3-fold since 1850, with a disproportionate contribution from anthropogenic sources (Kanakidou et al., 2016). Despite recent reductions, N deposition rates have remained well above background levels in some of the most affected regions in Europe and the US, and are still rising in China, India, and Brazil (Simpson et al., 2014; Vet et al., 2014; BassiriRad, 2015; Kanakidou et al., 2016). In temperate and boreal forests, reactive N inputs have been shown to alter understory biomass (Gundale et al., 2014), accelerate soil acidification and base cation loss (Högberg et al., 2006; Tian and Niu, 2015; Forstner et al., 2019), and increase N leaching (Moldan and Wright, 2011; Schleppi et al., 2017). At the same time, atmospheric N inputs can promote plant CO2 fixation and thus counteract global warming (Townsend et al., 1996; Norby et al., 2010; Fernández-Martínez et al., 2014; Wang et al., 2017; O'Sullivan et al., 2019).
However, increased atmospheric N deposition can also cause forest nutritional imbalances, as P deposition is not increasing to the same extent as N deposition (Peñuelas et al., 2012). This has led to the projection that natural vegetation will encounter stronger P limitation or increasing N-P co-limitation globally (Peñuelas et al., 2013), and signs there of have been reported, such as declining P nutrition of European forests (Jonard et al., 2015). In a recent meta-analysis, soil microbial communities and plant roots responded to N fertilization by up-regulation of phosphatase enzymes (Marklein and Houlton, 2012). However, responses were far from uniform, negative in some cases, and whether the up-regulation of plant and microbial phosphatases by N addition can offset potential plant P limitation is currently unknown. Increasing phosphorus (co-)limitation may therefore constrain the positive N (and CO2) fertilization effects on plant growth and thereby the global C sink capacity of temperate and boreal forests.
While N availability is a major direct control of tree productivity and thus biomass C storage (Thomas et al., 2010; Vicca et al., 2012; De Vries et al., 2014), it also markedly affects the cycling and storage of soil organic C (SOC), which amounts to more than 60% of the overall forest C (Dixon et al., 1994; Lal, 2005). While N fertilization generally stimulates SOC storage as demonstrated by several meta-analyses during the last decade, the extents of long-term SOC changes following simulated N deposition varied between meta-analysis, being non-significant in forests and in non-agricultural systems (Lu et al., 2011; Yue et al., 2016), +10–11% in forest soils (Janssens et al., 2010; Chen et al., 2018), or +17% in organic horizons with no change in the corresponding mineral forest soils (Liu and Greaver, 2010). The large variability of the SOC responses to simulated N deposition has been linked to a range of factors, such as differences in duration and rate of fertilization, soil nutrient availability, background N deposition, and to divergent responses of plant productivity and microbially-mediated soil organic matter (SOM) decomposition across sites. The N response of microbial SOM decomposition has been suggested to be key in this respect. Added N might sustain a larger pool of decomposer biomass either directly by alleviating microbial N limitation (Allison et al., 2009; Janssens et al., 2010) or indirectly by up-regulating plant C inputs (Litton et al., 2007). In both cases, resource availability to heterotrophic microbes is improved, which in turn can accelerate SOM decomposition. Alternatively, added N might reduce overall microbial biomass so that decomposition is slowed down and SOM accumulates (Treseder, 2008; Janssens et al., 2010; Frey et al., 2014).
While N-induced acceleration of decomposition seems to be limited to high-quality substrates such as low-lignin litter (Fog, 1988; Berg and Matzner, 1997; Talbot and Treseder, 2012; Xia et al., 2018), reductions in decomposition rates and microbial biomass are more common (Treseder, 2008; Janssens et al., 2010; Maaroufi et al., 2017; Morrison et al., 2018). Yet, the underlying mechanisms are far from elucidated—largely because N addition triggers a range of interlinked microbial and plant responses, which may directly or indirectly feedback on soil microbes. In her seminal review, Kathleen Treseder summarized some of these mechanisms (Figure 1 in Treseder, 2008). Here, we adapt this framework by including aspects of microbial C:N stoichiometry (Figure 1) and distinguish between (i) N acting as inorganic ion in soil solution (left-hand side of Figure 1) and (ii) the role of N as a microbial nutrient (right-hand side of Figure 1).
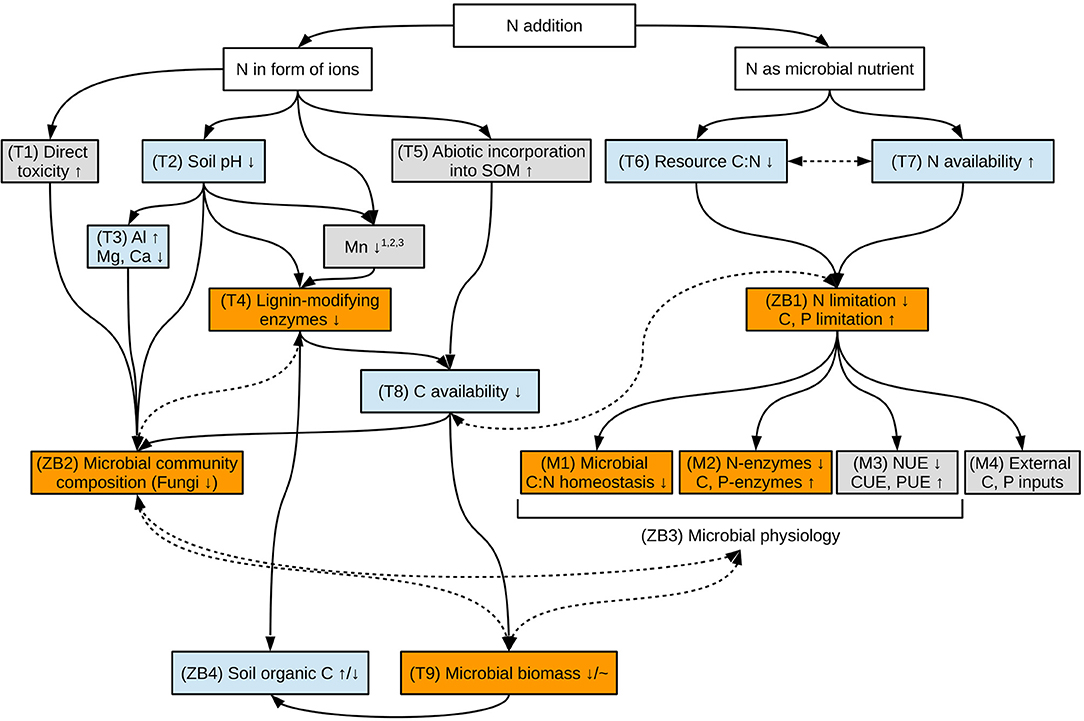
Figure 1. Scheme of potential mechanisms by which added N can impact soil microorganisms and soil organic C. The conceptual model is based on Treseder (2008) (T1-9) and includes ideas from Mooshammer et al. (2014) (M1-4) and Zechmeister-Boltenstern et al. (2015) (ZB1-4). Orange boxes highlight mechanisms studied in this contribution and are described in more detail the main text. Blue boxes highlight mechanisms studied by Forstner et al. (2019) at the same experimental sites. Gray boxes highlight mechanisms yet unstudied at these experimental sites. Continuous, single-headed arrows between boxes indicate hypothesized cause-effect relationships. Dashed, double-headed arrows between boxes indicate hypothesized feedback-loops. Up- and downward arrows within boxes indicate hypothesized increases and decreases of the respective parameters upon N addition, respectively, while the tilde indicates unchanged microbial biomass in case of physiological adaptations to added N. References relating N addition to Mn availability are Turlapati et al. (2013) (1), Berg et al. (2015) (2), and Whalen et al. (2018) (3).
The core of this conceptual model is well-supported by observations that added N often reduces soil microbial biomass and alters soil microbial community composition, particularly by decreasing the abundance of fungi (Frey et al., 2004; van Diepen et al., 2007, 2016; Edwards et al., 2011; Morrison et al., 2016). Decreases in fungal abundance often co-occurred with reduced activities of the lignin-modifying enzymes (LMEs) phenol oxidase and peroxidase, which are mainly produced by white rot fungi to oxidize lignin and SOM (Carreiro et al., 2000; Baldrian, 2006; Sinsabaugh, 2010; Hatakka and Hammel, 2011; Frey et al., 2014). Reduced LME activities after N addition are consistent across a wide range of ecosystems and have therefore been suggested to represent a “keystone microbial enzyme” mechanism by which N slows SOM decomposition and enhances SOC storage (Chen et al., 2018).
While this set of hypotheses focuses on (i) added N as ion in soil solution (left-hand side of Figure 1), we also investigated (ii) the role of added N as microbial nutrient (right-hand side of Figure 1). Here, added N can directly (when taken up from soil solution) or indirectly (via plant uptake and litterfall) lower the C:N stoichiometry of microbial resources. As a result, N addition can lower the C:N imbalance between soil microbes and their resources, which arises when relatively N-rich microbes face relatively C-rich substrates (Mooshammer et al., 2014). Microbes have several options to respond to such a situation, including adaptations of their biomass stoichiometry in a non-homeostatic way, shifts in enzyme production (right-hand side of Figure 1), and changes in microbial element use efficiencies (Mooshammer et al., 2014).
Whether soil microbes adapt to this decrease in C:N imbalance by added N acting mainly as microbial nutrient (ii), or alternatively, microbial abundance and associated LME activities are reduced by N acting mainly as ion (i) should have profound consequences for coupled belowground CNP cycles. In case (ii), soil microbial communities should be able to recouple CNP cycling by enhancing C and P mining in the face of chronic N inputs and therefore incrase SOM decomposition, lowering the potential for N-induced SOC accumulation. In case (i), chronic N additions could reduce microbial numbers and their enzymatic capacity to decompose SOM, in line with observations from several long-term N experiments and meta-analyses (Waldrop et al., 2004b; Janssens et al., 2010; Zak et al., 2011; Frey et al., 2014). Whether case (i) or case (ii) prevails might also vary throughout the soil profile.
Here, we tested these two alternative hypotheses at two long-term (~20 years) N addition experiments, one located in Alptal, Switzerland and one in Klosterhede, Denmark. Both sites are stocked by old spruce forests, but differ in soil type, i.e., nutrient-rich Gleysols in Alptal and nutrient-poor Podzols in Klosterhede. At these sites decadal N addition increased SOC storage in organic horizons while SOC pools of mineral topsoil horizons declined. As a result, SOC storage shifted from mineral to organic horizons with no net increase in overall SOC storage at both sites (Forstner et al., 2019). In order to better understand the controls behind these shifts in SOC storage, we investigated if and how soil microbial communities responded to added N, and did so at each site in six genetic soil horizons ranging from upper organic to lower mineral horizons within 0–30 cm depth. More specifically, we studied the N-response of (i) soil microbial biomass, (ii) soil microbial community composition, and (iii) aspects of soil microbial physiology, including C:N homeostasis, enzyme-mediated resource acquisition and relative C:N:P limitation.
We expected that (1) long-term N addition would reduce microbial biomass, in particular fungal biomass, and activities of LMEs mainly in organic horizons, where increases of SOC pools have been documented, and that (2) long-term N addition would lead to changes in microbial physiology mainly in mineral horizons, where N acts primarily as microbial nutrient and declines in SOC pools have been observed.
Materials and Methods
Sites and Experimental Design
Two long-term N addition experiments in Europe were investigated. Both experimental sites are located in temperate forests stands dominated by Norway spruce (Picea abies L. Karst.) and have received N amendments for about two decades. Other features such as parent material, climate and soil type differ markedly between sites (Table 1; Gundersen, 1998; Schleppi et al., 2017; Forstner et al., 2019).
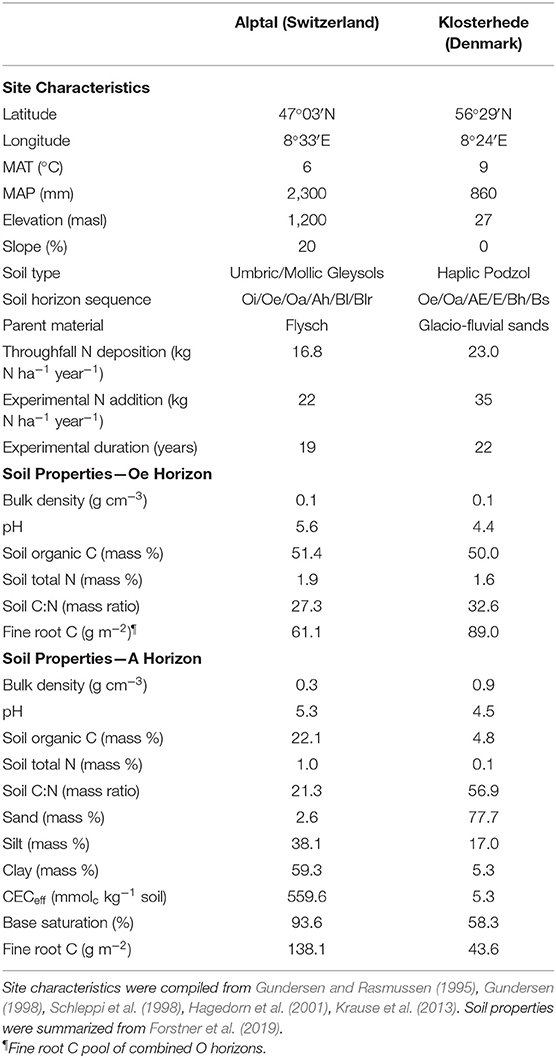
Table 1. Site characteristics and soil properties of control plots at Alptal (Switzerland) and Klosterhede (Denmark).
Alptal is located in the Swiss Pre-Alps with a cool and wet climate (Table 1). The experimental site is located on a 20% slope with a western aspect. Soils are clay-rich Gleysols developed from Flysch bedrock (Leupold, 1942; Hagedorn et al., 2001) and have a high cation-exchange capacity and base saturation. Gleysols occupy an estimated 720 million hectares worldwide (Driessen, 2001). The forest stand is dominated by up to 260-year-old Norway spruce trees (P. abies; Schleppi et al., 1998). Owing to the plasticity of the parent material, the slope has steadily been moving downhill resulting in a heterogeneous micro-topography, with associated small-scale variability in soil types and understory vegetation (Schleppi et al., 1998, 2017; Hagedorn et al., 2001; Krause et al., 2013). Two main micro-topographic units are distinguished: mounds are characterized by the occurrence of Vaccinium species on top of Umbric Gleysols, whereas depressions are dominated by grasses and forbs over Mollic Gleysols (Schleppi et al., 1998; Hagedorn et al., 2001; Krause et al., 2013).
The N addition experiment at Alptal has been set up in 1995 to study the response of N transformations, soil fauna, and trace gas fluxes at the plot and catchment scale (Mohn et al., 2000; Hagedorn et al., 2001; Xu et al., 2009; Krause et al., 2013). Four N addition plots of 20 m2 each were sampled for this study. Each N treated plot was paired with a control plot of the same size in close vicinity (<30 m) based on comparable micro-topography and vegetation cover in a replicated block design (for more details see Forstner et al., 2019).
Nitrogen was added to treatment plots by sprinkling of ammonium nitrate diluted in rainwater (Mohn et al., 2000; Schleppi et al., 2017) during precipitation events. Hence, N addition varied annually with local precipitation regime amounting to an average of 22 kg N ha−1 y−1 (Schleppi et al., 2017). Control plots received the same amount of unaltered rainwater. In winter, automatic irrigation was replaced by the occasional application of concentrated ammonium nitrate solution on top of the snowpack using a backpack-sprayer.
Klosterhede is located in Western Jutland, Denmark. Mean annual temperature is comparable to Alptal, while Klosterhede receives only one third of precipitation (Table 1). The experimental site is situated on a flat glacio-fluvial outwash plain where micro-topography is more homogeneous compared to Alptal. Soils are coarse-textured, nutrient-poor Haplic Podzols (Gundersen and Rasmussen, 1995). The Podzols are acidic and have a sandy texture, a low cation-exchange capacity as well as an intermediate base-saturation, and are characterized by the downward transport of dissolved organic matter together with iron and aluminum from the upper to the lower parts of the soil profile (Driessen, 2001; Blake et al., 2008). Podzols cover an estimated 485 million hectares worldwide (Driessen, 2001). The managed forest stand is the second generation after heathland conversion (Gundersen, 1998) with a tree age of 97 years in 2014. Ground vegetation is dominated by Deschampsia flexuosa L. Trin. and mosses (Gundersen and Rasmussen, 1995).
The original experimental design at Klosterhede involved one N treatment area (15 × 15 m) and two control areas (15 × 15 m and 15 × 10 m) at each side of the N treatment area with a 4–5 m buffer zone including a buried separating plastic sheet (Gundersen and Rasmussen, 1995). The treatment area had received N in the form of ammonium nitrate at a rate of 35 kg N ha−1 y−1 since February 1992 by hand-spraying of monthly aliquots (except for 2 years 1998–99 and in a few drought periods). Water added to the N treated area was less than 1% of the throughfall volume while control areas were subjected to natural precipitation (Gundersen and Rasmussen, 1995).
For the present study we divided each area (N treatment and combined controls) into four plots (7.5 × 7.5 m) that are regarded as experimental units. Each N addition plot was then paired with the control plot in closest juxtaposition to create four blocks of two plots each (see Forstner et al., 2019 for details).
Soil Sampling and Analysis
Soil sampling is described in detail elsewhere (Forstner et al., 2019). Briefly, soil was taken from three locations within each plot. At Alptal, samples from both mounds and depressions were included to cover micro-topographical variability. At each location, organic soil material was removed horizon-wise from within a 25 × 25 cm metal frame. Visible roots were separated from organic material on site. Subsequently, mineral soil was sampled with a steel corer (length 30 cm, diameter 4.5 cm). Four cores were retrieved from within the 25 × 25 cm metal frame and mineral soil was pooled by horizon to create one composite sample per location, stored in air-tight plastic bags, placed in cooled boxes and immediately transported to the laboratory. Any remaining roots were separated from organic horizon material by hand before organic soil material was homogenized in a polytron blender (7,000 rpm for 3 min; Grindomax GM2000, Retsch, Haan, Germany). Mineral soil samples were sieved to <2 mm. Gravimetric water content was determined from subsamples dried to constant mass at 105°C. Total C and N concentrations were measured with an elemental analyzer (NA 1500, Carlo Erba, Milan, Italy) after air-drying to constant mass. Inorganic C was determined by volumetry (Scheibler's method) and subtracted from total C to estimate soil organic carbon (SOC). Aliquots of field-moist soil were stored at 4°C up to 2 weeks for analysis of microbial biomass carbon (MBC), microbial biomass nitrogen (MBN), and enzyme activities. Subsamples were stored at −18°C until analysis of phospholipid fatty acids (PLFAs).
Microbial Biomass and Community Composition
Microbial biomass C and N were determined by chloroform fumigation-extraction (Vance et al., 1987). Field-moist soil samples were fumigated with ethanol-free chloroform for 24 h, and samples extracted with 0.5 M K2SO4 (1:20 w/v for organic soil material, 1:10 w/v for mineral soil material) for 1 h at room temperature, filtered through ash-free Whatman filter paper (No. 40) and stored at −18°C. Non-purgable organic carbon (NPOC) and total dissolved nitrogen (TDN) were measured using a TOC/TN analyzer (Shimadzu TOC-L/TNM-L, Shimadzu, Korneuburg, Austria). Microbial biomass C and N were calculated as the difference between fumigated and unfumigated samples in NPOC and TDN, respectively. We did not apply any factors to correct for incomplete extraction of microbial biomass as these factors are not known for these soils.
Microbial community composition was determined by analysis of PLFA biomarkers using a Bligh and Dyer method modified after Kaiser et al. (2010). Total lipids were extracted with chloroform/methanol/citric acid buffer (1:2:0.8 v/v/v, pH 4) from 0.5 and 2 g of freeze-dried organic and mineral soil material, respectively. Extracted fatty acids were subjected to mild alkaline hydrolysis and methylation using methanolic KOH. The resulting fatty acid methyl esters (FAMEs) were analyzed by gas-chromatography and a flame ionization detector. Individual FAMEs were quantified using non-adecanoic acid (19:0, 40 mg L−1) as internal standard and identified using a bacterial acid methyl ester mix (Supelco BAME Mix 47080-U, Sigma-Aldrich, Vienna, Austria) and a mix of common fatty acid methyl esters (Supelco 37 Component FAME Mix 47885-U/CRM47885, Sigma-Aldrich, Vienna, Austria). In total, we identified 35 individual PLFA markers that were assigned to the following microbial groups: Gram-negative bacteria (2OH 12:0, 3OH 12:0, 2OH 14:0, 16:1ω9c, cy17:0, cy19:0, 22:1ω9c), Gram-positive bacteria (a15:0, i15:0, i16:0, i17:0), general bacteria (15:0, 15:1ω5, 17:0, 17:1ω7c), fungi (18:2ω6,9), other microbial decomposers (14:0, 20:1ω9c), protozoa (20:2ω6, 20:3ω6), and general eukaryotes (18:3ω3, 20:4ω6, 20:5ω3, 21:0, 22:0, 22:6ω3, 23:0, 24:0). PLFA markers were assigned to these microbial groups following Ruess and Chamberlain (2010) and Willers et al. (2015) with additional information derived from Vestal and White (1989), Leckie (2005), Kaiser et al. (2010), Kohl et al. (2015), and Mooshammer et al. (2017). Bacterial markers are the sum of Gram-negative specific, Gram-positive specific, and general bacterial markers. The fungi-to-bacteria (F:B) ratio was calculated as the fungal marker 18:2ω6,9 divided by the sum of bacterial markers. Total PLFA concentration was calculated by summing the group-specific PLFA markers and the unspecific markers 16:0, 18:0, 18:1ω9c, 18:1ω9t, and 20:0. Relative abundance of PLFA markers (mol%) was calculated by normalizing biomarker concentration to total PLFA concentration per sample.
Soil Enzyme Activities
We assessed potential activities of five hydrolytic and two oxidative soil enzymes (Saiya-Cork et al., 2002; Kaiser et al., 2010). Activities of β-glucosidase (BG), cellobiohydrolase (CBH), N-acetyl-β-D-glucosaminidase (NAG), leucine-aminopeptidase (LAP), and acid phosphatase (AP) were measured using corresponding fluorigenic substrates. Activities of the lignin-modifying enzymes phenol oxidase (POX) and peroxidase (PER) were measured following the oxidation of the model substrate L-3,4-dihydroxyphenylalanine (L-DOPA, Table 2). Soil slurries for all assays were prepared by adding 0.5 and 1 g field-moist soil material for organic and mineral horizons, respectively, to 100 mL of sodium acetate buffer (100 mM, adjusted to pH 5.1 for Alptal and pH 4.4 for Klosterhede) and homogenized by applying ultrasonic treatment for one min at 10% power output (Bandelin Sonoplus HD 2200 with conical microprobe MS 72, Bandelin electronic GmbH & Co. KG, Berlin, Germany).
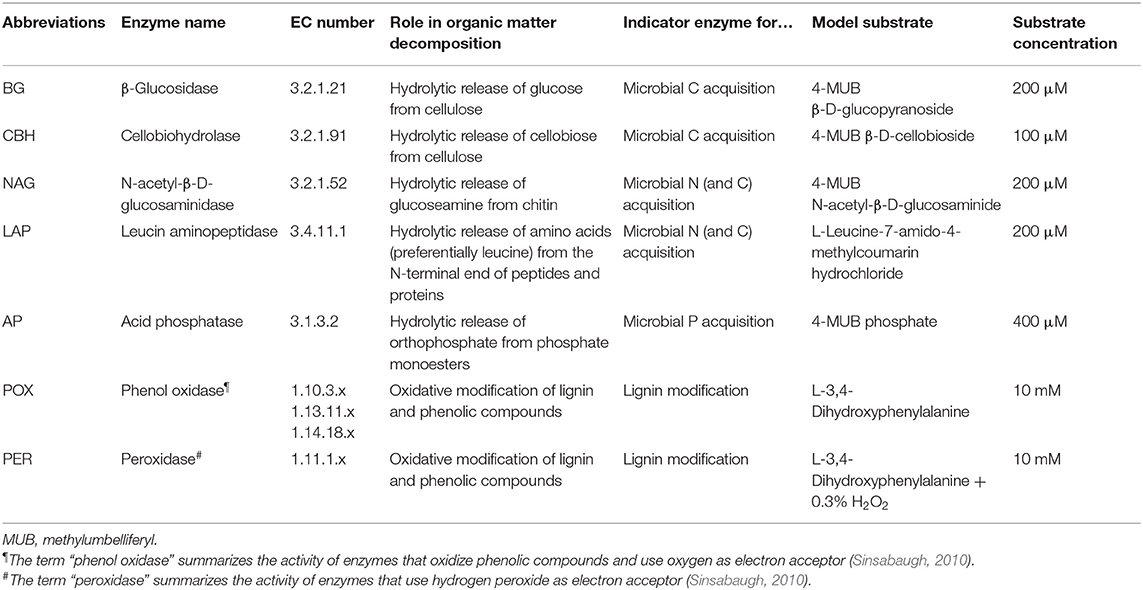
Table 2. Biochemical classification, role in organic matter decomposition and assay details for the seven soil enzyme classes included in this study.
For hydrolytic enzyme assays, 200 μL aliquots of soil slurry were removed under continuous stirring and transferred into a black 96-well microtiter plate in analytical triplicates. Assays were started by adding 50 μL of the corresponding fluorigenic substrate solutions to sample wells (Table 2). Each plate also had controls for background fluorescence from samples (200 μL soil slurry plus 50 μL buffer), buffer (250 μL buffer), and fluorigenic substrates (200 μL buffer plus 50 μL substrate solution), and was incubated for 140 min at 20°C. Fluorescence intensity was measured by a fluorescence spectrophotometer (Emission: 365 nm, Extinction: 450 nm; EnSpire 2300, PerkinElmer, Brunn/Gebirge, Austria). Activity was quantified against standard curves of 4-methylumbelliferone (MUB) or 7-amino-4-methylcoumarin (AMC, for LAP assays) prepared in soil slurry (quenched standards).
Equal volumes of L-DOPA solution (20 mM in sodium acetate buffer, pH 5.1 for Alptal and pH 4.4 for Klosterhede) and soil slurries were combined for phenol oxidase and peroxidase assays in 2 mL microcentrifuge tubes. Samples were shaken for 10 min and centrifuged (5 min at 5,000 rpm) before 250 μL of supernatant were transferred to two clear 96-well plates in analytical triplicates. Plates for peroxidase activities received 10 μL of 0.3% H2O2. Plates were measured immediately and again after incubation in the dark at 20°C for 20 h. Lignin-modifying enzyme activities were calculated from the increase in net absorbance at 450 nm and the pre-determined micromolar extinction coefficient of dopachrome (0.445 μmol−1) according to the recommendations of German et al. (2011).
Microbial C:N Homeostasis and Relative C:N:P Limitation
We used C:N ratios of microbial biomass, soil organic matter, and soil extractable labile compounds (EOC:ETN), respectively, to assess the degree of microbial C:N homeostasis. The slope S of the log-log linear relationship between C:N of soil organic matter or soil extractable labile compounds (x-axis, reflecting resource stoichiometry) and microbial C:N (y-axis, reflecting consumer stoichiometry) is interpreted as a measure for the strength of homeostatic regulation of soil microbes [log(microbial C:N) = log(constant) + S log(ressource C:N); (Sterner and Elser, 2002)]. The strength of homeostatic regulation was separately assessed for N addition and control treatments by standardized major axis regression as implemented in the smtr3 package (Warton et al., 2006, 2012). The resulting slopes were tested for significant differences. We then calculated the homeostatic regulatory coefficient (H) as the reciprocal of the slope (H = 1/S).
We used the activities of five hydrolytic enzymes to assess relative limitations of soil microbial communities with respect to C, N, and P (Table 2). In line with resource allocation theory we interpreted the ratios of C-, N-, and P-acquiring enzymes as indicators of microbial investment into the acquisition of the respective resources (Sinsabaugh and Moorhead, 1994; Sinsabaugh and Follstad Shah, 2012; Fanin et al., 2016) and used the geometric approach of Moorhead et al. (2016) to simultaneously assess (i) relative C vs. nutrient (N, P) limitation and (ii) relative N vs. P limitation. Therefore, the proportional activity of C vs. C+N acquiring enzymes (BG/[BG+NAG+LAP]) is plotted against the proportional activity of C vs. C+P acquiring enzymes (BG/[BG+AP]) and two metrics for the resulting vector connecting each point to the origin are calculated. For vector analysis we modified the approach of Bárta et al. (2014) assuming that microbes use all elements released from model substrates (i.e., hydrolysis products). Hence, the proportional activities for vector analysis were calculated as y = (CHP/(CHP+ NHP)) and x = (CHP/(CHP+ PHP)). Hydrolysis product vector length was then calculated as the square root of the sum of squared values of x and y, i.e., hydrolysis product vector length = sqrt(x2 + y2) and hydrolysis product vector angle was calculated as arctangent of the point (x, y), i.e., atan(y/x)*180/π (Moorhead et al., 2013; Fanin et al., 2016). Greater vector lengths indicate higher relative C vs. nutrient limitation while angles >45° indicate relative P vs. N limitation and angles <45° indicate relative N vs. P limitation (Moorhead et al., 2013).
Statistical Methods
All statistical analyses were conducted in R 3.5.1 (R Development Core Team, 2008) using the IDE RStudio Desktop 1.1.453 (RStudio, Inc., MA, USA). We used linear mixed-models (LMMs) to test for effects of N addition treatment, soil horizon, and their interaction on univariate response variables (package lme4 1.1–21, Bates et al., 2015). Variables were tested for normality and homogeneity of variances using Shapiro-Wilk and Levene's tests, respectively. In case of non-normality and/or heteroscedasticity data were transformed by either taking the natural logarithm or using the Box-Cox family of power transformations (package car 2.0–19, Fox and Weisberg, 2011). Block and replicate within block and treatment were included as random effects in the LMMs. Microtopographic position (mound/depression) was included as additional random effect at Alptal. Model assumptions were checked by inspection of diagnostic plots (residuals vs. fitted, qq). ANOVA-like procedures were used on LMMs to test for significance of main effects using the Kenward-Rodger method to correct denominator degrees of freedom and associated F-values (package afex 0.23-0, Singmann et al., 2019). Post-hoc differences between soil horizons were assessed with Tukey's HSD tests, and Dunnett's tests were used to check for treatment effects within horizons (package emmeans 1.3.4, Lenth, 2019). We calculated two goodess-of-fit measures for LMMs: Marginal R2 represents the amount of variance explained by fixed effects only, while conditional R2 gives the variance explained by the full model including random effects [Nakagawa and Schielzeth (2013) as implemented in the package MuMIn 1.43.6, Barton (2019)].
We used the relative abundances of PLFA biomarkers (mol%) to analyse multivariate microbial community composition. Relative abundances were used to construct Bray (Sørensen) distance matrices that served as input for both Non-metric Multidimensional Scaling (NMDS) and Permutational Multivariate Analysis of Variance Using Distance Matrices (ADONIS). In order to reduce noise for multivariate analysis we included only PLFA markers that exceeded 0.5 mol% relative abundance in at least 80% of the samples at each site (sensu Gutknecht et al., 2012; see Tables S1, S2). Individual NMDS ordinations were calculated for mineral horizons at Alptal, organic horizons at Klosterhede and mineral horizons at Klosterhede, respectively. Each ordination was constructed using the metaMDS command (package vegan 2.5-5, Oksanen et al., 2019). To find the best global solution, NMDS ordinations were started from at least 30 (up to 50) random starts. Permutational ANOVA (function adonis in vegan) was used with 999 within-block permutations to assess effects of N addition treatment, soil horizon and their interaction on multivariate biomarker distances. Multiple stepwise regression was conducted to relate potential predictors to NMDS axis scores (package caret 6.0-84, Kuhn et al. (2019), package leaps 3.0, Lumley (2017)].
To investigate the keystone enzyme hypothesis we evaluated effects of added N on relations between LMEs, SOC concentrations and F:B ratios using ANCOVA-like linear mixed effect models, and did so separately for organic and mineral horizons.
Results
Microbial Biomass C, N, and C:N Ratios
At Alptal, MBC ranged from 330 ± 40 in the uppermost Oi horizon to 7.6 ± 0.9 μmol g−1 in mineral subsoil, with no significant differences between control and N addition plots (treatment main effect: P = 0.50, treatment/horizon interaction: P = 0.17, Figure 2A). Microbial biomass N exhibited a similar depth-related gradient, ranging from 47 ± 6 to 1.2 ± 0.2 μmol g−1 soil with no effect of N addition (treatment main effect: P = 0.72, treatment/horizon interaction: P = 0.24, Figure 2B). Consequently, MBC:MBN was unaffected by added N, with molar ratios ranging from 5.4 in the Ah horizon to 14.5 in the Bl horizons (Figure 2C). In the Blr horizon, N addition reduced the MBC:MBN ratio from 8 to 4.9 on average (treatment/horizon interaction: P = 0.07, post-hoc differences of means: P = 0.001, Figure 2C).
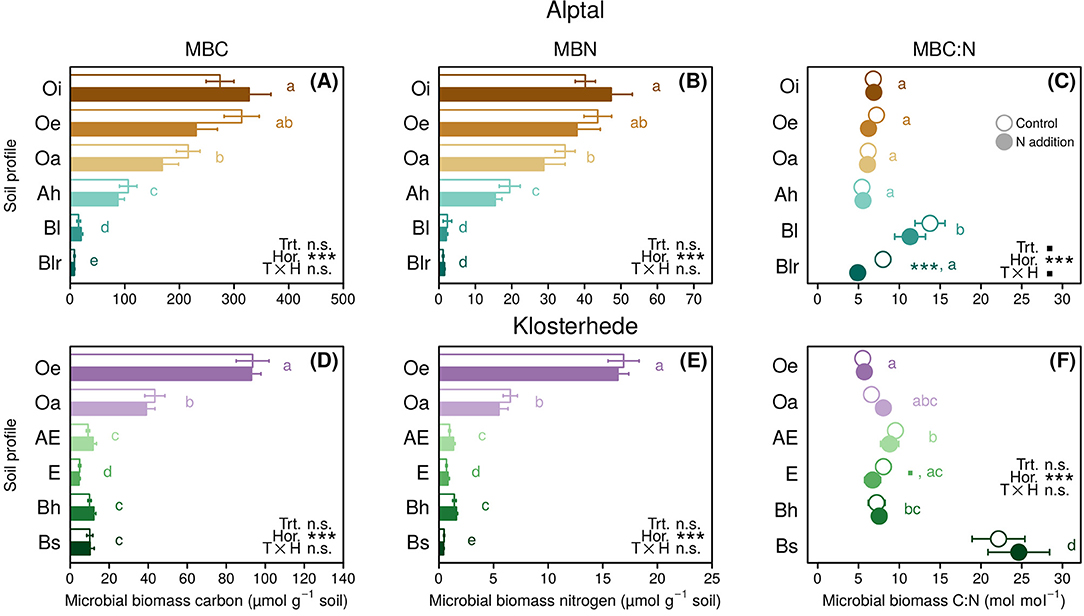
Figure 2. The mean (±1 SE, n = 4) of microbial biomass carbon (A,D), microbial biomass nitrogen (B,E), and microbial C:N ratios (C,F) in response to N addition along the topsoil profile (0–30 cm) at Alptal (A–C) and Klosterhede (D–F). Post-hoc differences between control and N addition treatment within soil horizon are indicated by symbols next to pairs of bars/circles (■P < 0.1; *P < 0.05; **P < 0.01; ***P < 0.001). Lower-case letters indicate post-hoc differences between soil horizons across treatments. Means with no letter in common are significantly different (Tukey's HSD, α = 0.05).
Microbial biomass C at Klosterhede ranged from 94 ± 8 μmol g−1 soil in the Oe horizon to 4.6 ± 0.6 μmol g−1 soil in the E horizon (Figure 2D). Microbial biomass N ranged from 16.9 ± 1.4 μmol g−1 soil in the Oe horizon to 0.4 ± 0.1 μmol g−1 soil in the Bs horizon (Figure 2E). As in Alptal, added N had no effect on MBC or MBN. Microbial C:N ratios were unaffected by N addition treatment and varied between 5.5 and 9.5 in most horizons (Figure 2F). In the lowermost Bs horizon, MBC:MBN ratios were unusually high with 22 ± 3 in the control and 25 ± 4 in the N addition plots, due to low MBN concentrations.
Viable Microbial Biomass and Microbial Community Composition
Added N tended to increase the amount of viable microbes measured as total PLFA concentration in mineral horizons of Alptal (treatment main effect: P = 0.13) and significantly increased total PLFA concentration in the Bl horizon, mainly due to increases in fungal markers (post-hoc differences of means: P = 0.05; Table 3). There was neither an effect of N addition on the relative abundance of group-specific PLFA biomarkers (univariate analysis; Table 3) nor on multivariate community composition in mineral horizons at Alptal, where N addition treatment explained only 1% of microbial community distances. In contrast, about 60% of the variation in multivariate distance between samples was explained by soil horizon (Figure 3A).
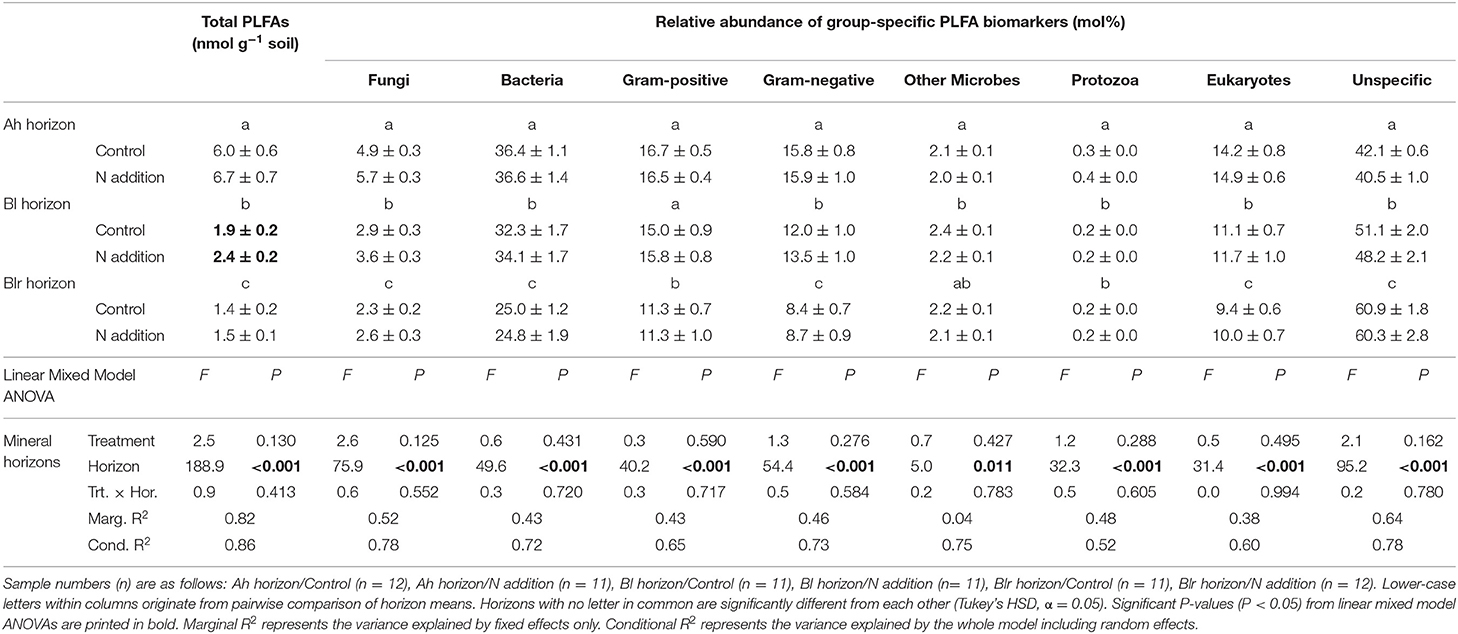
Table 3. Total PLFA concentrations and relative abundance of group-specific PLFA biomarkers (mol%) in response to long-term N addition at Alptal (Switzerland).
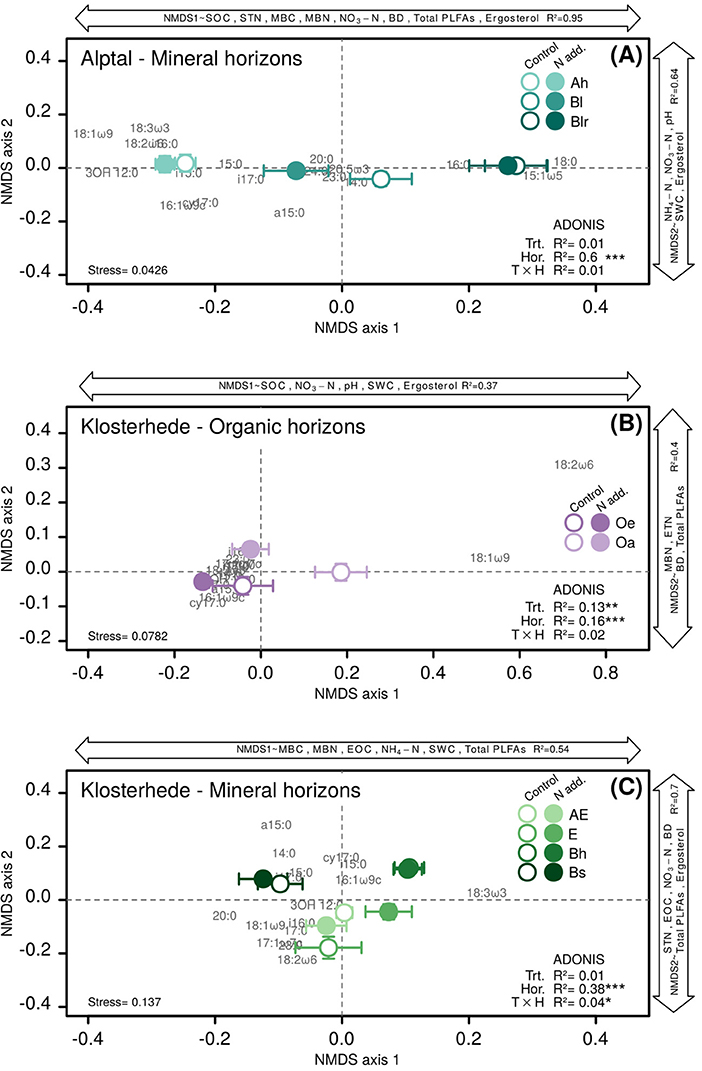
Figure 3. Non-metric multidimensional scaling (NMDS) ordinations based on distance-matrices calculated from PLFA biomarkers of control and N addition plots at Alptal (A) and Klosterhede (B,C). Double-headed arrows parallel to NMDS axes depict variables significantly related to the respective axis by multiple linear regression. Each ordination only includes PLFA markers with a relative abundance >0.5 mol% in at least 80% of samples (see Tables S1, S2). See Materials and Methods for assignment of PLFA biomarkers to microbial groups. Effects of N addition treatment, soil horizon and their interaction on multivariate PLFA biomarker distances were assessed by permutational analysis of variance (ADONIS).
Total viable microbial biomass was unaffected by N addition across the whole topsoil profile at Klosterhede (Table 4). However, there were horizon-specific shifts in microbial community composition related to N addition (Figures 3B,C; Table 4). In organic horizons, we found that the abundance of the fungal-specific biomarker 18:2ω6,9 generally decreased with added N (Table 4), particularly so in the highly decomposed Oa horizon (−53%, P = 0.07, Table 4). These differences in relative abundance of 18:2ω6,9 and, to a lesser extent, of 18:1ω9 drove the separation of control and N addition treatments along axis 1 in the NMDS analysis (Figure 3B). Here, N addition significantly altered microbial community composition across organic soil horizons (ADONIS P = 0.002) and explained 13% of the multivariate community distance (Figure 3B). Across organic soil horizons, the amount of community variability explained by added N was thus comparable to the effect of soil horizon, which drove the separation along NMDS axis 2 (ADONIS P = 0.001, R2 = 16%). Multiple linear regressions revealed that 37% of the variability in axis 1 scores was explained by soil organic C, nitrate, pH, and soil water content (Figure 3B) and related axis 2 scores to a linear combination of MBN, extractable total N, bulk density, and total PLFAs (Adj. R2 = 40%, Figure 3B).
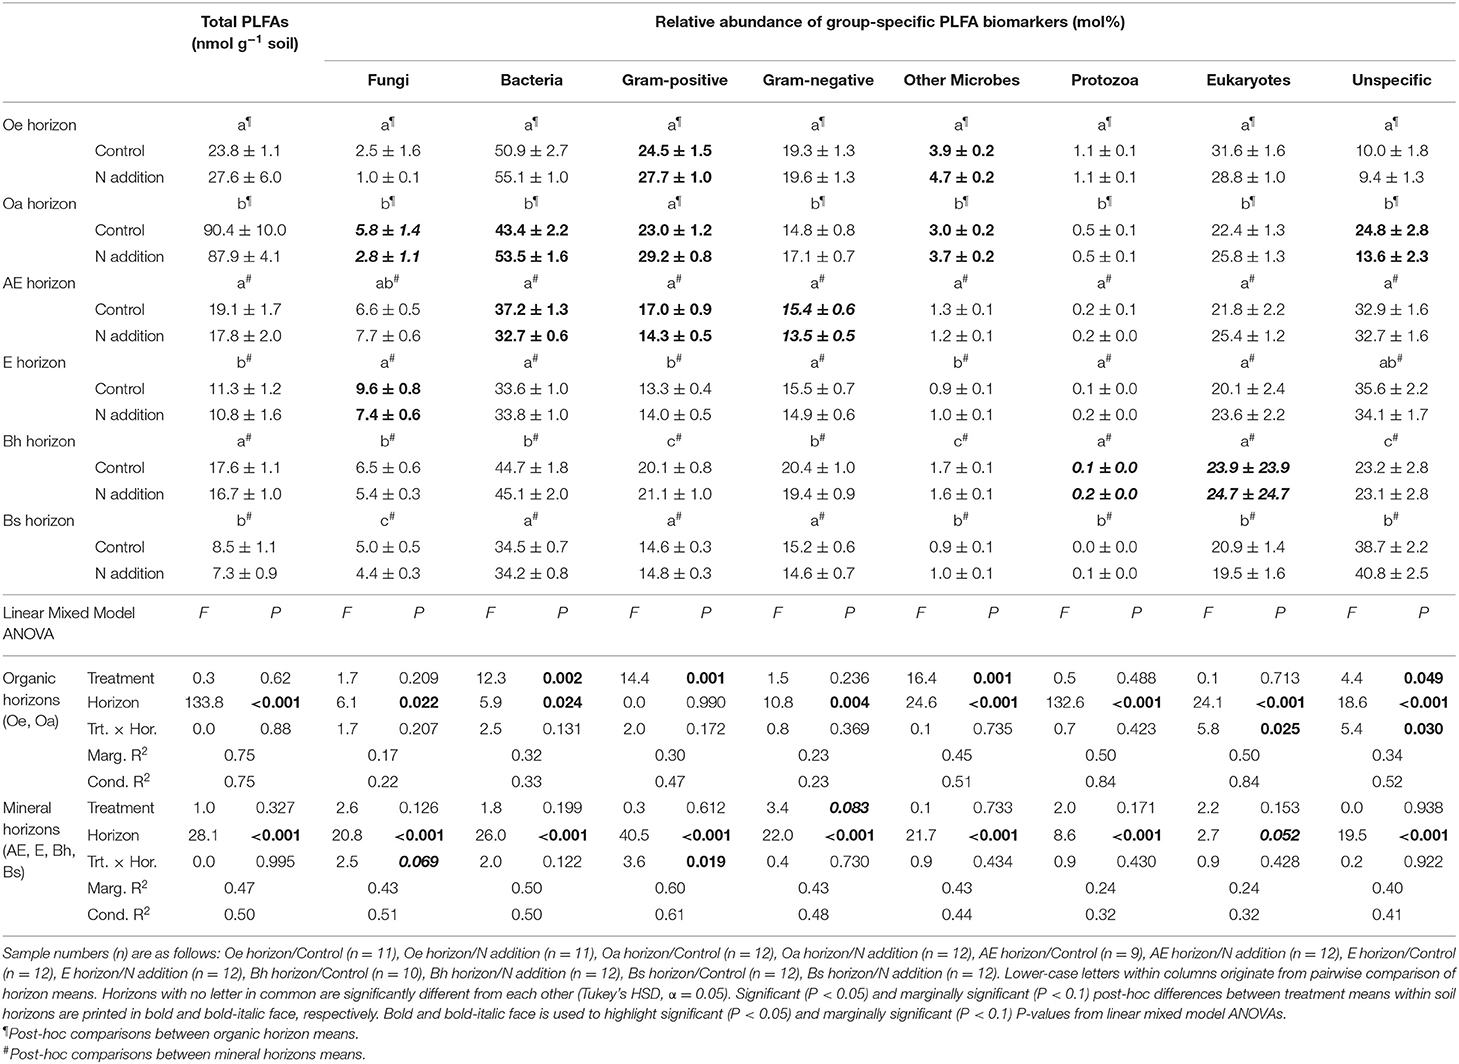
Table 4. Total PLFA concentrations (nmol g−1 soil) and relative abundance of group-specific PLFA biomarkers (mol%) in response to long-term N addition at Klosterhede (Denmark).
Most of the variability in multivariate community composition across mineral horizons at Klosterhede was again explained by soil horizon (ADONIS R2 = 38%), and captured by NMDS axis 1 along which lower horizons (Bh, Bs) had positive and upper horizons (AE, E) had negative scores (Figure 3C). However, a weak but significant interaction of soil horizon and N addition (ADONIS P = 0.03, R2 = 4%) indicated a horizon-specific response of microbial community composition to N. Nitrogen-induced shifts along NMDS axis 1 were mainly driven by a decline of fungal markers in the E horizon (−24%, post-hoc differences in means: P = 0.01, Table 4) and a decline of bacterial markers in the AE horizon (−12%, post-hoc differences in means: P = 0.008, Table 4).
Nitrogen addition marginally increased the F:B ratio in mineral soils at Alptal (treatment main effect: P = 0.091, Figure 4A), while the Gram-positive-to-Gram-negative (GP:GN) ratio was not affected (Figure 4B). At Klosterhede, F:B ratios in organic horizons were lowered by N addition (significantly in case of the Oa horizon, post-hoc differences in means: P = 0.001) as a consequence of an N-induced decline in fungal biomarkers (Figure 4C). In the AE horizon F:B ratios tended to increase with N following a decline in bacterial markers, while in the E horizon F:B ratios decreased with N treatment as fungi declined (treatment/horizon interaction: P = 0.05). Interestingly, GP:GN ratios showed largely opposite patterns, with trends toward higher ratios in response to added N in most horizons including the E horizon (post-hoc differences in means: P = 0.07), and lower ratios in the AE horizon (Figure 4D). Univariate analysis of biomarkers showed that N promoted the relative abundance of Gram-positive markers in organic horizons and reduced them more strongly than Gram-negative markers in the AE horizon (Table 4).
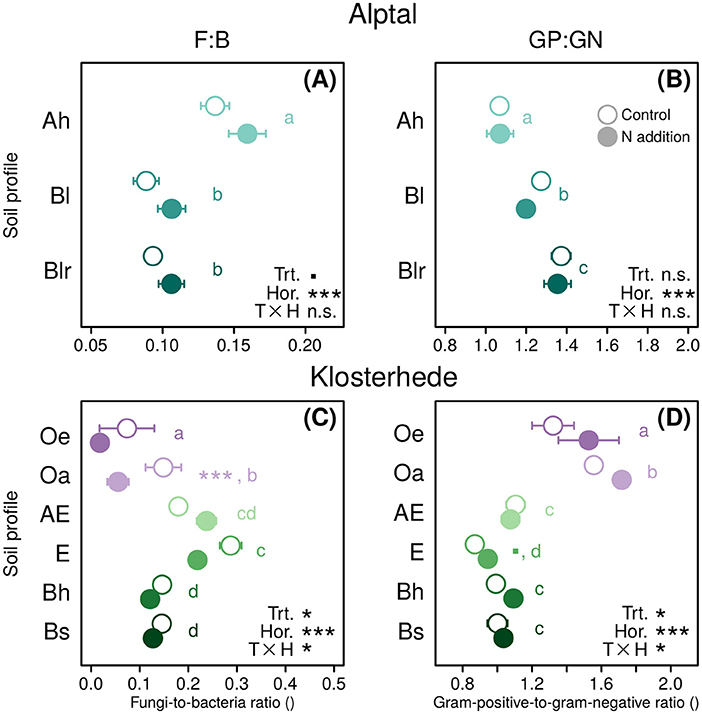
Figure 4. Ratios of fungi-to-bacteria (F:B) and Gram-positive-to-Gram-negative bacteria (GP:GN) in response to N addition along the topsoil profile (0–30 cm) at Alptal (A,B) and Klosterhede (C,D). Post-hoc differences between control and N addition treatment within soil horizon are indicated by symbols next to circle pairs (■P < 0.1; *P < 0.05; **P < 0.01; ***P < 0.001). Lower-case letters indicate post-hoc differences between soil horizons across treatments. Means with no letter in common are significantly different (Tukey's HSD, α = 0.05).
Soil Enzyme Activities
Activities of all soil enzymes were clearly structured by horizon at both sites, with activities generally decreasing with depth (horizon main effect P < 0.05 in all cases, Tables 5, 6). Experimental N treatment interacted with this pedologically-driven activity gradient for most measured enzymes (Tables 5, 6). At Alptal, this was most evident for the upper mineral horizon (Ah), where N reduced the mass-normalized activities of the hydrolytic enzymes beta-glucosidase (BG, −51%, post-hoc differences in means: P = 0.02), cellobiohydrolase (CBH, −47%, post-hoc differences in means: P = 0.021), N-acetyl-glucosaminidase (NAG, −60%, post-hoc differences in means: P < 0.001), leucine aminopeptidase (LAP, −32%, post-hoc differences in means: P = 0.02), and acid phosphatase (AP, −45%, post-hoc differences in means: P = 0.02). Similar N-induced reductions were found for BG, CBH, and NAG in the overlying Oa horizon (Table 5). The only enzymes whose activities were consistently reduced by N across the Alptal topsoil profile were NAG and AP (treatment main effects: P = 0.02 and P = 0.06, respectively, Table 5). Responses of the LMEs phenol oxidase (POX) and peroxidase (PER) to N at Alptal were unpredictable: While N halved POX activity in the Oi horizon in line with prevailing theory, PER activity was either dramatically increased (Oe and Oa horizons) or reduced (Bl horizons) in N addition plots (Table 5).
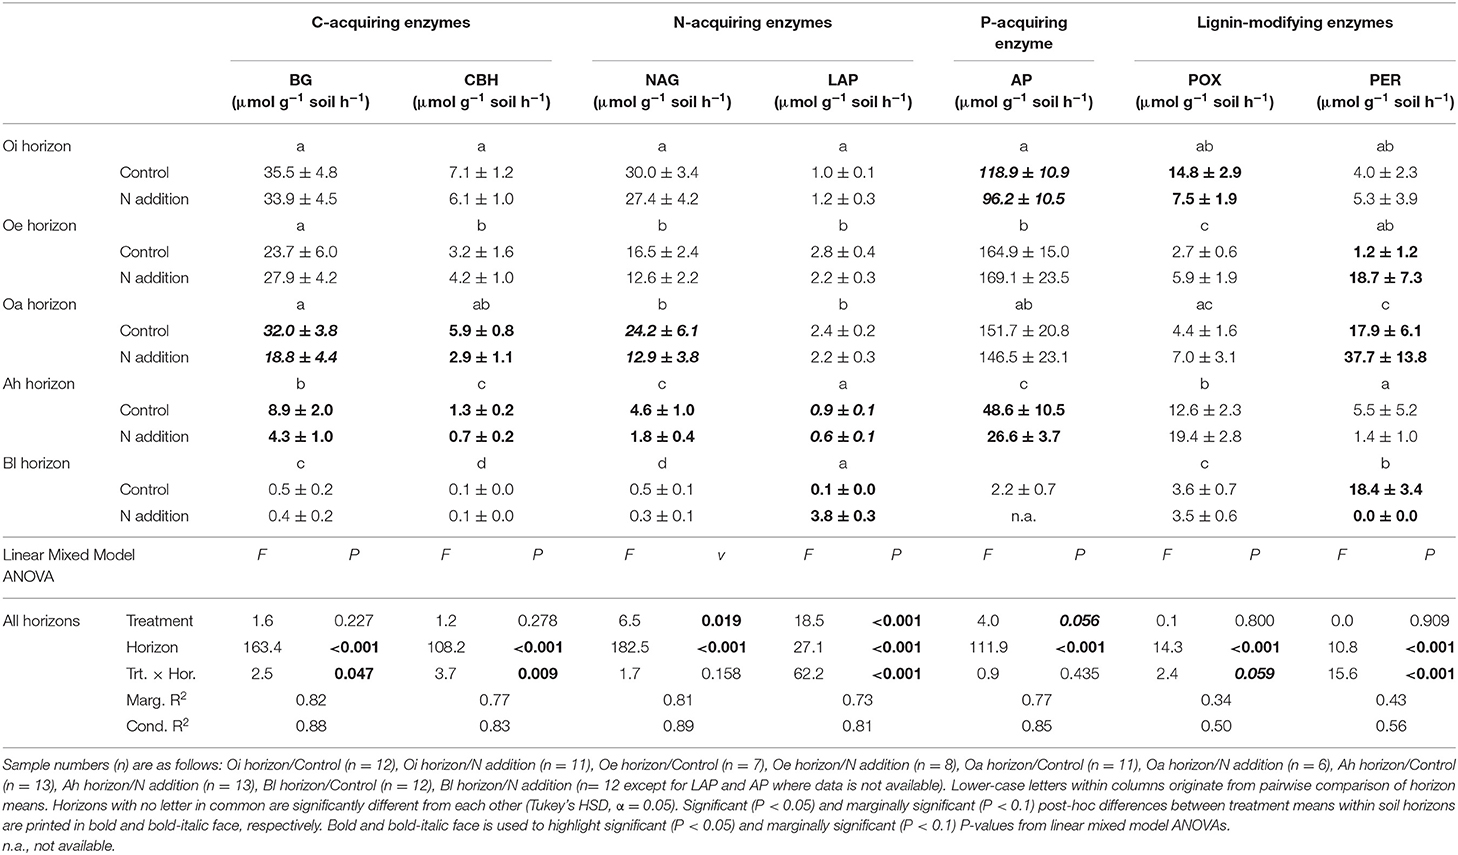
Table 5. Activities of seven soil enzyme classes involved in organic matter decomposition in response to long-term N addition at Alptal (Switzerland).
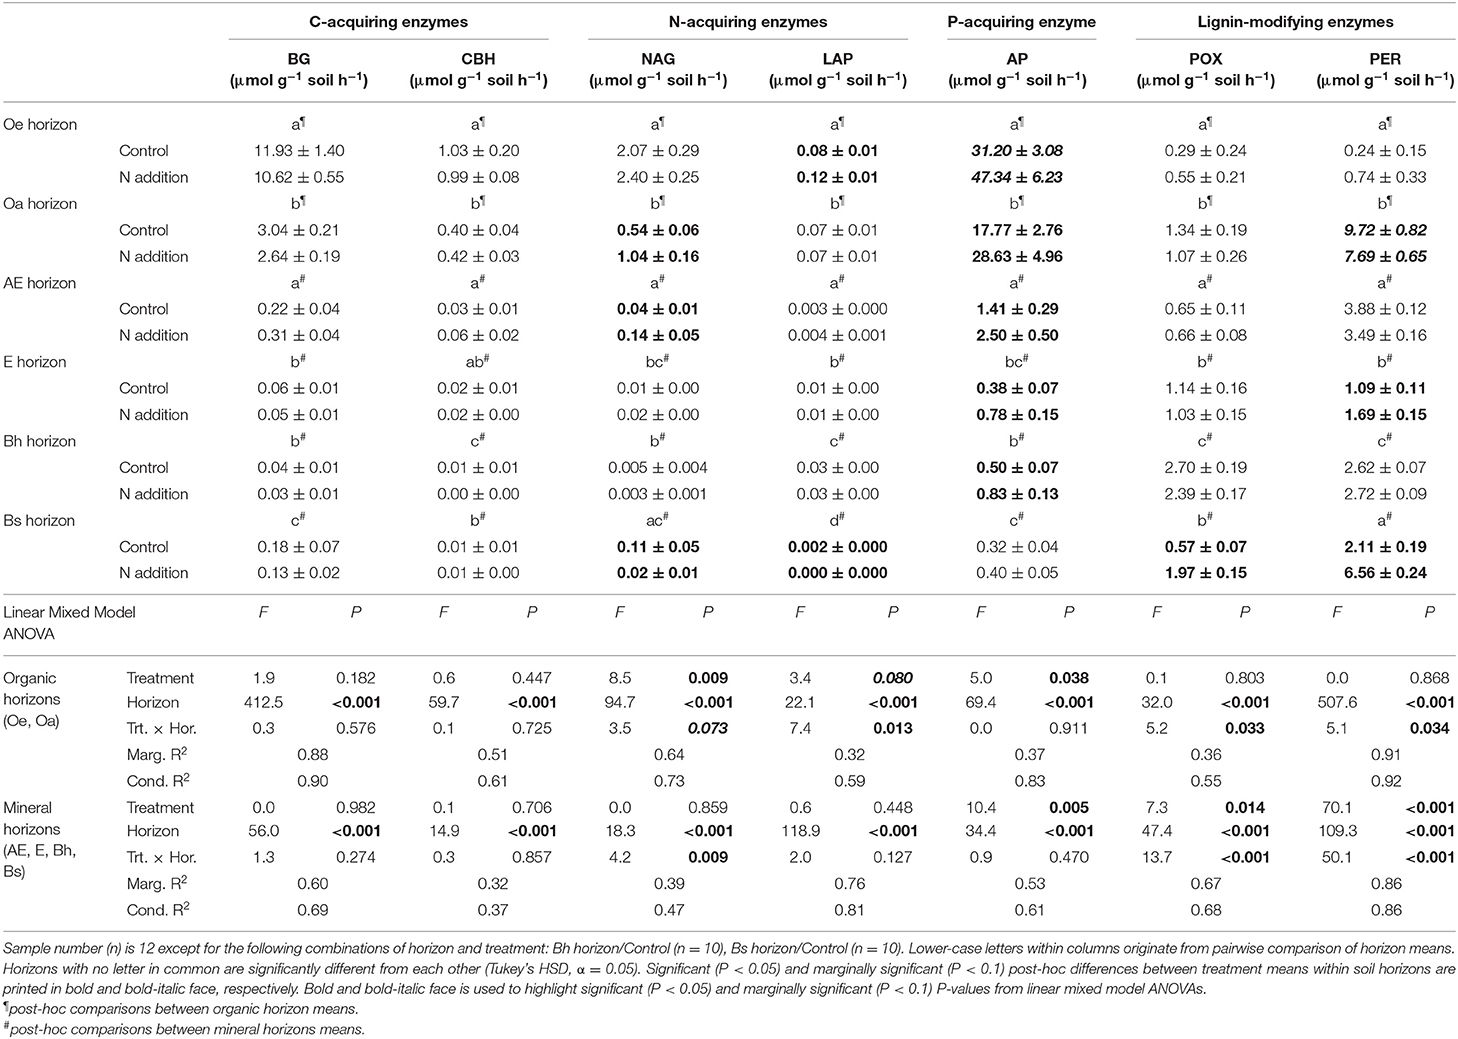
Table 6. Activities of seven soil enzyme classes involved in organic matter decomposition in response to long-term N addition at Klosterhede (Denmark).
At Klosterhede, both enzymes indicative for microbial N-acquisition were enhanced by N addition in organic and mineral topsoil (Oe horizon: LAP, +54%, post-hoc differences in means: P = 0.005, Oa and AE horizon: NAG, +95 and +229%, respectively, post-hoc differences in means: P = 0.001 and P = 0.04, respectively). In contrast, both enzyme activities were reduced by N in the lower mineral horizon Bs (LAP, −81%, post-hoc differences in means: P = 0.03, NAG, −100%, post-hoc differences in means: P = 0.013). The most striking result at Klosterhede was the consistent increase of acid phosphatase across the whole topsoil profile (treatment main effect: P = 0.04, Table 5). As in Alptal, the effects of N on LMEs depended on soil horizon, with a marginal reduction of peroxidase in the Oa horizon (−21%, post-hoc differences in means: P = 0.1) and increases of both phenol oxidase and peroxidase in the mineral horizons E and Bs (Table 6). These patterns also prevailed when enzyme activities were normalized to SOC concentrations (Tables S3, S4).
Discussion
Context-Dependency of Microbial Responses Due to Differences in Soil Type and N Load Between Sites
Long-term (~20 years) N addition to simulate increasing atmospheric N deposition affected several aspects of soil microbial communities in two European temperate forests, but these changes were partially context-dependent. We found that (i) overall microbial biomass (MBC, MBN, and total PLFA) did not respond to added N at both sites, while (ii) changes in microbial community composition were highly context-dependent. However, (iii) changes in fungal abundances and F:B ratios were not related to corresponding changes in LME activities and SOC content. (iv) Responses of soil C-, N-, and P-acquiring enzymes to N addition were also context-dependent and differed between sites and horizons. Taken together, these findings suggest a strong effect of site on the response of soil microbial communities to long-term N addition and therefore highlight that these responses are more complex than previously thought.
The sites differed in two main factors, soil type and experimental N addition, but not in vegetation type (spruce forest). Total cumulative N input including background deposition and experimental N addition was 750 kg N ha−1 at Alptal compared to 1,280 kg N ha−1 at Klosterhede. Increasing N addition rates and cumulative N loads have been shown to trigger stronger responses in soil C dynamics and in microbial community structure and function (e.g., Treseder, 2008; Jian et al., 2016; Yue et al., 2016; Zhou et al., 2017). As low N addition treatments were shown to produce smaller or inverse effects on SOC and MBC than intermediate and high N addition treatments in meta-analyses, the higher cumulative N load at Klosterhede might explain a part of the stronger N effects on microbial community composition and enzyme activities. However, soil types differed more strongly than N addition levels, as N treatments were realized on a nutrient-poor Podzol at Klosterhede and on a nutrient-rich Gleysol at Alptal.
The soils at Alptal (Gleysol) have developed from Flysch bedrock resulting in higher clay and SOC content, higher cation exchange capacity and almost 100% base saturation compared to the sandy, nutrient-poor Podzol at Klosterhede (Table 1, Gundersen, 1998; Schleppi et al., 1998; Forstner et al., 2019). At Alptal, trees responded positively to added N in terms of basal area growth and leaf litterfall, despite a drop in soil pH and indications of deteriorating tree mineral nutrition, except for N. At the same time, N addition has increased the bulk density of the moderately decomposed Oe horizon at Alptal, resulting in the observed increase of SOC pools in the organic soil horizon. The observed decrease in the SOC pool of the Ah horizon was triggered by N-induced decreases in SOC concentrations (Forstner et al., 2019). Signs of kinetic N saturation (sensu Lovett and Goodale, 2011) were much more evident in the nutrient-poor Podzol at Klosterhede, although the site was limited by N historically and still features much higher soil C:N ratios than Alptal (Table 1). The Podzol at Klosterhede is more acidic, has a coarse texture, is 100-fold lower in cation exchange capacity and 4-fold lower in SOC content compared to the Gleysol at Alptal. In the N-treated plots at Klosterhede, trees showed decreasing needle C:N ratios but due to the nutrient poor site conditions, this did not foster tree growth. On the contrary, tree mortality increased, which resulted in needle loss and higher litter inputs to the soil. Hence, the observed increase of C storage in organic soil horizons was attributed to increased litterfall, accompanied by increases in organic horizon thickness and greater Oe horizon turnover. The observed decrease of SOC pool size in the uppermost mineral soil was attributed to reduced layer thickness and decreased bulk density of the AE horizon, possibly as a consequence of accelerated podzolization (Forstner et al., 2019). The strong context dependency of microbial responses to elevated N deposition therefore is likely linked to the lower buffer capacity (lower pH, cation exchange capacity, base saturation, and SOM content) of the Podzol at Klosterhede, rendering microbial communities and vegetation more vulnerable to excessive N loading by atmospheric deposition.
The increase in SOC in organic horizons at both sites is mainly linked to greater plant litter inputs. Organic horizons receive C inputs mainly via litterfall, which increased after N addition at both sites, albeit for different reasons (increased litter production at the Swiss site, but higher litter inputs due to reduced tree vigor and increased tree mortality at the Danish site, Forstner et al., 2019). In contrast, plant C is supplied to mineral horizons (that showed decreasing SOC stocks) by various pathways including root turnover, root exudation, symbiotic mycorrhizal fungi, bioturbation, or dissolved organic carbon (DOC) leaching from the litter layer (Cotrufo et al., 2015). However, fine root biomass in mineral soils was largely unaffected by N addition at Alptal but strongly increased at Klosterhede (Forstner et al., 2019), indicating that other causal pathways triggered the SOC loss in mineral topsoil at both sites, such as for instance reduced ectomycorrhizal abundance (Treseder, 2004) and ectomycorrhizal growth (Klosterhede, −30%; Ginzburg, 2014).
Long-Term N Addition and Soil Microbes: Effects on Biomass and Community Composition
There is growing consensus that added N generally reduces soil microbial biomass (Treseder, 2008; Liu and Greaver, 2010; Lu et al., 2011; Zhou et al., 2017), which in turn drives reductions in decomposition and soil respiration (Janssens et al., 2010; Riggs and Hobbie, 2016). Yet common, this response is not universal (Waldrop et al., 2004a; Keeler et al., 2009; Riggs et al., 2015; Heuck et al., 2018) but contingent on, for example, ecosystem type (Yue et al., 2016), experimental duration (Treseder, 2008), N load (Maaroufi et al., 2019), or sampling year (Gutknecht et al., 2012; Contosta et al., 2015). For instance, in a recent meta-analysis MBC increased under low N loads (<50 kg N ha−1 yr−1, similar levels as applied at both study sites here) but did not respond above that levels (Yue et al., 2016).
The Alptal site had three times more microbial biomass than Klosterhede (Figure 2). We did not observe significant drops in microbial biomass in N-treatment plots at Alptal and Klosterhede, although a tendency toward declines could be observed in some horizons. Viable microbial biomass as represented by total PLFAs (nmol g−1 soil) was also not reduced in either of the sites, confirming the results of the chloroform fumigation extraction method (Tables 3, 4). It therefore appears that overall microbial biomass measured by chloroform fumigation extraction and viable microbial biomass measured by PLFA analysis were both resistant against the physico-chemical changes brought about by added N acting in the form of ion(s) such as decreasing soil pH and increasing inorganic N availability. Clearly, reduced microbial biomass was not responsible for the accumulation of SOC in the organic soil horizons of the two investigated forest sites, but rather increased litter inputs (Forstner et al., 2019) and/or reduced enzymatic decomposition capacities of the microbial communites under N treatment. Changes in the microbial community composition became evident at the microbial group levels, and community changes were most pronounced in Podzols at Klosterhede while little N-driven changes were detectable in Gleysols at Alptal. The most prominent changes were detected in the organic horizons of Klosterhede. In line with current evidence (Janssens et al., 2010; Zak et al., 2011), a decline of fungi was observed (Table 4). This also negatively affected F:B ratios (Figure 4), and the effect was strongest in the Oa horizon (see also Berg et al., 1998; Kellner et al., 2010), where fungal abundance was largest. In contrast to the prevalent theories we found that N addition did not reduce, but marginally increased F:B ratios at Alptal (treatment main effect: P = 0.091, Figure 4A). While N had no effect on multivariate microbial community composition at Alptal, NMDS analysis demonstrated divergent effects of N on microbial community composition in AE and E horizons at Klosterhede, respectively (Figure 3C). This pattern was driven by a decline in the relative abundance of bacterial markers in the AE horizon, whereas fungal markers were reduced in the E horizon (Table 4). Responses of microbial community composition were therefore contingent on soil type and horizon, with little changes in the nutrient-rich soils at Alptal and strongest, but divergent responses in organic and mineral horizons at Klosterhede. The observed microbial community changes therefore did not follow the overall trends established by meta-analysis where in terrestrial non-agricultural ecosystems (incl. 69 temperate forests) N addition caused fungi (−7%) and F:B ratios (−10%) to decline in a strongly N load-dependent manner, while bacteria (+6%), Gram-positive bacteria (+16%), and GP:GN ratios (+11%) increased (Zhou et al., 2017). On the other hand, though similar analyses are not available for microbial community composition, soil type effects were also reported by the meta-analysis by Jian et al. (2016) where N effects on SOC were weaker in nutrient-poor soils (e.g., Oxisols and Spodosols) than in nutrient-rich soils (e.g., Alfisols and Inceptisols).
The Keystone Enzyme Hypothesis at the Plot Scale: Exploring Links Between Fungal Dominance, Lignin-Modifying Enzymes, and Soil Organic C in Response to Added N
The so-called keystone enzyme hypothesis relates N-induced changes in soil C storage to N-induced shifts in LMEs (Chen et al., 2018). At its core, it states that the addition of N suppresses the activities of LMEs, which in turn leads to reduced organic matter decomposition and increased soil C storage (Freeman et al., 2001; Waldrop et al., 2004b; Janssens et al., 2010; Chen et al., 2018). This is thought to be in part due to the negative effects of N on saprotrophic fungi, the main producers of LMEs (Hatakka and Hammel, 2011; Zak et al., 2011; Chen et al., 2018).
In organic horizons, we indeed found a negative relation between LME activities and SOC, supporting the idea that LMEs control SOC concentrations in organic horizons where physical protection of SOM is weaker due to the lack of organic matter-mineral interactions (Figures 5A,B; Prescott, 2010; Averill and Waring, 2018). Though N did have negative impacts on fungi in organic horizons at Klosterhede (Figures 3B, 4C), we did not find significant relationships between fungal dominance and LME activities in organic horizons of both, control and N addition plots (Figure 5C). Although frequently invoked as explanation for the observed reductions in LME activities due to N, the statistical link between fungi and LMEs has rarely been explored directly (Waldrop et al., 2004a; Zak et al., 2011; Frey et al., 2014; Maaroufi et al., 2015). In contrast, recently metagenome analysis showed that N addition increased saprotrophic bacterial genes while saprotrophic fungi were unaltered in forest soils (Freedman et al., 2016). It is therefore unlikely that chronic N addition slowed fungal-mediated decomposition of SOM in organic horizons as predicted by the keystone enzyme hypothesis. SOC pools of Oe horizons, however, did increase with N addition at both sites, which was due to increases in horizon bulk density at Alptal and in horizon thickness at Klosterhede, respectively (Forstner et al., 2019). This suggests that added N, instead of decelerating SOM decomposition in organic layers, increased aboveground litter inputs, which led to larger organic horizon SOC pools and slower organic matter turnover rates at the investigated sites (Forstner et al., 2019). At the same time, SOC concentrations of organic horizons were unaffected by N, in line with findings from the Michigan Gradient Study where added N was found to increase organic horizon mass while SOC concentrations remained unaffected (Pregitzer et al., 2008).
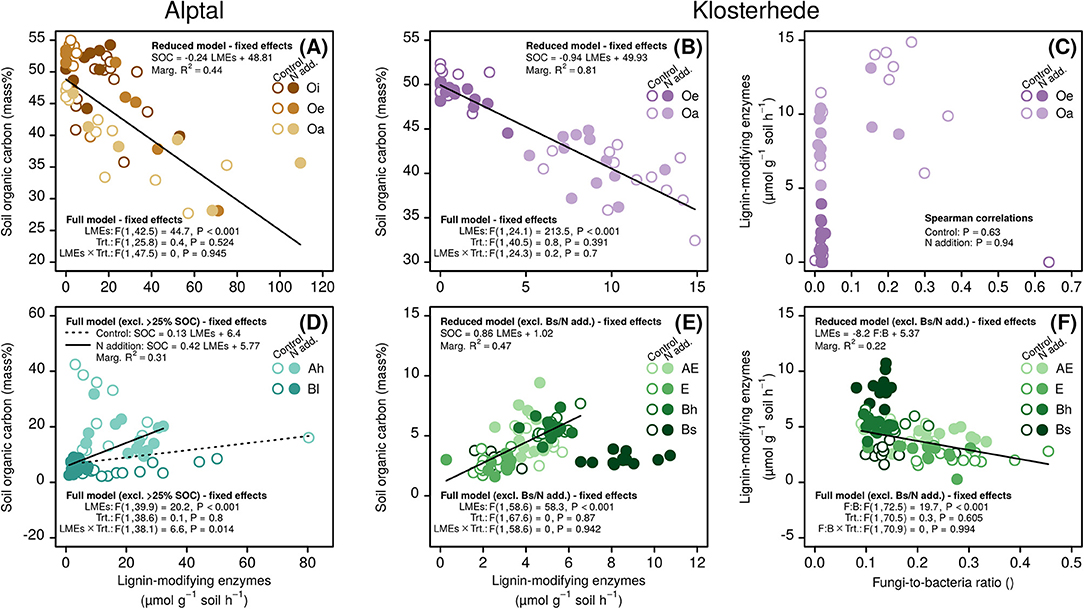
Figure 5. Impact of N addition on relationships between the fungi-to-bacteria ratio, lignin-modifying enzymes and soil organic carbon at Alptal (A,D) and Klosterhede (B,C,E,F). Relationships were assessed separately for organic (A–C) and mineral soil horizons (D–F). Note that it was not possible to relate lignin-modifying enzymes to the fungi-to-bacteria ratio at Alptal due to data unavailability.
The picture was different for mineral soil horizons (Figures 5D–F). Here, LMEs were positively related to SOC across mineral horizons at both sites, which is in direct contrast to the idea that SOC levels are controlled by the activities of LMEs (Figures 5D,E). Added N did interfere with this pattern only at Alptal by strongly reducing LME activities in the Bl horizon and thus further strengthening the positive relationship between LMEs and SOC (Figure 5D). Contrary to the keystone enzyme hypothesis, these positive relationships suggest that LMEs are not an “enzymic latch” (Freeman et al., 2001) on SOC concentrations at the investigated sites, but both variables are more likely controlled by the same drivers. This pattern may be driven by the general positive relationship between SOC and MBC, and larger microbial communities producing more extracellular enzymes. In mineral soils, another obvious candidate is the mineral matrix itself, which has been shown to control SOC storage (Torn et al., 1997; Schmidt et al., 2011; Lehmann and Kleber, 2015) and at the same time directly contributes to (abiotic, apparent) LME activity (Sinsabaugh, 2010; Bach et al., 2013; Schnecker et al., 2015). For Klosterhede, the importance of the mineral matrix might also explain the unexpected increase of LME activities with decreasing fungal dominance (Figure 5F), in addition to the fact that soil bacteria outnumber fungi in mineral soils (Fierer et al., 2003; Stone et al., 2014; Lladó et al., 2017) and are also capable of producing LMEs (Baldrian, 2006; Kellner et al., 2008; Sinsabaugh, 2010). Notwithstanding the exact mechanisms, it is clear that the relation between LMEs and SOC in mineral horizons and the lacking effect of N on this relation both differed from predictions made by the keystone enzyme hypothesis.
Microbial C:N Homeostasis as Affected by Long-Term N Addition
So far we have shown that added N induced site- and horizon-specific responses in microbial community composition and function. At the same time, N did generally not affect overall microbial biomass or links between fungal dominance, LMEs and SOC. Nitrogen-induced changes in community composition and function, however, might feedback on “bulk” microbial physiology when N acts primarily as a nutrient (right-hand side of Figure 1; Sterner and Elser, 2002; Sinsabaugh and Follstad Shah, 2012; Mooshammer et al., 2014). We therefore evaluated if N addition directly altered microbial C:N homeostasis by relating C:N ratios of microbial biomass to bulk soil and labile (extractable) soil C:N ratios as potential resources (Figure 6, Figure S2).
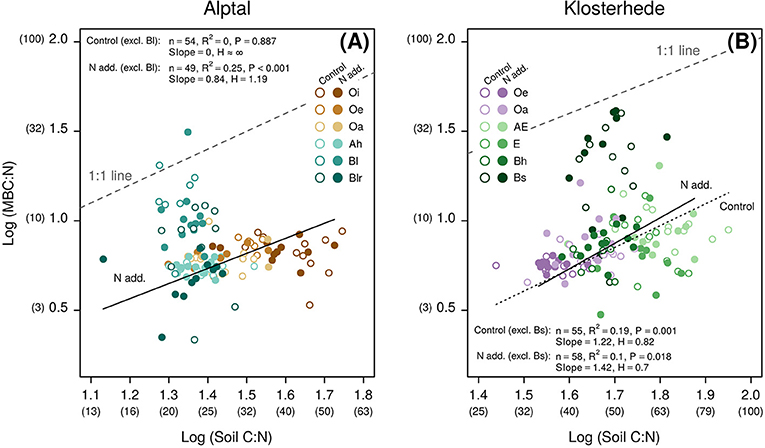
Figure 6. Nitrogen addition alters microbial C:N homeostasis across the topsoil profile (0–30 cm) at Alptal (A) and Klosterhede (B). Degrees of C:N homeostasis were assessed by comparing of slopes from reduced major axis (Type II) regressions (see section Material and Methods for details). Non-transformed values of microbial C:N and soil C:N are given in parentheses below axes labels. Note that samples from Bl and Bs horizons were excluded from analyses. The strength of microbial homeostasis is given by the slope of the log-log relationship of between elemental ratios in resources (x-axes) and consumers (y-axes): Smaller slopes (S) indicate stronger homeostasis and the corresponding regulatory coefficient (H) is larger. Conversely, non-homeostatic relationships are indicated by larger slopes, i.e., smaller regulatory coefficients.
Globally, soil microbes are highly homeostatic for C:N, but there is a large unaccounted variability in soil microbial C:N, which only partly is explained by biome and plant functional types (Xu et al., 2013). Hence, if added N boosted the amount of N available to microbes and C:N imbalances decreased as a result, soil microbes might have adapted their biomass stoichiometry accordingly by adjusting their biomass C:N in a non-homeostatic way (Mooshammer et al., 2014). Microbial C:N ratios per se were mostly resistant to added N at both sites (Figures 2C,F), with the exceptions of B horizons, though litter N and fine root N increased and C:N stoichiometry correspondingly decreased at both sites following N addition (Forstner et al., 2019). At Alptal, soil microbes in control plots were strictly homeostatic with respect to their C:N ratio, as indicated by the slope S indistinguishable from zero and the corresponding regulatory coefficient H approaching infinity [“homeostatic,” arbitrary categories from Persson et al. (2010) as cited by Xue et al. (2019), Figure 6A]. With added N, however, apparent homeostatic regulation weakened at Alptal as S increased to 0.8 and H decreased to 1.2, indicating a “plastic” response of microbial biomass C:N to variable resource C:N (Figure 6A). At Klosterhede, apparent homeostatic regulation was already low and “plastic” in control plots (S = 1.2, H = 0.8) but became even more non-homeostatic in N treated plots (S = 1.4, H = 0.7, Figure 6B).
Though a weakening of community-level C:N homeostatsis might imply a shift from fungal- to bacterial-dominated microbial communities (average fungal C:N ~15, average bacterial C:N ~5; Strickland and Rousk, 2010), we did not find a positive relation between microbial biomass C:N and soil F:B ratios except in organic horizons at Klosterhede (Figure S1).
However, soil C:N ratios only explained 10–25% of the variability in microbial C:N (and extractable OC:TN even less; Figure S2), implying that other mechanisms need to be adopted by soil microbes to cope with changing elemental imbalances beyond responding partially non-homeostatic. This might either be done through changes in the allocation to C- and N-acquiring enzymes to mine for limiting resources (see next chapter) or through adaptations in microbial element use efficiencies. At both sites litter and root N contents increased and the corresponding C:N ratios decreased in N treated plots (Forstner et al., 2019), indicating decreasing elemental imbalances between resources and microbes. The unexplained variability in microbial biomass therefore is most likely linked to increases in microbial carbon use efficiency, which might explain the often observed decrease in heterotrophic respiration in N treated soils, and decreases in microbial N use efficiency, causing less soil N retention but promoting soil N losses (Mooshammer et al., 2014).
Evidence for Microbial P Limitation in Response to Long-Term N Addition
Apart from weakening C:N homeostatic regulation, soil microbes might adapt to N-induced nutrient imbalances by altering enzyme production patterns (Figure 1; Mooshammer et al., 2014; Zechmeister-Boltenstern et al., 2015). Despite considerable variability between individual studies, added N was generally found to increase the activities of C- and P-acquiring enzymes (Marklein and Houlton, 2012; Jian et al., 2016), in accordance to predictions made by resource allocation theory (Sinsabaugh and Moorhead, 1994; Sinsabaugh and Follstad Shah, 2012), while N-acquiring enzymes were non-responsive to N deposition (Jian et al., 2016). Thus, soil microbes appear to evade N-induced C or P limitation by investing in enzymes that mobilize the limiting nutrient from SOM. Based on this assumption, we used enzyme vector analysis to investigate if added N altered the degree of relative microbial C vs. nutrient limitation as well as relative N vs. P limitation (Moorhead et al., 2013, 2016; Bell et al., 2014; Fanin et al., 2016).
This analysis showed that added N had site- and horizon-specific effects on relative microbial C vs. P limitation (Figure 7). Relative limitations of microbial communities at Alptal shifted from C in the uppermost organic horizon to nutrients further down the soil profile in control plots (Figure 7A). Added N amplified relative P limitation in Oa (non-significantly, P = 0.26) and Ah horizons (post-hoc differences in means: P = 0.05, Figure 7B). At Klosterhede, this shift from relative C to P limitation was more pronounced and driven by an absolute increase in acid phosphatase activities across the whole topsoil profile (Figures 7C,D). This profound shift from microbial C to P limitation may reduce long-term soil C sequestration, especially at nutrient-poor sites, in several ways: Plant-microbial competition for available P could limit plant productivity, and thus new organic matter inputs to soil, as indicated by high needle N:P ratios at Klosterhede (Gundersen, 1998). At the same time, microbial mining for P might reduce SOM and thus SOC storage in the long run.
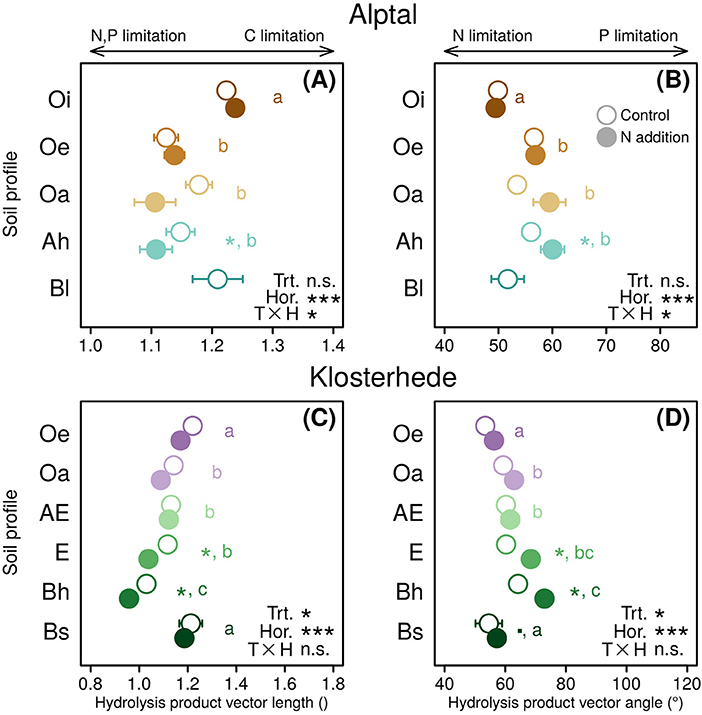
Figure 7. Enzyme-based vector lengths (A,C) and vector angles (B,D) in response to N addition along the topsoil profile (0–30 cm) at Alptal (A,B) and Klosterhede (C,D). Increasing hydrolysis product vector lengths indicate strogner relative C vs. nutrient limitation (A,C). Increasing hydrolysis product vector angles indicate stronger relative N vs. P limitation (B,D). Post-hoc differences between control and N addition treatment within soil horizon are indicated by symbols next to circle pairs (■P < 0.1; *P < 0.05; **P < 0.01; ***P < 0.001). Lower-case letters indicate post-hoc differences between soil horizons across treatments. Means with no letter in common are significantly different (Tukey's HSD, α = 0.05).
Conclusions
In our study we showed that relationships between cause (N addition) and effect (changes in soil microbial community composition and function) are context-dependent. According to previous studies, we expected that the detrimental effects of added reactive N on soil microbial communities would be more pronounced in organic soil horizons, where N would act primarily in form of ions (Figure 1). This hypothesis held true only under specific conditions: i.e., for the Podzol where fungal biomass was reduced, showing that soils with a low cation exchange capacity harbor less resistant microbial communities than nutrient-rich soils. However, total microbial biomass at both sites was remarkably resistant to two decades of chronic N additions. Regarding our second hypothesis, we found that soil microbial communities in N treated plots altered aspects of their physiology, as a result of N acting as a microbial nutrient. While added N weakened microbial C:N homeostasis relative P limitation increased, with potential negative consequences for long-term SOC storage. In many parts of Europe including Denmark and Switzerland, atmospheric N deposition (especially nitrate) is on the decline due to rigorous political measures. In other parts of the world such as Eastern Asia, the opposite is true. In this setting, it is problematic to rely on the assumed positive effect of atmospheric N-inputs to forests on soil carbon storage due to reduced microbial decomposition. As we have shown, this phenomenon cannot be generalized and may be accompanied by detrimental effects on plant growth, with a postulated accelerating feedback effect on climate change.
Data Availability Statement
The raw data supporting the conclusions of this manuscript will be made available by the authors, without undue reservation, to any qualified researcher.
Author Contributions
SZ-B, MT, and MG conceived the study with contributions from SF, KK, PS, PG, and WW. SF conducted soil sampling and laboratory analyses, analyzed the data, and drafted the manuscript. VW, SS, SM, and MT helped with soil sampling and conducted laboratory analyses. KK supervised laboratory analyses. PS and PG maintained the N addition experiments and supervised soil sampling. SZ-B, SF, and KK discussed the results and revised the manuscript with contributions from all authors. Final revisions were lead by WW.
Funding
This study was funded by the Fonds zur Förderung der wissenschaftlichen Forschung (Austrian Science Fund, FWF) within the INFOSOM project (Impact of N fertilization on soil organic matter in forest soils, P 25438). PG was supported by the Aage V. Jensen Naturfond.
Conflict of Interest
The authors declare that the research was conducted in the absence of any commercial or financial relationships that could be construed as a potential conflict of interest.
Acknowledgments
Open access funding provided by Austrian Science Fund (FWF). We thank Ewald Brauner, Karin Hackl, Astrid Hobel, Angelika Hromka, Elisabeth Kopecky, and Axel Mentler for their support with laboratory work. The valuable contributions of Editor Dr. NF and two reviewers are gratefully acknowledged.
Supplementary Material
The Supplementary Material for this article can be found online at: https://www.frontiersin.org/articles/10.3389/ffgc.2019.00073/full#supplementary-material
Table S1. Relative abundance of individual PLFA biomarkers in response to long-term N addition at Alptal (Switzerland).
Table S2. Relative abundance of individual PLFA biomarkers in response to long-term N addition at Klosterhede (Denmark).
Table S3. Activities of seven soil enzyme classes involved in organic matter decomposition in response to long-term N addition at Alptal (Switzerland) normalized to soil organic carbon (SOC) concentrations.
Table S4. Activities of seven soil enzyme classes involved in organic matter decomposition in response to long-term N addition at Klosterhede (Denmark) normalized to soil organic carbon (SOC) concentrations.
Figure S1. Relation between the fungi-to-bacterial (F:B) ratios and microbial biomass C:N at Alptal (A) and Klosterhede (B,C) across organic (B) and mineral horizons (A,C). Microbial biomass C:N is unrelated to F:B ratios across mineral horizons, while the weak, positive relation across organic horizons is affected by N.
Figure S2. Soil microbial communities are strictly C:N homeostatic with respect labile (extractable) resources across the topsoil profile at Alptal (A) and Klosterhede (B). See Figure 6 for details on interpretation.
References
Allison, S. D., LeBauer, D. S., Ofrecio, M. R., Reyes, R., Ta, A.-M., and Tran, T. M. (2009). Low levels of nitrogen addition stimulate decomposition by boreal forest fungi. Soil Biol. Biochem. 41, 293–302. doi: 10.1016/j.soilbio.2008.10.032
Averill, C., and Waring, B. (2018). Nitrogen limitation of decomposition and decay: how can it occur? Glob. Chang. Biol. 24, 1417–1427. doi: 10.1111/gcb.13980
Bach, C. E., Warnock, D. D., Van Horn, D. J., Weintraub, M. N., Sinsabaugh, R. L., Allison, S. D., et al. (2013). Measuring phenol oxidase and peroxidase activities with pyrogallol, l-DOPA, and ABTS: effect of assay conditions and soil type. Soil Biol. Biochem. 67, 183–191. doi: 10.1016/j.soilbio.2013.08.022
Baldrian, P. (2006). Fungal laccases – occurrence and properties. FEMS Microbiol. Rev. 30, 215–242. doi: 10.1111/j.1574-4976.2005.00010.x
Bárta, J., Šlajsová, P., Tahovská, K., Picek, T., and Šantručková, H. (2014). Different temperature sensitivity and kinetics of soil enzymes indicate seasonal shifts in C, N and P nutrient stoichiometry in acid forest soil. Biogeochemistry 117, 525–537. doi: 10.1007/s10533-013-9898-1
Barton, K. (2019). MuMIn: Multi-Model Inference. Available online at: https://CRAN.R-project.org/package=MuMIn
BassiriRad, H. (2015). Consequences of atmospheric nitrogen deposition in terrestrial ecosystems: old questions, new perspectives. Oecologia 177, 1–3. doi: 10.1007/s00442-014-3116-2
Bates, D., Mächler, M., Bolker, B., and Walker, S. (2015). Fitting linear mixed-effects models using lme4. J. Stat. Softw. 67, 1–48. doi: 10.18637/jss.v067.i01
Bell, C., Carrillo, Y., Boot, C. M., Rocca, J. D., Pendall, E., and Wallenstein, M. D. (2014). Rhizosphere stoichiometry: are C : N : P ratios of plants, soils, and enzymes conserved at the plant species-level? New Phytol. 201, 505–517. doi: 10.1111/nph.12531
Berg, B., Erhagen, B., Johansson, M.-B., Nilsson, M., Stendahl, J., Trum, F., et al. (2015). Manganese in the litter fall-forest floor continuum of boreal and temperate pine and spruce forest ecosystems – A review. For. Ecol. Manage. 358, 248–260. doi: 10.1016/j.foreco.2015.09.021
Berg, B., and Matzner, E. (1997). Effect of N deposition on decomposition of plant litter and soil organic matter in forest systems. Environ. Rev. 5, 1–25. doi: 10.1139/a96-017
Berg, M. P., Kniese, J. P., and Verhoef, H. A. (1998). Dynamics and stratification of bacteria and fungi in the organic layers of a Scots pine forest soil. Biol. Fertil. Soils 26, 313–322.
Blake, G. R., Steinhardt, G. C., Pombal, X. P., Muñoz, J. C. N., Cortizas, A. M., Arnold, R. W., et al. (2008). “Podzols,” in Encyclopedia of Soil Science, ed W. Chesworth (Dordrecht: Springer), 580–582. doi: 10.1007/978-1-4020-3995-9_450
Carreiro, M. M., Sinsabaugh, R. L., Repert, D. A., and Parkhurst, D. F. (2000). Microbial enzyme shifts explain litter decay responses to simulated nitrogen deposition. Ecology 81, 2359–2365. doi: 10.2307/177459
Chen, J., Luo, Y., van Groenigen, K. J., Hungate, B. A., Cao, J., Zhou, X., et al. (2018). A keystone microbial enzyme for nitrogen control of soil carbon storage. Sci. Adv. 4:eaaq1689. doi: 10.1126/sciadv.aaq1689
Contosta, A. R., Frey, S. D., and Cooper, A. B. (2015). Soil microbial communities vary as much over time as with chronic warming and nitrogen additions. Soil Biol. Biochem. 88, 19–24. doi: 10.1016/j.soilbio.2015.04.013
Cotrufo, M. F., Soong, J. L., Horton, A. J., Campbell, E. E., Haddix, M. L., Wall, D. H., et al. (2015). Formation of soil organic matter via biochemical and physical pathways of litter mass loss. Nat. Geosci. 8, 776–779. doi: 10.1038/ngeo2520
Crutzen, P. J. (2006). “The ‘Anthropocene,”' in Earth System Science in the Anthropocene, eds. E. Ehlers and T. Krafft (Berlin; Heidelberg: Springer), 13–18. doi: 10.1007/3-540-26590-2_3
De Vries, W., Du, E., and Butterbach-Bahl, K. (2014). Short and long-term impacts of nitrogen deposition on carbon sequestration by forest ecosystems. Curr. Opin. Environ. Sustain. 9–10, 90–104. doi: 10.1016/j.cosust.2014.09.001
Dixon, R. K., Brown, S., Houghton, R. A., Solomon, A. M., Trexler, M. C., and Wisniewsik, J. (1994). Carbon pools and flux of global forest ecosystems. Science 263, 185–190.
Driessen, P. M., (ed.). (2001). Lecture Notes on the Major Soils of the World. Rome: Food and Agriculture Organization of the United Nations
Edwards, I. P., Zak, D. R., Kellner, H., Eisenlord, S. D., and Pregitzer, K. S. (2011). Simulated atmospheric N deposition alters fungal community composition and suppresses ligninolytic gene expression in a northern hardwood forest. PLoS ONE 6:e20421. doi: 10.1371/journal.pone.0020421
Fanin, N., Moorhead, D., and Bertrand, I. (2016). Eco-enzymatic stoichiometry and enzymatic vectors reveal differential C, N, P dynamics in decaying litter along a land-use gradient. Biogeochemistry 129, 21–36. doi: 10.1007/s10533-016-0217-5
Fernández-Martínez, M., Vicca, S., Janssens, I. A., Sardans, J., Luyssaert, S., Campioli, M., et al. (2014). Nutrient availability as the key regulator of global forest carbon balance. Nat. Clim. Change 4, 471–476. doi: 10.1038/nclimate2177
Fierer, N., Schimel, J. P., and Holden, P. A. (2003). Variations in microbial community composition through two soil depth profiles. Soil Biol. Biochem. 35, 167–176. doi: 10.1016/S0038-0717(02)00251-1
Fog, K. (1988). The effect of added nitrogen on the rate of decomposition of organic matter. Biol. Rev. 63, 433–462. doi: 10.1111/j.1469-185X.1988.tb00725.x
Forstner, S. J., Wechselberger, V., Müller, S., Keibinger, K. M., Díaz-Pinés, E., Wanek, W., et al. (2019). Vertical redistribution of soil organic carbon pools after twenty years of nitrogen addition in two temperate coniferous forests. Ecosystems 22, 379–400. doi: 10.1007/s10021-018-0275-8
Fox, J., and Weisberg, S. (2011). An {R} Companion to Applied Regression. Thousand Oaks, CA: Sage. Available online at: http://socserv.socsci.mcmaster.ca/jfox/Books/Companion
Freedman, Z. B., Upchurch, R. A., Zak, D. R., and Cline, L. C. (2016). Anthropogenic N deposition slows decay by favoring bacterial metabolism: insights from metagenomic analyses. Front. Microbiol. 7:259. doi: 10.3389/fmicb.2016.00259
Freeman, C., Ostle, N., and Kang, H. (2001). An enzymic'latch'on a global carbon store. Nature 409:149. doi: 10.1038/35051650
Frey, S. D., Knorr, M., Parrent, J. L., and Simpson, R. T. (2004). Chronic nitrogen enrichment affects the structure and function of the soil microbial community in temperate hardwood and pine forests. For. Ecol. Manage. 196, 159–171. doi: 10.1016/j.foreco.2004.03.018
Frey, S. D., Ollinger, S., Nadelhoffer, K., Bowden, R., Brzostek, E., Burton, A., et al. (2014). Chronic nitrogen additions suppress decomposition and sequester soil carbon in temperate forests. Biogeochemistry 121, 305–316. doi: 10.1007/s10533-014-0004-0
German, D. P., Weintraub, M. N., Grandy, A. S., Lauber, C. L., Rinkes, Z. L., and Allison, S. D. (2011). Optimization of hydrolytic and oxidative enzyme methods for ecosystem studies. Soil Biol. Biochem. 43, 1387–1397. doi: 10.1016/j.soilbio.2011.03.017
Ginzburg, S. O. (2014). Nitrogen Deposition Effects on Soil Carbon Dynamics in Temperate Forests (Dissertation). University of Copenhagen, Copenhagen, Denmark.
Gundale, M. J., From, F., Bach, L. H., and Nordin, A. (2014). Anthropogenic nitrogen deposition in boreal forests has a minor impact on the global carbon cycle. Glob. Change Biol. 20, 276–286. doi: 10.1111/gcb.12422
Gundersen, P. (1998). Effects of enhanced nitrogen deposition in a spruce forest at Klosterhede, Denmark, examined by moderate NH4NO3 addition. For. Ecol. Manage. 101, 251–268.
Gundersen, P., and Rasmussen, L. (1995). Nitrogen mobility in a nitrogen limited forest at Klosterhede, Denmark, examined by NH4NO3 addition. For. Ecol. Manage. 71, 75–88.
Gutknecht, J. L. M., Field, C. B., and Balser, T. C. (2012). Microbial communities and their responses to simulated global change fluctuate greatly over multiple years. Glob. Change Biol. 18, 2256–2269. doi: 10.1111/j.1365-2486.2012.02686.x
Hagedorn, F., Schleppi, P., Bucher, J., and Flühler, H. (2001). Retention and leaching of elevated N deposition in a forest ecosystem with Gleysols. Water Air Soil Pollut. 129, 119–142. doi: 10.1023/A:1010397232239
Hatakka, A., and Hammel, K. E. (2011). “Fungal biodegradation of lignocelluloses,” in Industrial Applications the Mycota, ed M. Hofrichter (Berlin; Heidelberg: Springer), 319–340. doi: 10.1007/978-3-642-11458-8_15
Heuck, C., Smolka, G., Whalen, E. D., Frey, S., Gundersen, P., Moldan, F., et al. (2018). Effects of long-term nitrogen addition on phosphorus cycling in organic soil horizons of temperate forests. Biogeochemistry 141, 167–181. doi: 10.1007/s10533-018-0511-5
Högberg, P., Fan, H., Quist, M., Binkley, D., and Tamm, C. O. (2006). Tree growth and soil acidification in response to 30 years of experimental nitrogen loading on boreal forest. Glob. Change Biol. 12, 489–499. doi: 10.1111/j.1365-2486.2006.01102.x
Janssens, I. A., Dieleman, W., Luyssaert, S., Subke, J.-A., Reichstein, M., Ceulemans, R., et al. (2010). Reduction of forest soil respiration in response to nitrogen deposition. Nat. Geosci. 3, 315–322. doi: 10.1038/ngeo844
Jian, S., Li, J., Chen, J., Wang, G., Mayes, M. A., Dzantor, K. E., et al. (2016). Soil extracellular enzyme activities, soil carbon and nitrogen storage under nitrogen fertilization: a meta-analysis. Soil Biol. Biochem. 101, 32–43. doi: 10.1016/j.soilbio.2016.07.003
Jonard, M., Fürst, A., Verstraeten, A., Thimonier, A., Timmermann, V., Potočić, N., et al. (2015). Tree mineral nutrition is deteriorating in Europe. Glob. Change Biol. 21, 418–430. doi: 10.1111/gcb.12657
Kaiser, C., Koranda, M., Kitzler, B., Fuchslueger, L., Schnecker, J., Schweiger, P., et al. (2010). Belowground carbon allocation by trees drives seasonal patterns of extracellular enzyme activities by altering microbial community composition in a beech forest soil. New Phytol. 187, 843–858. doi: 10.1111/j.1469-8137.2010.03321.x
Kanakidou, M., Myriokefalitakis, S., Daskalakis, N., Fanourgakis, G., Nenes, A., Baker, A. R., et al. (2016). Past, present, and future atmospheric nitrogen deposition. J. Atmos. Sci. 73, 2039–2047. doi: 10.1175/JAS-D-15-0278.1
Keeler, B. L., Hobbie, S. E., and Kellogg, L. E. (2009). Effects of long-term nitrogen addition on microbial enzyme activity in eight forested and grassland sites: implications for litter and soil organic matter decomposition. Ecosystems 12, 1–15. doi: 10.1007/s10021-008-9199-z
Kellner, H., Luis, P., Zimdars, B., Kiesel, B., and Buscot, F. (2008). Diversity of bacterial laccase-like multicopper oxidase genes in forest and grassland Cambisol soil samples. Soil Biol. Biochem. 40, 638–648. doi: 10.1016/j.soilbio.2007.09.013
Kellner, H., Zak, D. R., and Vandenbol, M. (2010). Correction: fungi unearthed: transcripts encoding lignocellulolytic and chitinolytic enzymes in forest soil. PLoS ONE 5:10.1371/annotation/84b7b537-84f6-49e6-ac7c-9a2f0ad3f862. doi: 10.1371/annotation/84b7b537-84f6-49e6-ac7c-9a2f0ad3f862
Kohl, L., Laganière, J., Edwards, K. A., Billings, S. A., Morrill, P. L., Van Biesen, G., et al. (2015). Distinct fungal and bacterial δ13C signatures as potential drivers of increasing δ13C of soil organic matter with depth. Biogeochemistry 124, 13–26. doi: 10.1007/s10533-015-0107-2
Krause, K., Niklaus, P. A., and Schleppi, P. (2013). Soil-atmosphere fluxes of the greenhouse gases CO2, CH4 and N2O in a mountain spruce forest subjected to long-term N addition and to tree girdling. Agric. For. Meteorol. 181, 61–68. doi: 10.1016/j.agrformet.2013.07.007
Kuhn, M., Wing, J., Weston, S., Williams, A., Keefer, C., Engelhardt, A., et al. (2019). caret: Classification and Regression Training. Available online at: https://CRAN.R-project.org/package=caret
Lal, R. (2005). Forest soils and carbon sequestration. For. Ecol. Manage. 220, 242–258. doi: 10.1016/j.foreco.2005.08.015
Leckie, S. E. (2005). Methods of microbial community profiling and their application to forest soils. For. Ecol. Manage. 220, 88–106. doi: 10.1016/j.foreco.2005.08.007
Lehmann, J., and Kleber, M. (2015). The contentious nature of soil organic matter. Nature 528, 60–68. doi: 10.1038/nature16069
Lenth, R. (2019). emmeans: Estimated Marginal Means, aka Least-Squares Means. Available online at: https://CRAN.R-project.org/package=emmeans
Leupold, W. (1942). Neue Beobachtungen zur Gliederung der Flyschbildungen der Alpen zwischen Reuss und Rhein. Eclog. Geol. Helv. 35, 247–291.
Litton, C. M., Raich, J. W., and Ryan, M. G. (2007). Carbon allocation in forest ecosystems. Glob. Change Biol. 13, 2089–2109. doi: 10.1111/j.1365-2486.2007.01420.x
Liu, L., and Greaver, T. L. (2010). A global perspective on belowground carbon dynamics under nitrogen enrichment: belowground C dynamics under N enrichment. Ecol. Lett. 13, 819–828. doi: 10.1111/j.1461-0248.2010.01482.x
Lladó, S., López-Mondéjar, R., and Baldrian, P. (2017). Forest soil bacteria: diversity, involvement in ecosystem processes, and response to global change. Microbiol. Mol. Biol. Rev. 81:e00063–e00016. doi: 10.1128/MMBR.00063-16
Lovett, G. M., and Goodale, C. L. (2011). A new conceptual model of nitrogen saturation based on experimental nitrogen addition to an oak forest. Ecosystems 14, 615–631. doi: 10.1007/s10021-011-9432-z
Lu, M., Zhou, X., Luo, Y., Yang, Y., Fang, C., Chen, J., et al. (2011). Minor stimulation of soil carbon storage by nitrogen addition: a meta-analysis. Agric. Ecosyst. Environ. 140, 234–244. doi: 10.1016/j.agee.2010.12.010
Lumley, T. (2017). leaps: Regression Subset Selection. Available online at: https://CRAN.R-project.org/package=leaps
Maaroufi, N. I., Nordin, A., Hasselquist, N. J., Bach, L. H., Palmqvist, K., and Gundale, M. J. (2015). Anthropogenic nitrogen deposition enhances carbon sequestration in boreal soils. Glob. Change Biol. 21, 3169–3180. doi: 10.1111/gcb.12904
Maaroufi, N. I., Nordin, A., Palmqvist, K., and Gundale, M. J. (2017). Nitrogen enrichment impacts on boreal litter decomposition are driven by changes in soil microbiota rather than litter quality. Sci. Rep. 7:4083. doi: 10.1038/s41598-017-04523-w
Maaroufi, N. I., Nordin, A., Palmqvist, K., Hasselquist, N. J., Forsmark, B., Rosenstock, N. P., et al. (2019). Anthropogenic nitrogen enrichment enhances soil carbon accumulation by impacting saprotrophs rather than ectomycorrhizal fungal activity. Glob. Change Biol. 25, 2900–2914. doi: 10.1111/gcb.14722
Marklein, A. R., and Houlton, B. Z. (2012). Nitrogen inputs accelerate phosphorus cycling rates across a wide variety of terrestrial ecosystems. New Phytol. 193, 696–704. doi: 10.1111/j.1469-8137.2011.03967.x
Mohn, J., Schürmann, A., Hagedorn, F., Schleppi, P., and Bachofen, R. (2000). Increased rates of denitrification in nitrogen-treated forest soils. For. Ecol. Manage. 137, 113–119. doi: 10.1016/S0378-1127(99)00320-5
Moldan, F., and Wright, R. F. (2011). Nitrogen leaching and acidification during 19 years of NH4NO3 additions to a coniferous-forested catchment at Gårdsjön, Sweden (NITREX). Environ. Poll. 159, 431–440. doi: 10.1016/j.envpol.2010.10.025
Moorhead, D. L., Rinkes, Z. L., Sinsabaugh, R. L., and Weintraub, M. N. (2013). Dynamic relationships between microbial biomass, respiration, inorganic nutrients and enzyme activities: informing enzyme-based decomposition models. Front. Microbiol. 4:223. doi: 10.3389/fmicb.2013.00223
Moorhead, D. L., Sinsabaugh, R. L., Hill, B. H., and Weintraub, M. N. (2016). Vector analysis of ecoenzyme activities reveal constraints on coupled C, N and P dynamics. Soil Biol. Biochem. 93, 1–7. doi: 10.1016/j.soilbio.2015.10.019
Mooshammer, M., Hofhansl, F., Frank, A. H., Wanek, W., Hämmerle, I., Leitner, S., et al. (2017). Decoupling of microbial carbon, nitrogen, and phosphorus cycling in response to extreme temperature events. Sci. Adv. 3:e1602781. doi: 10.1126/sciadv.1602781
Mooshammer, M., Wanek, W., Zechmeister-Boltenstern, S., and Richter, A. (2014). Stoichiometric imbalances between terrestrial decomposer communities and their resources: mechanisms and implications of microbial adaptations to their resources. Front. Microbiol. 5:22. doi: 10.3389/fmicb.2014.00022
Morrison, E. W., Frey, S. D., Sadowsky, J. J., van Diepen, L. T. A., Thomas, W. K., and Pringle, A. (2016). Chronic nitrogen additions fundamentally restructure the soil fungal community in a temperate forest. Fungal Ecol. 23, 48–57. doi: 10.1016/j.funeco.2016.05.011
Morrison, E. W., Pringle, A., van Diepen, L. T. A., and Frey, S. D. (2018). Simulated nitrogen deposition favors stress-tolerant fungi with low potential for decomposition. Soil Biol. Biochem. 125, 75–85. doi: 10.1016/j.soilbio.2018.06.027
Nakagawa, S., and Schielzeth, H. (2013). A general and simple method for obtaining R2 from generalized linear mixed-effects models. Methods Ecol. Evol. 4, 133–142. doi: 10.1111/j.2041-210x.2012.00261.x
Norby, R. J., Warren, J. M., Iversen, C. M., Medlyn, B. E., and McMurtrie, R. E. (2010). CO2 enhancement of forest productivity constrained by limited nitrogen availability. Proc. Natl. Acad. Sci. U.S.A. 107, 19368–19373. doi: 10.1073/pnas.1006463107
Oksanen, J., Blanchet, F. G., Friendly, M., Kindt, R., Legendre, P., McGlinn, D., et al. (2019). vegan: Community Ecology Package. Available online at: https://CRAN.R-project.org/package=vegan
O'Sullivan, M., Spracklen, D. V., Batterman, S. A., Arnold, S. R., Gloor, M., and Buermann, W. (2019). Have synergies between nitrogen deposition and atmospheric CO2 driven the recent enhancement of the terrestrial carbon sink? Global Biogeochem. Cycles 33, 163–180. doi: 10.1029/2018GB005922
Peñuelas, J., Poulter, B., Sardans, J., Ciais, P., van der Velde, M., Bopp, L., et al. (2013). Human-induced nitrogen–phosphorus imbalances alter natural and managed ecosystems across the globe. Nat. Commun. 4:3934. doi: 10.1038/ncomms3934
Peñuelas, J., Sardans, J., Rivas-ubach, A., and Janssens, I. A. (2012). The human-induced imbalance between C, N and P in Earth's life system. Glob. Change Biol. 18, 3–6. doi: 10.1111/j.1365-2486.2011.02568.x
Persson, J., Fink, P., Goto, A., Hood, J. M., Jonas, J., and Kato, S. (2010). To be or not to be what you eat: regulation of stoichiometric homeostasis among autotrophs and heterotrophs. Oikos, 119, 741–751. doi: 10.1111/j.1600-0706.2009.18545.x
Pregitzer, K. S., Burton, A. J., Zak, D. R., and Talhelm, A. F. (2008). Simulated chronic nitrogen deposition increases carbon storage in Northern Temperate forests. Glob. Change Biol. 14, 142–153. doi: 10.1111/j.1365-2486.2007.01465.x
Prescott, C. E. (2010). Litter decomposition: what controls it and how can we alter it to sequester more carbon in forest soils? Biogeochemistry 101, 133–149. doi: 10.1007/s10533-010-9439-0
R Development Core Team (2008). R: A Language and Environment for Statistical Computing. Vienna: R Foundation for Statistical Computing
Riggs, C. E., and Hobbie, S. E. (2016). Mechanisms driving the soil organic matter decomposition response to nitrogen enrichment in grassland soils. Soil Biol. Biochem. 99, 54–65. doi: 10.1016/j.soilbio.2016.04.023
Riggs, C. E., Hobbie, S. E., Bach, E. M., Hofmockel, K. S., and Kazanski, C. E. (2015). Nitrogen addition changes grassland soil organic matter decomposition. Biogeochemistry 125, 203–219. doi: 10.1007/s10533-015-0123-2
Rockström, J., Steffen, W., Noone, K., Persson, Å., Chapin, F. S., Lambin, E. F., et al. (2009). A safe operating space for humanity. Nature 461, 472–475. doi: 10.1038/461472a
Ruess, L., and Chamberlain, P. M. (2010). The fat that matters: soil food web analysis using fatty acids and their carbon stable isotope signature. Soil Biol. Biochem. 42, 1898–1910. doi: 10.1016/j.soilbio.2010.07.020
Saiya-Cork, K. R., Sinsabaugh, R. L., and Zak, D. R. (2002). The effects of long term nitrogen deposition on extracellular enzyme activity in an Acer saccharum forest soil. Soil Biol. Biochem. 34, 1309–1315. doi: 10.1016/S0038-0717(02)00074-3
Schleppi, P., Curtaz, F., and Krause, K. (2017). Nitrate leaching from a sub-alpine coniferous forest subjected to experimentally increased N deposition for 20 years, and effects of tree girdling and felling. Biogeochemistry 134, 319–335. doi: 10.1007/s10533-017-0364-3
Schleppi, P., Muller, N., Feyen, H., Papritz, A., Bucher, J. B., and Flühler, H. (1998). Nitrogen budgets of two small experimental forested catchments at Alptal, Switzerland. For. Ecol. Manage. 101, 177–185.
Schmidt, M. W. I., Torn, M. S., Abiven, S., Dittmar, T., Guggenberger, G., Janssens, I. A., et al. (2011). Persistence of soil organic matter as an ecosystem property. Nature 478, 49–56. doi: 10.1038/nature10386
Schnecker, J., Wild, B., Takriti, M., Eloy Alves, R. J., Gentsch, N., Gittel, A., et al. (2015). Microbial community composition shapes enzyme patterns in topsoil and subsoil horizons along a latitudinal transect in Western Siberia. Soil Biol. Biochem. 83, 106–115. doi: 10.1016/j.soilbio.2015.01.016
Simpson, D., Andersson, C., Christensen, J. H., Engardt, M., Geels, C., Nyiri, A., et al. (2014). Impacts of climate and emission changes on nitrogen deposition in Europe: a multi-model study. Atmos. Chem. Phys. 14, 6995–7017. doi: 10.5194/acp-14-6995-2014
Singmann, H., Bolker, B., Westfall, J., and Aust, F. (2019). afex: Analysis of Factorial Experiments. Available online at: https://CRAN.R-project.org/package=afex
Sinsabaugh, R. L. (2010). Phenol oxidase, peroxidase and organic matter dynamics of soil. Soil Biol. Biochem. 42, 391–404. doi: 10.1016/j.soilbio.2009.10.014
Sinsabaugh, R. L., and Follstad Shah, J. J. (2012). Ecoenzymatic stoichiometry and ecological theory. Annu. Rev. Ecol. Evol. Syst. 43, 313–343. doi: 10.1146/annurev-ecolsys-071112-124414
Sinsabaugh, R. L., and Moorhead, D. L. (1994). Ressource allocation to extracellular enzyme production: a model for nitrogen and phosphorus control of litter decomposition. Soil Biol. Biochem. 26, 1305–13011.
Sterner, R. W., and Elser, J. J. (2002). Ecological Stoichiometry: the Biology of Elements From Molecules to the Biosphere. Princeton, NJ: Princeton University Press.
Stone, M. M., DeForest, J. L., and Plante, A. F. (2014). Changes in extracellular enzyme activity and microbial community structure with soil depth at the Luquillo Critical Zone Observatory. Soil Biol. Biochem. 75, 237–247. doi: 10.1016/j.soilbio.2014.04.017
Strickland, M. S., and Rousk, J. (2010). Considering fungal:bacterial dominance in soils – Methods, controls, and ecosystem implications. Soil Biol. Biochem. 42, 1385–1395. doi: 10.1016/j.soilbio.2010.05.007
Talbot, J. M., and Treseder, K. K. (2012). Interactions among lignin, cellulose, and nitrogen drive litter chemistry–decay relationships. Ecology 93, 345–354. doi: 10.1890/11-0843.1
Thomas, R. Q., Canham, C. D., Weathers, K. C., and Goodale, C. L. (2010). Increased tree carbon storage in response to nitrogen deposition in the US. Nat. Geosci.3, 13–17. doi: 10.1038/ngeo721
Tian, D., and Niu, S. (2015). A global analysis of soil acidification caused by nitrogen addition. Environ. Res. Lett. 10:024019. doi: 10.1088/1748-9326/10/2/024019
Torn, M. S., Trumbore, S. E., Chadwick, O. A., Vitousek, P. M., and Hendricks, D. M. (1997). Mineral control of soil organic carbon storage and turnover. Nature 389, 170–173. doi: 10.1038/38260
Townsend, A. R., Braswell, B. H., Holland, E. A., and Penner, J. E. (1996). Spatial and temporal patterns in terrestrial carbon storage due to deposition of fossil fuel nitrogen. Ecol. Appl. 6, 806–814. doi: 10.2307/2269486
Treseder, K. K. (2004). A meta-analysis of mycorrhizal responses to nitrogen, phosphorus, and atmospheric CO2 in field studies. New Phytol. 164, 347–355. doi: 10.1111/j.1469-8137.2004.01159.x
Treseder, K. K. (2008). Nitrogen additions and microbial biomass: a meta-analysis of ecosystem studies. Ecol. Lett. 11, 1111–1120. doi: 10.1111/j.1461-0248.2008.01230.x
Turlapati, S. A., Minocha, R., Bhiravarasa, P. S., Tisa, L. S., Thomas, W. K., and Minocha, S. C. (2013). Chronic N-amended soils exhibit an altered bacterial community structure in Harvard Forest, MA, USA. FEMS Microbiol. Ecol. 83, 478–493. doi: 10.1111/1574-6941.12009
van Diepen, L. T. A., Frey, S. D., Landis, E. A., Morrison, E. W., and Pringle, A. (2016). Fungi exposed to chronic nitrogen enrichment are less able to decay leaf litter. Ecology 98, 5–11. doi: 10.1002/ecy.1635
van Diepen, L. T. A., Lilleskov, E. A., Pregitzer, K. S., and Miller, R. M. (2007). Decline of arbuscular mycorrhizal fungi in northern hardwood forests exposed to chronic nitrogen additions. New Phytol. 176, 175–183. doi: 10.1111/j.1469-8137.2007.02150.x
Vance, E. D., Brookes, P. C., and Jenkinson, D. S. (1987). An extraction method for measuring soil microbial biomass C. Soil Biol. Biochem. 19, 703–707. doi: 10.1016/0038-0717(87)90052-6
Vestal, J. R., and White, D. C. (1989). Lipid analysis in microbial ecology: quantitative approaches to the study of microbial communities. Bioscience 39:535.
Vet, R., Artz, R. S., Carou, S., Shaw, M., Ro, C.-U., Aas, W., et al. (2014). A global assessment of precipitation chemistry and deposition of sulfur, nitrogen, sea salt, base cations, organic acids, acidity and pH, and phosphorus. Atmos. Environ. 93, 3–100. doi: 10.1016/j.atmosenv.2013.10.060
Vicca, S., Luyssaert, S., Peñuelas, J., Campioli, M., Chapin, F. S., Ciais, P., et al. (2012). Fertile forests produce biomass more efficiently: forests' biomass production efficiency. Ecol. Lett. 15, 520–526. doi: 10.1111/j.1461-0248.2012.01775.x
Vitousek, P. M., Aber, J. D., Howarth, R. W., Likens, G. E., Matson, P. A., Schindler, D. W., et al. (1997). Human alteration of the global nitrogen cycle: sources and consequences. Ecol. Appl. 7, 737–750.
Waldrop, M. P., Zak, D. R., and Sinsabaugh, R. L. (2004a). Microbial community response to nitrogen deposition in northern forest ecosystems. Soil Biol. Biochem. 36, 1443–1451. doi: 10.1016/j.soilbio.2004.04.023
Waldrop, M. P., Zak, D. R., Sinsabaugh, R. L., Gallo, M., and Lauber, C. (2004b). Nitrogen deposition modifies soil carbon storage through changes in microbial enzymatic activity. Ecol. Appl. 14, 1172–1177. doi: 10.1890/03-5120
Wang, R., Goll, D., Balkanski, Y., Hauglustaine, D., Boucher, O., Ciais, P., et al. (2017). Global forest carbon uptake due to nitrogen and phosphorus deposition from 1850 to 2100. Glob. Chang. Biol. 23, 4854–4872. doi: 10.1111/gcb.13766
Warton, D. I., Duursma, R. A., Falster, D. S., and Taskinen, S. (2012). smatr 3- an R package for estimation and inference about allometric lines: the smatr 3 - an R package. Methods Ecol. Evol. 3, 257–259. doi: 10.1111/j.2041-210X.2011.00153.x
Warton, D. I., Wright, I. J., Falster, D. S., and Westoby, M. (2006). Bivariate line-fitting methods for allometry. Biol. Rev. 81:259. doi: 10.1017/S1464793106007007
Whalen, E. D., Smith, R. G., Grandy, A. S., and Frey, S. D. (2018). Manganese limitation as a mechanism for reduced decomposition in soils under atmospheric nitrogen deposition. Soil Biol. Biochem. 127, 252–263. doi: 10.1016/j.soilbio.2018.09.025
Willers, C., Jansen van Rensburg, P. j, and Claassens, S. (2015). Microbial signature lipid biomarker analysis – an approach that is still preferred, even amid various method modifications. J. Appl. Microbiol. 118, 1251–1263. doi: 10.1111/jam.12798
Xia, M., Talhelm, A. F., and Pregitzer, K. S. (2018). Long-term simulated atmospheric nitrogen deposition alters leaf and fine root decomposition. Ecosystems 21, 1–14. doi: 10.1007/s10021-017-0130-3
Xu, G.-L., Schleppi, P., Li, M.-H., and Fu, S.-L. (2009). Negative responses of Collembola in a forest soil (Alptal, Switzerland) under experimentally increased N deposition. Environ. Pollut. 157, 2030–2036. doi: 10.1016/j.envpol.2009.02.026
Xu, X., Thornton, P. E., and Post, W. M. (2013). A global analysis of soil microbial biomass carbon, nitrogen and phosphorus in terrestrial ecosystems: global soil microbial biomass C, N and P. Glob. Ecol. Biogeogr. 22, 737–749. doi: 10.1111/geb.12029
Xue, H., Lan, X., Liang, H., and Zhang, Q. (2019). Characteristics and environmental factors of stoichiometric homeostasis of soil microbial biomass carbon, nitrogen and phosphorus in China. Sustainability 11:2804. doi: 10.3390/su11102804
Yue, K., Peng, Y., Peng, C., Yang, W., Peng, X., and Wu, F. (2016). Stimulation of terrestrial ecosystem carbon storage by nitrogen addition: a meta-analysis. Sci. Rep. 6:19895. doi: 10.1038/srep19895
Zak, D. R., Pregitzer, K. S., Burton, A. J., Edwards, I. P., and Kellner, H. (2011). Microbial responses to a changing environment: implications for the future functioning of terrestrial ecosystems. Fungal Ecol. 4, 386–395. doi: 10.1016/j.funeco.2011.04.001
Zechmeister-Boltenstern, S., Keiblinger, K. M., Mooshammer, M., Peñuelas, J., Richter, A., Sardans, J., et al. (2015). The application of ecological stoichiometry to plant–microbial–soil organic matter transformations. Ecol. Monogr. 85, 133–155. doi: 10.1890/14-0777.1
Keywords: ecological stoichiometry, forest fertilization, nitrogen saturation, Norway spruce, phosphorus limitation, soil carbon, soil enzymes, soil organic matter decomposition
Citation: Forstner SJ, Wechselberger V, Stecher S, Müller S, Keiblinger KM, Wanek W, Schleppi P, Gundersen P, Tatzber M, Gerzabek MH and Zechmeister-Boltenstern S (2019) Resistant Soil Microbial Communities Show Signs of Increasing Phosphorus Limitation in Two Temperate Forests After Long-Term Nitrogen Addition. Front. For. Glob. Change 2:73. doi: 10.3389/ffgc.2019.00073
Received: 30 July 2019; Accepted: 30 October 2019;
Published: 06 December 2019.
Edited by:
Nicolas Fanin, INRA Centre Bordeaux-Aquitaine, FranceReviewed by:
Felipe Bastida, Spanish National Research Council, SpainNadia Maaroufi, Swedish University of Agricultural Sciences, Sweden
Copyright © 2019 Forstner, Wechselberger, Stecher, Müller, Keiblinger, Wanek, Schleppi, Gundersen, Tatzber, Gerzabek and Zechmeister-Boltenstern. This is an open-access article distributed under the terms of the Creative Commons Attribution License (CC BY). The use, distribution or reproduction in other forums is permitted, provided the original author(s) and the copyright owner(s) are credited and that the original publication in this journal is cited, in accordance with accepted academic practice. No use, distribution or reproduction is permitted which does not comply with these terms.
*Correspondence: Stefan J. Forstner, c3RlZmFuLmZvcnN0bmVyQGJva3UuYWMuYXQ=