 Timothy Bryant
 Kristen Waring
 Andrew Sánchez Meador
 John B. Bradford
- 1School of Forestry, Northern Arizona University, Flagstaff, AZ, United States
- 2USDA Forest Service, Portland, OR, United States
- 3Southwest Biological Science Center, US Geological Survey, Flagstaff, AZ, United States
The concept of ecological resilience is an invaluable tool to assess the risk of state transitions and predict the impact of management on an ecosystem's response to future disturbances. However, resilience is difficult to quantify and the factors contributing to resilience are often unknown in systems subject to multiple disturbances. Here, we develop and demonstrate a framework to assess the potential of ponderosa pine and dry mixed conifer forests to be resilient to future disturbance (recover as the same forest type within a managerially significant timeframe) by combining indicators of short-term resilience (ability to withstand disturbance) to fire, insect, and drought disturbances using data from the Rio Tusas-Lower San Antonio landscape in northern New Mexico. The dry mixed conifer forests displayed an average resilience score of 4.54, while ponderosa pine forests had an average score of 3.45 (total possible of nine points) Stand density index was the most important driver of the overall score in the dry mixed conifer type. In the ponderosa pine type, overall basal area was the strongest driver of the overall score. These indicators have the greatest impact on the resilience score and provide the most effective targets for management to increase the possibility of resilience in these forest types. We applied the model in both forest types by comparing individual stands to an “ideal” score for a stand that is within the historic range of variation (HRV) of forest structure for each forest type and confirmed that stands outside of HRV had a low possibility of resilience and stands that had received restoration-based treatments were more likely to be resilient. Our results provide evidence that the changes to forest structure and species composition that have occurred since the onset of fire exclusion have degraded the potential of these forest types to be resilient to future fire, insect, and drought-related disturbances. By modifying disturbances and resilience indicator thresholds this model can be applied to assess resilience to other disturbances within these forest types and across various regions and ecosystem types.
Introduction
The concept of ecological resilience has been variously defined (Moser et al., 2019), but generally describes a natural system's ability to experience disturbance and re-organize to essentially the same structure and function (Holling, 1973). Lack of resilience can allow conversion to alternative states when a disturbance pushes these systems beyond a threshold in their capacity to self-organize (Gunderson, 2000; Scheffer and Carpenter, 2003). Society depends on provisioning, regulating, and cultural services provided by forests, which may be lost or modified as changes to disturbance regimes and forest structure drive these systems past “tipping points” into alternative ecological states (Millennium Ecosystem Assessment, 2005; Adams, 2013; Turner et al., 2013).
Related to resilience, resistance is the influence of structure and composition on the severity of disturbance (DeRose and Long, 2014) and is often addressed separately (Holling, 1973; DeRose and Long, 2014). Given increasing variability of disturbances (Millar and Stephenson, 2015) and potential shifts in species' ranges (Rehfeldt et al., 2006), we suggest a combined usage of these terms: a forest is more likely to recover as the same forest type following disturbance (resilience) if it has characteristics that limit the severity of the disturbance (resistance). Resistance in this context is short-term resilience and implies minimal changes to stand structure, including species composition.
To effectively inform forest management, resilience must be contextualized in terms of the system and the disturbance type in question (Carpenter et al., 2001). Furthermore, resilience must be evaluated across an ecologically and managerially relevant timeframe (i.e., resilience of what, to what, and in what timeframe). In this study, we have chosen to evaluate current resilience of southwestern ponderosa pine and dry mixed conifer forests to fire, insects, and drought. To accomplish this, we developed a flexible framework that may be adapted and applied to other forested systems. Using this model, land managers or other users can identify common disturbances for a given forest type, quantify short-term resilience to each threat using easily obtained forest metrics, and assign potential long-term resilience using an index. Selected indicators include both forest structural attributes and static abiotic characteristics; the combined use will result in a more useful framework that allows for both-stand scale resilience assessment and landscape-scale treatment prioritization.
Ponderosa pine and dry mixed conifer are two common forest types of the southwestern US, defined here as Arizona, New Mexico, southwest Colorado, and southern Utah (Prior-Magee et al., 2007; Vankat, 2013). In the southwestern United States, ponderosa pine (Pinus ponderosa) forests were historically characterized by a frequent, low severity fire regime with mean return intervals of 3–14 years, while dry mixed conifer (sensu Romme et al., 2009) forests historically supported a slightly less frequent, mixed severity fire regime, with mean return intervals of 9–33 years (Fulé et al., 2003, 2009; Brown and Wu, 2005; Heinlein et al., 2005; Huffman et al., 2015). This pattern of disturbance was disrupted across the Southwest due to unregulated grazing, historic logging practices and active fire suppression, which has led to shifts in species composition, increases in tree density, decreased presence of large trees, and high fuel loads (Covington and Moore, 1994; Swetnam and Baisan, 1996; Moore et al., 2004; Fulé et al., 2009; Sánchez Meador et al., 2009; Rodman et al., 2016). These structural and compositional changes have led to increased concern regarding the lack of resilience in these forests, concerns that are amplified by climate change projections of increasing aridity (Seager and Vecchi, 2010; Cook and Seager, 2013) and associated predictions of increasingly severe fire, insect, and drought-related disturbances (Weed et al., 2013; Clark et al., 2016). Restoration-based management is being implemented over large areas of the Southwest with the goal of limiting the effects of past management actions and increasing the possibility of resilience in forests (Buford et al., 2015; USDA, 2015a, 2019). Measuring the effect of management for restoration objectives on potential long-term resilience is difficult due to uncertainty surrounding the underlying mechanisms of resilience and methods of distinguishing tipping points from gradual change (Reyer et al., 2015). Land managers, who are tasked with securing a steady flow of ecological services from forests, would benefit from a quantitative method of assessing potential long-term resilience before a disturbance occurs to identify and prioritize areas at risk and allocate limited resources (Angeler and Allen, 2016).
To exemplify how the framework can be applied, we assessed short-term resilience to three disturbance categories that play important roles in, and constitute large threats to, southwestern ponderosa pine and dry mixed conifer forests: fire, insects, and drought. Past studies have used retrospective approaches to measure resilience to disturbances by quantifying large tree survivorship, establishment of non-native plants, and changes in species dominance (Savage and Mast, 2005; Waltz et al., 2014). We characterize current (short-term) resilience where possible, but assess forest type changes 35–40 years in the future. Resilience to mountain pine beetle (Dendroctonus ponderosae) outbreak has been measured by changes in species dominance before and after the disturbance (Hood et al., 2016). Multiple studies have shown the effect of stand density on resilience to drought and climatic stress (D'Amato et al., 2013; Magruder et al., 2013; Thomas and Waring, 2015; Bottero et al., 2017). To our knowledge, no previous work has combined indicators of short-term resilience (resistance) to multiple disturbances to assess the possibility of a stand or landscape being resilient to a suite of disturbances before an event has occurred.
Our objective was to create and demonstrate the application of a framework combining indicators of short-term resilience and potential resilience that managers could use to identify areas most in need of treatment before a catastrophic disturbance occurs. Examining resilience to fire, insects, and drought in a northern New Mexico landscape comprised of southwestern ponderosa pine and dry mixed conifer forests, we asked: (1) Based upon readily obtainable quantitative metrics, what are the patterns of resilience to fire, insects and drought among stands in this landscape? (2) How might management affect the estimated resilience in these forests? (3) How do restoration treatments influence forest resilience?
Methods
Data Sources and Location
We assessed resilience within the ~55,000 ha Rio Tusas-Lower San Antonio Landscape (hereafter RTLSA), Tres Piedras Ranger District, Carson National Forest in New Mexico, USA (Figure 1). Data were collected between 1985 and 2015 following the guidelines established by the USDA Forest Service Region 3 Common Stand Exam Field Guide (USDA, 2015b), and provided by the USDA Forest Service. The Common Stand Exam protocol includes recording all trees by species and diameter at breast height, with subsamples collected of tree heights, crown ratios (length of crown relative to length of tree bole), ages and 10-years radial increment.
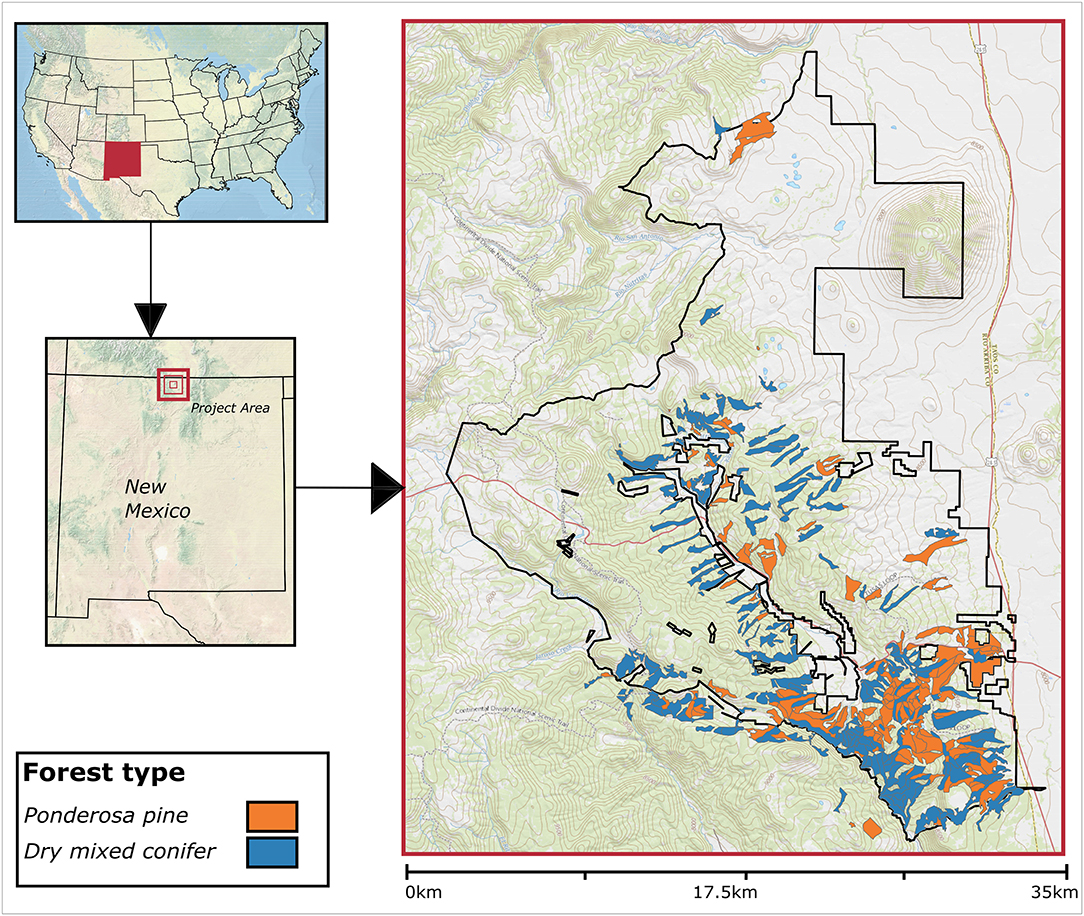
Figure 1. The Rio Tusas-Lower San Antonio Landscape in Northern New Mexico with project area boundary outlined. Shaded polygons represent sampled stands and forest types overlaid on a digital elevation model (DEM).
Elevation in the RTLSA ranges from ~2,400 to 3,000 m. Annual precipitation averages 353 mm, with the majority occurring between May and October, and temperature ranges from −14.6 to 26.6° C (January minimum and July maximum, respectively) (Western Regional Climate Center, 2016). Soils in the RTLSA are derived from mixed alluvium and colluvium with metamorphic, igneous, and sedimentary parent materials (Natural Resources Conservation Service, 2016). Site indices, metrics of site productivity based on the size and age of representative trees (Avery and Burkhart, 2002), calculated for ponderosa pine (for the ponderosa pine forest type) (Minor, 1964) and Douglas-fir (Pseudotsuga menziesii; Edminster and Jump, 1976) (for the dry mixed conifer forest type) range from 11 to 30 m with base age of 100 years.
Forest Types
Species composition on these sites includes ponderosa pine, Douglas-fir, white fir (Abies concolor), quaking aspen (Populus tremuloides), Gambel oak (Quercus gambelii), oneseed juniper (Juniperus monosperma), Utah juniper (Juniperus osteosperma), Rocky Mountain juniper (Juniperus scopulorum), two-needle piñon (Pinus edulis), blue spruce (Picea pungens), and Engelmann spruce (Picea engelmannii). For purposes of this study, the ponderosa pine and dry mixed conifer forest types were defined by the percent basal area of ponderosa pine, excluding that of Gambel oak (sensu Higgins et al., 2015). The ponderosa pine forest type was defined as having ≥90% ponderosa pine by basal area and dry mixed conifer as having 40–90% ponderosa pine by basal area. By this definition, pine-oak stands were included in the ponderosa pine forest type. During analysis, stands that no longer met the definition of the current forest type were classified as having a forest type conversion. Within the RTLSA study area there were 153 (4,212 ha) ponderosa pine type stands and 274 (6,386 ha) dry mixed conifer type stands.
Forest Vegetation Simulator
We used the Central Rockies variant of the Forest Vegetation Simulator (FVS), to predict tree growth, stand structures, and disturbance response in these stands. The Forest Vegetation Simulator is a deterministic individual-tree, distance-independent growth-and-yield simulation model used by public and private land managers, as well as researchers, to summarize stand conditions and simulate the effects of management alternatives (Dixon, 2015). We began this study by populating FVS with the stand exam data to grow all stands forward to the common starting year of 2015. We then summarized species composition to select stands fitting the definition of each forest type for inclusion in the study. Parameters used to initialize FVS across all model scenarios can be found in Supplementary Tables 1, 2. FVS output was assessed in 2015 for all indicators (described below) except for the fire disturbance forest type change indicator (assessed 35 years after fire) and the no disturbance scenario forest type change (assessed 40 years in the future).
No Disturbance Scenario
In order to compare our forest type change results, particularly with our fire disturbance indicator, we modeled the landscape, starting in 2015, under a no disturbance scenario, and evaluated forest type change in each stand at the end of the 40-years time period. This provides an effective comparator and baseline for evaluating relative changes due to disturbance and provides some protection from model nuances when interpreting results. Regeneration was input periodically using the same values applied in the no action scenario of the Silviculture Specialists' Report for the Rio Tusas Landscape Planning Area (Bryant et al., 2016) (Supplementary Table 3).
Indicators
Forest structural attributes and site factors were selected from the literature as indicators of potential short-term resilience to each disturbance (fire, insects, and drought). We chose indicators that can be routinely measured in the field and/or modeled with FVS and for which a threshold level, at which the indicator contributes to potential disturbance severity, therefore decreasing the possibility of resilience, could be determined (Table 1). Further, we selected indicators that we felt were most familiar to managers and chose different indicators for each disturbance type. The following sections briefly discuss methods relevant to each indicator in order of the disturbances listed in Table 1. For additional information see Supplemental Indicator Information.
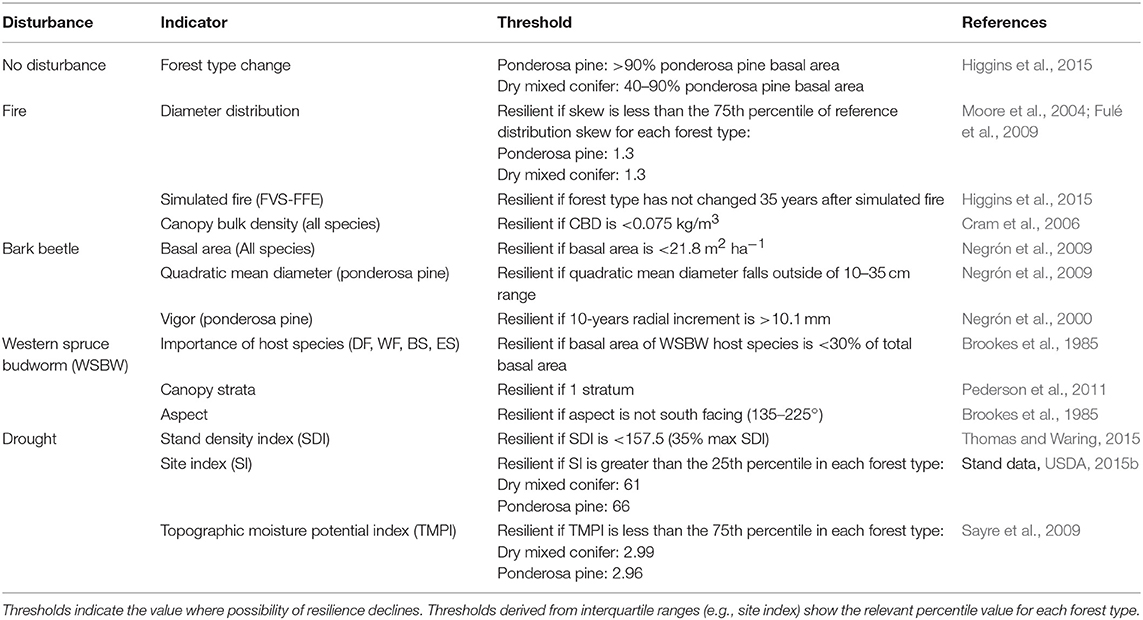
Table 1. Indicators of potential resilience and thresholds for each of the four disturbance types.
Fire Resilience Indicators
For metrics of potential resilience to high severity fire in ponderosa pine and dry mixed conifer forests, we used the skew of diameter distributions, predicted forest type change following a simulated fire, and canopy bulk density (CBD). Abundant small diameter trees in a stand can act as ladder fuels, providing vertical fuel continuity and increasing the likelihood of torching and severe fire effects (Agee and Skinner, 2005). In this study, stands with diameter distribution skew equal to or less than the 75th percentile of skew on historical plots, were considered to be more resistant to crown fire and therefore more likely to be resilient to high-severity fire. This value was used as it provides a suitable compromise between penalizing closed-canopy stands with high amounts of ladder fuels and rewarding the desired, uneven-aged composition, while recognizing that some variability does occur and that highly positive skewness (i.e., many, many small trees) represents conditions prone to high-severity wildfire. As a direct assessment of each stand's possibility of maintaining the same forest type after a severe fire, we used the Fire and Fuels Extension to FVS to simulate a fire and re-evaluate forest type 35 years post-fire (FVS-FFE; Rebain, 2015); this time period was selected as long enough for regeneration to occur (Mast et al., 1999). Stands falling into the same forest type as in 2015, based on percent basal area of ponderosa pine, were considered more likely to be resilient to a severe wildfire. For additional information about model parameters refer to Supplementary Tables 1, 2. Canopy bulk density (CBD) is a stand-level ratio of mass to volume for canopy fuels that is used to determine the rate of spread required to sustain an active crown fire. As CBD increases, lower rates of spread are required to maintain an active crown fire, which will cause high mortality and increase fire severity (Graham et al., 1999; Cram et al., 2006). We considered stands in the project area with CBD <0.075 kg/m3 to be resistant to crown fire and therefore more likely to be resilient to a wildfire of any type (Cram et al., 2006).
Insect Resilience Indicators
Ponderosa pine and dry mixed conifer forests face threats from different insects; potential resilience was evaluated separately for each forest type. Based on the hectares affected across the Southwest in 2014 (USDA, 2014), potential resilience to bark beetles and western spruce budworm were evaluated in the ponderosa pine and dry mixed conifer types, respectively. While native defoliators other than western spruce budworm impact ponderosa pine [e.g., Pandora moth (Coloradia pandora)] and bark beetles impact individual species in the dry mixed conifer forests, based on the literature and the authors' experience in these forest types, we believe bark beetles are a greater threat to the ponderosa pine forest type and western spruce budworm is a greater damaging agent on average, in the dry mixed conifer forest type.
Bark beetles (ponderosa pine forest type)
Southwestern ponderosa pine hosts eight bark beetle species (USDA, 2014) in the genus Ips and Dendroctonus. We evaluated potential resilience to bark beetles in the ponderosa pine forest type as indicated by the density of all tree species, the quadratic mean diameter (QMD), and stand-level radial growth increment (Table 1). Stand density has been shown to be positively correlated with bark beetle mortality in southwestern ponderosa pine forests (Negrón et al., 2009). We considered stands having a total basal area for all tree species below a threshold of 21.8 m2 ha−1 (Negrón et al., 2009) to be below the stand density requirement to support an outbreak size population and therefore more likely to show resilience by recovering to the same forest type if affected by bark beetles. This basal area threshold corresponds to the mean post-outbreak density, including all species, in ponderosa pine stands. From 2001 to 2004, bark beetle mortality caused by Ips spp. across four Arizona forests was primarily in the 10–25 cm diameter classes Negrón et al. (2009). We considered stands with a QMD for ponderosa pine outside of this range likely to experience lower ponderosa pine mortality during an outbreak and more likely to show resilience following the disturbance. While stands with irregular structure may not be as well-represented by QMD, stands with QMD <10 cm are comprised primarily of small diameter trees that are typically not at high risk for bark beetle mortality. Similarly, stands with QMD >25 cm will be dominated by large trees that should be more able to withstand attack through the induced defense system and resin production. Vigor has been linked to trees' ability to produce resin and defend against bark beetle attack (Christiansen et al., 1987). We considered stands with modeled 10-years radial growth increment for ponderosa pine >10.1 mm to be likely to have lower mortality rates during a beetle outbreak and more likely to show resilience by maintaining the same forest type following the disturbance.
Western spruce budworm (dry mixed conifer forest type)
Western spruce budworm (Choristoneura freemani; hereafter WSBW) affects more hectares of southwestern mixed conifer than any other forest insect, primarily in northern New Mexico (USDA, 2014). We evaluated potential resilience to WSBW in dry mixed conifer stands as indicated by percent basal area of host tree species, the number of canopy strata in a stand, and the mean aspect of the stand (Table 1).
Western spruce budworm host species present in the study area include Douglas-fir, white fir, blue spruce, and Engelmann spruce. Stands with >30% basal area of host species have elevated susceptibility to defoliation if a WSBW population is present (Brookes et al., 1985). Stands with host basal area <30% of total were considered at lower risk for a severe or continuous outbreak and thus more likely to be resilient. Western spruce budworm larvae spread vertically through canopies and sites with multiple strata, canopy layers defined by different height and/or age classes or species groups, are more likely to have a severe outbreak (Pederson et al., 2011). Stands with more than 1 stratum were considered more conducive to WSBW spread if an outbreak occurred and therefore less likely to be resilient.
Stands with south-facing aspects are more susceptible to high severity WSBW outbreaks (Brookes et al., 1985) and stands were considered more likely to be resilient if aspect falls outside the range 135–225°. See Supplementary Material for additional details about how aspect was estimated for each stand polygon.
Drought Resilience Indicators
We evaluated potential short-term resilience to drought as indicated by stand density index (SDI), site index, and topographic moisture potential index (TMPI) (Table 1). Stand density index is a measure of competition in forest stands based on the average diameter and number of stems in an area (Reineke, 1933; Shaw, 2006). Stands with lower levels of tree competition for resources have been shown to have increased resistance and resilience to drought, as quantified by diameter growth response (Thomas and Waring, 2015; Bottero et al., 2017). For both ponderosa pine and dry mixed conifer forest types, we used a maximum SDI of 450, which corresponds to ponderosa pine (Long and Shaw, 2005). We used FVS to calculate the SDI of each stand using the summation method (Shaw, 2000) and considered stands with SDI >35% max SDI (157.5) to be less likely to be resilient to drought (Erickson and Waring, 2014; Thomas and Waring, 2015). Site index is an indicator of productivity based on the height and age of representative trees (Avery and Burkhart, 2002); tree stress from drought is likely to be greater on lower productivity sites whereas higher productivity sites will be more likely to recruit new trees and maintain the pre-disturbance forest type. Site indices for the study area were calculated from ponderosa pine (Minor, 1964) and Douglas-fir (Edminster and Jump, 1976) site trees. Stands were considered more likely to be resilient to drought if site index was greater than the 25th percentile value within the same forest type. We took the effects of site topography on drought severity into account by using the topographic moisture potential index (TMPI) to estimate the potential of a site to retain moisture (Sayre et al., 2009). Topographic moisture potential index is a 30-m resolution raster dataset identifying four classes of moisture regimes. Stands were considered more likely to be resilient to drought if mean TMPI, on a 0–4 scale, with 4 being the driest, was less than the 75th percentile value for stands within the same forest type.
Calculating Resilience Scores
To score each stand's possibility of resilience to future disturbance, indicators of potential resilience in Table 1 were each worth one point. Stands were awarded one point for each indicator that contributed to resilience and zero points for each indicator that did not. Figure 2 depicts this process for a hypothetical dry mixed conifer stand. Although there were 12 indicators, potential resilience to different insect disturbances was evaluated separately for each forest type, resulting in a maximum possible score of 9 points. An area-weighted mean resilience score was calculated for each forest type by weighting the overall resilience score in each stand by its portion of the area in each forest type. The area-weighted mean score of each forest type to each disturbance was compared with a 2-tailed t-test to identify significant (p < 0.05) differences between the means.
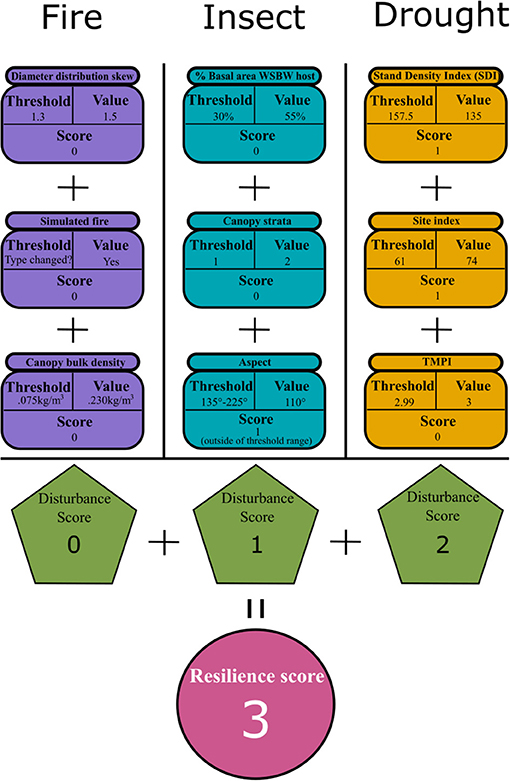
Figure 2. Diagram showing how the resilience score is calculated for a hypothetical dry mixed conifer stand. Indicators of potential resilience to each disturbance (Purple, Blue, Orange) are compared to threshold values and assigned a score of 0 or 1 depending on the indicators' contribution to potential resilience. Scores for each indicator are summed to give a resilience score for each disturbance (Green). The total resilience score for the stand (Pink) is the sum of scores from each disturbance.
Indicator Influence on the Resilience Score
To identify indicators with the greatest influence and simulate the potential for management to affect the overall resilience score in each forest type, we systematically adjusted indicator values and quantified resulting effects on overall resilience scores. All indicator values were adjusted simultaneously and only indicators with continuous response ranges were included (i.e., CBD, TMPI, SDI, site index, diameter distribution skew, total tree density, tree vigor, and percent basal area of WSBW host species). In every stand, each indicator value that fell on the non-resilient side of a threshold was adjusted incrementally in the direction of resilience by 5, 10, 20, 30, 40, and 50%. For example, if the CBD indicator in a hypothetical stand was greater than the threshold of 0.075 kg/m3 (Table 1), then the CBD value for that stand was decreased systematically by each percentage listed above, recording results after each decrease. At each adjustment step, we categorized stands in terms of whether their indicator values fell on the resilient side of each threshold.
Application of the Framework
We calculated a resilience score for three independent datasets collectively representing treated (treated within the previous 20 years to meet a restoration objective) and untreated (no previous treatment known) stands in each forest type in order to provide examples of how to apply our framework. Treatments to meet restoration objectives are designed to target stand structure and species composition within the HRV that has been identified for these forest types in the southwestern United States. We used data from the untreated ponderosa pine sites located at the Taylor Woods “levels of growing stock” experiment (hereafter Taylor Woods), on the Fort Valley Experimental Forest, Coconino National Forest, Arizona (Bailey et al., 2008) as our untreated reference conditions. Data from a ponderosa pine site treated to meet restoration objectives, located on the Bluewater demonstration site (hereafter Bluewater), Cibola National Forest, New Mexico (Reynolds et al., 2013), were combined with reconstructions of pre-settlement CBD (Fulé et al., 2002, 2004; Roccaforte et al., 2008, 2015) and used as the reference treated conditions to represent a ponderosa pine forest that was within the HRV.
Example application data for the dry mixed conifer forest type came from the Lower Middle Mountain Research Project, San Juan National Forest, Colorado (hereafter LMM; see Fulé et al., 2009; Stoddard et al., 2015). Three levels of treatment (control, thin only, and thin + burn) were implemented in 2008 to assess changes in forest structure and composition. We calculated a resilience score for the control (untreated) and two levels of treatment: thin only and thin + prescribed burn.
In both forest types, the site index and TMPI indicators were left out of the resilience score calculation because the threshold for these indicators is based on percentile. Instead, the distribution of site index and TMPI scores for each forest type on the RTLSA research landscape was assumed to also represent these stands.
Model Workflow Overview
We first identified stands that satisfied our definitions for the ponderosa pine or dry mixed conifer forest types. Next we identified three disturbances that we wanted to assess resilience to in each forest type. Indicators of short-term resilience to each disturbance were chosen from the literature and threshold levels were identified. Each indicator was defined as a variable in FVS, including the simulated fire with weather parameters. Outputs from the FVS run were sent to a database where the resilience score for each stand could be tallied. After the base scores were tallied, we adjusted the indicator values for each stand in the direction of resilience to test the response of each stand's score to potential “management.”
Results
Forest Type Conversions
Under the no disturbance scenario, 31 percent of stands across both forest types exhibited a forest type conversion, with the percentage similar in both ponderosa pine and dry mixed conifer forest types (Table 2). Comparatively, over 75% (76.5%) of stands exhibited a forest type conversion under the fire scenario, leading to a low resilience score for that indicator. In the ponderosa pine type, 85.6% of stands converted to non-ponderosa pine; of this total, 81% shifted to dry mixed conifer (40–90% ponderosa pine basal area) and 19% were reduced to zero basal area. In the dry mixed conifer type, 71.5% of stands shifted forest type away from dry mixed conifer; of these, 64% increased in ponderosa pine basal area and were classified as ponderosa pine type, 35% were reduced to zero basal area, and the remaining 1% dropped below 40% ponderosa pine basal area.
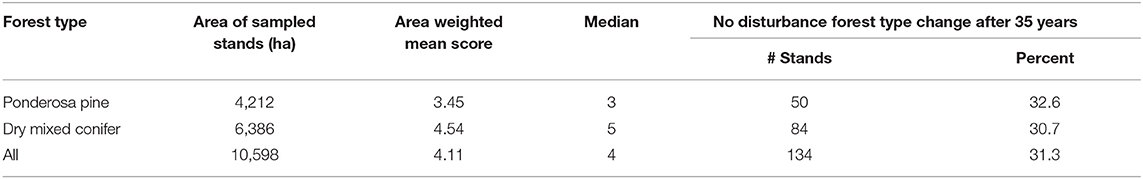
Table 2. Area of sampled stands shown in Figure 1, area weighted mean and median of resilience scores by forest type, and number and percent of stands indicating a forest type change after 40 years of no disturbance.
Resilience Score
The combined area-weighted mean resilience score for both the ponderosa pine and dry mixed conifer forest types on the Rio Tusas-Lower San Antonio landscape was 4.11 out of 9 (Table 2). The dry mixed conifer type scored higher than the ponderosa pine type with area-weighted means of 4.54 and 3.45, respectively (Table 2). However, the area in dry mixed conifer type was higher than in the ponderosa pine type (Table 2). Both forest types were similar in resilience to fire (p = 0.31) (Figure 3). Dry mixed conifer was significantly (p < 0.001) more likely to be resilient to insects than ponderosa pine and ponderosa pine was significantly more likely to be resilient to drought (p < 0.001) than dry mixed conifer (Figure 3).
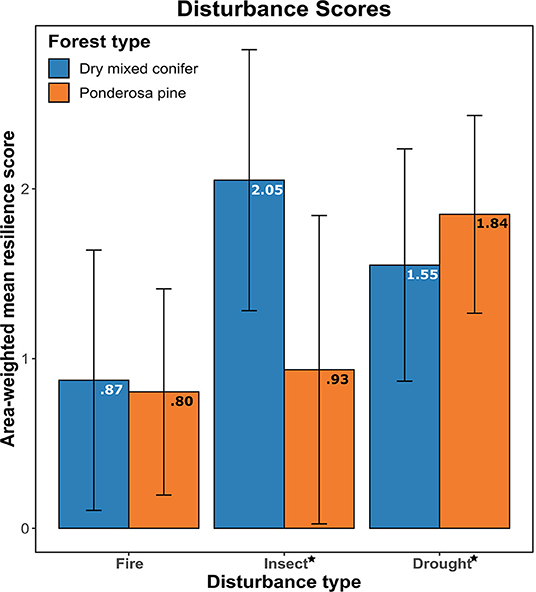
Figure 3. Comparison of mean scores ± standard deviation in each disturbance category by forest type. The maximum possible score in each category is 3 points. Inset numbers give the actual value represented by each bar. The ⋆ on the x axis denotes a significant difference in the resilience scores between the forest types (t-test, p < 0.05). The insect disturbance signifies western spruce budworm in the dry mixed conifer forest type and bark beetles in the ponderosa pine type.
Influence of Indicators on the Resilience Score
The ponderosa pine and dry mixed conifer forest types showed similar overall responses to adjustments in indicator values with the greatest occurring at lower indicator adjustment levels (Figure 4A). Both groups showed a decreasing response as percent adjustment increased. The overall increase in resilience scores across the course of adjustments was similar between the two forest types (Figure 4A).
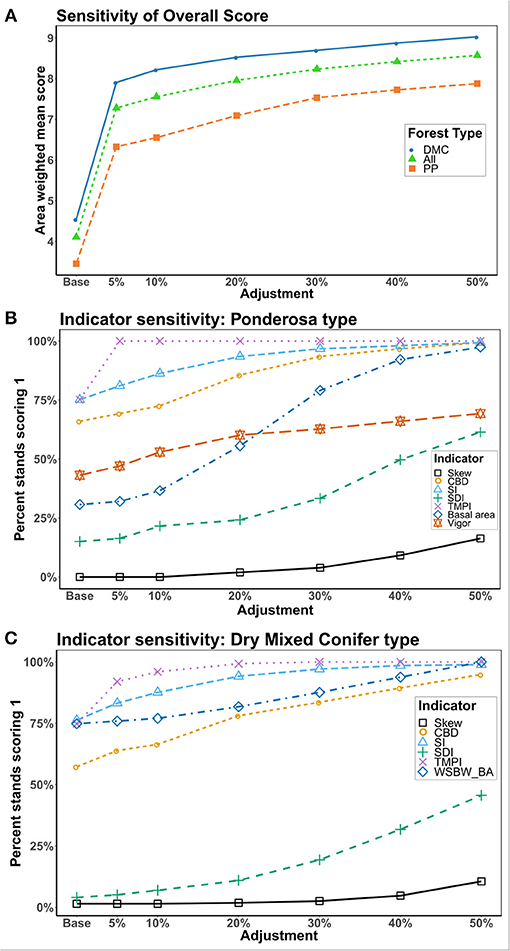
Figure 4. (A) Change in the overall area-weighted mean resilience score in response to adjustments in indicator values. (B,C) Forest Type-specific (B: Ponderosa pine and C: Dry mixed conifer) change in indicator values in response to adjustments. The y-axis gives the percentage of stands scoring a 1, meaning they were on the resilient side of the threshold, for each indicator. Only indicators with continuous responses are included in the analysis.
In the ponderosa pine type, basal area showed the greatest change in percent of stands categorized as resilient over the course of adjustments although SDI also showed a high amount of change (Figure 4B). Like the dry mixed conifer type, the site factors (TMPIand site index) showed similar amounts of change (Figure 4B). In particular, an adjustment of just 5% to TMPI resulted in all stands being categorized as resilient to that indicator (Figure 4B).
In the dry mixed conifer forest type, SDI was the metric of stand structure that showed the largest change in the number of stands categorized as resilient over the course of the adjustments (Figure 4C). The indicators for importance of WSBW hosts and site quality (site index and TMPI) all showed similar amounts of change, although TMPI values tended to be closer to the threshold than site index since an adjustment of 20% resulted in all stands categorized as resilient to these indicators (Figure 4C).
Application of the Framework
In the untreated ponderosa pine example dataset only the simulated fire indicator was on the resilient side of its threshold (i.e., forest type change was not predicted to occur 35 years post-fire) resulting in a partial resilience score of 1 out of 6 points (Table 3). In the restoration treated ponderosa pine stand all fire and insect indicators were categorized as resilient except QMD (Table 3), resulting in a partial resilience score of 6 out of 7 possible points. Approximately 90% of the 153 stands in the ponderosa pine type scored 1 or 2 out of 2 possible points for the combined site index and TPMI scores (Table 5). If the distribution of site quality found in the RTLSA stands is representative of the example stands, we could expect a full resilience score of 7–8 out 9 points for a treated stand and 2–3 out of 9 for an untreated stand.
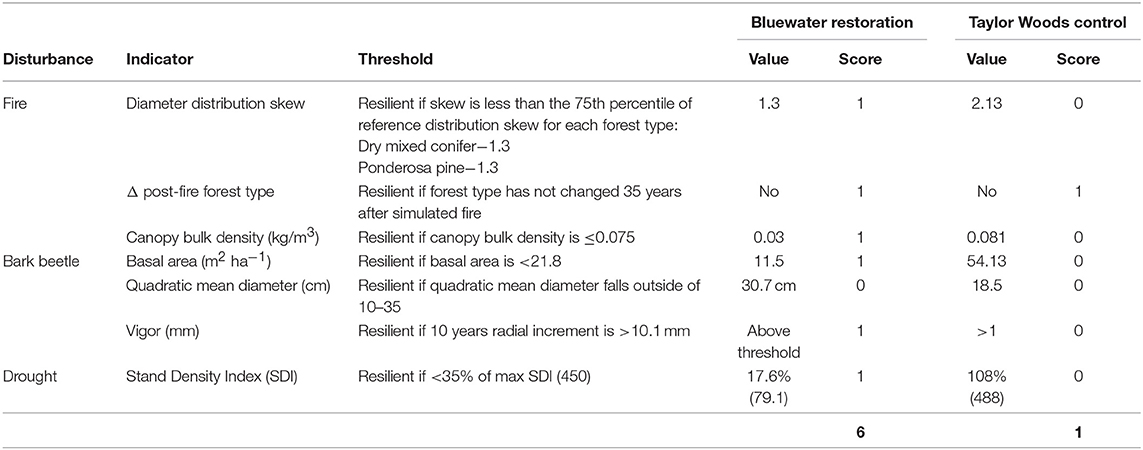
Table 3. Indicator values and overall resilience score in the ponderosa forest type from the Bluewater Demonstration Site, Cibola National Forest, New Mexico (Reynolds et al., 2013) and experimental control plot at Taylor Woods “Levels of Growth Study,” Fort Valley experimental Forest, Coconino National Forest, Arizona.
The untreated dry mixed conifer control dataset had two indicator values on the resilient side of their threshold, CBD and canopy strata, resulting in a score of 2 out of 6 possible points (Table 4). In the thin-only dry mixed conifer treatment, basal area of WSBW host species, stand aspect, and SDI did not contribute to resilience, resulting in a resilience score of 4 out of 6 possible points (Table 4). In the treated, thin + burn dry mixed conifer treatment, diameter distribution skew, forest type change after fire, and aspect were not on the resilient side of their thresholds, resulting in a resilience score of 4 out of 6 points (Table 4). On the RTLSA landscape, ~90% of the dry mixed conifer stands scored 1 or 2 out of 2 points for the combined site index and TPMI scores (Table 5). Assuming this distribution of drought scores is also representative of the example stands, we could expect the untreated stands to score 3–4, thin-only stands to score 5–6, and thin and prescribed burn stands to score 5–6 out of nine possible points.
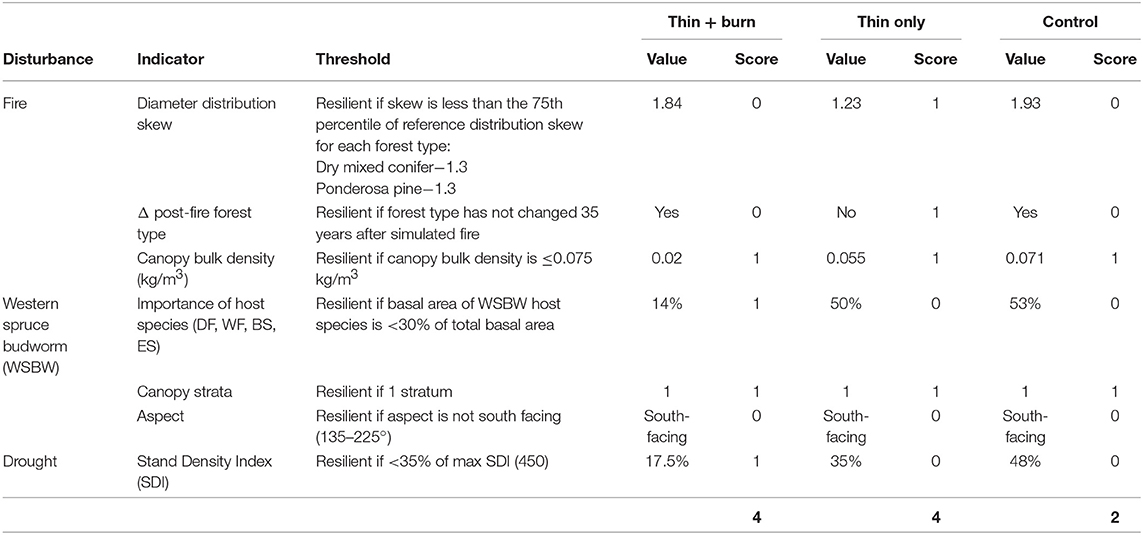
Table 4. Indicator values and overall resilience score in the dry mixed conifer forest type for the thin + burn, thin only, and control treatments on the Lower Middle Mountain Research Project, San Juan National Forest, Colorado.
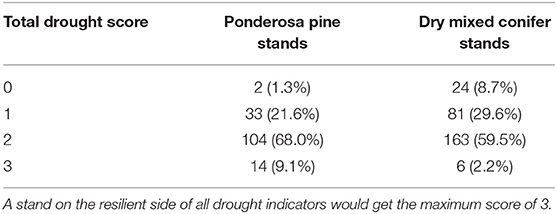
Table 5. Number (and percent) of sampled ponderosa pine and dry mixed conifer stands by drought score on the Rio Tusas-Lower San Antonio landscape calculated with the indicators in Table 1.
Discussion
We developed a framework for quantifying current ecological resilience using readily available metrics that can be adjusted for application in a variety of forested landscapes. We demonstrate the utility of the framework for a southwestern US landscape where understanding the implications of long-term historical changes in structure and composition for forest resilience to global change is both a pressing contemporary concern and a complex process to quantify. Our results provide additional evidence that the effects of these changes on potential resilience are less in the dry mixed conifer than in the ponderosa pine type. The overall weighted mean resilience score in the ponderosa pine forest type was 38% of the maximum while dry mixed conifer mean resilience score was 50% of the maximum score of 9. Although a direct comparison of the resilience scores is not appropriate due to differing insect disturbances and indicators, these scores may indicate that both forest types have a similar range of resilience in the research landscape currently (35–50%).
Ponderosa pine and dry mixed conifer forests have undergone large changes to structure and species composition in the Southwest due to past management and resulting disturbance regime shifts (e.g., Moore et al., 2004; Fulé et al., 2009). Ponderosa pine forests are fire adapted and composed nearly exclusively of ponderosa pine, which holds the competitive advantage over other species in periods of frequent fire (He et al., 2012). Fire free periods, such as the twentieth century in the Southwest (Swetnam and Baisan, 1996), can have a cascade of consequences for both forest types including shifts in species composition toward less fire adapted, shade tolerant species (Cocke et al., 2005; Fulé et al., 2009), increases in tree density (Moore et al., 2004; Fulé et al., 2009), and decreased vigor, limiting trees' ability to defend themselves from bark beetle attacks (Christiansen et al., 1987; Fischer et al., 2010). Previous work outside of the Southwest confirms the importance of fire in the ponderosa pine type, showing that low severity fire can increase ponderosa pine tree resistance to bark beetle attack (Hood et al., 2015) and increase stand level potential for resilience following an outbreak (Hood et al., 2016). This interaction shows that fire exclusion can have the dual effect of reducing the possibility of resilience to fire and insects. Reconstructions of historic structure in the dry mixed conifer forest type have found a higher mean tree density and a greater importance of shade tolerant and less fire adapted species than the ponderosa pine type (Reynolds et al., 2013). While large structural changes have also occurred in the dry mixed conifer type in the twentieth century (Fulé et al., 2004, 2009; Heinlein et al., 2005), the current structures and species compositions are not as far removed from historic ones.
We chose bark beetles and western spruce budworm (WSBW) as our insect indicators because these insects affected more hectares than any other insect species in southwestern ponderosa pine and dry mixed conifer forests, respectively, in 2014 but there are important differences in how these insects affect each forest type (USDA, 2014). Contrary to WSBW, a chronic defoliator causing low-growth episodes and eventually mortality after extended infestations (Pederson et al., 2011), bark beetles typically cause mortality within a year of attack and have caused mortality over a greater area than fire in the past three decades (Hicke et al., 2016). Additionally, the ponderosa pine forest type is relatively unusual in its dominance by a single species, meaning most trees of a certain diameter in a stand are susceptible to bark beetle mortality. In the dry mixed conifer forest type, a smaller percentage of trees are likely to be susceptible, given WSBW rarely feeds on ponderosa pine or quaking aspen, and preferentially feeds on white fir. Thus, the species composition of dry mixed conifer directly impacts susceptibility to WSBW. The dry mixed conifer forest type is also affected by bark beetles, particularly Douglas-fir beetle (Dendroctonus pseudotsugae) and fir engraver (Scolytus ventralis), which were not addressed in this model (USDA, 2014), suggesting that we may have overestimated insect resilience in the dry mixed conifer type. However, we believe the indicators we chose adequately represent the forest conditions leading to resilience to other insects as well. For example, reducing WSBW host species composition to <30% would also reduce host species for the Douglas-fir beetle and the fir engraver.
The changes in the overall scores for these two forest types in response to systematic indicator adjustments show that while both forest types may have a low potential for resilience in their current state, there is strong potential to be influenced by management (Figure 4). Treatments that reduce stand density, which will increase the vigor of residual trees, will increase resilience in both forest types (Fulé et al., 2002; Waltz et al., 2003; Roccaforte et al., 2015; Bradford and Bell, 2017). Similarly, combined thin and burn treatments, which have been shown to reduce tree density and encourage understory growth, may also be an effective strategy for enhancing resilience (Roccaforte et al., 2015; Strahan et al., 2015; Thomas and Waring, 2015).
In the dry mixed conifer type, stand density index (SDI) was the indicator with the greatest potential to influence resilience (Figure 4). This is consistent with previous studies' findings that overall stand density, particularly density of shade tolerant and less fire tolerant species that often host WSBW, have increased in southwestern dry mixed conifer forests (Cocke et al., 2005; Fulé et al., 2009; Huffman et al., 2015; Rodman et al., 2016). This analysis supports previous work demonstrating the potential benefits of treatments promoting a higher proportion of ponderosa pine, by reducing stand density and moving species composition away from shade tolerant, fire intolerant, WSBW hosts (Waltz et al., 2014; Stoddard et al., 2015). Ponderosa pine is the most drought tolerant tree species commonly found in the dry mixed conifer and a higher proportion will increase drought resilience (Niinemets and Valladares, 2006).
Although each disturbance and indicator was treated separately, as linear, independent variables in this model, correlations between indicators are likely, as are known interactions among disturbances, site factors, and stand-level variables. Such interactions can have negative or positive effects on forest resilience. Two types of interactions between fire and bark beetles have been well-documented: fire can supply beetles with susceptible trees, potentially increasing outbreak severity, and bark beetle attacks can cause increased risk of crowning, due to low canopy fuel moisture content in the short-term, and increased surface fuel loads as snags fall in the long-term (Gibson et al., 2007; Jenkins et al., 2014). There is strong support for drought as an underlying contributor to each of the other three disturbances (Raffa et al., 2008; Weed et al., 2013; Williams et al., 2013). For an example of a beneficial interaction, stand density and vigor, both indicators of potential resilience to bark beetles in this study (Table 1), are tightly coupled and there is strong evidence that stands with lower density may have increased resistance to drought as well (McDowell et al., 2006; Magruder et al., 2013; Erickson and Waring, 2014; Bradford and Bell, 2017).
Example applications of the framework yielded insights into the model's response to a variety of stand conditions in both forest types as well as the implications of restoration-based treatments on forest resilience. Low resilience scores for control stands in both forest types and the relatively high scores in treated stands confirm the usefulness of this model for distinguishing between functioning and non-functioning forest conditions. This is also consistent with evidence that the HRV represents a stand structure that's more likely to be resilient to future disturbance (Allen et al., 2002).
Although previous work has found thin + burn treatments to be the most effective at moving forest structure closer to HRV, as measured 5 years (Stoddard et al., 2015) and 11 years (Roccaforte et al., 2015) post-treatment, this model scored the thin only treatment at LMM equal to the thin + burn treatment although there were differences in the responses of specific indicators. The thin + burn was projected to change from the dry mixed conifer type to the ponderosa pine type 35 years following a modeled severe fire and the skew of the diameter distribution in the thin + burn was greater than the 75th percentile of historic stands. These results could indicate a weakness in the forest type definitions used for this model in that they do not properly account for fluctuations in species composition (especially in the importance of less fire tolerant species) that may occur following a severe fire or give cause for reevaluating the 35-years time frame used to determine post-fire forest type changes. We would expect the lower stand density in the thin + burn treatment (11.3 m2 ha−1) as compared to the thin only treatment (20.5 m2 ha−1) to allow for higher rates of regeneration and establishment, which is reflected in the more positive skew of the diameter distribution following the thin + burn treatment. Diameter distribution skew falling on the non-resilient side of its threshold in the thin + burn treatment could be evidence that the threshold established for this indicator may need adjustment to account for regeneration following treatment or disturbance. This could be exacerbated by our use of pre-settlement diameter distributions, which were influenced by frequent fires and thus may underestimate the proportion of small diameter trees in historical forests.
The most important decision faced in the development of this framework was determining modeling needs and the selection of the underlying model. Ultimately, FVS was chosen due to its (1) wide applicability and technical accessibility to a variety of audiences (i.e., growth and mortality models can be calibrated to specific geographic areas of the United States and twenty geographically-specific FVS variants exist), (2) ease at which it allows users to test alternative hypotheses related to different treatments and disturbances, and assess future forest conditions, and (3) long history of applications in forest resource assessment and planning (Crookston and Dixon, 2005). The FVS is not without its well-documented limitations, such as weaknesses in predicting crown and canopy fuel characteristics (e.g., Cruz and Alexander, 2010; Keyser and Smith, 2010), shortcomings when simulating responses to canopy gap-related disturbances (e.g., Arseneault and Saunders, 2012), inability to use spatially-explicit information or spatially-explicit predictions (e.g., Chivoiu et al., 2006), and general inaccuracies and imperfections in the underlying growth model (e.g., Ex and Smith, 2014; Petrova et al., 2014; Dickinson et al., 2019). Ultimately we selected FVS as the best choice of underlying model that adequately generalized forest stand development and its response to silvicultural treatments, as well as provided robust estimates that could be used to assess the risk of state transitions and predict the impact of management on an ecosystem's response to future disturbances. An estimate of the resilience score of these forest types across the region would be possible by implementing the framework described here, or some variant, in more locations to better account for the diversity of conditions found in the dry mixed conifer and ponderosa pine forest types. In general, this framework could be improved using pre- and post-disturbance data to test resilience possibilities. This could also provide an opportunity to address interactions between disturbance severities and resilience scores.
Management and Policy Implications
To the extent that the dry mixed conifer and ponderosa pine forests on the Rio Tusas-Lower San Antonio Landscape are representative of the same forest types across the Southwest, these results imply that there is much work left to be done to return ponderosa pine and dry mixed conifer forests to a resilient condition in the region. Together these two forest types represent ~28% of the forested area of the U.S. Southwest. There is also cause for optimism that the standards for frequent-fire forest restoration in the Southwest (Reynolds et al., 2013) are consistent with the goal of increasing resilience.
The results of this study have implications to management at stand, landscape, and regional scales. At the stand-scale, this framework allows the manager to assess the possibility of individual stands demonstrating resilience using routinely measured forest attributes. At the landscape-scale, it allows managers to prioritize stands for treatment based on their resilience score and location in relation to other resources or community assets. This landscape-scale prioritization is useful for avoiding catastrophic disturbances, reducing threats to the public and adjacent resources, and justifying treatments to stakeholders. At the regional-scale, future refinements and applications of the framework can provide a consistent, quantitative metric for tracking the progress of forest restoration and the potential resilience of these forest types across the Southwest. Although fire, insects and drought are major disturbances in forests worldwide so will likely be useful indicator in all areas, our process of combining resilience scores could be tailored to other regions by including the most locally appropriate metrics for other disturbances. Thus, we believe our index has the potential for wider application beyond the southwestern US.
Data Availability Statement
The raw data supporting the conclusions of this manuscript will be made available by the authors, without undue reservation, to any qualified researcher.
Author Contributions
TB, KW, AS, and JB developed the research ideas and methods and contributed to writing. TB conducted data analysis.
Funding
Support of this research was provided by USDA Forest Service via Grant 13-DG-11030200-014 and by the Ecological Restoration Institute at Northern Arizona University who provided personnel and logistical field support, as well as access to the Lower Middle Mountain Research Project dataset.
Conflict of Interest
The authors declare that the research was conducted in the absence of any commercial or financial relationships that could be construed as a potential conflict of interest.
Acknowledgments
We also thank the staff of the Carson National Forest, Tres Piedras Ranger District, for providing data and opportunities that became the foundation for this work and Sushil Nepal, Marguerite Rapp, Ian Fox, and Meredith Prentice for their assistance with fieldwork. Any use of trade, product, or firm names is for descriptive purposes only and does not imply endorsement by the U.S. Government.
Supplementary Material
The Supplementary Material for this article can be found online at: https://www.frontiersin.org/articles/10.3389/ffgc.2019.00056/full#supplementary-material
References
Adams, M. A. (2013). Mega-fires, tipping points and ecosystem services: managing forests and woodlands in an uncertain future. For. Ecol. Manage. 294, 250–261. doi: 10.1016/j.foreco.2012.11.039
Agee, J. K., and Skinner, C. N. (2005). Basic principles of forest fuel reduction treatments. For. Ecol. Manage. 211, 83–96. doi: 10.1016/j.foreco.2005.01.034
Allen, C. D., Savage, M., Falk, D. A., Suckling, K. F., Swetnam, T. W., Schulke, T., et al. (2002). Ecological restoration of southwestern ponderosa pine ecosystems: a broad perspective. Ecol. Appl. 12, 1418–1433. doi: 10.1890/1051-0761(2002)012[1418:EROSPP]2.0.CO;2
Angeler, D. G., and Allen, C. R. (2016). Quantifying resilience. J. Appl. Ecol. 53, 617–624. doi: 10.1111/1365-2664.12649
Arseneault, J. E., and Saunders, M. R. (2012). Incorporating canopy gap-induced growth responses into spatially implicit growth model projections. Ecol. Model. 237–238, 120–131. doi: 10.1016/j.ecolmodel.2012.04.003
Bailey, J. D., Olberding, S. D., and Moore, M. M. (Eds.). (2008). Forty Years Later at Taylor Woods: Merging the Old and New. Fort Valley Experimental Forest–A Century of Research 1908–2008, August 7–9, 2008 (Fort Collins, CO: USDA, Forest Service, Rocky Mountain Research Station), 128p.
Bottero, A., D'Amato, A. W., Palik, B. J., Bradford, J. B., Fraver, S., Battaglia, M. A., et al. (2017). Density-dependent vulnerability of forest ecosystems to drought. J. Appl. Ecol. 54, 1605–1614. doi: 10.1111/1365-2664.12847
Bradford, J. B., and Bell, D. M. (2017). A window of opportunity for climate-change adaptation: easing tree mortality by reducing forest basal area. Front. Ecol. Environ. 15:1445. doi: 10.1002/fee.1445
Brookes, M. H., Colbert, J. J., Mitchell, R. G., and Stark, R. W. (1985). Managing Trees and Stands Susceptible to Western Spruce Budworm. Washington, DC: USDA Forest Service, Cooperative State Research Service. Technical Bulletin No. 1695.
Brown, P. M., and Wu, R. (2005). Climate and disturbance forcing of episodic tree recruitment in a southwestern Ponderosa pine landscape. Ecology 86, 3030–3038. doi: 10.1890/05-0034
Bryant, T., Rapp, M., Sanchez Meador, A., Waring, K., and Arciniega, L. (2016). Silviculture Specialist Report for the Rio Tusas-Lower San Antonio Landscape Restoration Project. Written report delivered to the Tres Piedras Ranger District, Carson National Forest, Rio Arriba County, NM. 41p.
Buford, M., Chan, C., Crockett, J., Reinhardt, E., and Sloan, J. (2015). From Accelerating Restoration to Creating and Maintaining Resilient Landscapes and Communities Across the Nation: Update on Progress From 2012. USDA Forest Service. Report FS-1069.
Carpenter, S., Walker, B., Anderies, J. M., and Abel, N. (2001). From metaphor to measurement: resilience of what to what? Ecosystems 4, 765–781. doi: 10.1007/s10021-001-0045-9
Chivoiu, B., Shao, G., Moser, J., and Mills, W. L. (2006). ArcFVS: an integration of a Geographic Information System and Forest Vegetation Simulator. Sci. China E Technol. Sci. 49, 35–44. doi: 10.1007/s11431-006-8105-1
Christiansen, E., Waring, R. H., and Berryman, A. A. (1987). Resistance of conifers to bark beetle attack: searching for general relationships. For. Ecol. Manage. 22, 89–106. doi: 10.1016/0378-1127(87)90098-3
Clark, J. S., Iverson, L., Woodall, C. W., Allen, C. D., Bell, D. M., Bragg, D. C., et al. (2016). The impacts of increasing drought on forest dynamics, structure, and biodiversity in the United States. Glob. Chang. Biol. 22, 2329–2352. doi: 10.1111/gcb.13160
Cocke, A. E., Fulé, P. Z., and Crouse, J. (2005). Forest change on a steep mountain gradient after extended fire exclusion: San Francisco Peaks, Arizona, USA. J. Appl. Ecol. 42, 814–823. doi: 10.1111/j.1365-2664.2005.01077.x
Cook, B. I., and Seager, R. (2013). The response of the North American Monsoon to increased greenhouse gas forcing. J. Geophys. Res. Atmos. 118, 1690–1699. doi: 10.1002/jgrd.50111
Covington, W. W., and Moore, M. M. (1994). Southwestern Ponderosa forest structure: changes since Euro-American settlement. J. For. 92, 39–47.
Cram, D., Baker, T., and Boren, J. (2006). Wildland Fire Effects in Silviculturally Treated vs. Untreated Stands of New Mexico and Arizona. Fort Collins, CO: USDA Forest Service, Rocky Mountain Research Station. Research Paper RMRS-RP-55.
Crookston, N. L., and Dixon, G. E. (2005). The forest vegetation simulator: a review of its structure, content, and applications. Comput. Electron. Agric. 49, 60–80. doi: 10.1016/j.compag.2005.02.003
Cruz, M. G., and Alexander, M, E. (2010). Assessing crown fire potential in coniferous foersts of western North America: a critique of current approaches and recent simulation studies. Int. J. Wildland Fire 19, 377–398. doi: 10.1071/WF08132
D'Amato, A. W., Bradford, J. B., Fraver, S., and Palik, B. J. (2013). Effects of thinning on drought vulnerability and climate response in north temperate forest ecosystems. Ecol. Appl. 23, 1735–1742. doi: 10.1890/13-0677.1
DeRose, R. J., and Long, J. N. (2014). Resistance and resilience: a conceptual framework for silviculture. For. Sci. 60, 1205–1212. doi: 10.5849/forsci.13-507
Dickinson, Y. L., Battaglia, M. A., and Asherin, L. A. (2019). Evaluation of the FVS-CR diameter growth model in structurally heterogeneous ponderosa pine (Pinus ponderosa Douglas ex C. Lawson) stands in the Southern Rockies, and potential modifications. For. Ecol. Manage. 448, 1–10. doi: 10.1016/j.foreco.2019.05.031
Dixon, G. E. (2015). Essential FVS: A User's Guide to the Forest Vegetation Simulator. Fort Collins, CO: USDA, Forest Service, Forest Management Service Center.
Edminster, C. B., and Jump, L. H. (1976). Site Index Curves for Douglas-fir in New Mexico. Fort Collins, CO: USDA Forest Service, Rocky Mountain Forest and Range Experiment Station.
Erickson, C. C., and Waring, K. M. (2014). Old Pinus ponderosa growth responses to restoration treatments, climate and drought in a southwestern US landscape. Appl. Veg. Sci. 17, 97–108. doi: 10.1111/avsc.12056
Ex, S., and Smith, F. W. (2014). Evaluating forest vegetation simulator performance for trees in multi-aged ponderosa pine stands, Black Hills, USA. For. Sci. 60, 214–221. doi: 10.5849/forsci.12-054
Fischer, M. J., Waring, K. M., Hofstetter, R. W., and Kolb, T. E. (2010). Ponderosa pine characteristics associated with attack by the roundheaded pine beetle. For. Sci. 56, 473–483. doi: 10.1093/forestscience/56.5.473
Fulé, P. Z., Covington, W. W., Smith, H. B., Springer, J. D., Heinlein, T. A., Huisinga, K. D., et al. (2002). Comparing ecological restoration alternatives: Grand Canyon, Arizona. For. Ecol. Manage. 170, 19–41. doi: 10.1016/S0378-1127(01)00759-9
Fulé, P. Z., Crouse, J. E., Cocke, A. E., Moore, M. M., and Covington, W. W. (2004). Changes in canopy fuels and potential fire behavior 1880–2040: Grand Canyon, Arizona. Ecol. Modell. 175, 231–248. doi: 10.1016/j.ecolmodel.2003.10.023
Fulé, P. Z., Crouse, J. E., Heinlein, T. A., Moore, M. M., Covington, W. W., and Verkamp, G. (2003). Mixed-severity fire regime in a high-elevation forest of Grand Canyon, Arizona, USA. Landsc. Ecol. 18, 465–486. doi: 10.1023/A:1026012118011
Fulé, P. Z., Korb, J. E., and Wu, R. (2009). Changes in forest structure of a mixed conifer forest, southwestern Colorado, USA. For. Ecol. Manage. 258, 1200–1210. doi: 10.1016/j.foreco.2009.06.015
Gibson, K., Negrón, J. F., Hayes, J. L., and Lundquist, J. E. (Eds.). (2007). Fire and Bark Beetle Interactions. The Western Bark Beetle Research Group: A Unique Collaboration With Forest Health Protection: Proceedings of a Symposium at the 2007 Society of American Foresters Conference (Portland, OR: USDA, Forest Service, Pacific Northwest Research Station).
Graham, R. T., Harvey, A. E., Jain, T. B., and Tonn, J. R. (1999). The Effects of Thinning and Similar Stand Treatments on Fire Behavior in Western Forests. Portland, OR: USDA, Forest Service, Pacific Northwest Research Station. Gen. Tech. Rep. PNW-GTR-463.
Gunderson, L. H. (2000). Ecological resilience–in theory and application. Annu. Rev. Ecol. Syst. 31, 425–439. doi: 10.1146/annurev.ecolsys.31.1.425
He, T., Pausas, J. G., Belcher, C. M., Schwilk, D. W., and Lamont, B. B. (2012). Fire-adapted traits of Pinus arose in the fiery Cretaceous. New Phytol. 194, 751–759. doi: 10.1111/j.1469-8137.2012.04079.x
Heinlein, T. A., Moore, M. M., Fulé, P. Z., and Covington, W. W. (2005). Fire history and stand structure of two ponderosa pinemixed conifer sites: San Francisco Peaks, Arizona, USA. Int. J. Wildland Fire 14, 307–320. doi: 10.1071/WF04060
Hicke, J. A., Meddens, J. H., and Kolden, C, A. (2016). Recent tree mortality in the western United States from bark beetles and forest fires. For. Sci. 62, 141–153. doi: 10.5849/forsci.15-086
Higgins, A. M., Waring, K. M., and Thode, A. E. (2015). The effects of burn entry and burn severity on ponderosa pine and mixed conifer forests in Grand Canyon National Park. Int. J. Wildland Fire 24, 495–506. doi: 10.1071/WF13111
Holling, C. S. (1973). Resilience and stability of ecological systems. Annu. Rev. Ecol. Syst. 4, 1–23. doi: 10.1146/annurev.es.04.110173.000245
Hood, S., Sala, A., Heyerdahl, E. K., and Boutin, M. (2015). Low-severity fire increases tree defense against bark beetle attacks. Ecology 96, 1846–1855. doi: 10.1890/14-0487.1
Hood, S. M., Baker, S., and Sala, A. (2016). Fortifying the forest: thinning and burning increase resistance to a bark beetle outbreak and promote forest resilience. Ecol. Appl. 26, 1984–2000. doi: 10.1002/eap.1363
Huffman, D. W., Zegler, T. J., and Fulé, P. Z. (2015). Fire history of a mixed conifer forest on the Mogollon Rim, Northern Arizona, USA. Int. J. Wildland Fire 24, 680–689. doi: 10.1071/WF14005
Jenkins, M. J., Runyon, J. B., Fettig, C. J., Page, W. G., and Bentz, B. J. (2014). Interactions among the mountain pine beetle, fires, and fuels. For. Sci. 60, 489–501. doi: 10.5849/forsci.13-017
Keyser, T. L., and Smith, F. W. (2010). Influence of crown biomass estimators and distribution on canopy fuel characteristics in ponderosa pine stands of the Black Hills. For. Sci. 56, 156–165. doi: 10.1093/forestscience/56.2.156
Long, J. N., and Shaw, J. D. (2005). A density management diagram for even-aged ponderosa pine stands. West. J. Appl. For. 20, 205–215. doi: 10.1093/wjaf/20.4.205
Magruder, M., Chhin, S., Palik, B., and Bradford, J. B. (2013). Thinning increases climatic resilience of red pine. Can. J. For. Res. 43, 878–889. doi: 10.1139/cjfr-2013-0088
Mast, J. N., Fulé, P. Z., Moore, M. M., Covington, W. W., and Waltz, A. E. M. (1999). Restoration of presettlement age structure of an Arizona ponderosa pine forest. Ecol. Appl. 9, 228–239. doi: 10.1890/1051-0761(1999)009[0228:ROPASO]2.0.CO;2
McDowell, N. G., Adams, H. D., Bailey, J. D., Hess, M., and Kolb, T. E. (2006). Homeostatic maintenance of Ponderosa pine gas exchange in response to stand density changes. Ecol. Appl. 16, 1164–1182. doi: 10.1890/1051-0761(2006)016[1164:HMOPPG]2.0.CO;2
Millar, C. I., and Stephenson, N. L. (2015). Temperate forest health in an era of emerging megadisturbance. Science 349, 823–826. doi: 10.1126/science.aaa9933
Millennium Ecosystem Assessment (2005). Ecosystems and Human Well-Being: Synthesis. Washington, DC: Island Press, 64.
Minor, C. O. (1964). Site-Index Curves for Young-Growth Ponderosa Pine in Northern Arizona. Fort Collins, CO: USDA Forest Service, Rocky Mountain Forest and Range Experiment Station.
Moore, M. M., Huffman, D. W., Fulé, P. Z., Covington, W. W., and Crouse, J. E. (2004). Comparison of historical and contemporary forest structure and composition on permanent plots in southwestern ponderosa pine forests. For. Sci. 50, 162–176. doi: 10.1093/forestscience/50.2.162
Moser, S., Meerow, S., Arnott, J., and Jack-Scott, E. (2019). The turbulent world of resilience: interpretations and themes for transdisciplinary dialogue. Clim. Change 153, 21–40. doi: 10.1007/s10584-018-2358-0
Natural Resources Conservation Service (2016). Web Soil Survey. Washington, DC: Natural Resources Conservation Service, Soil Survey Staff, United States Department of Agriculture. Available online at: https://websoilsurvey.sc.egov.usda.gov/ (accessed September, 2016).
Negrón, J. F., McMillin, J. D., Anhold, J. A., and Coulson, D. (2009). Bark beetle-caused mortality in a drought-affected ponderosa pine landscape in Arizona, USA. For. Ecol. Manage. 257, 1353–1362. doi: 10.1016/j.foreco.2008.12.002
Negrón, J. F., Wilson, J. L., and Anhold, J. A. (2000). Stand conditions associated with roundheaded pine beetle (Coleoptera: Scolytidae) infestations in Arizona and Utah. Environ. Entomol. 29, 20–27. doi: 10.1603/0046-225X-29.1.20
Niinemets, Ü., and Valladares, F. (2006). Tolerance to shade, drought, and waterlogging of temperate northern hemisphere trees and shrubs. Ecol. Monogr. 76, 521–547. doi: 10.1890/0012-9615(2006)076[0521:TTSDAW]2.0.CO;2
Pederson, L., Sturdevant, N., and Blackford, D. (2011). Western Spruce Budworm Management. Washington, DC: USDA, Forest Service. Insect and Disease Management Series 6.1.
Petrova, M., Bakker, J. D., and Turnblom, E. C. (2014). Ten-year periodic diameter model for uneven-aged ponderosa pine stands in the Southwest reduces long-term error propagation. For. Sci. 60, 1148–1155. doi: 10.5849/forsci.12-537
Prior-Magee, J. S., Boykin, K. G., Bradford, D. F., Kepner, W. G., Lowry, J. H., Schrupp, D. L., et al. (2007). Southwest Regional Gap Analysis Project Final Report. Moscow, ID: Geological Survey, U.S., GAP Analysis Program.
Raffa, K. F., Aukema, B. H., Bentz, B. J., Carroll, A. L., Hicke, J., Turner, M. G., et al. (2008). Cross-scale drivers of natural disturbances prone to anthropogenic amplification: the dynamics of bark beetle eruptions. Bioscience 58, 501–517. doi: 10.1641/B580607
Rebain, S. (2015). The Fire and Fuels Extension to the Forest Vegetation Simulator: Updated Model Documentation. Fort Collins, CO: USDA, Forest Service, Forest Managment Service Center.
Rehfeldt, G. E., Crookston, N. L., Warwell, M. V., and Evans, J. S. (2006). Empirical analyses of plant-climate relationships for the western United States. Int. J. Plant Sci. 167, 1123–1150. doi: 10.1086/507711
Reineke, L. H. (1933). Perfecting a stand-density index for even-aged forests. J. Agric. Res. 46, 627–638.
Reyer, C. P. O., Brouwers, N., Rammig, A., Brook, B. W., Epila, J., Grant, R. F., et al. (2015). Forest resilience and tipping points at different spatio-temporal scales: approaches and challenges. J. Ecol. 103, 5–15. doi: 10.1111/1365-2745.12337
Reynolds, R. T., Sánchez Meador, A. J., Youtz, J. A., Nicolet, T., Matonis, M. S., Jackson, P. L., et al. (2013). Restoring Composition and Structure in Southwestern Frequent-Fire Forests: A Science-Based Framework for Improving Ecosystem Resiliency. Fort Collins, CO. General Technical Report RMRS-GTR-310.
Roccaforte, J. P., Fulé, P. Z., and Covington, W. W. (2008). Landscape-scale changes in canopy fuels and potential fire behaviour following ponderosa pine restoration treatments. Int. J. Wildland Fire 17, 293–303. doi: 10.1071/WF06120
Roccaforte, J. P., Huffman, D. W., Fulé, P. Z., Covington, W. W., Chancellor, W. W., Stoddard, M. T., et al. (2015). Forest structure and fuels dynamics following ponderosa pine restoration treatments, White Mountains, Arizona, USA. For. Ecol. Manage. 337, 174–185. doi: 10.1016/j.foreco.2014.11.001
Rodman, K. C., Sánchez Meador, A. J., Huffman, D. W., and Waring, K. M. (2016). Reference conditions and historical fine-scale spatial dynamics in a dry mixed-conifer forest, Arizona, USA. For. Sci. 62, 268–280. doi: 10.5849/forsci.15-136
Romme, W. H., Floyd, M. L., Hanna, D., Redders, J. S., McGarigal, K., and Crist, M. (2009). Landscape Condition Analysis for the South-Central Highlands Section, Southwestern Colorado and Northwestern New Mexico. Unpublished Report to the USDA Forest Service, San Juan National Forest, Durango, CO.
Sánchez Meador, A., Moore, M. M., Bakker, J., and Parysow, P. (2009). 108 years of change in spatial pattern following selective harvest of a Pinus ponderosa stand in northern Arizona, USA. J. Veg. Sci. 20, 79–90. doi: 10.1046/j.1365-2893.1999.00142.x-i1
Savage, M., and Mast, J. N. (2005). How resilient are southwestern ponderosa pine forests after crown fires? Can. J. For. Res. 35, 967–977. doi: 10.1139/x05-028
Sayre, R., Comer, P., Warner, H., and Cress, J. (2009). A new map of standardized terrestrial ecosystems of the conterminous United States. Reston, VA: U.S. Department of the Interior, U.S. Geological Survey. Professional Paper 1768.
Scheffer, M., and Carpenter, S. R. (2003). Catastrophic regime shifts in ecosystems: linking theory to observation. Trends Ecol. Evol. 18, 648–656. doi: 10.1016/j.tree.2003.09.002
Scott, J. H., and Burgan, R. E. (2005). Standard Fire Behavior Fuel Models: A Comprehensive Set for Use With Rothermel's Surface Fire Spread Model. Fort Collins, CO: USDA, Forest Service, Rocky Mountain Research Station. RMRS GTR-153.
Seager, R., and Vecchi, G. A. (2010). Greenhouse warming and the 21st century hydroclimate of southwestern North America. Proc. Natl. Acad. Sci. U.S.A. 107, 21277–21282. doi: 10.1073/pnas.0910856107
Shaw, J. D. (2000). Application of stand density index to irregularly structured stands. West. J. Appl. For. 15, 40–42. doi: 10.1093/wjaf/15.1.40
Shaw, J. D. (2006). “Reineke's Stand Density Index: where are we and where do we go from here?” in Proceedings: Society of American Foresters 2005 National Convention (Ft. Worth, TX), October 19–23, 2005.
Stoddard, M. T., Sánchez Meador, A. J., Fulé, P. Z., and Korb, J. E. (2015). Five-year post-restoration conditions and simulated climate-change trajectoriesin a warm/dry mixed-conifer forest, southwestern Colorado, USA. For. Ecol. Manage. 356, 253–261. doi: 10.1016/j.foreco.2015.07.007
Strahan, R. T., Stoddard, M. T., Springer, J. D., and Huffman, D. W. (2015). Increasing weight of evidence that thinning and burning treatments help restore understory plant communities in ponderosa pine forests. For. Ecol. Manage. 353, 208–220. doi: 10.1016/j.foreco.2015.05.040
Swetnam, T., and Baisan, C. (1996). “Historical fire regime patterns in the southwestern United States since AD 1700,” in Fire Effects in Southwestern Forests: Proceedings of the 2nd La Mesa Fire Symposium (Fort Collins, CO: USDA Forest Service, Rocky Mountain Research Station), 11p.
Thomas, Z., and Waring, K. M. (2015). Enhancing resiliency and restoring ecological attributes in second-growth ponderosa pine stands in Northern New Mexico, USA. For. Sci. 61, 93–104. doi: 10.5849/forsci.13-085
Turner, M. G., Donato, D. C., and Romme, W. H. (2013). Consequences of spatial heterogeneity for ecosystem services in changing forest landscapes: priorities for future research. Landsc. Ecol. 28, 1081–1097. doi: 10.1007/s10980-012-9741-4
USDA (2014). USDA Forest Service, Southwestern Region Forest Health. Forest Insect and Disease Conditions in the Southwestern Region. PR-R3-16-13. Washington, DC.
USDA (2015a). USDA Forest Service. Final Environmental Impact Statement: Four Forest Restoration Initiative. Washington, DC.
USDA (2015b). USDA Forest Service, Natural Resource Manager. FSVeg Common Stand Exam User Guide. Washington, DC.
USDA (2019). USDA Forest Service Four Forest Restoration Initiative. Available online at: https://www.fs.usda.gov/main/4fri/home (accessed August 29, 2019).
Vankat, J. L. (2013). Vegetation Dynamics on the Mountains and Plateaus of the American Southwest. New York, NY: Springer.
Waltz, A. E., Fulé, P. Z., Covington, W. W., and Moore, M. M. (2003). Diversity in ponderosa pine forest structure following ecological restoration treatments. For. Sci. 49, 885–900. doi: 10.1093/forestscience/49.6.885
Waltz, A. E. M., Stoddard, M. T., Kalies, E. L., Springer, J. D., Huffman, D. W., and Sánchez Meador, A. (2014). Effectiveness of fuel reduction treatments: assessing metrics of forest resiliency and wildfire severity after the Wallow Fire, AZ. For. Ecol. Manage. 334, 43–52. doi: 10.1016/j.foreco.2014.08.026
Weed, A. S., Ayres, M. P., and Hicke, J. A. (2013). Consequences of climate change for biotic disturbances in North American forests. Ecol. Monogr. 83, 441–470. doi: 10.1890/13-0160.1
Western Regional Climate Center (2016). Tres Piedras, New Mexico, Monthly Climate Summary. Reno, NV.
Keywords: ecological resilience, forest disturbance, fire, insects, drought, resistance, indicators, thresholds
Citation: Bryant T, Waring K, Sánchez Meador A and Bradford JB (2019) A Framework for Quantifying Resilience to Forest Disturbance. Front. For. Glob. Change 2:56. doi: 10.3389/ffgc.2019.00056
Received: 30 March 2019; Accepted: 04 September 2019;
Published: 18 September 2019.
Edited by:
Grizelle Gonzalez, International Institute of Tropical Forestry, Forest Service (USDA), United StatesReviewed by:
Robert Muscarella, Uppsala University, SwedenYi-Ying Chen, Academia Sinica, Taiwan
Jens Stevens, United States Geological Survey (USGS), United States
Copyright © 2019 Bryant, Waring, Sánchez Meador and Bradford. This is an open-access article distributed under the terms of the Creative Commons Attribution License (CC BY). The use, distribution or reproduction in other forums is permitted, provided the original author(s) and the copyright owner(s) are credited and that the original publication in this journal is cited, in accordance with accepted academic practice. No use, distribution or reproduction is permitted which does not comply with these terms.
*Correspondence: Kristen Waring, a3Jpc3Rlbi53YXJpbmcmI3gwMDA0MDtuYXUuZWR1