 Samuel J. Shry†
 Erin S. McCallum
- Department of Wildlife, Fish, and Environmental Studies, Swedish University for Agricultural Sciences (SLU), Umeå, Sweden
Fish display a remarkable diversity in juvenile migration strategies and behavior. Intra-species variation in migration can be considerable, and understanding the driving force of such variation is important for effective management and conservation of migratory fish. In facultative migratory species, such as many salmonid fish, energetic status is known to affect migration strategy and behavior. However, we currently lack a full understanding of how energetic status affects juvenile development and migration over different environmental contexts. In this study, we examined the effect of energetic status on juvenile migration initiation and migratory behaviors in 1 and 2 year old brown trout (Salmo trutta). By manipulating feeding regimes, we created a large variation in trout energetic status (using condition factor as a proxy). We then studied behavioral changes in migration in both a controlled environment (large-scale migration pools) as well as a natural river system using both passive integrative transponder tags (PIT-tags) as well as acoustic telemetry tags. In the laboratory setting, 1 year old trout with higher energetic status were more likely to initiate migration and migrated faster. For 2 year old trout, energetic status did not affect the initiation of migration (the large majority migrated), but high energetic status fish migrated faster. In a small-scale natural creek system, few age one fish migrated (11%); however, these few migrators were within the upper range of energetic status. In 2 year old trout, a high percentage became migrants (79%), and those with higher energetic status migrated at a faster speed. In a large-scale river system, successful downstream seaward migration for 2 year olds was low (9%) and independent of energetic status. Our findings provide valuable data for fisheries management because we show that age at release and energetic status prior to release can impact migration initiation and behaviors. Our findings also indicate that migration measured in the laboratory may over estimate migration in the wild, especially for younger, age one fish. More broadly, this work advances our understanding of this complex life history stage and the mechanisms involved in the initiation, behavior, and survival of migrating brown trout.
Introduction
Intra-population variation in migration behaviors are commonly observed in animal populations and can be an important component shaping population structure and viability (Chapman et al., 2011; Pulido, 2011; Avgar et al., 2013). Movement can be a response to adversity (Taylor and Taylor, 1977) and migration should be favored when the benefits outweighs the costs (Gross et al., 1988). Partial migration refers to the situation where both resident and migratory individuals breed in the same population. There is evidence to support that partial migration can be condition dependent and driven by environmentally responsive genetic thresholds that shape the migratory tendency across a range of animal species, including fish, mammals, and birds (reviewed in Chapman et al., 2011; Pulido, 2011; Avgar et al., 2013). In fish, partial migration has received particular attention, especially for anadromous salmonid populations where the consequences of migration may be profound in terms of fitness and ecosystem production (Chapman et al., 2012). In anadromous salmonids, juvenile migration from freshwater habitats to the sea is preceded by a physiological process preparing the fish for ocean life, i.e., smoltification. Smoltification generally takes place during the spring and affects the morphology, physiology, and the behavior of the fish; for instance, they become silvery in color, lose their positive rheotaxis and territoriality, increase their salinity tolerance and olfactory sensitivity among other things (McCormick et al., 1998; Jonsson and Jonsson, 2011). The decision to migrate, and hence undergo smoltification, is believed to occur during time periods (decision windows) several months before actual smoltification and downstream migration occurs (Thorpe et al., 1998). The decision may be controlled via genetically-based thresholds, where an individual's length, body condition, or energetic status is measured against a genetic threshold that varies between sexes and among individuals and populations (McCormick et al., 1998; Thorpe et al., 1998; Dodson et al., 2013).
Currently, we do not fully understand the effect of physiological state on juvenile migration in salmonids, especially for highly facultative migrating species such as the brown trout (Salmo trutta). Brown trout display a large variation in migration strategies, and there can be considerable variation in migration life-histories both within and between populations (Klemetsen et al., 2003; Cucherousset et al., 2005). Juvenile trout will either migrate to access more productive habitat (e.g., the sea or lake), sexually mature as a small resident, or potentially wait as a juvenile until a later decision window (Jonsson and Jonsson, 1993; Satterthwaite et al., 2009; Dodson et al., 2013). Ultimately, these alternative life history strategies have evolved to maximize reproductive success and has led to population resilience in variable environmental conditions (Jonsson and Jonsson, 2011). Proximately, the decision to migrate in brown trout can be affected by juvenile energetic status and energy (food resource) limitation in the natal habitat (Jonsson and Jonsson, 2011; Boel et al., 2014). Measures such as metabolic rate, growth rate, lipid levels, and condition factor are all indicators of an individual's energetic status, and changes in these measures are often associated with smoltification before downstream migration (reviewed in Wedemeyer et al., 1980; Jonsson and Jonsson, 2011; Ferguson et al., 2017). For wild fish, environmental food limitation (Olsson et al., 2006; O'Neal and Stanford, 2011), low body condition (Boel et al., 2014; Peiman et al., 2017), and high metabolic or growth rate (Forseth et al., 1999; Cucherousset et al., 2005) have all been associated with an increased likelihood of migration in brown trout; altogether, indicating that energetic status is an important proximate determinant of juvenile migration.
It is important to understand how energetic status affects juvenile brown trout migration propensity, distance, speed and success depending on fish size and age, especially in an aquaculture framework where effective production of hatchery reared smolt is highly warranted. Hatchery reared brown trout are released in large numbers globally to compensate for loss of natural production due to, for example, damming of rivers for hydropower production. The well-fed hatchery smolt are generally reported to be less successful at reaching the sea during downstream migration when compared to wild smolt (Serrano et al., 2009; Larsson et al., 2012). Excessive feeding in hatcheries also produces fast growing juveniles that quickly reach the size or condition that may activate smoltification (Thorpe et al., 1998). This has led to younger smolts being released from many hatcheries (e.g., at age one instead of age two; Hedman, 2011). Studies using reduced feeding regimes or periods of starvation (i.e., producing fish with lower energetic status) have found that more fish smoltified (Wysujack et al., 2009; Jones et al., 2015), migrated earlier (Vainikka et al., 2012), or migrated faster downstream (Lans et al., 2011; Larsson et al., 2012; Vainikka et al., 2012). But not all studies with hatchery-reared fish have found clear links between feed restriction and smoltifcation and/or migration speed and success (Davidsen et al., 2014; Näslund et al., 2017; Persson et al., 2018). The degree of feed deprivation, age of the fish, and precise timing of when treatments are applied may underlie the apparent variation in findings and be important factors contributing to migration “decisions” being made by juveniles (Thorpe et al., 1998).
To date, the majority of studies that have manipulated the quantity and/or quality of feed have done so to change long-term energy reserves (i.e., manipulations on the order of months), which would significantly reduce lipid stores, body mass, and condition (McCue, 2010; Bar, 2014). Few studies have manipulated short-term energy reserves (i.e., on the order of days) that would alter immediate hunger levels, which is—in part—triggered by an empty digestive track and rapidly declining glycogen reserves (Fletcher, 1984; McCue, 2010; Bar, 2014). Short-term feed deprivation may signal a less productive habitat to juveniles and may induce migratory behavior (Brodersen et al., 2008). Implementing short-term feed restrictions would be logistically practical for hatchery producers, and it would avoid any welfare concerns associated with long-term feed deprivation (e.g., increased fin damage, Persson and Alanärä, 2014). In this study, we tested how changes in long and/or short-term energetic status affected a suite of migration behaviors in hatchery reared brown trout. We induced four levels of energetic status by manipulating time when food was withheld: one with depleted short-term energy reserves (fed long-term, deprived short-term), one with depleted long-term energy reserves (deprived long-term, fed short-term) one with depleted short- and long-term energy reserves (deprived for entire study duration), and one un-deprived control (fed for entire study duration). We measured the effect of these regimes on energetic status using fish condition factor, a good and non-invasive proxy for energetic status (Persson et al., 2018). We implemented this study for both 1 and 2 year old fish and measured migration across three spatial scales using controlled laboratory migration pools, in the field across a small spatial scale in a creek, and across a large spatial scale in a river system. Most previous studies have also tended to exclusively focused on a single age/size class and only addressed migration effects in the field, which may mask behavioral effects due to influence of biotic and abiotic factors beyond control, such as predation.
Materials and Methods
The study was conducted in three parts (Table 1). Part one assessed migration in the laboratory using experimental migration pools and passive integrated transponder tags and antennas (i.e., a PIT tag tracking system). Part two assessed migration across a small spatial scale in the wild using PIT tag antennas and tagged individuals in a small creek. Part three assessed large-scale migration in the wild using acoustic telemetry to track migration of tagged individuals in a river. The three parts of this study used the same fish husbandry and feeding treatments. The migration portions of this study were timed to coincide with peak wild brown trout smolt migration in this system, which is typically late May to the end of June with some variation each year related to temperature. We first outline the general methods common to all experiments (husbandry, tagging, feeding treatments), and then follow this with specific details for each migration experiment.
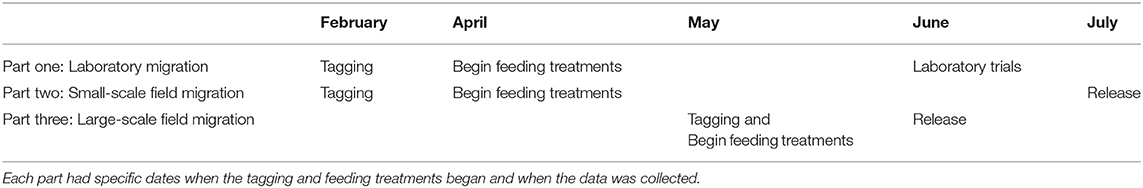
Table 1. A timeline detailing when each part of the study was conducted over the winter/spring of 2017.
Fish Source and Husbandry
The study took place at Norrfors research laboratory at the Norrfors fish hatchery (63°52'N 20°01'E), alongside Ume River outside Umeå, Sweden in 2017. Brown trout are annually released as smolts from the hatchery at both age one and age two. Fish were produced at the Norrfors fish hatchery following standard procedures: the hatchery population of juveniles is derived from a mix of sea-run returning spawners that are of wild and hatchery-origin (released as smolts) and are caught at the fish ladder at the Norrfors hydropower dam every year. On February 23, a subsample of individuals from the age one and age two cohorts were collected from the hatchery stock and moved to the research laboratory. The hatchery and research laboratory use a flow through circulation system from the adjacent Ume River, causing water temperature to vary with river conditions. Numerous windows allowed for semi-natural circadian light rhythms (63°N).
Fish Tagging and Feeding Treatments
Before placing fish in a feeding treatment, they were tagged using PIT-tags (HPT12, Biomark USA; 12.5 × 3 mm, 0.1 g) and/or acoustic transmitters (v5-180 khz, Vemco; 11 × 3.6 × 5.7 mm, 0.24 g) for later identification. Both tag types did not weight more than 5% of fish body mass (see Supplementary Table S1 for further details on tag dimensions and weights). Fish were anesthetized using diluted tricaine methanesulfonate (MS-222) and tagged using scalpel incision (tag placed in the intraperitoneal cavity). Morphological measurements of total length (mm) and body mass (g) were recorded. Fish were then placed in separate flow through tanks based on age cohort. Tanks were made of opaque glass fiber with a diameter of 1 m and had a water depth of 40 cm. Age one individuals were placed in eight tanks with a density of N = 75 per tank. Age two individuals were placed in 16 tanks with a density of N = 38 per tank. Fish were drawn from these housing tanks for the laboratory and creek migration experiments (further described, sections Part One: Laboratory Migration and Part two: Small-Scale Field Migration, below).
After tagging, water temperature was too cold to induce feeding (~0°C), and fish were therefore not administered their feeding treatments until after April 1 (or later for acoustic tagged fish). Four feeding treatments were created to produce fish with varying energetic status by manipulating long- and short-term energy reserves (measured using the change in condition factor from pre- to post-feeding treatment). The start of the feeding treatment, duration, and the final number of fish per treatment varied with experiment, see Tables 1, 2 and Supplementary Table S2 for details. The first treatment group comprised of individuals that were food deprived for the entire duration of the treatment period to create fish with low long- and short-term energy reserves (DD, “deprived”-“deprived”). The second treatment group was food deprived until 72 h before the behavioral measures commenced, at which point the fish were fed standard daily portions (described below) to create fish with low long-term energy reserves and high short-term energy reserves (DF, “deprived”-“fed”). The third treatment group was fed standard daily portions until 72 h before the behavioral measures commenced, at which point they were food deprived (FD, “fed”-“deprived”) to create fish with high long-term energy reserves but low short-term energy reserves. The fourth treatment group were fed standard daily portions for the entire duration of the treatment period (FF, “fed”-“fed”) to create fully fed fish with high long- and short-term energy reserves. The 72 h duration of the short-term treatment ensured that the fish had an empty stomach (i.e., being hungry), because trout have a gastric evacuation rate of <24 h at the water temperature during our treatments (10–12°C, Elliot, 1972). Treatments were administered equally over the holding tanks and age cohorts. Feed was 1.1 mm sinking pellets for the age 1 fish and 2 mm floating pellets for the age 2 fish (Inicio plus and Inicio 917, BioMar; www.biomar.se) administered in daily standard portions of 45 g until June 16, where the ration increased to 55 g. This amount and quality of the feed has been shown to be sufficient for hatchery reared salmonid juveniles (Alanärä et al., 2014; Persson et al., 2018). Feed was distributed using automatic feeders (TDrum 2000 feeders from Arvo-Tec; www.arvotec.fi) regulated with timer control (Sterner Fish Tech AS; www.fishtech.no).
Table 2. Total number of fish used, mean ± (s.d.) pre- and post-treatment mass, mean ± (s.d.) pre- and post-treatment total length (TL), and number and percentage of fish that were classified as migrating during each part of this study.
Part One: Laboratory Migration
To measure migration in the laboratory, two identical circular concrete pools (diameter: 11 m) were modified into experimental streams following previous methods (Hellström et al., 2016; Persson et al., 2018; Figure 1). Briefly, boundaries were constructed to form a stream course along the outer edge of the pool, which measured 30.1 m in length, 1.5 m wide, and had a water depth of ~33 cm. For each pool, a portion of the stream concaved (Figure 1) and had a shelter structure (40-cm polyvinyl chloride (PVC) pipe cut lengthwise). Two pass-through PIT-tag antennas (Biomark Inc.; www.biomark.com) with accompanying HPR plus tag readers (Biomark Inc.; www.biomark.com) were placed within each stream, ~6 m apart. Stream flow was counter-clockwise throughout the study and kept at a constant velocity for the duration of the study (~ 0.17 m/s, electromagnetic flow meter, Valeport Model 801).
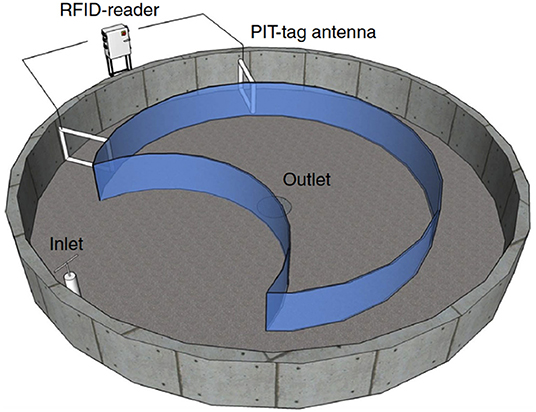
Figure 1. Illustration of migration pool for laboratory migration study. Illustration re-printed with permission and adapted from Hellström et al. (2016).
The laboratory migration trials were conducted between June 15—June 29, 2017. Three trials were conducted per migration pool (i.e., six replicates) with a staggered start (see Supplementary Table S2). Within a trial, 20 individuals from each of the four treatment groups were haphazardly selected from each cohort and released into each pool, resulting in 160 fish per pool, per trial. Each trial lasted for 72-h, during which fish migratory behavior was continuously measured using PIT-tag antenna detections. Fish were not fed in the migration pools. After the 72-h period, individuals were removed and euthanized (via cerebral concussion). Total length (mm) and body mass (g) were again collected (Table 2).
Individuals were assigned as either a “migrator” if they obtained at least 10 detections on both PIT-tag antennas in an alternating, consecutive order (i.e., signifying a direction of movement pass the first antenna to the second, back to the first), or “non-migrator” if they had <10. In most individuals a clear pattern of either “migrator” or “non-migrator” was observed, with most migrators having over 200 detections (see Supplementary Figures S1A,B for examples). See the Supplementary Materials for information on the detection efficiency of the antennas. Number of detections per individual was used as a proxy measure of migration distance under laboratory conditions. Individual lap times were calculated by taking the difference in time between detections on the same antenna. Because some individuals lingered in the antenna detection range causing multiple detections within a short timespan a minimal lap time of 10 s was enacted to reduce detection noise. Additionally, not all individuals migrated continuously. To ensure an accurate measure of active swimming that excluded rest time, laps that were longer than 90 s were excluded. Visually inspecting detection-time histograms and identifying the common time when the trough following the first peak of detections occurred determined this cut-off.
Part Two: Small-Scale Field Migration
On July 7 2017, a subsample of trout from all treatment groups and both cohorts were released into a natural creek habitat (Table 1). The creek was 1–3 m in width, of variable depth from 0.3 to 0.7 m in depth, contained natural complex structure (e.g., boulders, cobble), overhanging branches from the surrounding forest environment, and curvature (e.g., many small bends in the creek's path). Individuals were anesthetized (MS-222) 24 h before release and measured for total length (mm) and body mass (g). The creek was ~240 m in length, with the release site located at the origin. Within this creek, two PIT-tag antennas and accompanying HPR plus tag readers were installed to track fish downstream migration. The first antenna was located ~110 m downstream from the release site, whilst the second antenna was located ~87 m downstream from the first antenna (Figure 2A). Both antennas were run continuously for 10 days after release. Fish released in the creek were later categorized as either “migrators” or “non-migrators” based on whether they were detected crossing the first and second downstream PIT-tag antenna. Migration due to density dependent reasons was thought to be negligible since most of the 2 year olds were expected to leave the creek soon after release and the complex habitat from the release site to the first antenna offered plenty of holding opportunities [additionally, the highest density of 1+ brown trout in the wild in Västerbotten, Sweden was estimated at 55 fish per 100 m2 (unpublished results), and the density of fish in the creek in our study would have been ~60 fish per 100 m2 if all fish stayed and did not leave the creek, see Results]. However, we cannot rule out that some migration movements were by residents exploring the creek environment or that some fish may have migrated past the antennas locations after the 10 day post-release monitoring period. See the Supplementary Materials for information on the detection efficiency of the antennas in the creek.
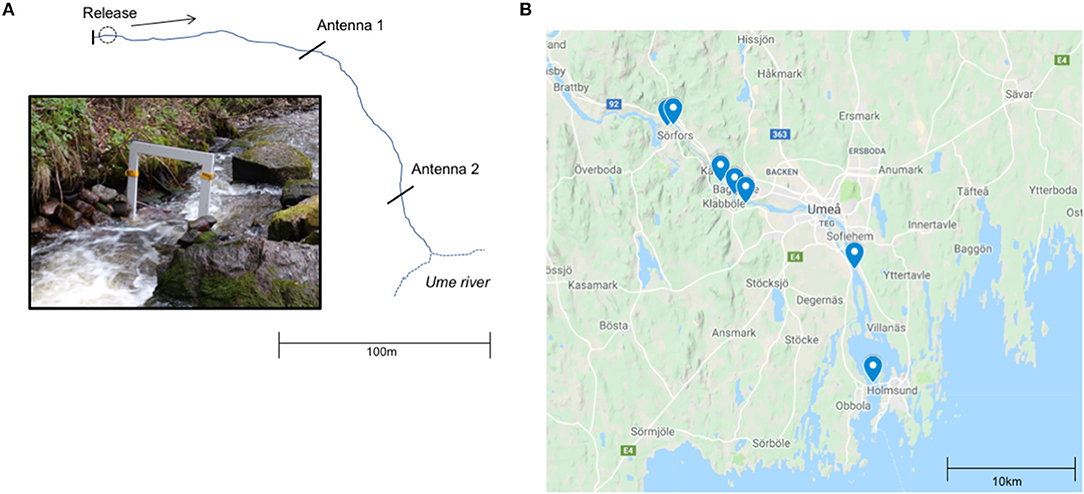
Figure 2. (A) Illustration of creek antenna set-up for the small-scale migration study (Part 2) adapted from McCallum et al. (2019). Individuals were released at the origin of the creek and their downstream migration out to Ume River were tracked by two PIT-tag antennas. (B) Map of acoustic receiver locations in the Ume River used in large-scale field migration study. The creek is located directly upstream of the first receiver, as the creek joins the river at this location 63.88N, 20.026E (Part 3) map created with Google Maps.
Part Three: Large-Scale Field Migration
On May 3 2017, 42 individuals from the age two cohort were selected, anesthetized (MS-222), and surgically tagged in the intraperitoneal cavity with both a PIT-tag (12 mm) and an acoustic tag (Vemco v5-180 khz). The tag transmitted every 0.7 s on the HR coding scheme, and every 30 s on the PPM coding scheme (Guzzo et al., 2018). After tagging the fish were returned to their tank where one of the four feeding treatments began for five more weeks. On June 7, all individuals were again anesthetized (MS-222) and measured for length (mm) and weight (g). After a 24-h recuperation period, they were released into the same natural habitat used for the small-scale field migration. The creek flows directly into the Ume River, which in turn enters the Gulf of Bothnia 30 km downstream. The creek flows into the old river bed of the Ume River about 32 km from the coast of the Bothnian Bay. The annual discharge of the main Ume River is ~460 m3/s and due to the hydropower plant Stornorrfors there is this 8 km long section of old river bed where the discharge varies between 10 and 50 m3/s between May 20 and October 1 with higher flows at spring flood and special occasions. For more detailed description of the river system please see Persson et al. (2019). To track the migration in the river, 14 acoustic receivers (Vemco 180 khz VR2W & HR2) were deployed at seven locations dispersed along the river to the sea (Figure 2B). One receiver was also deployed 1.27 km upstream the mouth of the creek to monitor if the fish migrated upstream in the river. Receivers operated continuously from the date of release until September 27, 2017.
Statistical Analyses
General Approach
Feeding treatment was used as the explanatory variable and treated as a four-level fixed factor (DD, DF, FD, FF) in all analyses outlined in detail below, unless otherwise stated. The main effect of feeding treatment was inferred using an ANOVA or likelihood ratio test, followed by Tukey's post-hoc analyses to distinguish between treatment levels if needed. In all analyses, we conducted separate models for each age cohort. Model assumptions were visually checked using quantile–quantile and residuals-vs.-fitted diagnostic plots, as well as Shapiro-Wilk and Breusch-Pagan tests. Data were transformed when necessary to meet model assumptions (log or power transformations). Analyses were done in the statistical software R (R Core Team, 2017), using base R and the packages lme4 (Bates et al., 2015), interval (Therneau, 2015), and survival (Fay and Shaw, 2010) when necessary.
Effect of Feeding Treatment on Body Condition
To determine whether feeding treatment affected fish body condition, the change in Fultons condition factor (Fulton, 1904; hereafter, condition factor) between the start and end of the study was calculated for each fish.
In all three parts of the study, linear mixed effect model (LMM) or linear model (LM) was used to assess if feeding treatment affected body condition, where the change in condition was the response variable. A random effect of trial ID (migration pool replicate) was included as a random effect for the laboratory study analysis to account for staggered start trial start times (see Supplementary Table S2).
Part One: Laboratory Migration
For the age two cohort in Part one, feeding treatment was modeled as a two-level factor (“fed” and “deprived”) as the treatment groups FD and FF could not be unambiguously distinguished due to a logistical error during the final short-term feeding treatment. The same applied to the DF and DD treatments. Fish were hence pooled into a “fed” (i.e., FD & FF) and a “deprived” (i.e., DF & DD) treatment group (see Table 2) using relative condition factor (see Supplementary Materials).
To determine the effect of treatment on the probability that a fish from either cohort would migrate or not, a generalized linear mixed effects model (GLMM) with binomial errors was applied, using migration as a binary response variable (migrating/not migrating) and feeding treatment as a fixed effect. A separate binomial GLMM was used to test if final condition factor predicted probability of migration, with migration as a binary response and final condition factor as a continuous predictor. The effect of feeding treatment on migration distance (number of detections) was tested using a negative binomial GLMM appropriate for over-dispersed count data. To test the effect of feeding treatment on lap time, the mean lap time of an individual was used as a response variable in a LMM. In all the above analyses, trial ID (migration pool replicate) was included as a random effect.
Part Two: Small-Scale Field Migration
The effect of feeding treatment on the probability to migrate was tested using a GLM with binomial errors, treating migration as a binary response variable (migrating/non-migrating). A separate binomial logistic GLM was used to test if final condition factor predicted probability of migration, with migration as a binary response and final condition factor as a continuous predictor. The effect of feeding treatment on migration speed in the creek was tested using a LM, treating the difference in time between detection at the first and the second antenna per individual as a response variable and feeding treatment as fixed effect.
Part Three: Large-Scale Field Migration
Migration success (detection from one receiver to the next) of the released individuals was performed using an interval-censored survival analysis. Each receiver acted as intervals and time of unique last detection for each individual at each receiver was used to determine an individual's last interval of survival. To test whether the survival (or distance moved) of the juveniles varied with feeding treatment, we used a non-parametric maximum likelihood (NPMLE) permutation test suitable for interval-censored data with small sample sizes (Fay and Shaw, 2010; Therneau, 2015).
Results
Part One: Laboratory Migration
Feeding increased condition factor in both age cohorts [Age one: LMM N = 237, F(3, 229) = 229, P < 0.0001; Age two: LMM N = 255, F(1, 249) = 221, P < 0.0001; Figures 3A,B]. Within the age one cohort, fish from the FF and FD treatments had a greater change in condition factor than the DF and DD treatment groups, which were not statistically different from each other (Tukey, all contrasts P < 0.001 except DD-DF P = 0.91; Figure 3A).
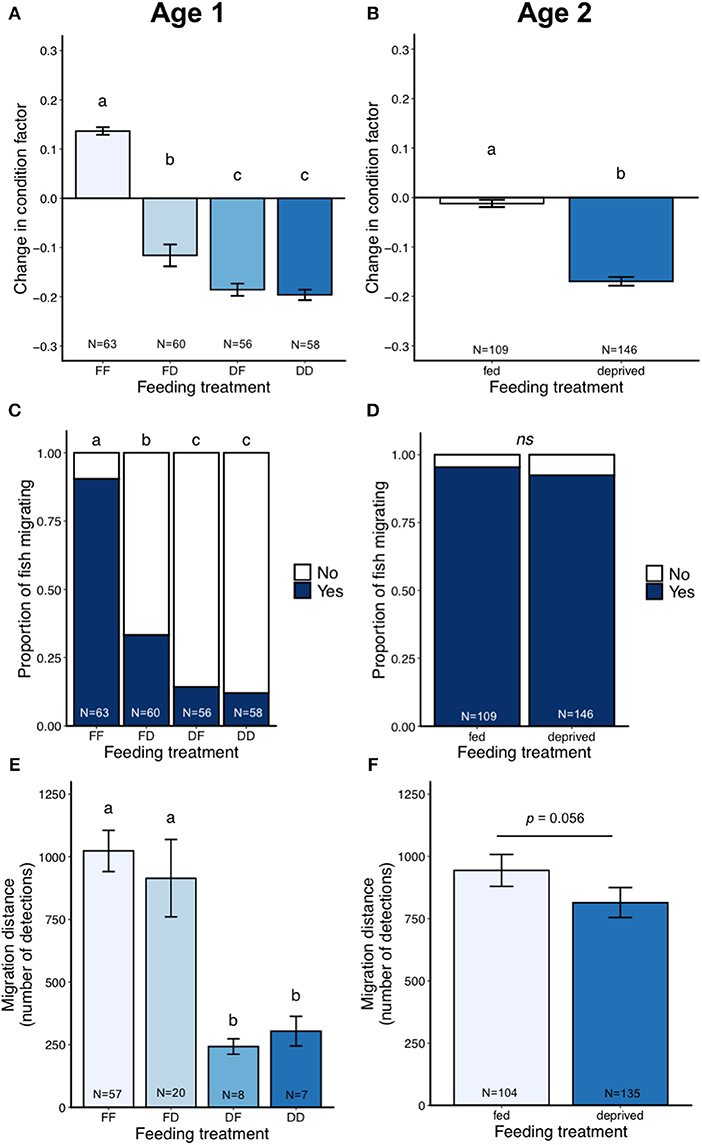
Figure 3. Results from the laboratory migration study (part one), showing change in condition factor (A,B), proportion of fish migrating (C,D), and migration distance (number of detections) in the migration pool (E,F) for the age one and age two cohorts. Error bars represent ± 1 standard error of the mean. Different letters show statistical differences among treatment groups.
There was a large difference between the age cohorts in the proportion of fish migrating (Table 2). For the age one cohort, only 39% of the fish migrated in the migration pools, while 94% of the age two fish migrated. In the age one cohort, FF and FD individuals were more likely to migrate than both the food deprived treatments (Binomial GLMM N = 237, LRT = 126, P < 0.0001, Figure 3C; Table 2; Tukey, FD-FF Z = 5.23 P < 0.001, DF-FF Z = 6.34 P < 0.001, DD-FF Z = 6.54 P <0.001, DF-FD Z = 2.62 P = 0.04, DD-FD Z = 3.04 P = 0.012). Regardless of treatment, age one fish with higher condition factor at the end of the experiment were more likely to migrate (Binomial GLMM, N = 237, LRT = 146.91, P < 0.0001; Figure 4A). In the age two cohort, almost all fish were migrating and feeding treatment did not affect whether or not a fish migrated (Binomial GLMM, N = 255, LRT = 0.95 P = 0.33; Figure 3D). Likewise, condition factor at the end of the experiment did not predict if age two fish would migrate (Binomial GLMM, N = 255, LRT = 0.51 P = 0.47; Figure 4B).
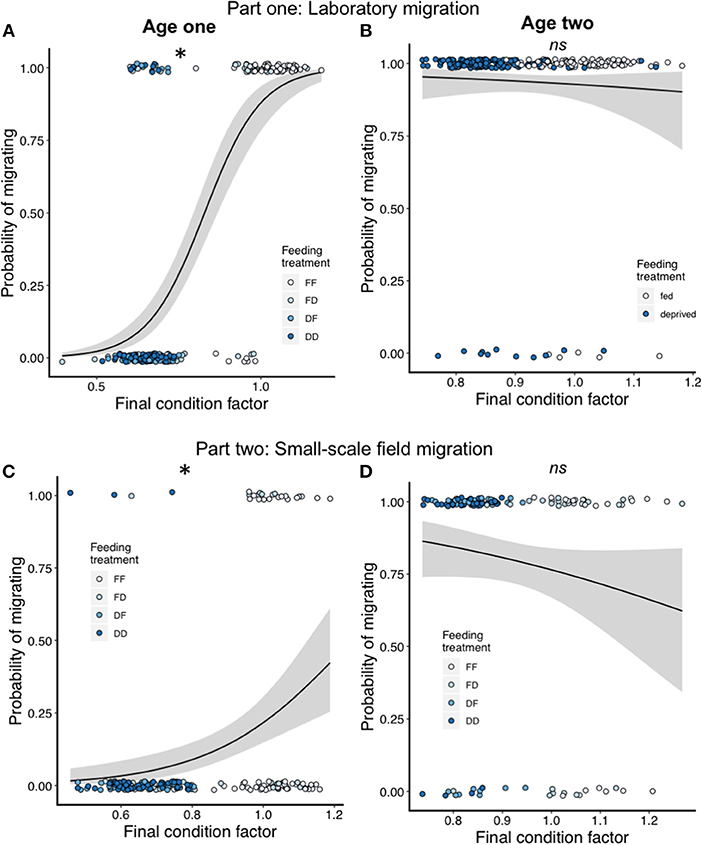
Figure 4. Effect of final condition factor on the probability of migration for age one (A) and age two (B) fish in the laboratory migration study (part one); for age one (C) and age two (D) fish in the small-scale field migration study (part two). In all panels the solid line shows the mean with the shaded ribbon showing the 95% confidence interval of the mean. Feeding treatment groups are shown in different colors for reference, but were not included in the statistical models for these analyses. *indicates p < 0.05; ns indicates non-significant.
Of the fish that were actively migrating, age one fish that were fed (FF, FD) migrated a further distance than fish that were food-deprived (DF, DD) (number of detections; Negative Binomial GLMM, N = 92, LRT = 43.4, P < 0.0001; Figure 3E; Tukey: DF-FF Z = −6.38 P < 0.001, DD-FF Z = −4.56 P < 0.001, DF-FD Z = −4.44 P < 0.001, DD-FD Z = −2.74 P = 0.03). Each treatment group migrated the equivalent of 30.8 (FF), 27.5 (FD), 7.3 (DF), or 9.2 (DD) km. In the age two cohort, fish from the fed treatment group tended to migrate a greater distance than the food deprived treatment group, but this did not reach significance (Negative Binomial GLMM N = 239, LRT = 3.65, P = 0.056; Figure 3F). Age two fish migrated the equivalent of 28.4 or 24.5 km in the fed and deprived treatments, respectively.
Feeding increased average lap time in age one fish [LMM N = 92, F(3, 88) = 14.4, P < 0.001; Supplementary Figure S2A]. The FF treatment group completed an average lap faster than both of the food deprived treatments (Tukey: DF-FF Z = 5.97 P < 0.001, DD-FF Z = 3.38 P = 0.004, DF-FD Z = 4.14 P < 0.001), with each treatment group taking an average ± s.d. of 1.02 ± 0.1 (FF), 1.07 ± 0.1 (FD), 1.20 ± 0.1 (DF), or 1.12 ± 0.2 (DD) min to complete a lap, which corresponds to a swimming speed of 0.49 (FF), 0.46 (FD), 0.42 (DF), and 0.44 (FF) m/s (relative to ground distance). Feeding also increased average lap time in age two fish [LMM N = 239, F(1, 232) = 18.2, P < 0.0001; Supplementary Figure S2B], with each treatment group taking an average ± s.d. of 0.93 ± 0.05 (fed) or 0.96 ± 0.06 (deprived) min to complete a lap, which corresponds to a swimming speed of 0.53 (fed) and 0.50 (deprived) m/s (relative to ground distance).
Part Two: Small-Scale Field Migration
Similar to the laboratory study, feeding treatment affected the change in condition factor for both age cohorts. In the age one fish, both fed treatment groups (FF, FD) had a more positive change in condition factor compared to the food deprived [LM, N = 194, F(3, 190) = 88.7, P < 0.0001; Tukey: all contrasts P < 0.001, except DD-DF P = 0.38; Figure 5A]. In the age two cohort, fed treatment groups also had larger positive change in condition factor compared to food deprived treatment groups [LM, N = 127, F(3, 123) = 94, P < 0.0001. Tukey: all contrasts P < 0.001 except FD-FF P = 0.0049; Figure 5B].
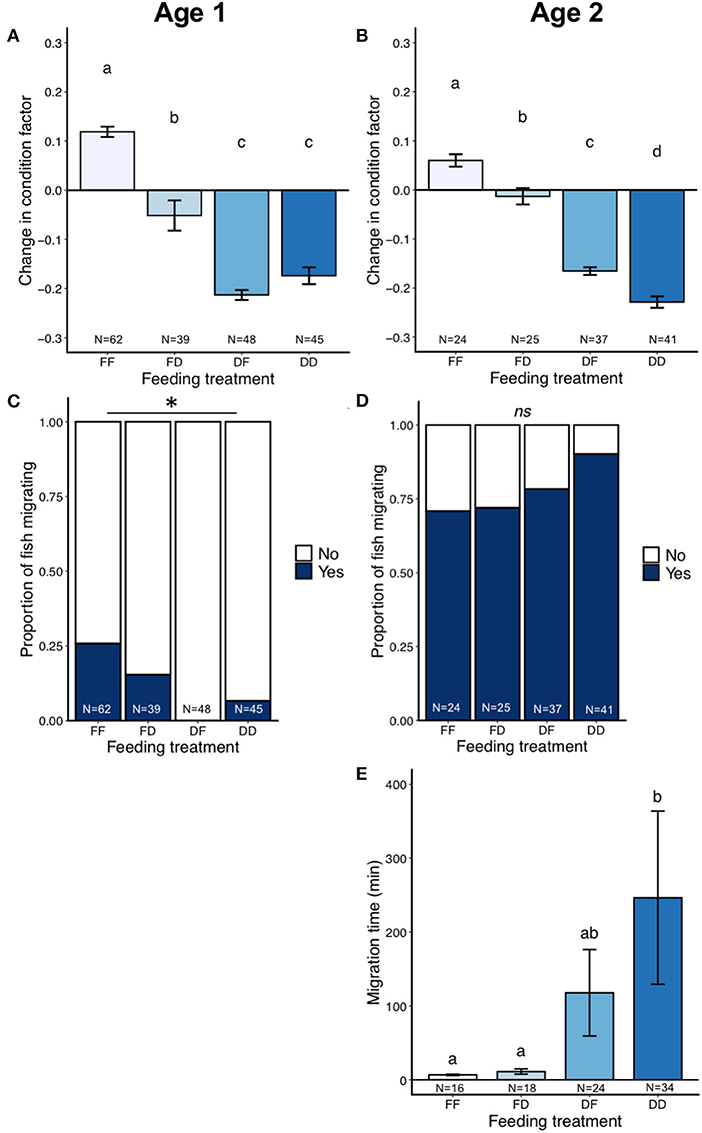
Figure 5. Results from the small-scale field migration study (part two), showing change in condition factor (A,B), proportion of fish migrating (C,D), and migration time between antennas in the creek (E) for the age one and age two cohorts. Error bars represent ± 1 standard error of the mean. Different letters show statistical differences among treatment groups. *indicates P < 0.05. Note: too few age one fish migrated to test for effects of feeding on migration time.
The proportion of age one fish migrating was low, with 11% of fish migrating past antenna 1 and only 4% of fish migrating past antenna 2. Feeding increased the probability that age one fish would migrate to antenna 1 in the field (Binomial GLM, N = 194, LRT = 22.3, P < 0.0001; Figure 5C). This effect was similar for antenna 2, but did not reach statistical significance (Binomial GLM, N = 194, LRT = 7.27, P = 0.064). Tukey post-hoc contrasts among all treatments were not possible because no fish migrated in the DF group (i.e., data separation; DD-FF Z = −2.38 P = 0.06, FD-FF Z = −1.22 P = 0.56, DD-FD Z = −1.26 P = 0.54; Figure 5C). In contrast, most fish migrated in the age two cohort with 79% of the fish migrating past antenna 1 and 77% migrating past antenna 2. There was no significant effect of feeding treatment on probability to migrate past antenna 1 (Binomial GLM N = 127, LRT = 5.28, P = 0.15; Figure 5D) or antenna 2 (Binomial GLM N = 127, LRT = 3.24, P = 0.36) in the age two cohort. Regardless of treatment, age one fish with higher condition factor at the end of the experiment were more likely to migrate (Antenna 1: Binomial GLM, N = 194, LRT = 19.6, P < 0.0001, Figure 4C; Antenna 2: Binomial GLM, N = 194, LRT = 4.65, P = 0.031). Condition factor at the end of the experiment did not predict if age two fish would migrate (Antenna 1: Binomial GLM, N = 127, LRT = 2.27, P = 0.13; Figure 4D; Antenna 2: Binomial GLM, N = 127, LRT = 0.26, P = 0.61).
The effect of feeding treatment on migration speed could not be analyzed in the age one cohort due to small sample size (i.e., very few individuals detected at the first or second antenna, Table 2). In the age two cohort, feeding increased migration speed (LM, N = 92, χ2 = 98.4, P = 0.0003; Figure 5E), with both fed treatment groups migrating faster than the food deprived treatment groups (Tukey: DF-FF t = 2.6 P = 0.05, DD-FF t = 3.7 P = 0.002, DD-FD t = 3.5 P = 0.005).
Part Three: Large-Scale Field Migration
As with the first two studies, feeding resulted in an increased change in condition factor [LM, N = 42, F(3, 38) = 7.07, P = 0.0007; Figure 6A], with change in condition factor declining with less feed (Tukey, DD-FF t = −4.2 P = 0.001, DD = FD t = −3.8 P = 0.003, remaining contrasts P > 0.1).
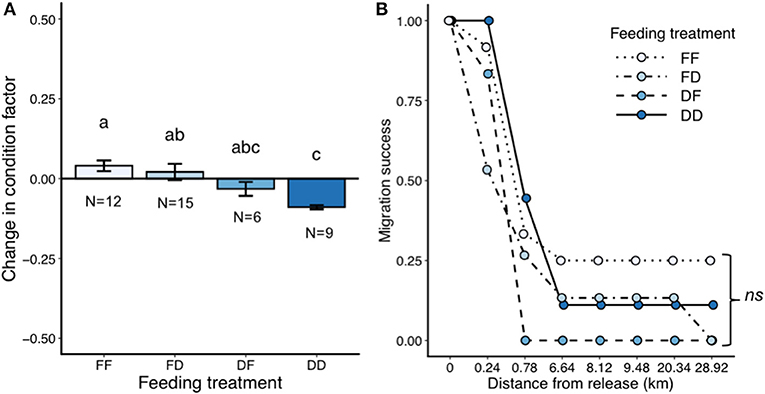
Figure 6. Results from the large-scale field migration study (part three), showing change in condition factor (A) and migration success in the field (B). Error bars represent ± 1 standard error of the mean. Different letters show statistical differences among treatment groups. Note: only age two fish were used in this study.
After release, 33 fish were detected leaving the creek and entered the river between 1 and 48 h later. Once in the river, detection numbers dropped to 12 unique individuals (28%) by 0.8 km from release site. By 8 km downstream from release site, only six unique individuals were detected and these six continued 20 km downstream, where only four were then detected in the river delta 29 km downstream. It took between 5 and 17 days for these four fish to migrate out of the river system. Three of the four out migrating fish were from the treatment group FF, while one was from treatment group DD. Feeding treatment had no effect on migration success (NPMLE permutation test, N = 42, χ2 = 6.84, P = 0.07; Figure 6B). In addition, five of the 42 released fish migrated upstream through a fish ladder to be detected on a receiver located in the reservoir above a large hydropower dam (1.3 km upstream the release site). Upstream migrating fish were not included in the survival analysis. Of these five fish, two came from the treatment group DD, two came from the treatment group FD, and one came from the treatment group FF.
Discussion
Efficacy of Feeding Treatments in Manipulating Energetic Status
As expected, the feeding treatments used in our study manipulated long-term energy reserves in brown trout (as measured by change in condition factor), even when the duration of treatment was as little as 5 weeks. The greatest difference was between the treatment groups with or without depleted long-term energy reserves (FF vs. DD groups). In contrast, the energetic status created from fish with altered short-term energy reserves (FD vs. DF) was often intermediate, less consistent across experimental contexts, and sometimes not statistically different from the long-term treatments. Previous studies have similarly used altered feeding regimes to manipulate long-term energy reserves (Wysujack et al., 2009; Lans et al., 2011; Persson et al., 2018), but the best of our knowledge, this is the first study to include very short-term feeding regime manipulations aimed at altering short-term energy reserves.
Laboratory and Small-Scale Field Studies: Migration Decisions and Migratory Behaviors
In both the laboratory and the small-scale field study, the majority of the age two fish migrated independent of their feeding treatment. This finding is in contrast to previous studies showing that starvation for a period of at least 5 months increased the proportion of trout that smoltified (Wysujack et al., 2009) and the proportion of migrating juvenile trout (Davidsen et al., 2014, see Midwood et al., 2016 for short-term effects). Our results suggest that migration for age two trout was independent of the energetic status in the spring (i.e., ish may have surpassed a size or condition threshold) and/or the decision to smoltify and migrate had been made before the feeding treatments started in April. It is well-established for Atlantic salmon that the switch for smoltification is activated during the late summer or early autumn prior to smoltification the following spring, and it is dependent on the physiological status of the fish and the rate of change of that status in relation to genetic thresholds (Thorpe et al., 1998). Regional environmental conditions may also influence these thresholds creating a gene-by-environment interaction (Økland et al., 1993; Jonsson and Jonsson, 2011). Persson et al. (2018) did not reverse the pathway toward smoltification and migration in Atlantic salmon despite very harsh starvation treatments during the winter and spring prior to migration. The authors concluded that the decision to migrate or threshold for migration may have been made or surpassed before their treatments began. Midwood et al. (2014) suggested that brown trout have an autumn activation window similar to Atlantic salmon, because the proportion of brown trout migrating in their study were unaffected by cortisol treatments in the spring. Näslund et al. (2017) found that reducing the feed ration in the laboratory for 1 month in October prior to migration decreased the proportion of wild juvenile brown trout that smoltified in spring. However, Jones et al. (2015) found that starvation over the prior autumn and winter did not predict which juvenile fish would smoltify, while starvation in the spring increased the likelihood of smoltification.
In contrast to the age two fish, feeding increased the proportion of age one fish migrating in both the laboratory and the small-scale field study. Thus, the proportion of migrating age one trout was modified by different feeding regimes during the spring, but in an opposite direction to the majority of previous studies with hatchery-reared brown trout (Wysujack et al., 2009; Davidsen et al., 2014; Jones et al., 2015). At the time of migration, the fed age one fish weighed 2.5–3 times more and had substantially higher condition factor compared to the age one fish that had been food deprived. Smoltification and juvenile migration are energetically costly processes for trout (Folmar and Dickhoff, 1980), and the age one fish with low energetic status might not have had enough energy to migrate. The average size of wild brown trout smolts from the rivers in the region of this study is 150–225 mm (Larsson et al., 2012; data collected within the European Data Collection Framework, ICES International Cooperation for Exploration of the Sea, 2018), which is larger than the size of the food deprived age one trout in our study (average length 116–119 mm; Table 2). Deprived age one fish in our study may not have reached sufficient size and/or energetic status to become smolt and therefore postponed migration, unlike age two fish that migrated despite a period of starvation. Most studies investigating effects of energetic status on hatchery reared trout migration have used age two juveniles. Yet, age one smolt are very common in hatcheries today (ICES International Cooperation for Exploration of the Sea, 2018) and age one smolts also occur in nature at southern latitudes (L'Abée-Lund et al., 1989). Our results show the importance of also considering younger age classes when conducting smolt migration studies as the response may differ across ontogeny.
For both ages in our study, high energetic status increased the lap time and the distance migrated (together, per unit time: migration speed). High migration speeds may have implications for fitness, because smolt that spend more time in the river have been shown to experience decreased energetic status and survival (Thorpe and Morgan, 1978; Peake and McKinley, 1998; Aarestrup et al., 2005; Salminen et al., 2007). In our study, fish with low energetic status may have been too depleted of energy to keep a similar migration speed as fish of higher energetic status. Also, in a natural river environment, fish with low energetic status may divert time from migration to feed and sustain the energy needed for migration. Boel et al. (2014) found that smolt with the lowest energetic status were more likely to stop at the first feeding opportunity compared to smolt of intermediate energetic status that migrated the longest distance (fish with the highest energetic status stayed as resident in the river in their study). Of the few studies that have investigated impact of energetic status on migration speed in trout, both Lans et al. (2011) and Larsson et al. (2012) found that starvation increased migration speed, while Davidsen et al. (2014) could not determine any effect. Noteworthy is that all of these studies were performed in the field by tracking smolt migration in the river and may therefore not be fully comparable with our laboratory and small-scale field study.
We did not find any clear effects of the treatment aimed to manipulate short-term energy reserves or “hunger” on the probability, speed or distance of trout migration. As the levels of glycogen influence the capacity for physical activity and endurance in fish (Hammer, 1995), we expected these short-term depleted fish to migrate slower or a shorter distance than fish that were fed. Contrarily, one could also expect “hunger” to increase migration speed as “hunger” is known to increase risk taking behavior in fish (Pettersson and Brönmark, 1993), and increased risk-taking has been linked to increased migration intensity in Atlantic salmon smolt (Hellström et al., 2016). The lack of effect seen in this study may indicate that the 72 h starvation period was too short to alter migration due to “hunger” in the well fed fish (FD), or due to replenished energy reserves in food deprived fish (DF). It is also possible that the behavioral effects of temporary “hunger” vary more among individuals than their responses to the long-term feeding treatment.
Large-Scale Field Migration
We could not detect any effect of feeding treatment on migration success in age two fish in the large-scale field study. However, the sample size was very low because only four fish managed to reach the coast. The majority of fish did begin migrating (i.e., they left the release site in the creek), but quickly disappeared once reaching the main river, most likely due to avian or piscivorous predators that are abundant in the area. Mortality can be high during in-river migration for brown trout smolt (Thorstad et al., 2012), especially for hatchery reared smolt who lack predator experience (Huntingford, 2004). High predation may mask any effect of energetic status on migration, and a larger sample size would be needed to discern any difference between treatments in the river system used in this study. It is noteworthy that five of the fish undertook a substantial upstream migration in the river, even navigating a long fish ladder. Similar extensive upstream migration could not be detected either in the laboratory migration pool or in the small creek, highlighting the importance of investigating aspects of salmonid migration over multiple scales. We also cannot exclude that this behavior was a consequence of being predated by a larger upstream migrating predator.
Conclusions
Our findings show that high energetic status in 1 and 2 year old brown trout increased swimming speed and migration distance. We also showed that the proportion of migrating age one fish can be modified by manipulating the energetic status during early spring, but that the same manipulation does not affect the proportion of migrating age two fish. These findings suggest that there are different thresholds or windows of activation (or potentially inhibition) that vary with age or physiological aspects related to age (size, growth, energetic status etc.). Specific to our study, fed 1 year old fish that were large and in good condition migrated, whereas deprived 1 year old fish that were smaller and in poorer condition appeared to delay migration for another year, and almost all 2-year old fish migrated regardless of condition because a threshold or migration decision was surpassed prior to the treatments. This study is one of very few that has tested the effect of energetic status on juvenile migration over multiple spatial scales, and the fact that the results were largely repeatable both in the laboratory setup and in the small-scale field study suggests high confidence in the results. Our results also suggest reconsidering the previous recommendations for more restrictive feeding regimes in hatcheries to enhance migration (Serrano et al., 2009; Larsson et al., 2012). Future studies should aim to identify when in time juvenile trout makes the decision to smoltify by tracking the energetic status of juveniles over longer periods, if possible from birth until smoltification and migration.
Data Availability Statement
The datasets generated for this study are available in the Supplementary Material and on request from the corresponding author.
Ethics Statement
This study and the methods used within it were approved under animal ethics permit a11-13 to AA and a20-18 to GH from Jordbruksverket.
Author Contributions
SS, GH, LP, and AA designed this study. SS and EM collected the data and conducted the statistical analyses. GH and EM wrote the manuscript together, with input from SS, LP, and AA. GH and AA secured the funding for this study.
Funding
This research was supported by an Energiforsk grant VK12006 to AA and GH.
Conflict of Interest
The authors declare that the research was conducted in the absence of any commercial or financial relationships that could be construed as a potential conflict of interest.
Acknowledgments
The authors would like to thank the Vattenfall Norrfors fish hatchery staff and Daniel Cerveny for laboratory assistance.
Supplementary Material
The Supplementary Material for this article can be found online at: https://www.frontiersin.org/articles/10.3389/fevo.2019.00411/full#supplementary-material
References
Aarestrup, K., Jepsen, N., Koed, A., and Pedersen, S. (2005). Movement and mortality of stocked brown trout in a stream. J. Fish Biol. 66, 721–728. doi: 10.1111/j.0022-1112.2005.00634.x
Alanärä, A., Schmitz, M., and Persson, L. (2014). Functional Methods to Farm Physiologically Wild Like Atlantic salmon Smolt (in Swedish with Extended English Summary). Elforsk rapport, 14(02). Available online at: https://energiforskmedia.blob.core.windows.net/media/18416/funktionella-metoder-foer-odling-av-fysiologiskt-naturanpassad-laxsmolt-energiforskrapport-2014-2.pdf
Avgar, T., Street, G., and Fryxell, J. M. (2013). On the adaptive benefits of mammal migration. Can. J. Zool. 92, 481–490. doi: 10.1139/cjz-2013-0076
Bar, N. (2014). Physiological and hormonal changes during prolonged starvation in fish. Can. J. Fish. Aquat. Sci. 71, 1447–1458. doi: 10.1139/cjfas-2013-0175
Bates, D., Maechler, M., Bolker, B., and Walker, S. (2015). Fitting linear mixed-effects models using lme4. J. Stat. Softw. 67, 1–48. doi: 10.18637/jss.v067.i01
Boel, M., Aarestrup, K., Baktoft, H., Larsen, T., Søndergaard Madsen, S., Malte, H., et al. (2014). The physiological basis of the migration continuum in brown trout (Salmo trutta). Physiol. Biochem. Zool. 87, 334–345. doi: 10.1086/674869
Brodersen, J., Nilsson, P. A., Hansson, L. A., Skov, C., and Brönmark, C. (2008). Condition-dependent individual decision-making determines cyprinid partial migration. Ecology 89, 1195–1200. doi: 10.1890/07-1318.1
Chapman, B. B., Brönmark, C, Nilsson, J. Å., and Hansson, L. A. (2011). The ecology and evolution of partial migration. Oikos 120, 1764–1775. doi: 10.1111/j.1600-0706.2011.20131.x
Chapman, B. B., Skov, C., Hulthén, K., Brodersen, J., Nilsson, P. A., Hansson, L. A., et al. (2012). Partial migration in fishes: definitions, methodologies and taxonomic distribution. J. Fish Biol. 81, 479–499. doi: 10.1111/j.1095-8649.2012.03349.x
Cucherousset, J., Ombredane, D., Charles, K., Marchand, F., and Baglinière, J.-L. (2005). A continuum of life history tactics in a brown trout (Salmo trutta) population. Can. J. Fish Aquat. Sci. 62, 1600–1610. doi: 10.1139/f05-057
Davidsen, J. G., Daverdin, M., Sjursen, A. D., Rønning, L., Arnekleiv, J. V., and Koksvik, J. I. (2014). Does reduced feeding prior to release improve the marine migration of hatchery brown trout Salmo trutta smolts? J. Fish Biol. 85, 1992–2002. doi: 10.1111/jfb.12485
Dodson, J. J., Aubin-Horth, N., Thériault, V., and Páez, D. J. (2013). The evolutionary ecology of alternative migratory tactics in salmonid fishes. Biol. Rev. 88, 602–625. doi: 10.1111/brv.12019
Elliot, J. M. (1972). Rates of gastric evacuation in brown trout, Salmo trutta L. Freshwater Biol. 2, 1–18. doi: 10.1111/j.1365-2427.1972.tb01575.x
Fay, M. P., and Shaw, P. A. (2010). Exact and asymptotic weighted logrank tests for interval censored data: the interval R package. J. Stat. Softw. 36, 1–34. doi: 10.18637/jss.v036.i02
Ferguson, A., Reed, T., McGinnity, P., and Prodohl, P. (2017). “Anadromy in brown trout (Salmo trutta): a review of the relative roles of genes and environmental factors and the implications for management and conservation,” in: Sea Trout: Science and Management: Proceedings of the 2nd International Sea Trout Symposium, ed G. Harris (Leicestershire: Troubador Publishing Ltd), 1–40.
Fletcher, D. J. (1984). The physiological control of appetite in fish. Comp. Biochem. Physiol. A Physiol. 78, 617–628. doi: 10.1016/0300-9629(84)90608-X
Folmar, L. C., and Dickhoff, W. W. (1980). The parr—Smolt transformation (smoltification) and seawater adaptation in salmonids: a review of selected literature. Aquaculture 21, 1–37. doi: 10.1016/0044-8486(80)90123-4
Forseth, T., Nesje, T. F., Jonsson, B., and Härsaker, K. (1999). Juvenile migration in brown trout: a consequence of energetic state. J. Anim. Ecol. 68, 783–793. doi: 10.1046/j.1365-2656.1999.00329.x
Gross, M. R., Coleman, R. M., and McDowall, R. M. (1988). Aquatic productivity and the evolution of diadromous fish migration. Science 239, 1291–1293. doi: 10.1126/science.239.4845.1291
Guzzo, M. M., Van Leeuwen, T. E., Hollins, J., Koeck, B., Newton, M., Webber, D. M., et al. (2018). Field testing a novel high residence positioning system for monitoring the fine-scale movements of aquatic organisms. Methods Ecol. Evol. 9, 1478–1488. doi: 10.1111/2041-210X.12993
Hammer, C. (1995). Fatigue and exercise tests with fish. Comp. Biochem. Physiol. A Physiol. 112, 1–20. doi: 10.1016/0300-9629(95)00060-K
Hedman, L. (2011). Försök med utsättning av ettårig smolt 2003 - 2005. Elforsk rapport 11(21). URL: https://energiforskmedia.blob.core.windows.net/media/18972/forsok-med-utsattning-av-ettarig-smolt-2003-2005-elforskrapport-2011-21.pdf
Hellström, G., Klaminder, J., Finn, F., Persson, L., Alanär,ä, A., Jonsson, M., et al. (2016). GABAergic anxiolytic drug in water increases migration behaviour in salmon. Nat. Commun. 7:13460. doi: 10.1038/ncomms13460
Huntingford, F. A. (2004). Implications of domestication and rearing conditions for the behaviour of cultivated fishes. J. Fish Biol. 65, 122–42. doi: 10.1111/j.0022-1112.2004.00562.x
ICES International Cooperation for Exploration of the Sea (2018). Report of the Baltic salmon and Trout Assessment Working Group (WGBAST), 20-28 March 2018. Turku, Finland. ICES CM 2018/ACOM:10: 369. Available online at: https://www.ices.dk/sites/pub/Publication%20Reports/Forms/DispForm.aspx?ID=34275
Jones, D. A., Bergman, E., and Greenberg, L. (2015). Food availability in spring affects smolting in brown trout (Salmo trutta). Can. J. Fish Aquat. Sci. 72, 1694–1699. doi: 10.1139/cjfas-2015-0106
Jonsson, B., and Jonsson, N. (1993). Partial migration: niche shift versus sexual maturation in fishes. Rev. Fish Biol. Fish. 3, 348–365. doi: 10.1007/BF00043384
Jonsson, B., and Jonsson, N. (2011). “Ecology of Atlantic salmon and brown trout: habitat as a template for life histories,” in Fish and Fisheries Series 33, ed D. L.G. Noakes (Heidelberg: Springer Verlag), 720. doi: 10.1007/978-94-007-1189-1
Klemetsen, A., Amundsen, P. A., Dempson, J. B., Jonsson, B., Jonsson, N., O'Connell, M. F., et al. (2003). Atlantic salmon Salmo salar L., brown trout Salmo trutta L. and Arctic charr Salvelinus alpinus (L.): a review of aspects of their life histories. Ecol. Freshw. Fish. 12, 1–59 doi: 10.1034/j.1600-0633.2003.00010.x
L'Abée-Lund, J. H., Jonsson, B., Jensen, A. J., Saettem, L. M., Heggberget, T. G., Johnsen, B. O., et al. (1989). Latitudinal variation in life history characteristics of sea-run migrant brown trout Salmo trutta. J. Anim. Ecol. 58, 525–542. doi: 10.2307/4846
Lans, L., Greenberg, L. A., Karlsson, J., Calles, O., Schmitz, M., and Bergman, E. (2011). The effects of ration size on migration by hatchery-raised Atlantic salmon (Salmo salar) and brown trout (Salmo trutta). Ecol. Freshw. Fish. 20, 548–557. doi: 10.1111/j.1600-0633.2011.00503.x
Larsson, S., Serrano, I., and Eriksson, L.-O. (2012). Effects of muscle lipid concentration on wild and hatchery brown trout (Salmo trutta) smolt migration. Can. J. Fish Aquat. Sci. 69, 1–12. doi: 10.1139/f2011-128
McCallum, E. S., Sundelin, A., Fick, J., Alanärä, A., Klaminder, J., Hellström, G., et al. (2019). Investigating tissue bioconcentration and the behavioural effects of two pharmaceutical pollutants on sea trout (Salmo trutta) in the laboratory and field. Aquat. Toxicol. 207, 170–178. doi: 10.1016/j.aquatox.2018.11.028
McCormick, S. D., Hansen, L. P., Quinn, T. P., and Saunders, R. L. (1998). Movement, migration, and smolting of Atlantic salmon (Salmo salar). Can. J. Fish Aquat. Sci. 55, 77–92. doi: 10.1139/d98-011
McCue, M. D. (2010). Starvation physiology: reviewing the different strategies animals use to survive a common challenge. Comp. Biochem. Physiol. A Mol. Integr. Physiol. 156, 1–18. doi: 10.1016/j.cbpa.2010.01.002
Midwood, J. D., Larsen, M. H., Aarestrup, K., and Cooke, S. J. (2016). Stress and food deprivation: linking physiological state to migration success in a teleost fish. J. Exp. Biol. 219, 3712–3718. doi: 10.1242/jeb.140665
Midwood, J. D., Larsen, M. H., Boel, M., Jepsen, N., Aarestrup, K., and Cooke, S. J. (2014). Does cortisol manipulation influence outmigration behaviour, survival and growth of sea trout? A field test of carryover effects in wild fish. Mar. Ecol. Prog. Ser. 496, 135–144. doi: 10.3354/meps10524
Näslund, J., Sundström, F. L., and Johnsson, J. I. (2017). Autumn food restriction reduces smoltification rate, but not over-winter survival, in juvenile brown trout Salmo trutta. Ecol. Freshw. Fish. 26, 205–216. doi: 10.1111/eff.12268
Økland, F., Jonsson, B., Jensen, A., and Hansen, L. (1993). Is there a threshold size regulating smolt size in brown trout and Atlantic salmon. J. Fish Biol. 42, 541–550. doi: 10.1111/j.1095-8649.1993.tb00358.x
Olsson, I. C., Greenberg, L. A., Bergman, E., and Wysujack, K. (2006). Environmentally induced migration: the importance of food. Ecol. Lett. 9, 645–651. doi: 10.1111/j.1461-0248.2006.00909.x
O'Neal, S. L., and Stanford, J. A. (2011). Partial migration in a robust brown trout population of a Patagonian river. Trans. Am. Fish. Soc. 140, 623–635. doi: 10.1080/00028487.2011.585577
Peake, S., and McKinley, R. (1998). A re-evaluation of swimming performance in juvenile salmonids relative to downstream migration. Can. J. Fish Aquati. Sci. 55, 682–687. doi: 10.1139/f97-264
Peiman, K. S., Birnie-Gauvin, K., Midwood, J. D., Larsen, M. H., Wilson, A. D., Aarestrup, K., et al. (2017). If and when: intrinsic differences and environmental stressors influence migration in brown trout (Salmo trutta). Oecologia 184, 375–384. doi: 10.1007/s00442-017-3873-9
Persson, L.A, Kagervall, K., Leonardsson, M., and Royan Alanärä, A. (2019). The effect of body size and energetic state on smolt migration in Atlantic salmon. Ecol. Freshwat. Fish. 28, 190–199. doi: 10.1111/eff.12442
Persson, L., and Alanärä, A. (2014). The effect of shelter on welfare of juvenile Atlantic salmon Salmo salar reared under a feed restriction regimen. J. Fish Biol. 85, 645–656. doi: 10.1111/jfb.12443
Persson, L., Leonardsson, K., and Alanärä, A. (2018). Manipulation of the energetic state of Atlantic salmon Salmo salar juveniles and the effect on migration speed. J. Fish Biol. 92, 961–978. doi: 10.1111/jfb.13555
Pettersson, L. B., and Brönmark, C. (1993). Trading off safety against food: state dependent habitat choice and foraging in crucian carp. Oecologia 95, 353–357. doi: 10.1007/BF00320988
Pulido, F. (2011). Evolutionary genetics of partial migration–the threshold model of migration revis (it) ed. Oikos 120, 1776–1783. doi: 10.1111/j.1600-0706.2011.19844.x
R Core Team (2017). R: A Language and Environment for Statistical Computing. R Foundation for Statistical Computing, Vienna. Available online at: https://www.R-project.org/
Salminen, M., Alapassi, T., and Ikonen, E. (2007). The importance of stocking age in the enhancement of River Kymijoki salmon (Salmo salar). J. Appl. Ichthyol. 23, 46–52. doi: 10.1111/j.1439-0426.2006.00794.x
Satterthwaite, W. H., Beakes, M. P., Collins, E. M., Swank, D. R., Merz, J. E., Titus, R. G., et al. (2009). Steelhead life history on California's central coast: insights from a state-dependent model. Trans. Am. Fish. Soc. 138, 532–548. doi: 10.1577/T08-164.1
Serrano, I., Larsson, S., and Eriksson, L. O. (2009). Migration performance of wild and hatchery sea trout (Salmo trutta L.) smolts-Implications for compensatory hatchery programs. Fish. Res. 99, 210–215. doi: 10.1016/j.fishres.2009.06.004
Taylor, L. R., and Taylor, R. A. J. (1977). Aggregation, migration and population mechanics. Nature 265, 415–421. doi: 10.1038/265415a0
Therneau, T. M. (2015). A Package for Survival Analysis in S. Version 2.38. Available online at: https://CRAN.R-project.org/package=survival
Thorpe, J. E., Mangel, M., Metcalfe, N. B., and Huntingford, F. A. (1998). Modelling the proximate basis of salmonid life-history variation, with application to Atlantic salmon, Salmo salar L. Evol. Ecol. 12, 581–599. doi: 10.1023/A:1022351814644
Thorpe, J. E., and Morgan, R. (1978). Periodicity in Atlantic salmon Salmo salar L. smolt migration. J. Fish Biol. 12, 541–548. doi: 10.1111/j.1095-8649.1978.tb04200.x
Thorstad, E. B., Whoriskey, F., Uglem, I., Moore, A., Rikardsen, A. H., and Finstad, B. (2012). A critical life stage of the Atlantic salmon Salmo salar: behaviour and survival during the smolt and initial post-smolt migration. J. Fish Biol. 81, 500–542. doi: 10.1111/j.1095-8649.2012.03370.x
Vainikka, A., Huusko, R., Hyvärinen, P., Korhonen, P. K., Laaksonen, T., Koskela, J., et al. (2012). Food restriction prior to release reduces precocious maturity and improves migration tendency of Atlantic salmon (Salmo salar) smolts. Can. J. Fish. Aquat. Sci. 69, 1981–1993. doi: 10.1139/f2012-119
Wedemeyer, G. A., Saunders, R. L., and Clarke, W. C. (1980). Environmental factors affecting smoltification and early marine survival of anadromous salmonids. Mar. Fish. Rev. 42, 1–14.
Keywords: behavior, smolt, salmonid, acoustic telemetry, PIT-tag, feeding, condition factor, hatchery
Citation: Shry SJ, McCallum ES, Alanärä A, Persson L and Hellström G (2019) Energetic Status Modulates Facultative Migration in Brown Trout (Salmo trutta) Differentially by Age and Spatial Scale. Front. Ecol. Evol. 7:411. doi: 10.3389/fevo.2019.00411
Received: 29 March 2019; Accepted: 15 October 2019;
Published: 13 November 2019.
Edited by:
Nathan R. Senner, University of South Carolina, United StatesReviewed by:
Martin Hage Larsen, The Danish Centre for Wild Salmon, DenmarkYolanda E. Morbey, University of Western Ontario, Canada
Copyright © 2019 Shry, McCallum, Alanärä, Persson and Hellström. This is an open-access article distributed under the terms of the Creative Commons Attribution License (CC BY). The use, distribution or reproduction in other forums is permitted, provided the original author(s) and the copyright owner(s) are credited and that the original publication in this journal is cited, in accordance with accepted academic practice. No use, distribution or reproduction is permitted which does not comply with these terms.
*Correspondence: Erin S. McCallum, ZXJpbi5tY2NhbGx1bSYjeDAwMDQwO3NsdS5zZQ==
†Present address: Samuel J. Shry, Länsstyrelsen Gävleborg, Gävle, Sweden