 Tara L. Crewe
 Greg W. Mitchell
 Maxim Larrivée
- 1National Data Center, Bird Studies Canada, Port Rowan, ON, Canada
- 2Wildlife Research Division, Environment and Climate Change Canada, Ottawa, ON, Canada
- 3Insectarium de Montréal, Montréal, QC, Canada
The eastern North American monarch butterfly population shows a long-term population decline. While it is hypothesized that forest loss on the wintering grounds and milkweed loss throughout the breeding range are responsible for the observed decline, there is much less certainty regarding the factors driving year-to-year variation around the current population level. Using 15 years of butterfly count data, we used a community-based approach to delineate the stage of the annual cycle during which population limiting factors are most strongly acting. We compared annual fluctuations in size of the breeding population of monarch butterflies in Canada to fluctuations in 13 additional butterfly species which either migrate long distances to Canada or are resident but breed in similar habitats to the monarch. We show that the breeding population of monarchs in southern Canada shows a higher degree of synchrony with other long-distance migrants than with breeding residents, and that annual fluctuations of all migrant butterflies show a positive correlation with the number of 21°C days during spring migration and re-colonization. Further, we found that size of the monarch breeding population shows a higher degree of synchrony with the size of the following winter population than with the size of the previous winter population. Combined, our results suggest that the monarch population in Canada is limited by factors acting during spring migration, and that weather plays an important role in the ability of the monarch to successfully re-colonize and breed in the northern portion of their summer range each year. A predicted increase in temperature in the early spring, combined with continued loss of breeding and wintering habitat, has the potential to limit the reproductive capacity of monarchs and their ability to recover from population lows.
Introduction
Monarch butterfly (Danaus plexippus) populations are declining throughout their eastern range, during all phases of the annual cycle (fall migration: Crewe and McCracken, 2015, but see Badgett and Davis, 2015; over-wintering: Thogmartin et al., 2017a; breeding: Pleasants and Oberhauser, 2013), and its migration is considered by some to be an endangered biological phenomenon (Brower et al., 2012). While it is generally hypothesized that milkweed loss throughout the monarch's breeding range and forest loss on the monarch's wintering grounds are largely responsible for the 84% population decline observed since the mid-1990s (Stenoien et al., 2016; Malcolm, 2017; Thogmartin et al., 2017b), there is much less certainty regarding the primary factors driving year-to-year variation around the overall negative population trend. For example, Thogmartin et al. (2017b) found that early warm temperatures in the northern breeding range negatively affected population size on the wintering grounds the following winter, but that warmer temperatures later in the season had a positive effect, likely due to effects on the growing conditions for milkweed. Conversely, Badgett and Davis (2015), Ries et al. (2015), and Inamine et al. (2016) suggested a lack of correlation between fall population indices in the US and population size on the wintering grounds is evidence that limiting factors are occurring during fall migration. Given these competing, yet not mutually exclusive hypotheses, there is a need to better understand when, and where limiting factors are occurring in the annual cycle of the monarch butterfly.
In Canada, the monarch butterfly is listed as “Special Concern” but is being considered for uplisting to the status of “Endangered” under the Species at Risk Act (SARA), and occurs in greatest numbers in southern and eastern Ontario, where they are at the northern limit of their breeding range (COSEWIC, 2016; Environment Climate Change Canada, 2016). The population size of monarchs in Canada may be limited by factors acting throughout the monarch's annual cycle. For example, in the north central US, summer breeding populations are best predicted by higher amounts of precipitation, and cooler temperatures in Texas during early migration/breeding, likely reflecting ideal growing conditions for milkweed in the south (Zipkin et al., 2012; Saunders et al., 2016, 2018). Indeed, correspondence between changes in egg density and milkweed abundance in the upper mid-western United States with the number of individuals migrating in fall in Canada (Crewe and McCracken, 2015) suggests that breeding habitat and/or weather conditions experienced at breeding locations south of Canada are important. Northern breeding populations could also be limited by habitat availability and/or weather conditions as well as local density dependence on the breeding grounds (e.g., Marini and Zalucki, 2017; Thogmartin et al., 2017b). Alternatively, previous winter's population size in Mexico has been found to be positively correlated with the following winter's population size (Thogmartin et al., 2017b), suggesting a positive ripple effect through successive breeding generations that may affect breeding numbers reaching the north. Last, conditions during fall migration such as nectar availability and suitable weather conditions for migration may influence migration success and the ability of monarchs to reach the wintering grounds (Badgett and Davis, 2015; Ries et al., 2015, and Inamine et al., 2016), potentially affecting Canada's overall contribution to the winter population.
Until now, research addressing monarch population limitation has generally been conducted in isolation from the broader butterfly community. However, if weather and habitat change are acting not just on monarchs, but on the entire butterfly community, then the amount of temporal synchrony among species with similar life history strategies has the potential to reveal broad-scale relationships between observed patterns of change, and the processes driving those changes (Michel et al., 2016). Monarchs are among several long-distance migratory butterfly species that breed in southern Canada; several migratory species overwinter in the southern United States, north of the monarch's Mexican over-wintering grounds. Because these additional migrants do not overwinter in the same region as monarchs, temporal synchrony among those migrants on their Canadian summer breeding grounds would lend support to the hypothesis that migrant butterflies, including monarchs, are most limited by factors influencing the success of the spring migration and recolonization period. In contrast, many species that breed in similar habitats to the monarch are non-migratory residents in southern Canada. Greater temporal synchrony between monarchs and resident species would support the hypothesis that breeding habitat quantity or quality and/or weather conditions directly affecting survival and reproduction during breeding limit southern Canada's breeding monarch population.
We use monarch overwintering density estimates (Semmens et al., 2016; Thogmartin et al., 2017a) and butterfly survey data collected in the form of checklists by the Ontario Butterfly Atlas (2003–2017; Macnaughton et al., 2017), and eButterfly (2012–2017; Prudic et al., 2017) to test four competing hypotheses on whether monarchs breeding in southern Canada are most strongly limited by factors acting during fall migration, winter, spring migration and recolonization, or summer breeding (Table 1). We predicted that if monarchs are limited by factors acting during fall migration (“fall limitation hypothesis”), there will be weak correlation between relative abundance on the breeding grounds and subsequent wintering density; and if monarchs are limited by factors acting on their overwintering grounds (“winter limitation hypothesis”), there should be a strong correlation between previous winter density and relative abundance on the breeding grounds during the following summer. Alternatively, we predicted that if monarchs are limited by conditions during spring migration and re-colonization (“spring limitation hypothesis”), there will be (a) weak correlation between previous winter population density and breeding abundance, and (b) stronger temporal synchrony between monarchs and other migratory butterflies, than between monarchs and resident butterfly species. If monarchs are limited by conditions on their southern Canada breeding grounds (“summer limitation hypothesis”), we predicted that there should be (a) strong correlation between summer relative abundance and monarch densities during the following winter, and (b) stronger synchrony between monarchs and resident butterfly species than between monarchs and species which undergo long-distance migrations. By incorporating community-level comparisons of a 15-year time series dataset and comparing indices of summer and winter population densities, we differentiate between these competing limitation hypotheses, and test when during the annual cycle monarchs breeding in Ontario are most likely limited.
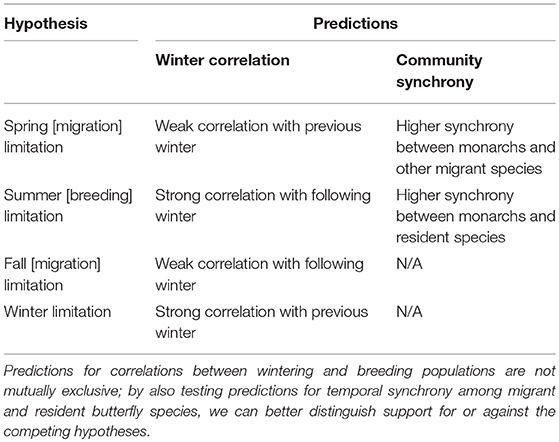
Table 1. Competing hypotheses testing when during the annual cycle monarch butterfly populations in Canada are most limited.
Methods
Data Collection
Overwintering Population Size
Estimates of the overwintering density of monarchs (2002–2014) were obtained from Thogmartin et al. (2017a), which provides the raw observed hectares collected by the World Wildlife Fund Mexico, fitted hectares as estimated by Semmens et al. (2016), and associated predicted population size in millions of individuals (see Thogmartin et al., 2017a for details).
Ontario Breeding Population Size
Annual indices of population size for the monarch butterfly and additional migratory and non-migratory butterfly species that share similar breeding habitats (Table 2) were estimated using butterfly checklist data from the Ontario Butterfly Atlas (hereafter “Atlas”) for the years 2003–2017. The Atlas includes occurrence and abundance data for Ontario from several sources including museum collections, eButterfly, Butterflies and Moths of North America (BAMONA), and iNaturalist (Macnaughton et al., 2017). eButterfly is a crowd-sourced checklist-based web-platform for gathering presence/presumed absence data from across North America (Prudic et al., 2017). Regional experts verify the validity of submitted observations on both Atlas and eButterfly platforms. Records submitted to the Atlas were excluded when: (1) they had missing day, month, or year, (2) “x” was listed as the count, or (3) “road-kill” or “specimen” were listed as the record type.
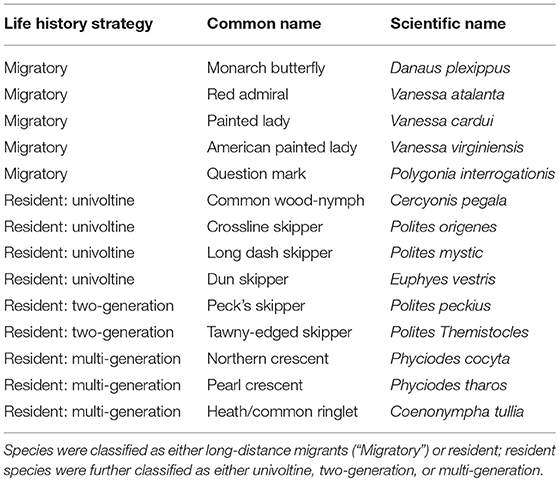
Table 2. Species included in community level analyses of temporal synchrony.
Because Atlas data are submitted as independent observations for each species, a “checklist” is defined here as observations submitted by an observer or group of observers on a particular date for a particular location (latitude/longitude, rounded to the nearest 2 decimal places, or ~ 1-km accuracy); i.e., each unique combination of date, latitude, longitude, and observer(s) is considered a checklist. Prior to calculating total number of species observed (hereafter “list length”) on a checklist, we aligned the butterfly taxonomy where it differed among databases represented in the Atlas (Supplementary Table 1). Records of unknown or very rare species were excluded from the data, and records for individuals with unknown species but known genus (e.g., Colias sp.) were included in calculations of list length only when the Genus was not already present on a list. In total, 160 species were detected by the Ontario Atlas and included in the calculation of list length (Supplementary Table 1).
After calculating list length, we used the open GIS software QGIS (v.2.18.16) to select lists that fell within the predicted breeding range of the monarch, based on known milkweed and monarch distributions (Larrivée, unpubl. data; Supplementary Figure 1). Lists with fewer than 4 species were also removed to avoid including rare species reports (Breed et al., 2013). Because list length declined with an increase in latitude, we controlled for the effect of latitude on list length by using the residuals from a linear regression of the log of list length by latitude as a surrogate for list length (Supplementary Figure 2). We further filtered data for each species by excluding lists collected before or after the minimum and maximum observation date for that species across years.
Weather Data
We used the NCEP.gather function of the RNCEP package (Kemp et al., 2012) in R (R Core Team, 2017) to extract surface-level weather variables for the lower-, mid-, and -upper United States in April, May and June, respectively, from the National Centers for Environmental Prediction (NCEP)/National Center for Atmospheric Research (NCAR) Reanalysis data set (Kalnay et al., 1996). These data have a spatial resolution of 2.5° × 2.5° and a temporal resolution of 6 h (00, 06, 12, 18 h UTC; Kemp et al., 2012). For the month of April, weather data were extracted for the lower U.S., which we defined as the area encompassed by latitudes in the 30 to 35 degree range, and within −104 to −83 degrees longitude. In May, we extracted weather data from the mid-U.S., which we defined as the area encompassed by latitudes in the 35 to 40 degree range, and within −104 to −83 degrees longitude. In June, we extracted data for the upper-U.S., defined as the area encompassed by latitudes in the 40 to 45 degree range, and within −104 to −83 degrees longitude. For each month, we calculated the total number of ≥ 21°C days, and for April and May, total number of freezing (≤ 0°C) days. The mean number of 21°C days and freezing days across locations in a region was used as an index of annual “21° days” and “0 days,” respectively. We chose the total number of ≥ 21°C days because Thogmartin et al. (2017b) found that this number for early May was negatively correlated with proceeding winter population sizes. Data for May 0°C days were not complete in 2009, and 2009 was excluded from those analyses.
Breeding Population Estimates
We estimated annual indices of population size for each butterfly species (Table 2) by fitting a modification of the list length analysis for checklist data described in Breed et al. (2013) and Szabo et al. (2011) to the Ontario Butterfly Atlas data. Because monarchs are large and conspicuous, probability of detection nears 0.75 or greater at the end of the breeding season during both low and high abundance years (Supplementary Figure 3). We therefore used abundance and assumed a negative binomial distribution for overdispersed counts in place of an occurrence model with a binomial data distribution as in Breed et al. (2013) and Szabo et al. (2011). For each species we used hierarchical linear regression to model the number of individuals observed on a list as a function of fixed effects for list length (residuals of the linear regression of log list length by latitude, as described above) and year. The parameter for list length was assumed to control for all factors that influence detection, including effort, observer skill, weather, time of day, etc. (Szabo et al., 2011; Breed et al., 2013). We re-parameterized the model by removing the intercept for year; in doing so, an effect size for each year, after accounting for random variability among years, was output for the model. These year effects provided a year-specific estimate of abundance, which we used as an index of relative abundance in the correlation and synchrony analyses described below. Random first-order autoregressive random effects for year and day of year nested within year were also included to account for temporal autocorrelation of counts among years and days of the year, respectively. All models were fit in a Bayesian framework using integrated nested Laplace approximation with the INLA package (Rue et al., 2009; Martins et al., 2013) in the R statistical programming language (R version 3.4.0; R Core Team, 2017).
Temporal Synchrony
To tease apart which of the four competing hypotheses (Table 1) was best supported by the data, we tested (1) the correspondence of monarch overwintering and breeding annual indices, (2) community-level correspondence of indices among migrating and resident butterfly species, and between monarchs and other migrant or resident species that breed in similar habitats; and (3) correspondence of butterfly and weather indices for the time period during the annual life cycle deemed to be driving population fluctuations based on results from (1) and (2).
Correspondence of Breeding Monarch Butterflies and Overwintering Densities
We tested whether size of the breeding population was correlated with the size of the previous and following overwintering population (raw observed hectares and fitted hectares, as described above) using Spearman rank correlation for both the raw and de-trended breeding and wintering annual population indices. De-trending removes any underlying linear trend from a time series by taking the residuals of a linear model fit to the indices and allows fluctuations in indices to be compared after accounting for any linear trend over time. Indices were detrended using the detrend function of the RSEIS R package (Lees and Harris, 2008). Because temporal autocorrelation of annual indices can bias cross-correlation estimates, we adjusted the p- and t- values of the r estimate by correcting for the loss of degrees of freedom due to temporal autocorrelation, following the methods described in Kirchner (2001); Michel et al. (2016). Next, we used the peaks function of the synchrony R package (Gouhier and Guichard, 2014; R Core Team, 2019) to determine the proportion of maxima and minima that corresponded between the breeding and wintering population time series, for both raw and de-trended annual indices of abundance.
Synchrony Among Resident and Migratory Butterfly Species
For community level correspondence of annual indices, we first tested the correlation of de-trended annual indices among species-species pairs using Spearman rank correlation, correcting for any temporal autocorrelation among annual indices (Kirchner, 2001; Michel et al., 2016). We then used a hierarchical linear model with the correlation coefficient (r) as the dependent variable, comparison type (migrant to migrant [M-M]; migrant-resident [M-R]; and resident to resident [R-R]) as an explanatory factor, and species 1 and 2 as random effects to account for repeated measures across species in the species-species comparisons. For the 5 migrant and 9 resident species (Table 2), this resulted in 10 M-M, 36 R-R, and 45 M-R correlations. Next, we used the community.sync function of the synchrony R package (Gouhier and Guichard, 2014) to estimate the community-level synchrony across (1) all species, (2) migrant butterfly species, and (3) resident butterfly species. If monarchs are limited by factors acting during spring migration and recolonization, migrant species should show a higher degree of synchrony amongst each other, than with southern Canada resident butterfly species. Alternatively, if monarchs are limited by factors acting during the breeding season, there should be greater synchrony between monarchs and resident butterfly species. Finally, we compared the correspondence of maxima and minima in the time series of species-species pairs using the peaks function in the synchrony R package. Using the same modeling structure described above, we also fit a hierarchical linear model with proportion of corresponding peaks as the dependent variable. Last, we repeated the same analysis with the proportion of corresponding peaks as the dependent variable, but only considering comparisons between the monarch and each other species.
Correspondence of Weather Variables With Breeding Population Indices
We tested the correlation of detrended weather and breeding annual indices for migrant butterflies using Spearman rank correlation, with t- and p-values adjusted for temporal autocorrelation of counts as described above and in Kirchner (2001), Michel et al. (2016). We also used the peaks function in the synchrony R package to estimate the proportion of corresponding maxima and minima between the de-trended annual indices of each migrant and each weather variable (mean number of 21°C days and 0°C days in April in the lower U.S., May in the mid-U.S., and June in the upper mid-west).
Results
Between 2003 and 2017, total number of lists submitted to the Ontario Butterfly Atlas increased significantly (linear regression: DF = 1, 13, F = 13.57, p = 0.003), but mean list length did not (linear regression: DF = 1, 17,352, F = 0.28, p = 0.59). Across years, mean and median list length were 8 and 7 species, respectively. Because list length declined with increasing latitude, we used residuals from the linear regression of log list length by latitude (DF = 1, 17,352, F = 145.3, p < 0.0001; Supplementary Figure 2) in our trend analyses, to model the effect of list length after accounting for variation due to latitude. Estimated annual indices for the 5 migrant and 9 resident butterfly species are shown in Figure 1.
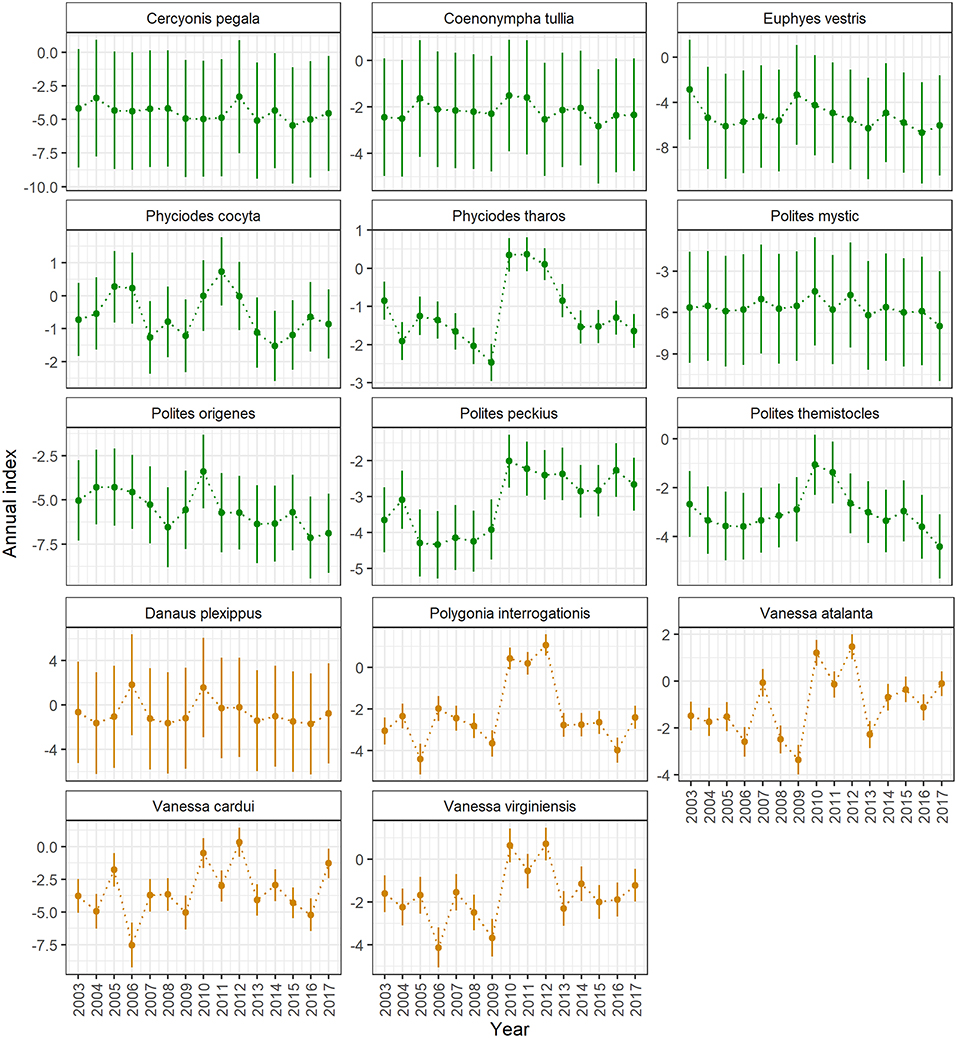
Figure 1. Annual indices (± std. dev.) of breeding population size for resident (top 3 rows, green) and migrant (bottom 2 rows, orange) butterfly species detected by the Ontario Butterfly Atlas (2003–2017). Indices were estimated using hierarchical linear regression that assumed a negative binomial data distribution, with count as the dependent variable, and with residuals of list length by latitude (a measure of effort), and year (factor) as explanatory variables. Temporal autocorrelation among years and among days within years were accounted for through the specification of random year and day effects.
Temporal Synchrony
Correspondence of Wintering and Breeding Population Estimates
Annual indices for the southern Canada monarch breeding population had a significant positive correlation only with the following winter's fitted hectares and density estimates (Table 3), which lends support to the summer limitation hypothesis and suggests a lack of support for the fall limitation hypothesis (Table 1). Weak correlation with the previous winter's estimates (Table 3) lends support to the spring limitation hypothesis and suggests a lack of support for the winter limitation hypothesis (Table 1). Proportion of corresponding maxima and minima (“Prop. Peaks,” Table 3) in the time series was also greater between the summer breeding and following winter populations, than between the breeding and previous winter populations (Figure 2), again supporting the summer and spring limitation hypotheses, respectively. De-trending the time series did not increase the proportion of corresponding peaks, but did result in an increase in the Spearman correlation coefficient from 0.28 to 0.66 (p = 0.02) and 0.70 (p = 0.01) for the fitted hectares and density overwintering estimates, respectively (Table 3; Figure 2), suggesting that breeding and wintering populations show a greater correspondence in the direction of annual fluctuations than among linear trends in counts over time.
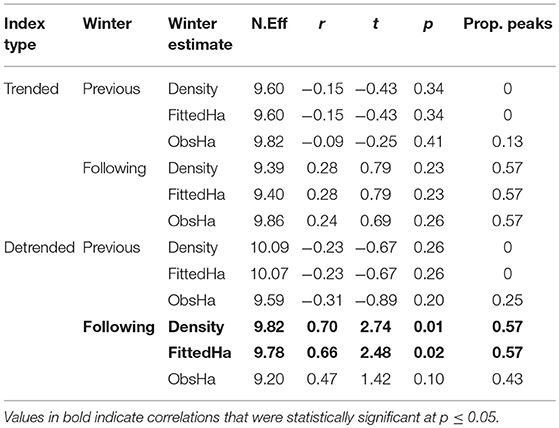
Table 3. Spearman correlation (N.Eff, effective sample size after accounting for temporal autocorrelation of indices; r, correlation coefficient; t, t-value; p, p-value) and proportion of corresponding maxima and minima (Prop. peaks) of breeding annual indices estimated using Ontario Butterfly Atlas data with overwintering population estimates (density, fitted Hectares, and observed hectares) for the winter previous and following the breeding season, and using raw and de-trended annual indices.
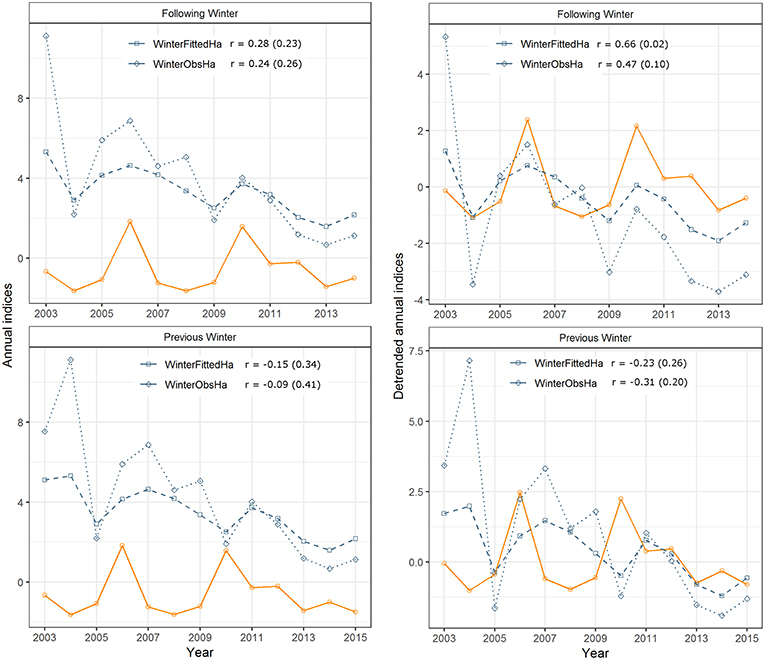
Figure 2. Raw and detrended monarch butterfly annual indices for the breeding population (orange) and for two estimates of the overwintering population (fitted hectares and observed hectares), comparing breeding indices with the previous (bottom), and following (top) winter. Significant correlations (r, p-value in parentheses) were detected between the detrended breeding annual indices and detrended fitted hectares and density estimates for the overwintering population (Table 3; density not shown).
Correspondence Between Migrant and Resident Butterfly Species
Mean correlation of annual indices for migrant-migrant species comparisons was greater than mean correlation among migrant-resident and resident-resident comparisons, and 95% confidence intervals of migrant-migrant and migrant-resident groups did not overlap. This result suggests that the annual indices of long-distance migrants are more strongly correlated with the annual indices of other migrants, than they are with annual indices of resident butterfly species (Table 4, Figure 3A; for raw correlation estimates see Supplementary Table 2) and suggests stronger support for the spring limitation hypothesis than for the summer limitation hypothesis. The stronger correlation between migrant-migrant pairs compared with migrant-resident pairs was maintained when residents were classified into groups according to number of generations in a year (univoltine, 2-generation, or multi-generation; Supplementary Figure 4). Spearman correlation coefficients were also significantly greater when monarch annual indices were compared to those of other migrants, than when compared with Ontario breeding residents (linear regression: intercept = 0.38, p < 0.001; group (M-R) = −0.27, p = 0.01; Figure 3B).
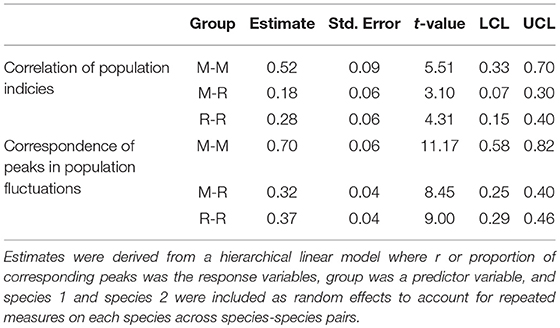
Table 4. Estimates for mean Spearman correlation (r) and proportion of corresponding peaks for species-species comparisons between migrant species (M-M, n = 10), between migrant and resident species (M-R; n = 45), and between resident species pairs (R-R; n = 36).
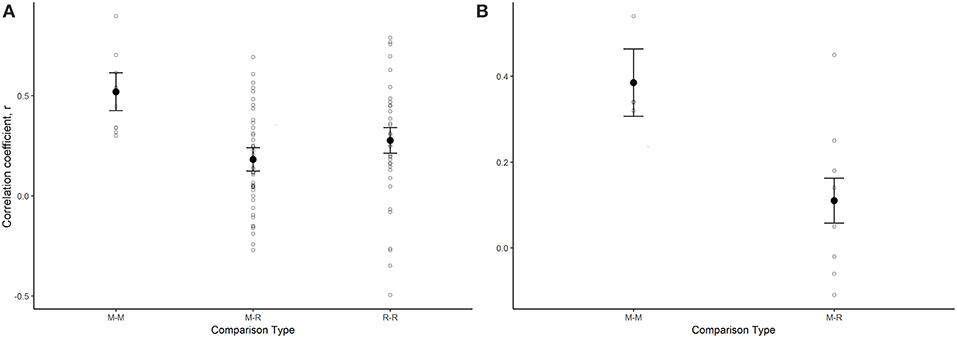
Figure 3. Model derived estimates (black circles) and associated standard errors of the spearman rank correlation of species-species annual population indices for models that tested for a difference among groups (M, migrant; R, resident), for (A) a model that looked at all species-species comparisons across the 14 migrant and resident species (M-M: n = 10; M-R, n = 45; R-R, n = 36), and (B) a model that included only species-species comparisons that included the monarch butterfly (M-M, n = 4; M-R, n = 7). In both cases, the raw spearman correlation coefficient for each species-species comparison is also plotted for each group (open circles).
For the butterfly species compared, community-wide synchrony was estimated to be 0.44 (p = 0.01) across all 14 migrant and resident butterfly species, 0.48 (p = 0.01) across the 9 resident species, and 0.62 (0.04) across the 5 migrant species. When residents were broken down into groups based on number of breeding generations, community-wide synchrony increased to 0.64 (p = 0.04) among multi-generational residents, 0.89 (p = 0.01) among 2-generational residents, and 0.49 (p = 0.04) among univoltine residents.
The spring limitation hypothesis was also supported by results of proportion of corresponding peaks, which was greatest among migrant-migrant comparisons. Confidence limits (95%) of the M-M estimate did not overlap with those of the migrant-resident and resident-resident estimates, which supports that migrants are showing more similar fluctuations in annual indices as a group than when migrants are compared with resident butterfly species (Table 4, Figure 4A; for raw proportion of corresponding peaks for each species-species pair, see Supplementary Table 3). As with correlation estimates, the stronger relationship between migrant-migrant pairs than migrant-resident pairs was maintained when residents were further broken down into groups according to number of annual generations (Supplementary Figure 5). When comparisons were restricted to those that included the monarch butterfly, proportion of corresponding maxima and minima between the monarch's annual indices and indices of other migrants was significantly greater than when monarch annual indices were compared to those of resident butterfly species (linear regression: intercept = 0.68, p < 0.0001; group (M-R) = −0.42, p < 0.0001; Figure 4B).
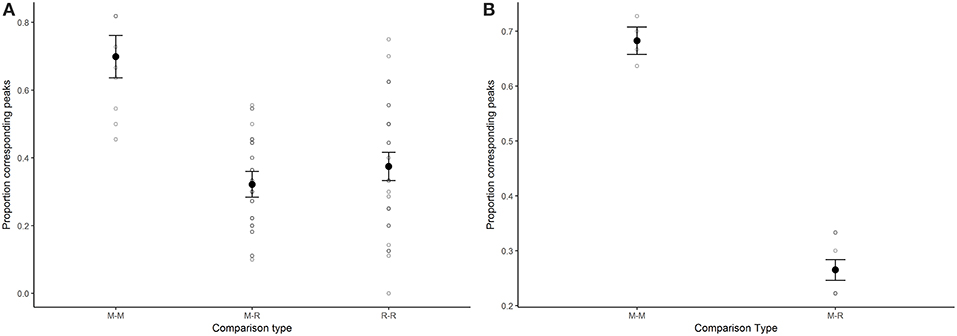
Figure 4. Model derived estimates and associated standard errors of the proportion of corresponding peaks among species-species annual population indices for models that tested for a difference among groups, for (A) a model that looked at all species-species comparisons across the 14 migrant (M) and resident (R) species (M-M: n = 10; M-R, n = 45; R-R, n = 36), and (B) a model that included only species-species comparisons that included the monarch butterfly (M-M, n = 4; M-R, n = 7). In both cases, the proportion of corresponding peaks for each species-species comparison is also plotted for each group (open circles).
Correspondence of Weather Variables With Breeding Population Indices
Annual indices of migrant butterfly species tended to show greater correspondence with the number of 21°C days in April and May than with 21°C days in June and the number of 0°C days in April or May (Figure 5A), though the only statistically significant relationships were for the correlation between annual indices of the monarch (r = 0.68, p = 0.01) and question mark butterflies (0.56, p = 0.05) and the number of 21°C days in April in the lower U.S. (Figure 6; raw correlation coefficients in Supplementary Table 4). Correspondence of maxima and minima in the time series was greatest for all migrant species with the number of 21°C days in May in the mid-U.S. and June in the upper mid-west (Figures 5B, 7; raw proportion of peaks in Supplementary Table 4). Proportion of corresponding peaks was significant between annual indices and May 21°C days for monarch (0.70, p = 0.02), painted lady (0.73, p = 0.03) and American painted lady (0.64, 0.04) butterflies, and between annual indices and June 21°C days for monarch (0.70, p = 0.04) and American painted lady butterflies (0.73, p = 0.02).
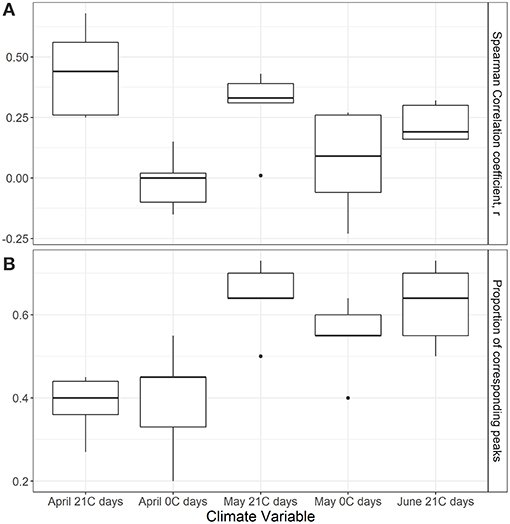
Figure 5. Boxplots showing distribution of (A) Spearman correlation coefficients and (B) proportion of corresponding peaks between breeding population indices for the five migrant butterflies (Table 1) and weather indices, where April/May 21 days and April/May 0 days are the mean number of 21°C days (or greater) and 0°C days (or less), respectively, during the month of April in the lower U.S., and the month of May in the mid U.S.
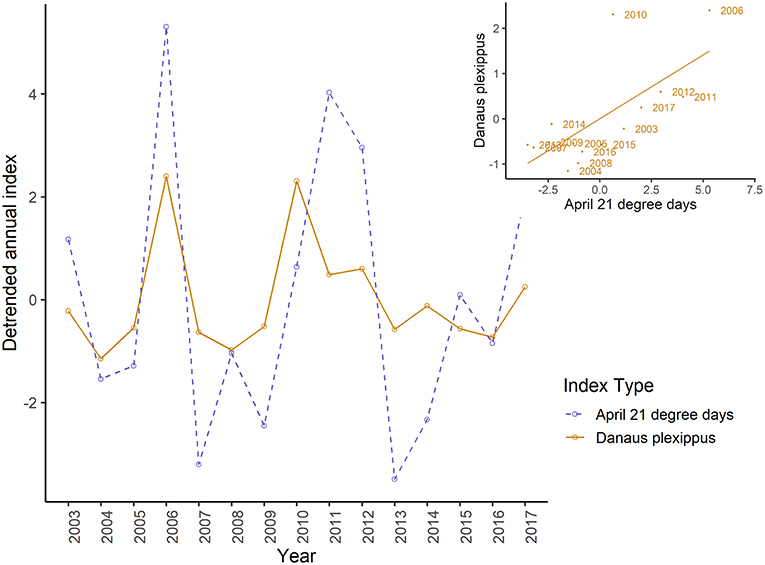
Figure 6. Detrended annual indices for breeding monarch butterflies and detrended mean number of 21° days in April in the lower United States, by year and, inset, showing linear relationship between detrended monarch and detrended mean April 21° day indices. A significant Spearman correlation of 0.71 (p = 0.01) was detected.
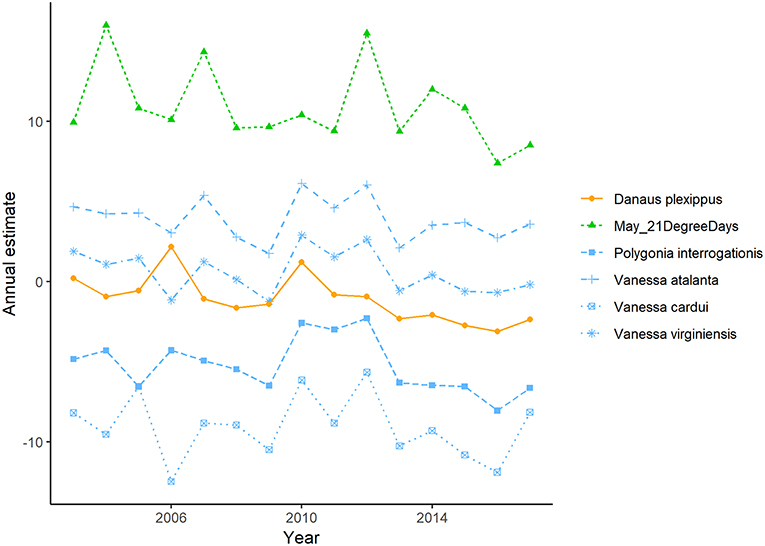
Figure 7. Detrended annual indices for migrant butterflies that breed in southern Canada plotted with the detrended mean number of 21° days in May in the mid-eastern United States. Significant correlations between detrended breeding annual indices and detrended mean 21° days were not detected, though proportion of corresponding maxima and minima ranged between 0.60 and 0.82.
Discussion
Our unique butterfly community analysis allowed us to assess and disentangle the relative importance of migration and summer breeding factors as drivers of annual and inter-annual variability in monarch population size in southern Canada. We show that weak correspondence between the size of the overwintering population and subsequent breeding population, along with stronger temporal population synchrony among migrants than among resident butterflies, supports the hypothesis that monarchs breeding in Canada are most strongly limited by factors acting during spring migration and recolonization given contemporary levels of milkweed availability in the US (see Thogmartin et al., 2017c). The lack of synchrony between annual numbers of monarchs and resident co-occurring butterfly species suggests that the size of the monarch breeding population is not driven by factors acting during the breeding season, such as direct and indirect effects of weather (e.g., effects on nectar availability or milkweed quality). Instead, interannual synchrony of all migratory butterfly species breeding in southern Canada over the 15 year time series examined in this study suggests that factors acting during spring migration and recolonization are driving observed patterns in the year-to-year variability in monarch annual population indices.
Weak correspondence between the size of the overwintering population and subsequent southern Canada breeding population did not support the hypothesis that the size of the Ontario breeding population is predominantly limited by factors acting on the overwintering grounds. This hypothesis is also not supported by our result that monarch numbers fluctuate in sync with all long distance migrant butterflies on their southern Canada breeding grounds, but not with 9 common co-occurring resident species of butterflies that breed in the same habitats as monarchs in southern Canada. Therefore, the relationship between overwintering and subsequent breeding population sizes likely breaks down as a result of variation in reproductive potential with weather conditions during spring migration and recolonization (Zipkin et al., 2012; Saunders et al., 2016, 2018).
The correspondence of monarch (and other migrant) annual indices with the mean number of 21° days during spring migration is in agreement with Thogmartin et al. (2017b) and suggests that given favorable breeding conditions, monarchs have the potential to recover from low winter population sizes. Indeed, while the pattern of ups and downs were strongly correlated between the breeding and following winter population estimates, correspondence was poor when the time series were not de-trended; i.e., the strong decline in overwintering population size, observed prior to more recent increases since population lows in 2012–2014, was not reflected in the breeding population. However, Crewe and McCracken (2015) found that the magnitude of change between peaks and lows in the number of monarchs migrating out of Ontario each fall has declined over time, which might be indicative of a reduction in reproductive and re-colonization potential. If so, the monarch population may become more susceptible to further declines over time, particularly if spring weather conditions become increasingly warm with climate change (e.g., Schwartz and Reiter, 2000; Zipkin et al., 2012; Saunders et al., 2016, 2018).
Strong correspondence between breeding and following winter population sizes did not support the hypothesis that the current breeding population of monarchs in Canada is predominantly limited by mortality during fall migration (Badgett and Davis, 2015; Ries et al., 2015; Inamine et al., 2016). Also, observed shifts in the phenology of monarch butterflies, such that monarchs are staying in southern Canada later in the year (Prudic et al., 2017, e.g., Zipf et al., 2017), could have an impact on fall migration mortality, if later migration results in a higher probability of encountering extreme weather events on the breeding grounds or during migration. Research is required to determine whether a shifting phenology on the breeding grounds is resulting in additional breeding generations each year or delayed migration, and whether individuals delaying their migration, or a new late summer or early fall generation, are likely to survive a later fall migration.
Migratory monarch butterfly populations are currently extremely low and vulnerable (Semmens et al., 2016). Loss of milkweed breeding habitat as a result of glyphosate application to genetically modified crops is thought to be largely responsible for current population levels (Pleasants and Oberhauser, 2013; Flockhart et al., 2015; Stenoien et al., 2016; Pleasants, 2017). Historical forest loss on the wintering grounds in Mexico due to logging has also been hypothesized to affect population size and has been responsible for the disappearance of a wintering colony (Brower et al., 2002; Vidal et al., 2014). Further, nectar resource availability has likely declined through time (Potts et al., 2010), potentially limiting the availability of nectar resources for monarchs to build fat reserves late in the fall migration in the southern US and Mexico, which are required to sustain them throughout the winter (Brower et al., 2006). While our study suggests that fluctuations in the number of breeding monarchs counted in southern Canada since 2003 are driven by factors acting during spring migration and recolonization, our results do not imply that factors acting during alternative phases of the annual cycle, including the availability of milkweed during the summer breeding season, nectar resources during fall migration, and forest habitat during the overwintering period, have not contributed to historical rates of population decline, or are not limiting the potential of monarchs to recover to previous population levels. Further research is needed on historical and contemporary milkweed availability in Canada to better understand how land management practices affect current breeding populations of monarchs and other pollinators. Research should also address whether increasing rates and severity of extreme weather events in the fall since the turn of the 21st century, such as hurricanes and extended drought periods, are influencing monarch survival during fall migration. Finally, while overwintering forest loss has sharply declined since 2008 (Vidal et al., 2014), increasing overwintering habitat could help increase population numbers observed in Canada, particularly in years where growing conditions for milkweed in the southern US are favorable. It should also be noted that severe weather events on the wintering grounds, which were not explicitly accounted for in our analysis, have the potential to limit next summer breeding success in northeastern North-America in any given year. For example, large die-offs of monarchs on the wintering grounds owing to severe storm events (e.g., Brower et al., 2017) might affect the number of fall migrants returning to Mexico the following winter. We suggest that further research is needed on the interactions between events on the wintering grounds and the subsequent spring migration and recolonization to fully understand contemporary population limiting processes of the migratory monarch population.
In conclusion, we show that our list-length approach using data that was largely collected by citizen scientists to develop population indices for 14 butterfly species breeding in Canada, speaks to the value of community science data and butterfly checklists and suggests our approach could easily be extended to other parts of the monarch range. Our community level analysis which allowed us to compare inter-annual population indices of several co-occurring migratory and resident butterfly species in southern Canada also revealed for the first time that contemporary populations of monarchs in Canada are most strongly limited by weather events occurring in the US during spring, a result supported by multiple analyses in the US (Zipkin et al., 2012; Saunders et al., 2016, 2018). Moving forward, it will be important to understand how conservation actions taken by all three countries throughout the annual cycle of the monarch interact with stochastic weather effects, and where those interactions are strongest, so that conservation planners can better prioritize where remedial actions may be most effective.
Author Contributions
ML, GM, and TC conceived and designed the experiments. ML, TC, and GM contributed data and analysis tools. TC performed the experiments and analyzed the data. TC wrote the manuscript, with input from GM and ML.
Funding
Funding for this work was provided by Environment and Climate Change Canada.
Conflict of Interest Statement
The authors declare that the research was conducted in the absence of any commercial or financial relationships that could be construed as a potential conflict of interest.
Acknowledgments
We are grateful to the many individuals whose butterfly observations are incorporated into the Ontario Butterfly Atlas each year.
Supplementary Material
The Supplementary Material for this article can be found online at: https://www.frontiersin.org/articles/10.3389/fevo.2019.00308/full#supplementary-material
References
Badgett, G., and Davis, A. K. (2015). Population trends of monarchs at a northern monitoring site: analyses of 19 years of fall migration counts at Peninsula Point, MI. Ann. Entomol. Soc. Am. 108, 700–706. doi: 10.1093/aesa/sav060
Breed, G. A., Stichter, S., and Crone, E. E. (2013). Climate-driven changes in Northeastern US butterfly communities. Nat. Clim. Chang. 3, 142–145. doi: 10.1038/nclimate1663
Brower, L. P., Castilleja, G., Peralta, A., Lopez-Garcia, J., Bojorquez-Tapia, L., Díaz, S., et al. (2002). Quantitative changes in forest quality in a principal overwintering area of the monarch butterfly in Mexico, 1971–1999. Conserv. Biol. 16, 346–359. doi: 10.1046/j.1523-1739.2002.00572.x
Brower, L. P., Fink, L. S., and Walford, P. (2006). Fueling the fall migration of the monarch butterfly. Integr. Comp. Biol. 46, 1123–1142. doi: 10.1093/icb/icl029
Brower, L. P., Taylor, O. R., Williams, E. H., Slayback, D. A., Zubieta, R. R., and Ramírez, M. I. (2012). Decline of monarch butterflies overwintering in Mexico: is the migratory phenomenon at risk? Insect Conserv. Divers. 5, 95–100. doi: 10.1111/j.1752-4598.2011.00142.x
Brower, L. P., Williams, E. H., Jaramillo-López, P., Kust, D. R., Slayback, D. A., and Ramírez, M. I. (2017). Butterfly mortality and salvage logging from the March 2016 storm in the monarch butterfly biosphere reserve in Mexico. Am. Entomol. 63, 151–164. doi: 10.1093/ae/tmx052
COSEWIC (2016). COSEWIC Assessment and Status Report on the Monarch Danaus Plexippus in Canada. Committee on the Status of Endangered Wildlife in Canada. Ottawa. xiii + 59 pp. Available online at: http://www.registrelep-sararegistry.gc.ca/default.asp?lang=en&n=24F7211B-1 (accessed August 07, 2019).
Crewe, T. L., and McCracken, J. D. (2015). Long-term trends in the number of Monarch Butterflies (Lepidoptera:Nymphalidae) counted on fall migration at Long Point, Ontario, Canada (1995–2014). Ann. Entomol. Soc. Am. 108, 707–717. doi: 10.1093/aesa/sav041
Environment and Climate Change Canada (2016). Management plan for the Monarch (Danaus plexippus) in Canada. Species at Risk Act Management Plan Series. Environment and Climate Change Canada, Ottawa. iv + 45 pp.
Flockhart, D. T. T., Pichancourt, J.-B., Norris, D. R., and Martin, T. G. (2015). Unravelling the annual cycle in a migratory animal: breeding-season habitat loss drives population declines of Monarch Butterflies. J. Anim. Ecol. 84, 155–165. doi: 10.1111/1365-2656.12253
Gouhier, T. C., and Guichard, F. (2014). Synchrony: quantifying variability in space and time. Methods Ecol. Evolut. 5, 524–533. doi: 10.1111/2041-210X.12188
Inamine, H., Ellner, S. P., Springer, J. P., and Agrawal, A. A. (2016). Linking the continental migratory cycle of the Monarch Butterfly to understand its population decline. Oikos 125, 81–91. doi: 10.1111/oik.03196
Kalnay, E., Kanamitsu, M., Kistler, R., Collins, W., Deaven, D., Gandin, L., et al. (1996). The NCEP/NCAR 40-Year Reanalysis Project. Bull. Am. Meteorol. Soc. 77, 437–471. doi: 10.1175/1520-0477(1996)077<0437:TNYRP>2.0.CO;2
Kemp, M. U., van Loon, E. E., Shamoun-Baranes, J., and Bouten, W. (2012). RNCEP: Global weather and climate data at your fingertips. Methods Ecol. Evolut. 3, 65–70. doi: 10.1111/j.2041-210X.2011.00138.x
Kirchner, J. (2001). Data Analysis Toolkit #11: Serial Correlation. Available online at: http://seismo.berkeley.edu/~kirchner/eps_120/Toolkits/Toolkit_11.pdf (accessed August 07, 2019).
Lees, J. M., and Harris, D. (2008). RSEIS: Seismic Time Series Analysis Tools. Available online at: https://cran.r-project.org/web/packages/RSEIS/index.html (accessed August 07, 2019).
Macnaughton, A., Layberry, R., Jones, C., and Edwards, B. (2017). Ontario Butterfly Atlas Data. Ontario Butterfly Atlas. Available online at: http://www.ontarioinsects.org/atlas_online.htm (accessed August 07, 2019).
Malcolm, S. B. (2017). Anthropogenic impacts on mortality and population viability of the monarch butterfly. Annu. Rev. Entomol. 63, 277–302. doi: 10.1146/annurev-ento-020117-043241
Marini, L., and Zalucki, M. P. (2017). Density-dependence in the declining population of the monarch butterfly. Sci. Rep. 7:13957. doi: 10.1038/s41598-017-14510-w
Martins, T. G., Simpson, D., Lindgren, F., and Rue, H. (2013). Bayesian computing with INLA: new features. Comput. Stat. Data Anal. 67, 68–83. doi: 10.1016/j.csda.2013.04.014
Michel, N. L., Smith, A. C., Clark, R. G., Morrissey, C. A., and Hobson, K. A. (2016). Differences in spatial synchrony and interspecific concordance inform guild-level population trends for aerial insectivorous birds. Ecography 39, 774–786. doi: 10.1111/ecog.01798
Pleasants, J. (2017). Milkweed restoration in the midwest for monarch butterfly recovery: estimates of milkweeds lost, milkweeds remaining and milkweeds that must be added to increase the monarch population. Insect Conserv. Divers. 10, 42–53. doi: 10.1111/icad.12198
Pleasants, J. M., and Oberhauser, K. S. (2013). Milkweed loss in agricultural fields because of herbicide use: effect on the monarch butterfly population. Insect Conserv. Divers. 6, 135–144. doi: 10.1111/j.1752-4598.2012.00196.x
Potts, S. G., Biesmeijer, J. C., Kremen, C., Neumann, P., Schweiger, O., and Kunin, W. E. (2010). Global pollinator declines: trends, impacts and drivers. Trends Ecol. Evol. (Amst). 25, 345–353. doi: 10.1016/j.tree.2010.01.007
Prudic, K. L., McFarland, K. P., Oliver, J. C., Hutchinson, R. A., Long, E. C., Kerr, J. T., et al. (2017). eButterfly: leveraging massive online citizen science for butterfly consevation. Insects 8, 1–12. doi: 10.3390/insects8020053
R Core Team (2017). R: A Language and Environment for Statistical Computing. R Foundation for Statistical Computing. Available online at: https://www.r-project.org/ (accessed August 07, 2019).
R Core Team (2019). R: A Language and Environment for Statistical Computing. R Foundation for Statistical Computing, Vienna, Austria. Available online at: https://www.r-project.org (accessed August 07, 2019).
Ries, L., Taron, D. J., and Rendón-Salinas, E. (2015). The disconnect between summer and winter monarch trends for the eastern migratory population: possible links to differing drivers. Ann. Entomol. Soc. Am. 108, 691–699. doi: 10.1093/aesa/sav055
Rue, H., Martino, S., and Chopin, N. (2009). Approximate bayesian Inference for latent gaussian models by using integrated nested laplace approximations. J. R. Statist. Soc. 71, 319–392. doi: 10.1111/j.1467-9868.2008.00700.x
Saunders, S. P., Ries, L., Oberhauser, K. S., Thogmartin, W. E., and Zipkin, E. F. (2018). Local and cross-seasonal associations of climate and land use with abundance of monarch butterflies Danaus plexippus. Ecography 41, 278–290. doi: 10.1111/ecog.02719
Saunders, S. P., Ries, L., Oberhauser, K. S., and Zipkin, E. F. (2016). Evaluating confidence in climate-based predictions of population change in a migratory species. Global Ecol. Biogeo. 25, 1000–1012. doi: 10.1111/geb.12461
Schwartz, M. D., and Reiter, B. E. (2000). Changes in north American spring. Int. J. Climatol. 20, 929–932. doi: 10.1002/1097-0088(20000630)20:8<929::AID-JOC557>3.0.CO;2-5
Semmens, B. X., Semmens, D. J., Thogmartin, W. E., Wiederholt, R., López-Hoffman, L., Diffendorfer, J. E., et al. (2016). Quasi-extinction risk and population targets for the eastern, migratory population of monarch butterflies (Danaus plexippus). Sci. Rep. 6:23265. doi: 10.1038/srep23265
Stenoien, C., Nail, K. R., Zalucki, J. M., Parry, H., Oberhauser, K. S., and Zalucki, M. P. (2016). Monarchs in decline: a collateral landscape-level effect of modern agriculture. Insect Sci. 25, 548–541. doi: 10.1111/1744-7917.12404
Szabo, J. K., Vesk, P. A., Baxter, P. W. J., and Possingham, H. P. (2011). Paying the extinction debt: woodland birds in the Mount Lofty Ranges, South Australia. Emu 111, 59–70. doi: 10.1071/MU09114
Thogmartin, W. E., Diffendorfer, J. E., López-Hoffman, L., Oberhauser, K., Pleasants, J., Semmens, B. X., et al. (2017a). Density estimates of monarch butterflies overwintering in Central Mexico. PeerJ. 5:e3221. doi: 10.7717/peerj.3221
Thogmartin, W. E., López-Hoffman, L., Rohweder, J., Diffendorfer, J., Drum, R., Semmens, D., et al. (2017c). Restoring monarch butterfly habitat in the Midwestern US: ‘all hands on deck'. Environ. Res. Lett. 12:074005. doi: 10.1088/1748-9326/aa7637
Thogmartin, W. E., Wiederholt, R., Oberhauser, K., Drum, R. G., Diffendorfer, J. E., Altizer, S., et al. (2017b). Monarch butterfly population decline in North America: identifying the threatening processes. R. Soc. Open Sci. 4:170760. doi: 10.1098/rsos.170760
Vidal, O., López-García, J., and Rendón-Salinas, E. (2014). Trends in deforestation and forest degradation after a decade of monitoring in the monarch butterfly biosphere reserve in Mexico. Conserv. Biol. 28, 177–186. doi: 10.1111/cobi.12138
Zipf, L., Williams, E. H., Primack, R. B., and Stichter, S. (2017). Climate effects on late-season flight times of Massachusetts butterflies. Int. J. Biometeorol. 61, 1667–1673. doi: 10.1007/s00484-017-1347-8
Keywords: monarch butterfly, Danaus plexippus, population limitation, community ecology, temporal synchrony, weather
Citation: Crewe TL, Mitchell GW and Larrivée M (2019) Size of the Canadian Breeding Population of Monarch Butterflies Is Driven by Factors Acting During Spring Migration and Recolonization. Front. Ecol. Evol. 7:308. doi: 10.3389/fevo.2019.00308
Received: 15 January 2019; Accepted: 31 July 2019;
Published: 14 August 2019.
Edited by:
Jay E. Diffendorfer, United States Geological Survey (USGS), United StatesReviewed by:
Nathan Lemoine, Colorado State University, United StatesChip Taylor, University of Kansas, United States
Copyright © 2019 Crewe, Mitchell and Larrivée. This is an open-access article distributed under the terms of the Creative Commons Attribution License (CC BY). The use, distribution or reproduction in other forums is permitted, provided the original author(s) and the copyright owner(s) are credited and that the original publication in this journal is cited, in accordance with accepted academic practice. No use, distribution or reproduction is permitted which does not comply with these terms.
*Correspondence: Tara L. Crewe, dGxjcmV3ZSYjeDAwMDQwO2dtYWlsLmNvbQ==
†Present address: Tara L. Crewe, College of Engineering, IT and Environment, Charles Darwin University, Darwin, NT, Australia