 Leona K. Svancara
 John T. Abatzoglou
 Beth Waterbury
- 1Idaho Department of Fish and Game, Moscow, ID, United States
- 2Department of Geography, University of Idaho, Moscow, ID, United States
- 3Idaho Department of Fish and Game, Salmon, ID, United States
Monarch butterflies (Danaus plexippus) are widespread in North America but have experienced large rangewide declines. Causes of recent declines likely involve multiple biotic and abiotic stressors including climate change and loss and degradation of native milkweed (Asclepias spp.), monarchs' obligate larval host plant. Recent broad-scale modeling efforts suggest milkweed and monarch distributions in the eastern United States will expand northward during summer months while fine-scale modeling of western population overwintering sites in California indicate shifts inland and upward in elevation. However, species' response to climate measures varies at sub-regional scales across its range and both the impacts of climate change and potential adaptation measures may be sensitive to the spatial scale of climate data used, particularly in areas of complex topography. Here, we develop fine-scale models of monarch breeding habitat and milkweed distributions in Idaho, an area at the northern extent of the monarch breeding range in North America and important in western overwintering population recruitment. Our models accurately predict current distributions for showy milkweed (A. speciosa), swamp milkweed (A. incarnata), and monarch with AUC (area under the receiver operating characteristic curve) = 0.899, 0.981, and 0.929, respectively. Topographic, geographic, edaphic, and climatic factors all play important roles in determining milkweed and, thus, monarch distributions. In particular, our results suggest that at sub-regional and fine-scales, non-climatic factors such as soil depth, distance to water, and elevation contribute significantly. We further assess changes in potential habitat across Idaho under mid-21st century climate change scenarios and potential management implications of these changing distributions. Models project slight decreases (−1,318 km2) in potential suitable habitat for showy milkweed and significant increases (+5,830 km2) for swamp milkweed. Projected amounts of suitable habitat for monarch are likely to remain roughly stable with expansion nearly equal to contraction under a moderate scenario and slightly greater when under the more severe scenario. Protected areas encompass 8% of current suitable habitat for showy milkweed, 11% for swamp milkweed, and 9% for monarch. Our study shows that suitable habitat for monarchs and/or milkweeds will likely continue to be found in managed areas traditionally seen as priority habitats in Idaho through mid-century.
Introduction
Monarch butterflies (Danaus plexippus plexippus) are widespread in North America but appear to be experiencing large rangewide declines in both the eastern (Semmens et al., 2016; Agrawal and Inamine, 2018) and western populations (Jepsen et al., 2015; Schultz et al., 2017). Factors contributing to declines are increasingly understood and likely involve multiple biotic and abiotic stressors including climate change and loss and degradation of native milkweed (Asclepias spp.), monarchs' obligate larval host plant (Flockhart et al., 2015; Jepsen et al., 2015; Inamine et al., 2016; Thogmartin et al., 2017; Belsky and Joshi, 2018). Changes in climate patterns, in particular, may both favor and hinder species through complex, seasonal relationships. Monarchs, for example, appear to benefit from warm winters and warm, wet springs (Zipkin et al., 2012; Espeset et al., 2016; Thogmartin et al., 2017), while excessively hot, dry, cold, or wet conditions may be a detriment (Zalucki, 1982; York and Oberhauser, 2002; Zalucki and Rochester, 2004; Nail et al., 2015; James, 2016), but these relationships are region-specific (Zipkin et al., 2012; Flockhart et al., 2017). Similarly, warmer temperatures result in increased growth for some milkweed species while drought reduces their growth, survivorship, seed production and germination, and nutritional quality (Bowles et al., 1998; Woods et al., 2012; Couture et al., 2015). These patterns have led to suggestions that northern populations of both milkweed and monarchs may benefit from projected changes in climate (Couture et al., 2015) depending on if and how milkweed distributions change (Lemoine, 2015).
Species distribution models (SDMs) are increasingly used to assess the current “climate envelope” for species and project the potential effects of changes in those climate variables under different future scenarios (Porfirio et al., 2014). To date, broad-scale modeling efforts suggest milkweed and monarch distributions in the eastern United States (US) will expand northward during summer months (Batalden et al., 2007; Lemoine, 2015) while fine-scale modeling of western population overwintering sites in California indicate shifts upward in elevation and inland (Fisher et al., 2018). Such modeling efforts, however, are often limited due to a mismatch between the spatial resolution of climate data available (e.g., 1–30 km) and the scale relevant to the species of interest (e.g., 10–100 m), especially in areas of complex terrain (Randin et al., 2009; Austin and Van Niel, 2011; Suggitt et al., 2011; Franklin et al., 2013). In addition, several modeling efforts have shown that species' response to climate often varies across its range (e.g., Pearman et al., 2010; Hällfors et al., 2016; Ikeda et al., 2017; Nice et al., 2019). Given that monarchs are a widespread, highly migratory species, one may not expect significant variability in climate response across the species range, while milkweed may exhibit more local adaptability.
Currently at the northern extent of monarch breeding range, Idaho significantly contributes to recruitment of monarchs to the western population (Yang et al., 2016). Chosen as the Idaho state insect, yet classified as unprotected wildlife in the state, the monarch butterfly was recently designated as an Idaho Species of Greatest Conservation Need predominantly due to significant rangewide declines and a lack of information on Idaho-specific status and trends [Idaho Department of Fish and Game (IDFG), 2017]. In particular, knowledge of monarch breeding locations, distribution, and movement patterns as well as potential impacts of climate change and other threats are limited in the region. Initial mapping of western milkweed and monarch observations (Xerces Society, 2014) and modeling work (Stevens and Frey, 2010; USFWS/Xerces Society, 2016) identified probable breeding habitat across seven western states, including Idaho. These and other studies suggested that monarchs in the intermountain states (Idaho, Utah, Nevada) are comparatively sparsely populated and may be constrained by low milkweed species diversity, semi-arid climates, and unsuitable temperature regimes associated with elevation or latitude (Pyle, 1999; Stevens and Frey, 2010). However, surveys by the Idaho Department of Fish and Game (IDFG) (Waterbury and Ruth, 2015) identified monarch breeding activity in a climatic region previously considered to be thermally unsuitable for monarch reproduction (Stevens and Frey, 2010). This finding suggests that other regions of Idaho, also previously deemed thermally constrained for monarch breeding, may currently support suitable natal habitat. Beginning in 2015, IDFG engaged in several efforts aimed at improving the knowledge base for monarchs including collaborating with Washington Department of Fish and Wildlife on a project to investigate monarch distributions and status in Idaho and Washington (Waterbury and Potter, 2018). Here, we employ data collected through these efforts to (1) develop fine-scale models of current milkweed and monarch butterfly distributions in Idaho using the most scale-relevant data available, (2) assess potential changes under mid-century climate change scenarios, and (3) assess potential management implications of these changing distributions.
Materials and Methods
Milkweed and Monarch Observations
All known observations of monarch and milkweed in Idaho as of April 26, 2018, were compiled for this modeling effort. This included data from the Western Monarch and Milkweed Mapper Occurrence Database (museum and herbarium specimens, older survey efforts, and incidental observations) (Xerces Society, 2018), recently collected IDFG and College of Western Idaho survey data (summers 2016, 2017), and incidental observations recorded in iNaturalist and in the Idaho Fish and Wildlife Information System Species Diversity Database [Idaho Department of Fish and Game (IDFG), 2018]. We carefully evaluated all data for use in the distribution models to ensure spatial and temporal accuracy. As part of this evaluation, we determined sufficient data exist in Idaho to model distributions for monarch (n = 1603) and two native milkweed species, showy milkweed (A. speciosa) (n = 5258) and swamp milkweed (A. incarnata) (n = 313). Other milkweed species documented but not modeled included narrow-leaf milkweed (A. fascicularis) (n = 94), pallid milkweed (A. cryptoceras) (n = 84), and spider milkweed (A. asperula) (n = 7). All compiled data are available online [Idaho Department of Fish and Game (IDFG), 2018 data used for modeling can be requested from the lead author].
Compiled observation data such as these are prone to errors of observational certainty, spatial accuracy, and sampling bias both geographically (e.g., more samples in easily accessible areas) and environmentally (e.g., more samples at lower elevations). To maximize observational certainty, we used only observations classified as verified (e.g., specimen, DNA, or photograph) or trusted (e.g., documented by a biologist, researcher, or taxonomic expert). To maximize spatial accuracy, we limited our data set to those locations with ≤ 100 m accuracy. Even though the vast majority of our observations resulted from targeted inventory or survey efforts (93% of showy milkweed, 91% of swamp milkweed, and 88% of monarch observations), sampling bias was still an issue as data were highly clustered at fine scales in portions of the state. Species distribution models can be sensitive to such bias and several authors have suggested spatial filtering or subsampling of the presence data to account for it (Phillips et al., 2009; Veloz, 2009; Anderson and Raza, 2010; Kramer-Schadt et al., 2013; Radosavljevic and Anderson, 2013). The key to spatial filtering is to randomly subsample presence data with a minimum distance separating the sample points, thereby limiting spatial autocorrelation and reducing the environmental bias caused by uneven sampling. That minimum distance is somewhat arbitrary, however, and depends on the environmental conditions of the study area as well as the resolution of the data used for modeling. We reduced the locally dense sampling of monarch and milkweed by randomly subsampling the observations with a minimum distance of 270 m, which accounted for the coarsest spatial data resolution of the environmental variables and the sampling design of the majority of field surveys. These filtering procedures (trusted or verified, ≤ 100 m accuracy, and >270 m separation) resulted in a total of 1079 showy milkweed observations, 100 swamp milkweed observations, and 344 monarch observations available for use in our modeling efforts (Figure 1).
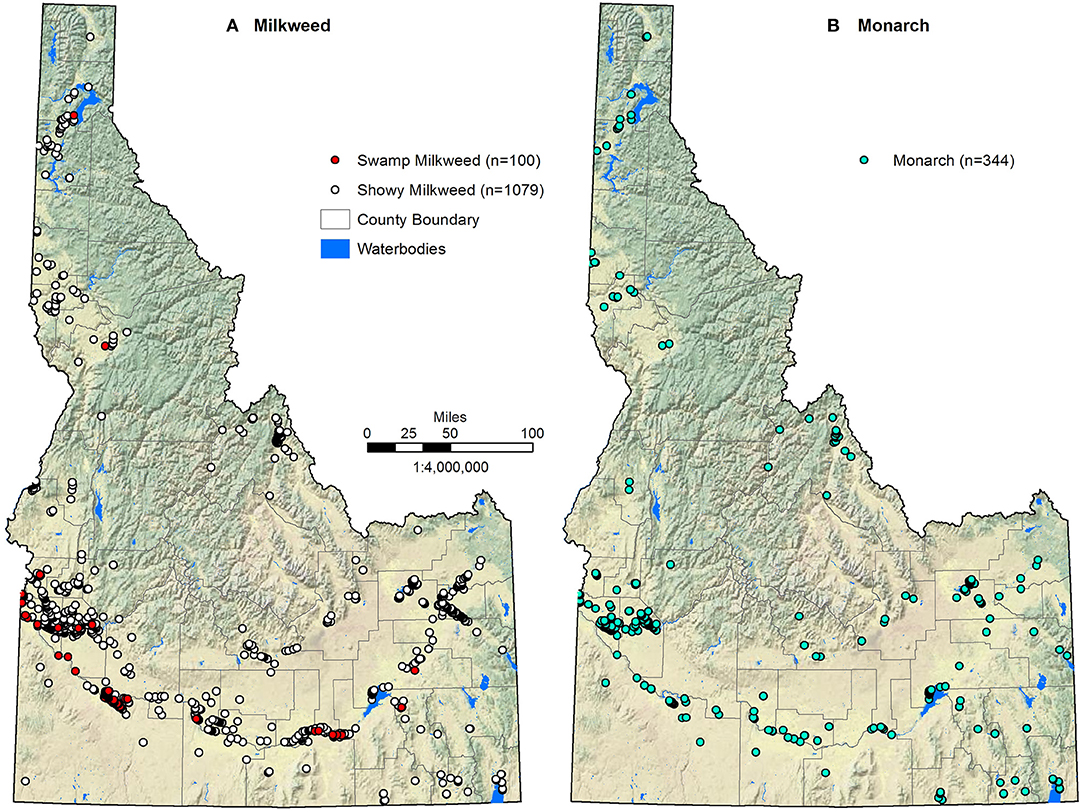
Figure 1. Milkweed (A) and monarch (B) observations used in modeling distributions across Idaho.
Environmental Variables
Previous modeling efforts have focused on a number of climatic, topographic, and edaphic environmental covariates at broader spatial extents (western US, eastern US) and resolutions (90 m−10 km cell sizes) (Batalden et al., 2007; Lemoine, 2015; Dilts et al., 2018). Learning from and building on these efforts, we compiled and/or developed finer-scale versions of these covariates (Table 1), striving to use data at scales most applicable to milkweed and monarch butterflies and to ensure variables represented ecophysiological processes known to influence plant growth either directly or as surrogates (Austin and Van Niel, 2011). Conducting all spatial analyses in ArcGIS 10.5.1 (ESRI, 2017), we ensured spatial data were in a common geographic coordinate system, spatial resolution (30 m), and extent (Idaho), and exported as ASCII files for input into R (3.5.0; R Core Team, 2018) and Maxent (Maxent 3.4.1; Phillips et al., 2006, 2017; Phillips and Dudík, 2008).
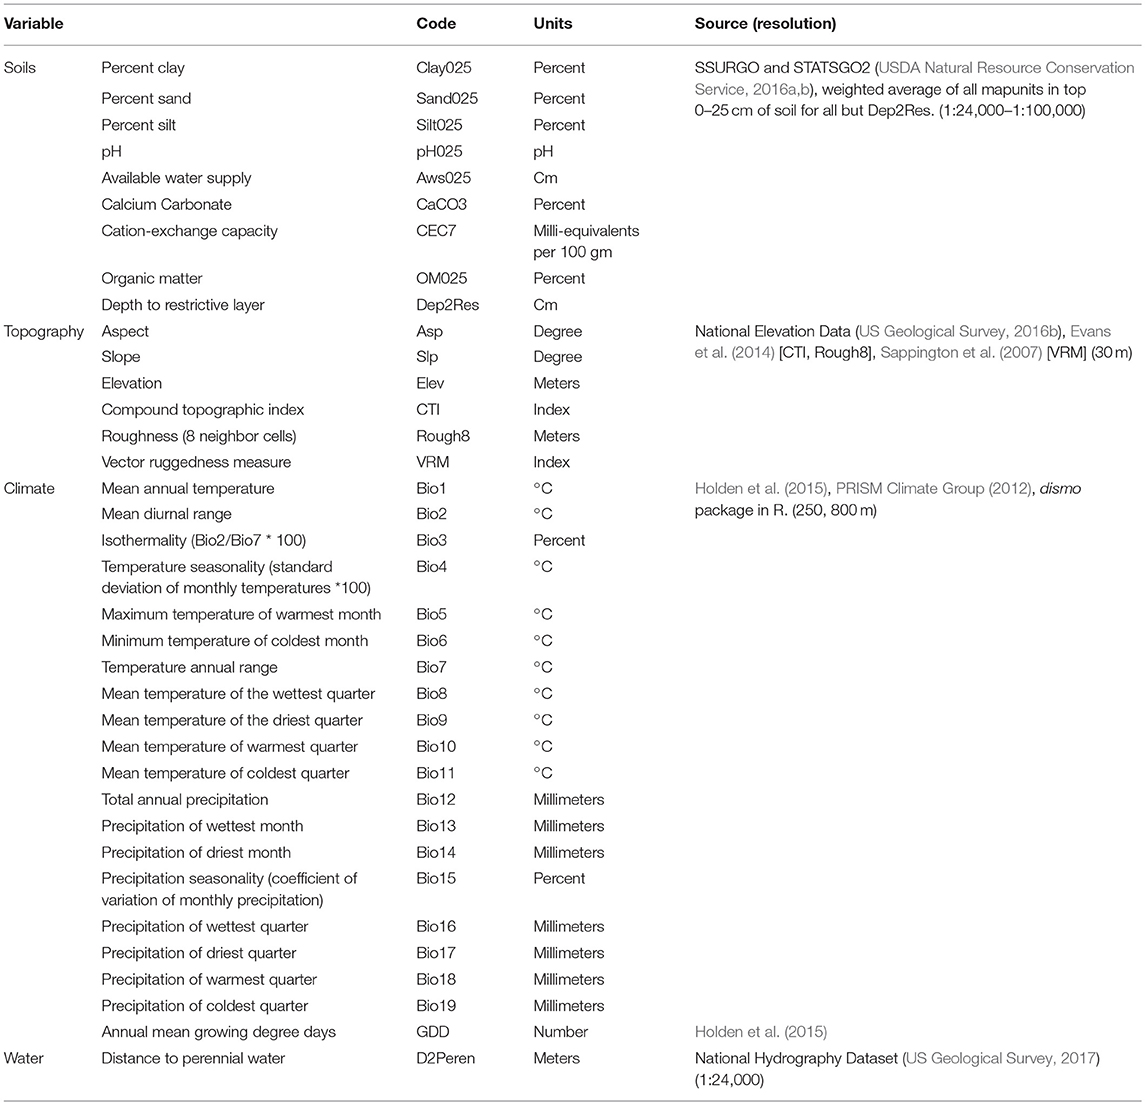
Table 1. Environmental variables used in monarch and milkweed distribution modeling in Idaho.
Topographic variables generally act as surrogates for factors influencing plant growth, but can also directly account for differences in local climate and be important in SDMs (Luoto and Heikkinen, 2008; Austin and Van Niel, 2011). We developed several topographic variables including elevation, slope, aspect, compound topographic index (CTI), roughness, and vector ruggedness measure (VRM) from the National Elevation Data (30 m) (US Geological Survey, 2016b). The CTI, a steady-state wetness index, measures the catenary topographic position represented by both slope and catchment size and aims to model soil water content (Moore et al., 1993). Roughness, similar to the terrain ruggedness index (Riley et al., 1999), calculates the amount of elevation difference between a grid cell and its neighbors, essentially the variance of elevation within the neighborhood (8 × 8 cells in this analysis). The VRM, which measures terrain heterogeneity within a neighborhood (9 × 9 cells in this analysis), captures variability in both slope and aspect into a single measure (Sappington et al., 2007). We calculated CTI and roughness using Evans et al. (2014) and VRM using Sappington (2012), both freely available ArcGIS tools. All of these topographic variables, to varying degrees, were selected to reflect temperature, water and light resources that help determine plant distributions and may contribute to monarch habitats. For example, CTI and roughness may serve as proxies for local temperature patterns (e.g., cold air drainage, Dobrowski et al., 2009) while VRM, slope, and aspect act as surrogates for light or solar radiation.
Edaphic measures developed were characteristics known to either affect the availability of nutrients or exert direct physiological limitations, or both, on plants and included percent sand, percent silt, percent clay, pH, available water supply, calcium carbonate, cation-exchange capacity, organic matter, and depth to a restrictive layer. To focus on the most critical soil for plant establishment, we used a weighted average based on percent composition for aggregating across all soil map units in the top 0–25 cm for all variables except soil depth. These data were developed primarily from the Soil Survey Geographic database (SSURGO, USDA Natural Resource Conservation Service, 2016a), with missing areas filled in with the U.S. General Soils database (STATSGO2, USDA Natural Resource Conservation Service, 2016b), following the national standard methodology and tools used for similar products (e.g., gSSURGO) (USDA Natural Resource Conservation Service, 2016c).
Climatic variables used in previous efforts relied on temperature and precipitation at moderate (~1 km) spatial resolution (Hijmans et al., 2005; Daly et al., 2008; Wang et al., 2012). To better represent Idaho climate we used more recent temperature data developed at finer spatial resolution (250 m) for the Northern Rockies (Holden et al., 2015) in combination with precipitation data (originally 800 m, resampled to 250 m resolution using cubic convolution to match the temperature data) from the Parameterized Regression on Independent Slopes Model (PRISM, Version 14.1-20140502-1000) (PRISM Climate Group, 2012; Daly et al., 2015). Both of these datasets represent monthly 30-year normals covering the period 1981-2010, from which we calculated 19 bioclimatic variables following Nix (1986) and Hijmans et al. (2005). These bioclimatic variables have been used extensively in SDMs for decades (e.g., Elith et al., 2010, 2011; Anderson and Gonzalez, 2011; Stanton et al., 2011; Booth et al., 2014), as well as in previous monarch and milkweed modeling studies (e.g., Lemoine, 2015; Dilts et al., 2018), and characterize climatic conditions best related to species physiology (O'Donnell and Ignizio, 2012; Booth et al., 2014).
To portray mid-century climate conditions we used projections from 20 Global Climate Models (GCM) participating in the Fifth Coupled Model Intercomparison Project that were statistically downscaled using the Multivariate Adaptive Constructed Analogs (MACA, Abatzoglou and Brown, 2012). Output from GCMs were downscaled using the historical training dataset of Abatzoglou (2013) to a 4-km spatial resolution. We calculated differences in monthly mean minimum temperature, maximum temperature, and accumulated precipitation between 1981-2010 and 2040-2069 for each of the 20 models given two emission scenarios, Representative Concentration Pathway [RCP] 4.5 and RCP 8.5. The latter, which we refer to herein as severe, assumes a business as usual emissions pathway whereas the former, referred to as moderate, assumes policies that lead to a plateau and eventual decline in emissions. While there is potential value in examining difference in the uncertainty in climate projections across models, we constrain our efforts on the 20-model mean change. Differences between ensemble mean future and baseline monthly climate data at a 4-km spatial resolution were interpolated to the 250-m resolution of the observed data and superposed to these 250-m gridded observed data to provide an estimate of the projected climate fields. We then recalculated the 19 bioclimatic variables using these projected values.
Other potentially informative landscape-related variables developed included distance to intermittent streams and distance to perennial streams and waterbodies based on the National Hydrography Data (US Geological Survey, 2017) (FCodes 46006 and 46003, respectively). We considered including land cover and percent natural land cover following Dilts et al. (2018), but instead chose to omit these variables because the spatial and thematic scale of the most current land cover data (US Geological Survey, 2016a) did not accurately reflect known milkweed occurrences. For example, >50% of both showy and swamp milkweed locations were mapped as developed, cultivated cropland, or open water, yet field surveys determined milkweed was rarely found in these types and instead preferred grasslands-herbaceous, emergent herbaceous wetlands, and deciduous forests (Waterbury and Potter, 2018). In addition, even if found important, future projections of land cover were lacking. Finally, as monarch breeding habitat is generally found to be constrained by the occurrence of milkweed (Lemoine, 2015; Dilts et al., 2018), the outputs from the showy and swamp milkweed models were included with the previous covariates when modeling monarchs.
Current/Future Habitat Suitability
We used maximum entropy methods (Maxent 3.4.1; Phillips et al., 2006, 2017; Phillips and Dudík, 2008) to model current potential habitat suitability for monarch, showy milkweed, and swamp milkweed, as well as the potential habitat suitability for the mid-21st century. Given a set of environmental variables and presence-only species occurrences, Maxent identifies the correlations between each variable and the presence data, compares that with the range of environmental conditions available in the modeled region, and develops a continuous model of relative likelihood of suitable habitat across the study area based on environmental similarity to known occupied sites. We choose to use Maxent because it does not require absence data, it efficiently handles complex interactions, it has been shown to perform better than other approaches with similar data, and it effectively transfers model projections to future conditions (Phillips et al., 2006; Elith et al., 2010, 2011). We supplied Maxent with occurrence data as described above, as well as background points consisting of 10,000 randomly generated pseudo-absences across Idaho that were >270 m apart, >270 m from presence locations, and outside of waterbodies.
Following recommended approaches (Elith et al., 2010, 2011; Anderson and Gonzalez, 2011; Merow et al., 2013; Radosavljevic and Anderson, 2013; Yackulic et al., 2013; Porfirio et al., 2014; Wright et al., 2015; Searcy and Shaffer, 2016; Morales et al., 2017), we developed current distribution models for monarch and milkweed using species-specific model parameters, particularly with regard to collinearity, regularization multiplier, and feature types. In Maxent, the feature types represent mathematical transformations of the covariates to allow complex relationships while the regularization multiplier imposes penalties to the model to help prevent overfitting (Elith et al., 2010, 2011; Merow et al., 2013). In an iterative approach, we optimized each model for feature types (linear, quadratic, product, threshold, hinge, and interactions) and regularization multiplier (values tested included 0.5, 1, 1.5, 2, 2.5, 3, 3.5, 4, 4.5, 5, 6, 7, 8, 9, 10, 12.5, 15, 17.5, and 20) using the enmSdm package (Smith, 2017) in R 3.5.0 (R Core Team, 2018) and selected the best performing combination based on sample size-corrected Akaike Information Criteria (AICc) (Warren and Seifert, 2011; Wright et al., 2015). Beginning with a full model inclusive of all covariates (n = 37), we implemented 10-fold cross-validation and jackknifing to measure importance of each variable to the resulting model. Variables were then ranked based on their permutation importance (Searcy and Shaffer, 2016) and removed if < 1% contribution. Correlated variables (Pearson correlation >|0.70|) were also removed keeping the variable with the higher permutation importance. This process of model optimization, development, and variable ranking and removal was repeated until all variables had a minimum contribution of ≥2%. The final model for each species represented the average of 10 cross-validation replicates using the optimized parameters and most important variables in cloglog output format and was evaluated using AUC (area under the receiver operating characteristic curve). We then projected the final models for each species onto spatial data projected for the two mid-century climate scenarios.
We imported all mean model outputs into ArcGIS 10.5.1 (ESRI, 2017) and identified areas of suitable and unsuitable habitat based on the “balance training omission, predicted area and threshold value” threshold calculated by Maxent. This threshold uses weighting constants to provide a balance between over-fitting and over-estimating. For comparative purposes, we further binned the suitable habitat using an expert opinion-based threshold to identify marginal and optimal suitability for each species. The current and two future models for each species were then overlaid to calculate the proportion of suitable habitat projected to remain suitable in the future (persistence), the proportion of current suitable habitat projected to become unsuitable (contraction), and the proportion of future habitat projected in currently unsuitable areas (expansion). Lastly, we tabulated the areas of gain and loss for pertinent IDFG Wildlife Management Areas (WMA), US Fish and Wildlife Service (USFWS) National Wildlife Refuges (NWR), and the US Forest Service (USFS) Curlew National Grassland (NG) to identify potential areas of concern.
Uncertainty is inherent in species distribution modeling simply due to limited knowledge of species-habitat relationships and correlative nature of the modeling process. Modeling potential effects of climate change introduces additional sources of potential variability given the range of estimates provided by each GCM. To assess how variability in projected changes might influence both the calculated bioclimatic variables as well as the modeling of suitable species habitat, we addressed potential uncertainty in two ways. First, we calculated the monthly standard deviation of projected changes in each climate measure (minimum temperature, maximum temperature, precipitation) to map variability among the 20 GCMs. This provided a simple way of evaluating potential influences on the bioclimatic variables. Second, we evaluated results of a Multivariate Environmental Similarity Surface analysis (Elith et al., 2010, 2011) to identify areas where novel conditions (i.e., conditions outside of the training range of the covariates) exist in model predictions and which variables were most limiting. In all cases, we assumed the species relationships with mapped covariates and correlations among covariates would remain consistent through time.
Results
Maxent accurately predicted current distributions for showy milkweed, swamp milkweed, and monarch with AUC = 0.899, 0.981, and 0.929, respectively (Figure 2). The best-fit models based on AICc for all three species employed linear, quadratic, and product features, with a regularization multiplier of 0.5 for showy milkweed and monarch and a regularization multiplier of 2.0 for swamp milkweed.
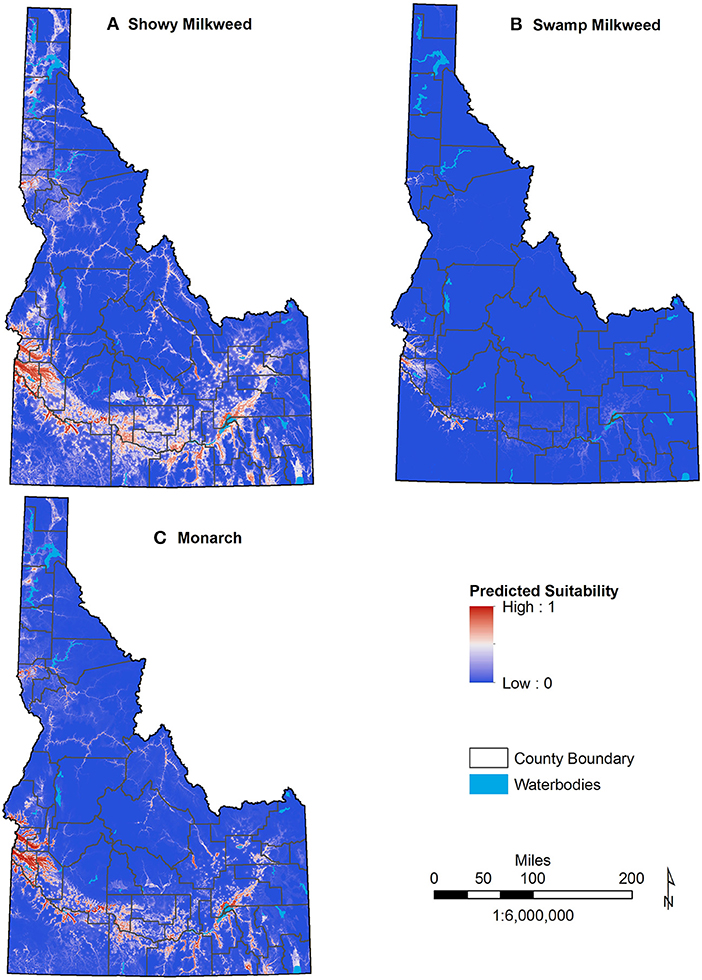
Figure 2. Current predicted distributions of showy milkweed (A), swamp milkweed (B), and monarch butterfly (C) across Idaho. Areas of higher suitability are shown in red with lower suitability in blue.
Suitable habitats for all three species were predominantly characterized as low in elevation (≤ 1,300 m) and near perennial water (≤ 1,000 m), particularly swamp milkweed. In addition, showy milkweed habitat occurred in areas of deeper soils (≥30 cm), lower precipitation (i.e., wettest month was relatively dry at ≤ 50 mm), and higher diurnal temperature range (≥14°C) (Figure 3; Table 2). Jackknife tests for showy milkweed indicated that mean diurnal temperature range had the most useful information by itself and elevation appeared to have the most information that was not present in other variables. Similarly, suitable swamp milkweed habitat was also characterized by areas with moderate monthly and annual temperature variability (isothermality ≥33%, temperature seasonality ≥7.75°C), moderate minimum winter temperatures (−1 to −9°C), low winter precipitation (≤ 75 mm), and moderate annual precipitation variability (seasonality 26–52%). Jackknife tests for swamp milkweed indicated that precipitation of the coldest quarter had the most useful information by itself and distance to perennial streams appeared to have the most information that was not present in other variables. Monarch habitat was predominantly a function of modeled showy milkweed habitat (probability ≥0.53) but also depended on warmer average temperatures (≥10°C) during the wettest part of the year. Jackknife tests for monarch indicated that the modeled prediction of showy milkweed had the most useful information by itself as well as appeared to have the most information that was not present in other variables.
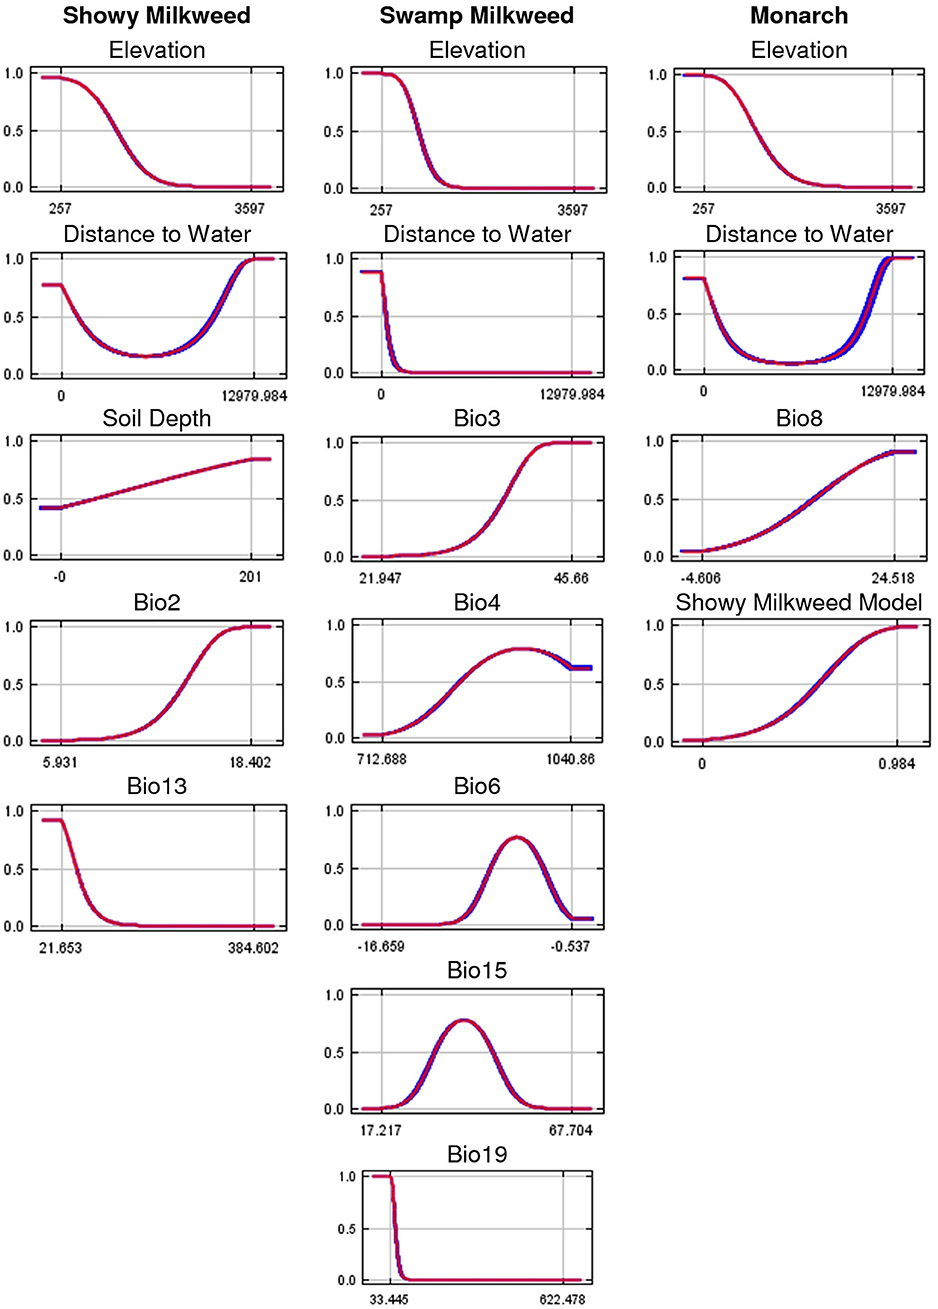
Figure 3. Response curves for the most important variables in the final showy milkweed, swamp milkweed, and monarch predicted current distribution models. Curves represent a model created using only that variable, and reflect the dependence of predicted suitability on the selected variable and on correlations between the selected variable and other variables. The mean response of 10 replicate runs is in red and the mean ± 1 standard deviation is in blue. Y-axis values are predicted probability of suitable conditions, as given by cloglog output format. See Table 1 for variable abbreviations.
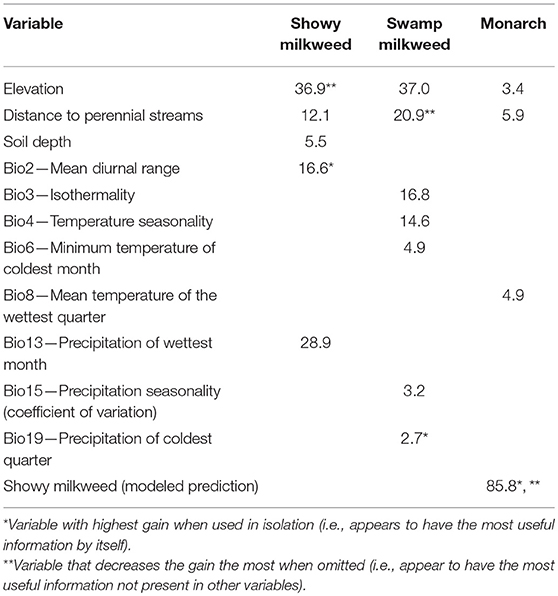
Table 2. Most important variables based on percent permutation importance for the final monarch and milkweed models.
Because selection of specific model thresholds is somewhat arbitrary and biologically meaningful thresholds can be difficult to determine, reporting a range of threshold values, or none at all, is often recommended (Liu et al., 2005; Merow et al., 2013). Although we considered several thresholds calculated by Maxent in the interpretation of habitat suitability (Table 3), the “Balance training omission, predicted area and threshold value area” threshold best reflected expert knowledge of known habitats across the state and captured 75% of monarch and showy milkweed occurrences and 88% of swamp milkweed occurrences. Thus, we defined suitable habitat for showy milkweed, swamp milkweed, and monarch using the threshold values of 0.4704, 0.1415, and 0.399, respectively. For all three species, we used an expert-opinion-based threshold of 0.7 to separate marginal and optimal habitat. Using these threshold values, models for present day conditions predicted 15,836 km2 of Idaho (7.4%) as suitable showy milkweed habitat with 36.0% (5,701 km2) of that as optimal, 3,125 km2 (1.5%) of Idaho as suitable swamp milkweed habitat with 8.8% (275 km2) as optimal, and 11,521 km2 (5.4%) of Idaho as suitable monarch habitat with 44.6% (5,143 km2) as optimal. Suitable habitats for all three species occur primarily along the Snake River and tributaries in south Idaho, with smaller amounts of habitat in the Pend Oreille, Coeur d'Alene, and Clearwater River valleys of north Idaho and the Salmon River of east-central Idaho (Figure 4). Nearly all (>98%) predicted suitable habitat for monarchs and swamp milkweed is encompassed by that predicted as suitable habitat for showy milkweed. Similarly, predicted suitable monarch habitat includes 98% of swamp milkweed distribution, but only 72% of showy milkweed distribution.
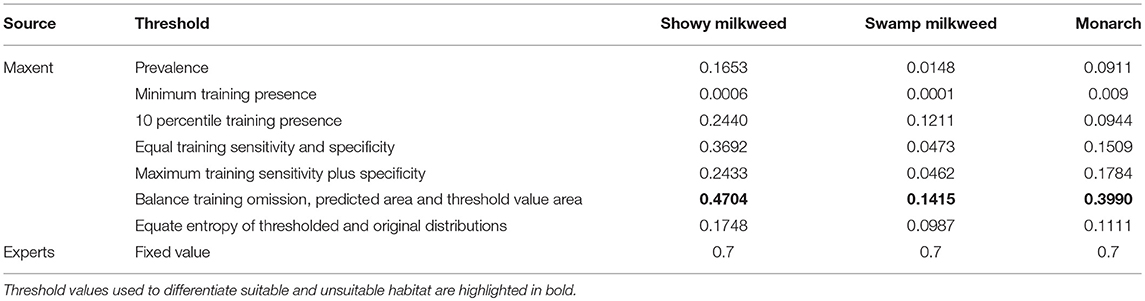
Table 3. Maxent modeled and expert opinion-based thresholds used in aiding interpretation of habitat suitability.
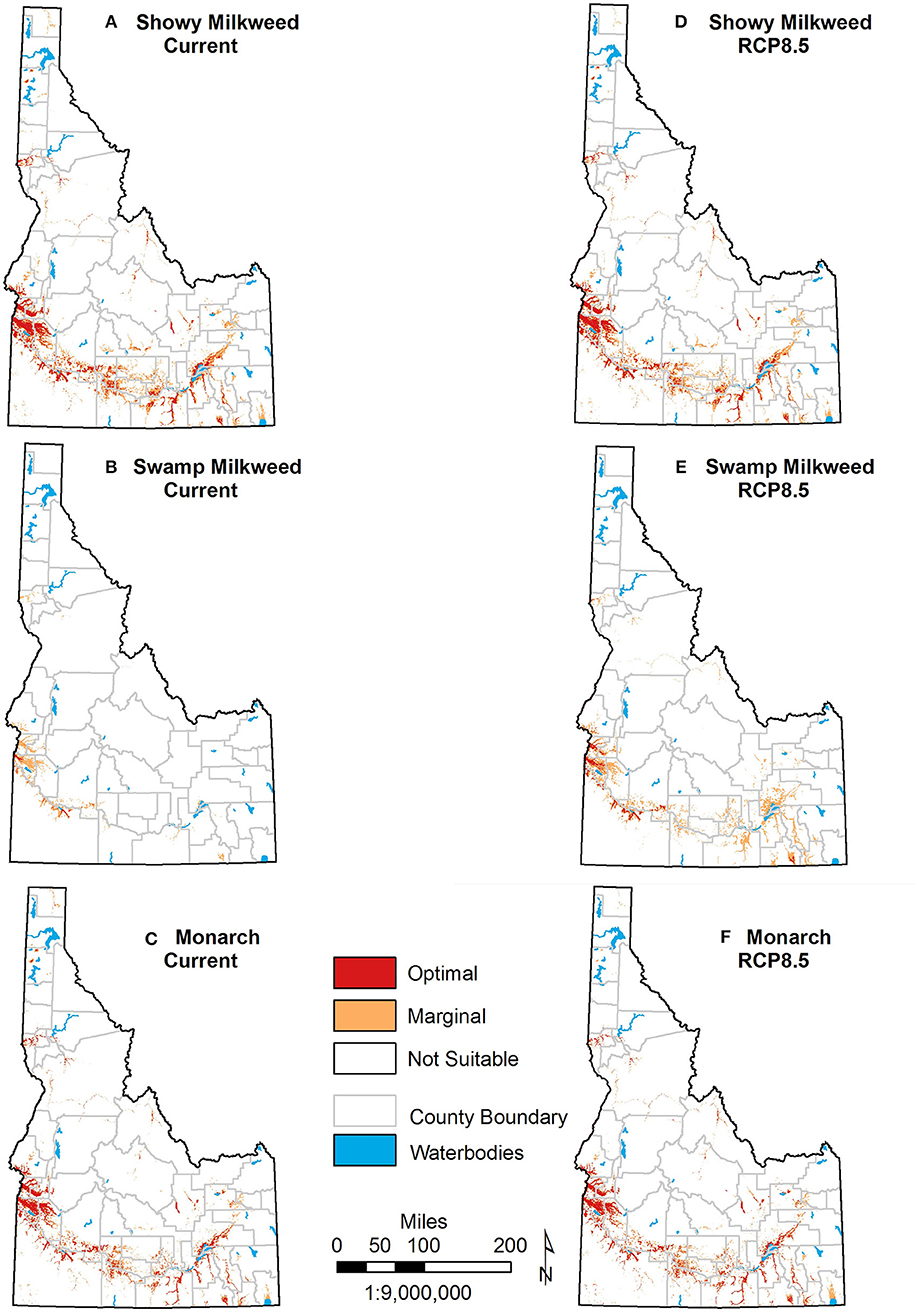
Figure 4. Current and future predicted distributions of showy milkweed (A,D), swamp milkweed (B,E), and monarch (C,F) across Idaho. Future distributions represent 20 global climate model average ensemble projections under severe (RCP 8.5) climate change scenarios. Separation of non-suitable habitat with marginal habitat is based on the “Balance training omission, predicted area and threshold value area” threshold, and separation with optimal habitat is based on an expert-derived threshold.
Mid-century projections suggested relatively small (<8.5% of current habitat) changes in the cumulative area of suitable habitat statewide for showy milkweed and monarch under either the moderate or more severe emission scenario (Figure 4; Table S1). Models projected contraction of showy milkweed suitable habitat (1,259 and 1,349 km2 for moderate and severe scenarios, respectively), with minor expansion (29 and 31 km2) into previously unsuitable areas, predominantly due to increased precipitation in the wettest month. For monarch, projected expansion (543 and 859 km2) was roughly similar to contraction (558 and 573 km2) and largely due to changes in the showy milkweed model as well as increased temperature of the wettest quarter. Conversely, projections for swamp milkweed showed considerable expansion (3,444 and 5,830 km2) with only minor contraction (1 km2 under moderate and 0 km2 under severe), a result of increased temperature seasonality, minimum temperature of the coldest month, and precipitation in the coldest quarter.
At a local scale, however, areas of expansion and contraction appear more substantial. This expansion and contraction is particularly apparent with projected increases of swamp milkweed into southeast Idaho, and contraction of both showy milkweed and monarch habitat in portions of north and south-central Idaho (Figure 5). Projected changes for selected managed areas are also important (Figure 6; Table S2). For example, 14 WMAs, four NWRs, and the Curlew NG are all projected to gain suitable habitat for swamp milkweed, including >10 km2 gains in Curlew NG, Minidoka NWR, and Mud Lake WMA. Conversely, while persistence of showy milkweed remains high, expansion of suitable habitat for the species is minor in extent (<0.2 km2) and limited to only two WMAs (CJ Strike and Craig Mountain). In fact, 20 of the 30 managed areas assessed are projected to lose suitable showy milkweed habitat, although all projected losses are <4.5 km2. Monarch projections are more variable with 12 areas projected to experience habitat expansion (0.1–15.2 km2), 7 to experience habitat contraction (0.1–1.4 km2), and two to experience both expansion and contraction. Overall, five managed areas in northern Idaho are projected to experience a cumulative loss of monarch and/or showy milkweed habitat by mid-century under a severe emission scenario (Figure 6).
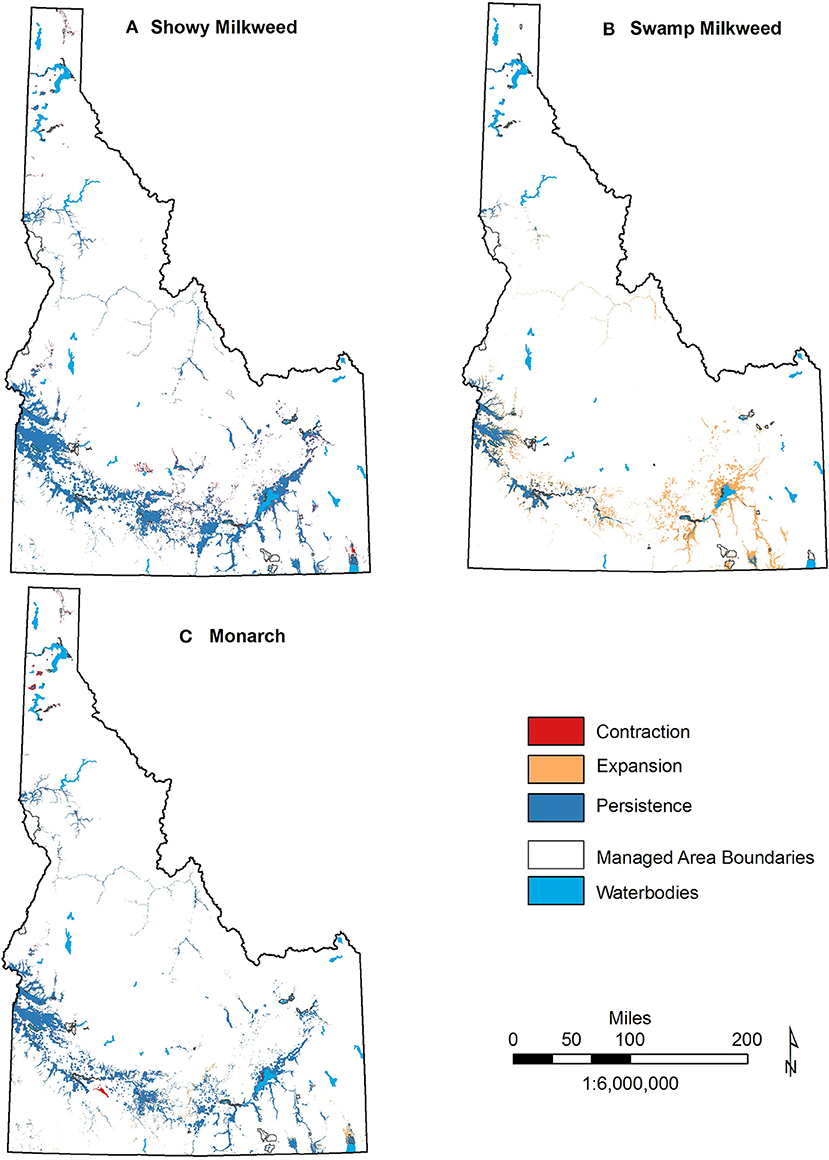
Figure 5. Areas of suitable habitat expansion, contraction, and persistence for showy milkweed (A), swamp milkweed (B), and monarch (C) distribution in Idaho under severe (RCP8.5) climate change scenarios in relation to important managed areas.
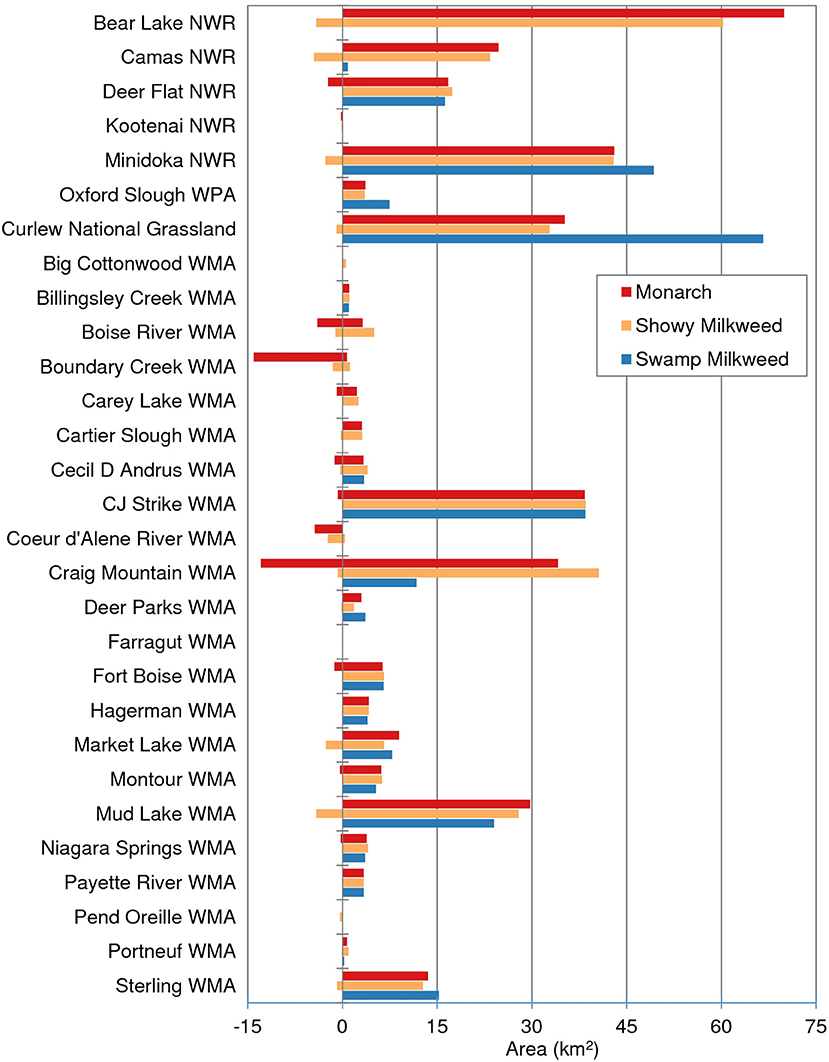
Figure 6. Area (km2) of projected suitable habitat for showy milkweed, swamp milkweed, or monarch breeding by mid-century under a severe (RCP8.5) climate change scenario within selected managed areas in Idaho. Positive values represent persisting and/or expanding habitat while negative values indicate habitat contraction.
Analyses of variability among GCMs and uncertainty in the SDMs suggest areas where these projections should be interpreted with caution. For showy milkweed, analyses indicated few areas with novel conditions under a severe emission scenario with only a few limiting variables in localized areas (Figure 7). For swamp milkweed, novel conditions are much more apparent, particularly in the valley bottoms of northcentral Idaho and a few localized areas in south Idaho due, predominantly, to the influence of minimum temperature of the coldest month (particularly in north Idaho), temperature seasonality and precipitation seasonality. For monarchs, novel conditions are evident in the southwest and a few areas in northcentral, primarily limited by mean temperature of the wettest quarter. In addition, monthly standard deviation of the projected changes in each of the core climate variables (minimum temperature, maximum temperature, precipitation) indicated both seasonal and spatial variability among the 20 GCMs (Figures S1–S3). For both minimum and maximum temperature, variability among the GCMs is greatest in early spring (Feb-April) in south-central and southeast Idaho, regardless of emission scenario. For precipitation, variability among the models is greatest during the summer months (July-Sept) in southwest Idaho, which also has the lowest precipitation during this time. Given the seasonality of the variability among GCMs, the bioclimatic variables most likely affected include mean diurnal range, isothermality, temperature seasonality, and precipitation seasonality. Thus, SDMs using these variables may over- or under-predict possible changes in suitable habitats.
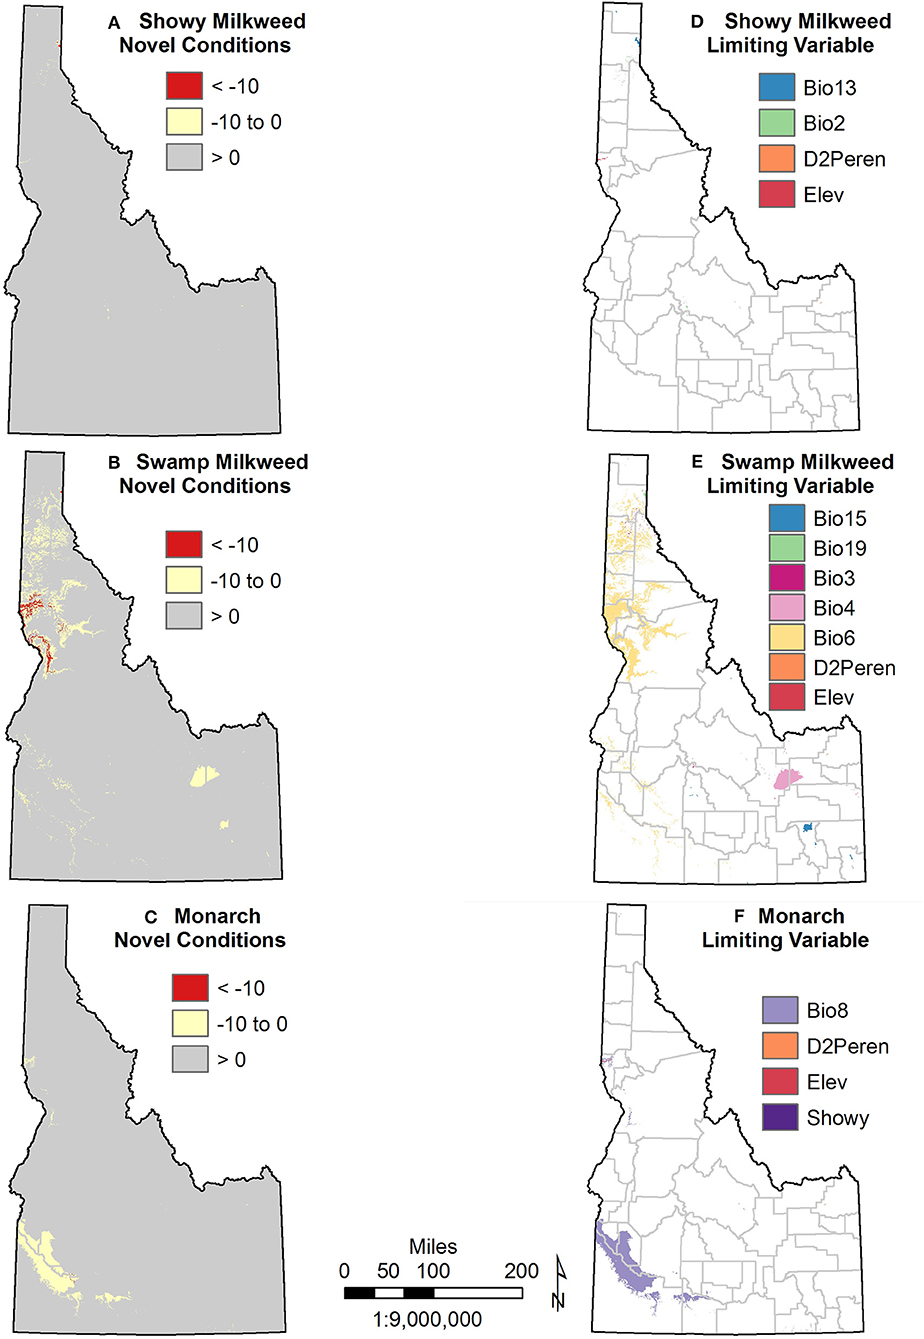
Figure 7. Model uncertainty as indicated by novel conditions and limiting variables for showy milkweed (A,D), swamp milkweed (B,E), and monarch (C,F). Only projections for the severe climate change scenario (RCP 8.5) are shown. Refer to Table 1 for variable abbreviations.
Discussion
Use of SDMs to depict current and potential future species distributions under changing climates is becoming commonplace, however local adaptation can result in significant variability in climate responses across a species range (Pearman et al., 2010; Hällfors et al., 2016; Ikeda et al., 2017; Nice et al., 2019). Our results indicated variability in milkweed response to projected climates in Idaho with the amount of showy milkweed suitable habitat decreased slightly statewide while swamp milkweed potential habitat doubled under a moderate emission scenario and nearly tripled under a more severe emission scenario. Projected amounts of suitable habitat for monarch in Idaho are likely to remain roughly stable with expansion nearly equal to contraction under a moderate scenario and slightly greater when under the more severe scenario. As such, our assessment of potential changes in monarch and milkweed distributions at a finer scale and in the northern portion of the range represents important contributions to the long-term conservation and management of the species.
Overall, our models of current distributions of milkweed and monarch habitats are similar to other broad-scale modeling efforts (Lemoine, 2015; Dilts et al., 2018) in that monarch distribution was largely a function of milkweed occurrence with relatively minimal influence of climate variables, although spring temperatures were positively related in our case as in Espeset et al. (2016). While monarchs are not in Idaho during the wettest time of year (spring), the combination of warm/wet conditions likely facilitates milkweed habitat, and thus suitability of monarch habitat. Milkweed distributions in Idaho were influenced by variables emphasizing annual and seasonal variability in temperature and precipitation as opposed to the more broad-scale efforts (Lemoine, 2015; Espeset et al., 2016; Dilts et al., 2018) that highlighted mean and maximum variables (e.g., mean annual temperature). Perhaps more importantly, our results suggest that at a more local/state scale, non-climatic factors such as soil depth, distance to water, and elevation play important roles in determining milkweed and monarch distributions. Although these factors (soil, water, elevation) are likely not independent of climate, but rather interact with climate to create suitable conditions.
The primary resources of light, heat, water, and nutrients constrain species distributions at topo- and meso-scales (Mackey and Lindenmayer, 2001). As such, several studies have indicated inclusion of edaphic variables is important when modeling plant distributions (Bertrand et al., 2012; Beauregard and de Blois, 2014; Diekman et al., 2015; Velazco et al., 2017) and we found a positive relationship between soil depth and showy milkweed habitat. Surprisingly, soil variables were not significant in the model for swamp milkweed, a species adapted for moist soils (Woodson, 1954) and typically found in marsh and saturated meadow habitats in the state (Waterbury and Potter, 2018). Distance to perennial water, however, was significant for all three species distributions but particularly swamp milkweed. Dilts et al. (2018) also found swamp milkweed dependent on proximity to perennial water and it may be that this factor overrides other explanatory soil variables important for the species (e.g., hydric soils). This general relationship of milkweeds with water may also help explain the use of riparian corridors as typical migratory paths for western monarchs (Pyle, 1999; Dingle et al., 2005; Morris et al., 2015). Future modeling efforts that go beyond the typical bioclimatic variables might effectively couple soils with climate. For example, a simple water balance model that considers soil water holding capacity, precipitation, and potential evapotranspiration that captures the joint seasonality of energy and moisture (e.g., Abatzoglou et al., 2018) might more concisely synthesize climatic and edaphic factors important for habitat.
Our results support the inclusion of elevation as a necessary predictor for species distributions (Luoto and Heikkinen, 2008; Randin et al., 2009; Oke and Thompson, 2015), potentially due to reflecting environmental conditions not properly portrayed by climate data (Körner, 2007; Oke and Thompson, 2015), the bioclimatic factors used in this study, or other topographic variables (e.g., slope, aspect, CTI). Correlations of elevation with climate and biophysical variables may vary over space and time (Phillips et al., 2006) and we chose to follow a process of variable selection that allowed for expert input while maximizing variable importance in the SDMs and minimizing correlations. As such, we identified only five climate variables that were significantly correlated with, but of less importance in the SDMs, and thus excluded by elevation. Interestingly, these excluded variables reflected mean and maximum temperature characteristics identified as important in broad-scale models (Lemoine, 2015; Espeset et al., 2016; Dilts et al., 2018) but suggested as less relevant to butterfly distributions (Filz et al., 2013). The importance of elevation in our models suggests the included bioclimatic variables may still be inadequately capturing physical processes related to moisture and/or energetics of milkweed habitat either due to missing variables (e.g., downward shortwave radiation) or mismatches of scale. Ultimately, local fine-scale variability in topographic, climatic, and edaphic characteristics can result in extreme differences in growing conditions for plants (Austin and Van Niel, 2011; Lembrechts et al., 2018). In addition, the effects of climate change may be elevationally dependent (Nice et al., 2019), although that effect is not well-represented through our current approach using a statistically downscaled model ensemble. It remains unknown on how synoptic and land-surface factors will modify the occurrence and strength of cold air drainages and other elevation-dependent changes in climate in future climate (Daly et al., 2010; Pepin et al., 2015). Advances in understanding how climate change will manifest itself at these finer spatial scales may help improve estimates of changes in impacts.
To date, the rather substantial projected broad-scale northward expansions of showy milkweed and swamp milkweed as well as monarch breeding distributions (Batalden et al., 2007; Lemoine, 2015) are driven chiefly by increasing temperatures. Our results suggest that northward expansion might not be the case in Idaho. While we did project expansions of suitable swamp milkweed habitat, expansions were predominantly in the east and southeastern portions of the state. Conversely, showy milkweed expansions and contractions were minimal, but concentrated such that many of the managed areas in the northern portion of Idaho were projected to experience greater habitat losses than gains. Similarly, projected expansion of monarch distribution occurred mainly in the southeast with contractions in the north. These estimates reflect the spatial patterns of observed and projected increases in winter and spring temperature and precipitation across Idaho (Abatzoglou et al., 2014; Klos et al., 2015; Rupp and Abatzoglou, 2017). Our models indicated species expansion in areas with moderately increasing precipitation coupled with warming temperatures (i.e., southeast) but contraction in some areas, particularly in north Idaho, that may become too wet during spring to provide suitable habitat. Given future climate projections of progressively hotter, drier summers and warmer, wetter winters as well as the highly variable topography and amount of natural landscapes available in Idaho, one might hypothesize substantial expansion of showy milkweed suitable habitat due to upslope range shifts. While the iterative variable inclusion process works well modeling current distributions, it can be an important source of uncertainty for future predictions (Braunisch et al., 2013). Our models suggest current habitat suitability for all three species declines with increasing elevation. Given that elevation remains constant under future climate conditions, the future model projections are thus limited to lower elevations reducing the ability of higher elevation areas to potentially be modeled as expanded habitat under future scenarios. Development of a climate-only model, or inclusion of the elevation-correlated temperature variables mentioned above, may have resulted in just such changes in suitable habitat. However, projecting the effects of climate change on species in topographically diverse areas is complex. Climate-only models may not reflect realistic patterns as local topography can result in steep, fine-scale temperature gradients (e.g., insolation or cool-air pooling) (Daly et al., 2010; Holden et al., 2015) that can moderate the effects of rising temperatures by creating microclimates and refugia that enable species persistence (Luoto and Heikkinen, 2008; Austin and Van Niel, 2011; Suggitt et al., 2011; Lembrechts et al., 2018). In addition, variation in edaphic measures and habitat can also alter microclimates and refugia (Suggitt et al., 2011; Bertrand et al., 2012; Beauregard and de Blois, 2014). In fact, the presence of suitable microclimates due to substantial variability in these characteristics may be a key factor in the persistence of both milkweeds and monarch butterflies in Idaho.
In the absence of climate refugia, known physiological constraints of monarchs may further alter the extent of breeding distribution in Idaho beyond our model results. Monarchs typically arrive in Idaho in June, breed through August, then depart mid-August/mid-September (Waterbury and Potter 2018). Currently, maximum monthly temperatures during these months are generally within the optimal (27–29°C) or sub-lethal (30–36°C) range for monarch survival identified in laboratory studies (Zalucki, 1982; York and Oberhauser, 2002; Zalucki and Rochester, 2004; Nail et al., 2015) (Figure 8). Under a severe emission scenario, however, maximum temperatures are projected to increase substantially between June and September with areas in the optimal and sub-lethal range expanding greatly and a portion of current habitat in the southwest exceeding 36°C (maximum 38.7°C). While limited exposure to high temperatures (36–38°C) is not detrimental to monarchs, extended exposure is lethal to immature stages (York and Oberhauser, 2002; Nail et al., 2015; James, 2016). Following a similar spatial pattern, minimum temperatures are also projected to increase such that the amount of area above the lower temperature threshold for larval development (≥11°C, Zalucki, 1982) also expands substantially from June-September. Spatially extensive warming on the shoulder months of June and September may result in earlier and/or later breeding over broader areas of Idaho, potentially resulting in additional breeding generations (Batalden et al., 2007), but lethal temperature limits in the southwest may result in increased mortality in important managed areas such as Payette River WMA, Montour WMA, Fort Boise WMA, CJ Strike WMA, and Deer Flat NWR. In addition, increases in the frequency and duration of extreme temperatures may result in earlier senesce and/or reduced nutritional quality of important milkweed and other nectaring plants. Given climate variability, there will likely be years in which summer temperatures are above and below averages reported here. These model projections underscore the need to investigate western monarch population vital rates across all life stages (i.e., survival, individual growth, reproduction, recruitment) to better predict monarch response to changing climates and weather (Schultz et al., 2017; Belsky and Joshi, 2018).
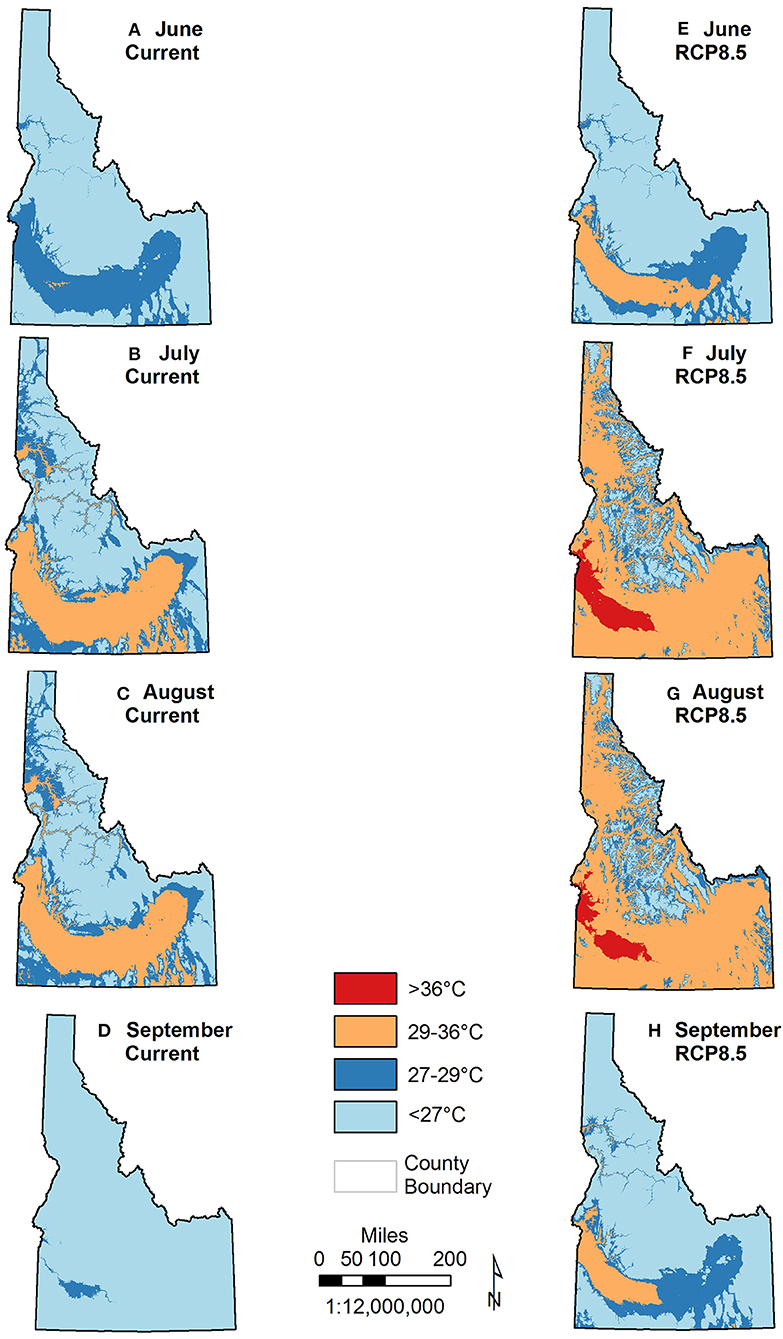
Figure 8. Extent of optimal and lethal maximum temperatures for monarchs based on derived maximum monthly temperatures for current (1980-2010) and projected mid-century under RCP8.5 in June (A,E), July (B,F), August (C,G), and September (D,H).
Management Implications and Caveats
Mapped classes of suitable, marginal, and optimal habitats showcase how relatively small and fragmented suitable areas are for monarch and milkweed in Idaho, which appears to be the case in on-the-ground surveys (Waterbury and Potter, 2018). Even so, our study shows that suitable habitat for monarch and/or milkweeds will likely continue to be found in managed areas traditionally seen as priority habitats through mid-century. For example, Waterbury and Potter (2018) documented major monarch eclosure events at Bear Lake NWR, CJ Strike WMA, Sterling WMA, and Fort Boise WMA in recent years. Extensive areas of suitable habitats are projected to persist in all four of these managed areas, with sizeable habitat expansions (>4 km2) in Bear Lake NWR. Additional managed areas with substantial expansions include Camas NWR, Minidoka NWR, Curlew NG, and Mud Lake WMA. Even though total amount of suitable habitat statewide is not projected to drastically diminish, geographic patterns in habitat contractions suggest that five areas in northern Idaho (Kootenai NWR, Boundary Creek WMA, CDA River WMA, Farragut WMA, and Pend Oreille WMA) may lose nearly all suitable habitat. Based on our results, protected areas currently encompass 8, 11, and 9% of suitable habitat for showy milkweed, swamp milkweed, and monarch, respectively, with 2.4% of showy milkweed habitat and 2.9% of swamp milkweed and monarch habitat protected under the IDFG, USFWS, and USFS managed areas we assessed. Under the most severe climate change scenario, this percentage increases for all three species to 2.5, 3.0, and 3.2%, respectively. These managed areas, however, represent a relatively small proportion of current and future suitable milkweed and monarch habitats in Idaho, indicating sizeable potential to engage private landowners and industry in expanding habitat protection, enhancement, and restoration to benefit monarchs and other pollinators in Idaho.
Currently, distribution of showy milkweed encompasses virtually all suitable swamp milkweed habitat. This relationship is seen in the field as well with swamp milkweed generally co-occurring with showy milkweed in Idaho. These areas of co-occurrence tend to have the highest monarch productivity due to extended phenology with showy milkweed early and swamp milkweed later (Waterbury and Potter, 2018). If swamp milkweed expands, but showy milkweed does not, these areas may experience reduced early-season monarch productivity but, conversely, increased later-season monarch productivity. Greater availability of later-blooming swamp milkweed may also aid the migratory generation, both locally-produced and those stopping by from points further north. Although our results suggest broad-scale overlap of milkweed and monarch occurrence, at finer scales, presence of milkweed is not synonymous with presence of monarchs. Breeding monarchs likely select for a range of variables beyond what we could model to maximize reproductive fitness. Such resource selection studies are lacking but urgently needed for the western monarch population. Further inventory is also needed to assess potential climate adaptability and habitat relationships of monarchs with other native milkweeds (narrow-leaved, pallid, and spider) in Idaho. In addition, monitoring that incorporates areas of potential habitat expansion would ensure changes in distribution are documented and not just assumed a population loss due to declining numbers in specific areas.
Even though we employed best modeling practices recommended in the literature (Elith et al., 2010, 2011; Anderson and Gonzalez, 2011; Merow et al., 2013; Radosavljevic and Anderson, 2013; Yackulic et al., 2013; Porfirio et al., 2014; Wright et al., 2015; Searcy and Shaffer, 2016; Morales et al., 2017), our models and analyses are still subject to several caveats based on ecological and mathematical assumptions inherent in SDMs developed with Maxent and violation of these assumptions can affect model inferences to varying degrees (Phillips et al., 2006, 2017; Wiens et al., 2009; Merow et al., 2013; Yackulic et al., 2013). Key to Maxent, both sampling probability and detection probability are assumed constant across space. Although we attempted to account for multiple sources of uncertainty in our compiled occurrence data, including sampling bias, this key assumption may not be met. Similarly, detection probabilities for milkweed and monarch butterflies are unknown but, given both species are generally conspicuous on the landscape, we assumed detection probability was constant. Our choice of background extent and threshold values to determine suitable/non-suitable habitat likely also influenced model results, thus there may be more or less habitat available than we are suggesting. The true distribution of monarchs and milkweeds in Idaho is likely beyond the resolution our models provide, both spatially and thematically. We used the finest spatial data available (250 m climate, 30 m all others), yet even this resolution likely averaged over micro-environments important in the establishment of milkweed and/or the breeding of monarchs, as well as potential refugia.
Fundamental to SDMs, the species is assumed to be in equilibrium with its environment and its occurrence data representative of suitable habitat. In addition, SDMs are correlative in nature and, while selected model covariates are assumed to adequately reflect determinants of species distributions at relevant temporal and spatial scales, derived relationships may be due to other correlated variables not assessed. We modeled milkweed and monarch distributions based on the assumption that abiotic factors (light, heat, water, nutrients; Mackey and Lindenmayer, 2001) primarily controlled occurrence. However, other variables important in determining milkweed and monarch distributions may be lacking such as land cover or disturbance (Suggitt et al., 2011; Dilts et al., 2018) or light/solar radiation (Austin and Van Niel, 2011). Biotic interactions, genetic responses and geographic barriers limiting dispersal and/or colonization likely also dictate species distributions to some degree (Wiens et al., 2009). SDMs are also assumed to be spatially and temporally transferable. Projecting through time assumes the relationships among monarch, milkweeds, and their environs will remain consistent and that the correlation among this suite of variables will also remain consistent. In other words, we are assuming the species and their environment, as well as multiple components of that environment, will not become decoupled from each other (Walther, 2010). Furthermore, we still know little about monarch and milkweed direct relationships with climate and potential abiotic and biotic interactions (e.g., soils, parasites, monarch vital rates) at local scales, as well as species adaptive capacity (Dawson et al., 2011; Beever et al., 2016), both of which are likely to influence current and future distributions.
Lastly, uncertainty in the climate projections can be due to emission scenario, model structure, or natural climate variability (Hawkins and Sutton, 2011; Woldemeskel et al., 2016). We used a multi-model mean of 20 MACA downscaled GCMs because it performs well in areas of complex terrain (Abatzoglou and Brown, 2012). However, this does limit the SDMs to bulk-30 year averages and does not account for climate variability and extremes at finer temporal scales that may affect milkweeds and/or monarchs themselves, although assessments of SDMs and semi-process based models show similar performance (Parker and Abatzoglou, 2017). Both emission scenarios we assessed represent realistic scenarios of future conditions. Focusing on mid-century, as opposed to end-of-century, projections limited the extent of uncertainty as well in that there is an average of only about 1°C difference in temperature change between scenarios by the mid-century (Rupp and Abatzoglou, 2017). However, neither emission scenario takes into consideration potential cascading and/or interacting effects such as non-native plant invasions, changes in land use (e.g., extent of agricultural or urbanization), and changes in water usage. For instance, areas predicted to persist or expand under our two emission scenarios (i.e., Snake River Plain) are expected to favor cool-season species of exotic invasives such as cheatgrass (Bromus tectorum) (Smith et al., 2006; Bradley, 2009). Interactions between climate change and cheatgrass proliferation may combine to increase invasion risk to native rangeland and grassland ecosystems, thereby increasing fine fuels and risk of frequent and/or large-scale wildfires (Whisenant, 1990; D'Antonio and Vitousek, 1992). Likewise, changes in waterbody extent, distribution and water usage may play an important role in agriculture-intensive areas within an irrigation landscape (high water demand and diminishing aquifer), such as in areas of the Snake River Basin predicted as expansion for swamp milkweed. Because we limited our study extent to Idaho, future model projections may also not capture the full range of environments milkweed and monarch inhabit in other areas. In other words, areas and covariate values identified as “novel” in our analyses are only novel for Idaho and may not be in other areas.
Even with these caveats, our models accurately predict current and project future distributions of milkweed and monarchs and provide a means for assessing potential changes in habitat and distributions, identifying priority areas for conservation, and directing future research and monitoring efforts. While broad-scale modeling efforts provide a baseline understanding of species-habitat relationships and distribution, and can help guide finer-scale sampling efforts (such as our use of earlier versions of Dilts et al. (2018), or adoption of sampling schemes that collect presence/absence data), they fail to consider the potential for intraspecific variability in climate relationships and potential for local refugia. Understanding this variability is key in knowing just how vulnerable a species may be in a given area, as well as identifying the most appropriate adaptive management. Even state-level analyses, as ours, are likely to overlook more regional or local level variability in species responses (Pearman et al., 2010; Hällfors et al., 2016; Ikeda et al., 2017; Nice et al., 2019) and we recommend additional efforts to identify regions of smaller extents where climate responses of monarchs and milkweed are likely to be more homogeneous.
Author Contributions
LS and BW contributed conception and design of the study and funding acquisition. JA developed climate scenarios. LS conducted analysis and wrote the first draft of the manuscript. BW and JA wrote sections of the manuscript. All authors contributed to manuscript revision and read and approved the submitted version.
Funding
This research was funded by the USFWS Federal Aid in Wildlife Restoration Program (Grant Number F16AF01105, Amendment 1) with match from the IDFG Nongame Trust Fund.
Conflict of Interest Statement
The authors declare that the research was conducted in the absence of any commercial or financial relationships that could be construed as a potential conflict of interest.
Acknowledgments
We thank the numerous field crews, citizen scientists, College of Western Idaho, and Xerces Society staff for data collection and compilation over the years. We also thank Adam Smith for modeling assistance and Tyler Flockhart, Nathan Lemoine and Wayne Thogmartin for comments on earlier drafts.
Supplementary Material
The Supplementary Material for this article can be found online at: https://www.frontiersin.org/articles/10.3389/fevo.2019.00168/full#supplementary-material
References
Abatzoglou, J. T. (2013). Development of gridded surface meteorological data for ecological applications and modeling. Int. J. Climatol. 33, 121–131. doi: 10.1002/joc.3413
Abatzoglou, J. T., and Brown, T. J. (2012). A comparison of statistical downscaling methods suited for wildfire applications. Int. J. Climatol. 32, 772–780. doi: 10.1002/joc.2312
Abatzoglou, J. T., Dobrowski, S. Z., Parks, S. A., and Hegewisch, K. C. (2018). Data from: terraclimate, a high-resolution global dataset of monthly climate and climatic water balance from 1958–2015. Scie. Data 5:170191. doi: 10.1038/sdata.2017.191
Abatzoglou, J. T., Rupp, D. E., and Mote, P. W. (2014). Seasonal climate variability and change in the Pacific Northwest of the United States. J. Clim. 27, 2125–2142. doi: 10.1175/JCLI-D-13-00218.1
Agrawal, A. A., and Inamine, H. (2018). Mechanisms behind the monarch's decline. Science 360, 1294–1296. doi: 10.1126/science.aat5066
Anderson, R. P., and Gonzalez, I. Jr (2011). Species-specific tuning increases robustness to sampling bias in models of species distributions: an implementation with Maxent. Ecol. Model. 222, 2796–2811. doi: 10.1016/j.ecolmodel.2011.04.011
Anderson, R. P., and Raza, A. (2010). The effects of the extent of the study region on GIS models of species geographic distributions and estimates of niche evolution: preliminary test with montane rodents (genus Nephelomys) in Venezuela. J. Biogeogr. 37, 1378–1393. doi: 10.1111/j.1365-2699.2010.02290.x
Austin, M. P., and Van Niel, K. P. (2011). Improving species distribution models for climate change studies: variable selection and scale. J. Biogeogr. 38, 1–8. doi: 10.1111/j.1365-2699.2010.02416.x
Batalden, R., Oberhauser, K. S., and Peterson, A. T. (2007). Ecological niches in breeding generations of Eastern North American monarch butterflies. Ecol. Entomol. 36, 1365–1373 doi: 10.1603/0046-225X(2007)36[1365:ENISGO]2.0.CO;2
Beauregard, F., and de Blois, S. (2014). Beyond a climate-centric view of plant distribution: edaphic variables add value to distribution models. PLoS ONE 9:e92642. doi: 10.1371/journal.pone.0092642
Beever, E. A., O'Leary, J., Mengelt, C., West, J. M., Julius, S., Green, N., et al. (2016). Improving conservation outcomes with a new paradigm for understanding species' fundamental and realized adaptive capacity. Conserv. Lett. 9, 131–137. doi: 10.1111/conl.12190
Belsky, J., and Joshi, N. K. (2018). Assessing role of major drivers in recent decline of monarch butterfly population in North America. Front. Environ. Sci. 6:86. doi: 10.3389/fenvs.2018.00086
Bertrand, R., Perez, V., and Gegout, J.-C. (2012). Disregarding the edaphic dimension in species distribution models leads to the omission of crucial spatial information under climate change: the case of Quercus pubescens in France. Glob. Chang. Biol. 18, 2648–2660. doi: 10.1111/j.1365-2486.2012.02679.x
Booth, T. H., Nix, H. A., Busby, J. R., and Hutchinson, M. F. (2014). BIOCLIM: the first species distribution modelling package, its early applications and relevance to most MaxEnt studies. Divers. Distrib. 20, 1–9. doi: 10.1111/ddi.12144
Bowles, M. L., McBride, J. L., and Betz, R. F. (1998). Management and restoration ecology of the federal threatened Mead's Milkweed, Asclepias meadii (Asclepiadaceae). Ann. Mo. Bot. Gard. 85, 110–125. doi: 10.2307/2992001
Bradley, B. (2009). Regional analysis of the impacts of climate change on cheatgrass invasion shows potential risk and opportunity. Glob. Chang. Biol. 15, 196–208. doi: 10.1111/j.1365-2486.2008.01709.x
Braunisch, V., Coppes, J., Arlettaz, R., Schant, R., Schmid, H., and Bollmann, K. (2013). Selecting from correlated climate variables: a major source of uncertainty for predicting species distribution under climate change. Ecography 36, 971–983. doi: 10.1111/j.1600-0587.2013.00138.x
Couture, J. J., Serbin, S. P., and Townsend, P. A. (2015). Elevated temperature and periodic water stress alter growth and quality of common milkweed (Asclepias syriaca) and monarch (Danaus plexippus) larval performance. Arthropod Plant Interact. 9, 149–161. doi: 10.1007/s11829-015-9367-y
Daly, C., Conklin, D. R., and Unsworth, M. H. (2010). Local atmospheric decoupling in complex topography alters climate change impacts. Int. J. Climatol. 30, 1857–1864. doi: 10.1002/joc.2007
Daly, C., Halbleib, M., Smith, J. I., Gibson, W. P., Doggett, M. K., Taylor, G. H., et al. (2008). Physiographically sensitive mapping of climatological temperature and precipitation across the conterminous United States. Int. J. Climatol. 28, 2031–2064. doi: 10.1002/joc.1688
Daly, C., Smith, J. I., and Olson, K. V. (2015). Mapping atmospheric moisture climatologies across the Conterminous United States. PLoS ONE 10:e0141140. doi: 10.1371/journal.pone.0141140
D'Antonio, C. M., and Vitousek, P. M. (1992). Biological invasions by exotic grasses, the grass fire cycle, and global change. Annu. Rev. Ecol. Syst. 23, 63–87. doi: 10.1146/annurev.es.23.110192.000431
Dawson, T. P., Jackson, S. T., House, J. I., Prentice, I. C., and Mace, G. M. (2011). Beyond predictions: biodiversity conservation in a changing climate. Science 332, 53–58. doi: 10.1126/science.1200303
Diekman, M., Michaelis, J., and Pannek, A. (2015). Know your limits - the need for better data on species responses to soil variables. Basic Appl. Ecol. 16, 563–572. doi: 10.1016/j.baae.2015.08.010
Dilts, T. D., Steele, M., Black, S., Craver, D., Cruz, E., Engler, J., et al. (2018). Data From: Western Monarch and 779 Milkweed Habitat Suitability Modeling Project Version 2 – Maxent Model Outputs. Xerces Society, U.S. Fish and Wildlife Service, University of Nevada Reno. Available online at: https://www.monarchmilkweedmapper.org/habitatsuitabilitymodels
Dingle, H., Zalucki, M. P., Rochester, W. A., and Armijo-Prewitt, T. (2005). Distribution of the monarch butterfly, Danaus plexippus (L.) (Lepidoptera:Nymphalidae) in western North America. Biol. J. Linn. Soc. 85, 491–500. doi: 10.1111/j.1095-8312.2005.00512.x
Dobrowski, S. Z., Abatzoglou, J. T., Greenberg, J. A., and Schladow, S. G. (2009). How much influence does landscape-scale physiography have on air temperature in a mountain environment? Agric. For. Meteorol. 149, 1751–1758. doi: 10.1016/j.agrformet.2009.06.006
Elith, J., Kearney, M., and Phillips, S. (2010). The art of modeling range-shifting species. Methods Ecol. Evol. 1, 330–342. doi: 10.1111/j.2041-210X.2010.00036.x
Elith, J., Phillips, S. J., Hastie, T., Dudík, M., Chee, Y. E., and Yates, C.J. (2011). A statistical explanation of MaxEnt for ecologists. Divers. Distrib. 17, 43–57. doi: 10.1111/j.1472-4642.2010.00725.x
Espeset, A. E., Harrison, A. G., Shapiro, A. M., Nice, C. C., Thorne, J. H., Waetjen, D. P., et al. (2016). Understanding a migratory species in a changing world: climatic effects and demographic declines in the western monarch revealed by four decades of intensive monitoring. Oecologia 181:819–830. doi: 10.1007/s00442-016-3600-y
Evans, J. S., Oakleaf, J., Cushman, S. A., and Theobald, D. (2014). Data from: An ArcGIS Toolbox for Surface Gradient and Geomorphometric Modeling, version 2.0-0. Available online at: https://evansmurphy.wixsite.com/evansspatial/arcgis-gradient-metrics-toolbox
Filz, K. J., Schmitt, T., and Engler, J. O. (2013). How fine is fine-scale? Questioning the use of fine-scale bioclimatic data in species distribution models used for forecasting abundance patterns in butterflies. Eur. J. Entomol. 110, 311–317. doi: 10.14411/eje.2013.044
Fisher, A., Saniee, K., van der Heide, C., Griffiths, J., Meade, D., and Villablanca, F. (2018). Climatic niche model for overwintering monarch butterflies in a topographically complex region of California. Insects 9:167. doi: 10.3390/insects9040167
Flockhart, D. T. T., Brower, L. P., Ramirez, M. I., Hobson, K. A., Wassenaar, L. I., Altizer, S., and Norris, D. R. (2017). Regional climate on the breeding grounds predicts variation in the natal origin of monarch butterflies overwintering in Mexico over 38 years. Glob. Change Biol. 23, 2565–2576. doi: 10.1111/gcb.13589
Flockhart, D. T. T., Pichancourt, J.-B., Norris, D. R., and Martin, T. G. (2015). Unravelling the annual cycle in a migratory animal: breeding-season habitat loss drives population declines of monarch butterflies. J. Anim. Ecol. 84, 155–165. doi: 10.1111/1365-2656.12253
Franklin, J., Davis, F. W., Ikegami, M., Syphard, A. D., Flint, L. E., Flint, A. L., et al. (2013). Modeling plant species distributions under future climates: how fine scale do climate projections need to be? Glob. Change Biol. 19, 473–483. doi: 10.1111/gcb.12051
Hällfors, M. H., Liao, J., Dzurisin, J., Grundel, R., Hyvärinen, M., Towle, K., et al. (2016). Addressing potential local adaptation in species distribution models: implications for conservation under climate change. Ecol. Appl. 26, 1154–1169. doi: 10.1890/15-0926
Hawkins, E., and Sutton, R. (2011). The potential to narrow uncertainty in projections of regional precipitation change. Clim. Dyn. 37, 407–418. doi: 10.1007/s00382-010-0810-6
Hijmans, R. J., Cameron, S. E., Parra, J. L., Jones, P. G., and Jarvis, A. (2005). Very high resolution interpolated climate surfaces for global land areas. Int. J. Climatol. 25, 1965–1978. doi: 10.1002/joc.1276
Holden, Z. A., Swanson, A., Klene, A. E., Abatzoglou, J. T., Dobrowski, S. Z., Cushman, S. A., et al. (2015). Development of high-resolution (250m) historical daily gridded air temperature data using reanalysis and distributed sensor networks for the US Northern Rocky Mountains. Int. J. Climatol. 36, 3620–3632. doi: 10.1002/joc.4580
Idaho Department of Fish and Game (IDFG) (2017). Idaho State Wildlife Action Plan, 2015. Boise, ID: Idaho Department of Fish and Game. Available online at: http://fishandgame.idaho.gov
Idaho Department of Fish Game (IDFG) (2018). Data From: Idaho Fish and Wildlife Information System, Species Diversity Database, Idaho Natural Heritage Data. Availlable online at: https://idfg.idaho.gov/species/
Ikeda, D. H., Max, T. L., Allan, G. J., Lau, M. K., Shuster, S. M., and Whitham, T. G. (2017). Genetically informed ecological niche models improve climate change predictions. Glob. Change Biol. 23, 164–176. doi: 10.1111/gcb.13470
Inamine, H., Ellner, S. P., Springer, J. P., and Agrawal, A. A. (2016). Linking the continental migratory cycle of the monarch butterfly to understand its population decline. Oikos 125, 1081–1091. doi: 10.1111/oik.03196
James, D. (2016). Population biology of monarch butterflies, Danaus plexippus (L.) (Lepidoptera: Nymphalidae), at a milkweed-rich summer breeding site in central Washington. J. Lepid. Soc. 70, 182–193. doi: 10.18473/107.070.0303
Jepsen, S., Schweitzer, D. F., Young, B., Sears, N., Ormes, M., and Black, S. H. (2015). Conservation Status and Ecology of Monarchs in the United States. Portland, OR: NatureServe, Arlington, Virginia, and the Xerces Society for Invertebrate Conservation.
Klos, P. Z., Abatzoglou, J. T., Bean, A., Blades, J., Clark, M. A., Dodd, M., et al. (2015). Indicators of climate change in Idaho: an assessment framework for coupling biophysical change and social perception. Weather Clim. Soc. 7, 238–254. doi: 10.1175/WCAS-D-13-00070.1
Körner, C. (2007). The use of 'altitude' in ecological research. Trends Ecol. Evol. 22, 569–574. doi: 10.1016/j.tree.2007.09.006
Kramer-Schadt, S., Niedballa, J., Pilgrim, J. D., Schröder, B., Lindenborn, J., Reinfelder, V., et al. (2013). The importance of correcting for sampling bias in Maxent species distribution models. Divers. Distrib. 19, 1366–1379. doi: 10.1111/ddi.12096
Lembrechts, J. J., Nijs, I., and Lenoir, J. (2018). Incorporating microclimate into species distribution models. Ecography 42, 1–13. doi: 10.1111/ecog.03947
Lemoine, N. P. (2015). Climate change may alter breeding ground distributions of eastern migratory monarchs (Danaus plexippus) via range expansion of Asclepias host plants. PLoS ONE 10:e0118614. doi: 10.1371/journal.pone.0118614
Liu, C., Berry, P. M., Dawson, T. P., and Pearson, R. G. (2005). Selecting thresholds of occurrence in the prediction of species distributions. Ecography 28, 385–393. doi: 10.1111/j.0906-7590.2005.03957.x
Luoto, M., and Heikkinen, R. K. (2008). Disregarding topographical heterogeneity biases species turnover assessments based on bioclimatic models. Glob. Change Biol. 14, 483–494. doi: 10.1111/j.1365-2486.2007.01527.x
Mackey, B. G., and Lindenmayer, D. B. (2001). Towards a hierarchical framework for modelling the spatial distribution of animals. J. Biogeogr. 28, 1147–1166. doi: 10.1046/j.1365-2699.2001.00626.x
Merow, C., Smith, M. J., and Silander, J. A. Jr (2013). A practical guide to MaxEnt for modeling species' distributions: what it does, and why inputs and settings matter. Ecography 36, 1058–1069. doi: 10.1111/j.1600-0587.2013.07872.x
Moore, I. D., Gessler, P. E., Nielsen, G. A., and Petersen, G. A. (1993). “Terrain attributes: estimation methods and scale effects,” in Modelling Change in Environmental Systems, eds A. J. Jakeman, M. B. Beck, and M. McAleer (London: Wiley), 189–214.
Morales, N. S., Fernández, I. C., and Baca-González, V. (2017). MaxEnt's parameter configuration and small samples: are we paying attention to recommendations? A systematic review. Peer J. 5:e3093. doi: 10.7717/peerj.3093
Morris, G. M., Kline, C., and Morris, S. M. (2015). Status of Danaus plexippus population in Arizona. J. Lepid. Soc. 69, 91–107. doi: 10.18473/lepi.69i2.a10
Nail, K. R., Batalden, R. V., and Oberhauser, K. S. (2015). “What's too hot and what's too cold: lethal and sublethal effects of extreme temperatures on developing monarchs” in Monarchs in a Changing World: Biology and Conservation of an Iconic Butterfly, eds K. Oberhauser, S. Altizer, and K. Nail (Ithaca, NY: Cornell university Press), 99–108.
Nice, C. C., Forister, M. L., Harrison, J. G., Gompert, Z., Fordyce, J. A., Thorne, J. H., et al. (2019). Extreme heterogeneity of population response to climatic variation and the limits of prediction. Glob. Change Biol. 2019, 1–10. doi: 10.1111/gcb.14593
Nix, H. A. (1986). “A biogeographic analysis of Australian elapid snakes,” in Atlas of elapid snakes of Australia: Australian flora and fauna series 7, ed R. Longmore (Canberra, ACT: Bureau of Flora and Fauna), 4–15.
O'Donnell, M. S., and Ignizio, D. A. (2012). Bioclimatic predictors for supporting ecological applications in the conterminous United States: U.S. Geological Survey. Data Series 691:10. doi: 10.3133/ds691
Oke, O. A., and Thompson, K. A. (2015). Distribution models for mountain plant species: the value of elevation. Ecol. Model. 301, 72–77. doi: 10.1016/j.ecolmodel.2015.01.019
Parker, L. E., and Abatzoglou, J. T. (2017). Comparing mechanistic and empirical approaches to modeling the thermal niche of almond. Int. J. Biometeorol. 61, 1593–1606. doi: 10.1007/s00484-017-1338-9
Pearman, P. B., D'Amen, M., Graham, C. H., Thuiller, W., and Zimmermann, N. E. (2010). Within-taxon niche structure: niche conservatism, divergence and predicted effects of climate change. Ecography 33, 990–1003. doi: 10.1111/j.1600-0587.2010.06443.x
Pepin, N., Bradley, R. S., Diaz, H. F., Baraër, M., Caceres, E. B., Forsythe, N., et al. (2015). Elevation-dependent warming in mountain regions of the world. Nat. Clim. Change 5:424. doi: 10.1038/nclimate2563
Phillips, S. J., Anderson, R. P., Dudík, M., Schapire, R. E., and Blair, M. E. (2017). Opening the black box: an open-source release of Maxent. Ecography 40, 887–893. doi: 10.1111/ecog.03049
Phillips, S. J., Anderson, R. P., and Schapire, R. E. (2006). Maximum entropy modeling of species geographic distributions. Ecol. Model. 190, 231–259. doi: 10.1016/j.ecolmodel.2005.03.026
Phillips, S. J., and Dudík, M. (2008). Modeling of species distributions with Maxent: new extensions and a comprehensive evaluation. Ecography 31, 161–175. doi: 10.1111/j.0906-7590.2008.5203.x
Phillips, S. J., Dudík, M., Elith, J., Graham, C. H., Lehmann, A., Leathwick, J., and Ferrier, S. (2009). Sample selection bias and presence-only distribution models: implications for background and pseudo-absence data. Ecol. Appl. 19, 181–197. doi: 10.1890/07-2153.1
Porfirio, L. L., Harris, R. M. B., Lefroy, E. C., Hugh, S., Gould, S. F., Lee, G., et al. (2014). Improving the use of species distribution models in conservation planning and management under climate change. PLoS ONE 9:e113749. doi: 10.1371/journal.pone.0113749
PRISM Climate Group (2012). Data From: 30-Year Normal Monthly Climate Data, 1981-2010 (800m) Available online at: http://www.prism.oregonstate.edu/
Pyle, R. (1999). Chasing Monarchs: Migrating With the Butterflies of Passage. New York, NY: Houghton Mifflin Company.
R Core Team (2018). R: A Language and Environment for Statistical Computing. Vienna: R Foundation for Statistical Computing.
Radosavljevic, A., and Anderson, R. P. (2013). Making better Maxent models of species distributions: complexity, overfitting and evaluation. J. Biogeogr. 41, 629–643. doi: 10.1111/jbi.12227
Randin, C. F., Engler, R., Normand, S., Zappa, M., Zimmermann, N. E., Pearman, P. B., et al. (2009). Climate change and plant distribution: local models predict high-elevation persistence. Glob. Change Biol. 15, 1557–1569. doi: 10.1111/j.1365-2486.2008.01766.x
Riley, S. J., DeGloria, S. D., and Elliot, R. (1999). A terrain ruggedness index that quantifies topographic heterogeneity. Intermt. J. Sci. 5, 23–27.
Rupp, D. E., Abatzoglou, J. T, and Mote, P. W. (2017). Projections of 21st century climate of the Columbia River Basin. Clim. Dyn. 49, 1783–1799. doi: 10.1007/s00382-016-3418-7
Sappington, J. M., Longshore, K. M., and Thomson, D. B. (2007). Quantifying landscape ruggedness for animal habitat analysis: a case study using bighorn sheep in the Mojave Desert. J. Wildl. Manage. 71, 1419–1426. doi: 10.2193/2005-723
Sappington, M. (2012). Data From: Vector Ruggedness Measure (Terrain Ruggedness). Available online at: http://www.arcgis.com/home/item.html?id=9e4210b3ee7b413bbb1f98fb9c5b22d4
Schultz, C. B., Brown, L. M., Pelton, E., and Crone, E. E. (2017). Citizen science monitoring demonstrates dramatic declines of monarch butterflies in western North America. Biol. Conserv. 214, 343–346. doi: 10.1016/j.biocon.2017.08.019
Searcy, C. A., and Shaffer, H. B. (2016). Do ecological niche models accurately identify climatic determinants of species ranges? Am. Nat. 187, 423–435. doi: 10.1086/685387
Semmens, B. X., Semmens, D. J., Thogmartin, W. E., Wiederholt, R., Lopez-Hoffman, L., Diffendorfer, J. E., et al. (2016). Quasi-extinction risk and population targets for the Eastern, migratory population of monarch butterflies (Danaus plexippus). Sci. Rep. 6, 1–7. doi: 10.1038/srep23265
Smith, A. B. (2017). Data From: enmSdm: Tools for Modeling Species Niches and Distributions: R Package Version 0.1.0.0. Available online at: https://rdrr.io/github/adamlilith/enmSdm/
Smith, S. D., Strain, B. R., and Sharkey, T. D. (2006). Effects of CO2 enrichment on four Great Basin grasses. Funct. Ecol. 1, 139–143. doi: 10.2307/2389717
Stanton, J. C., Pearson, R. G., Horning, N., Ersts, P., and Akcakaya, H. R. (2011). Combining static and dynamic variables in species distribution models under climate change. Methods Ecol. Evol. 3, 349–357. doi: 10.1111/j.2041-210X.2011.00157.x
Stevens, S. R., and Frey, D. F. (2010). Host plant pattern and variation in climate change predict the location of natal grounds for migratory monarch butterflies in western North America. J. Insect Conserv. 14, 731–744. doi: 10.1007/s10841-010-9303-5
Suggitt, A. J., Gillingham, P. K., Hill, J. K., Huntley, B., Kunin, W. E., Roy, D. B., et al. (2011). Habitat microclimates drive fine-scale variation in extreme temperatures. Oikos 120, 1–8. doi: 10.1111/j.1600-0706.2010.18270.x
Thogmartin, W. E., Wiederholt, R., Oberhauser, K., Drum, R. G., Diffendorfer, J. E., Altizer, S., et al. (2017). Monarch butterfly population decline in North America: identifying the threatening processes. R. Soc. Open Sci. 4:170760. doi: 10.1098/rsos.170760
US Geological Survey (2016a). Data From: GAP/LANDFIRE National Terrestrial Ecosystems 2011. Gap Analysis Program. https://gapanalysis.usgs.gov/gaplandcover
US Geological Survey (2016b). Data From: USGS National Elevation Data. Available online at: http://ned.usgs.gov/
US Geological Survey (2017). Data from: National Hydrography Dataset (NHD) for Idaho, Version 2.2.0. Available online at: https://viewer.nationalmap.gov/
USDA Natural Resource Conservation Service (2016a). Data From: Soil Survey Geographic (SSURGO) Database for Idaho. Availble online at: http://websoilsurvey.nrcs.usda.gov/
USDA Natural Resource Conservation Service (2016b). Data From: U.S. General Soil Map (STATSGO2). Available online at: http://websoilsurvey.nrcs.usda.gov/
USDA Natural Resource Conservation Service (2016c). Data From: Soil Data Management Toolbox for ArcGIS User Guide, Version 3.0. Available online at: https://www.nrcs.usda.gov/wps/portal/nrcs/detail/soils/survey/geo/?cid=nrcs142p2_053628
USFWS/Xerces Society (2016). Data From: Western Milkweed and Monarch Breeding Habitat Suitability Models, Phase I. Available online at: https://www.monarchmilkweedmapper.org/habitatsuitabilitymodels/
Velazco, S. J. E., Galväo, F., Villalobos, F., and De Marco Júnior, P. (2017). Using worldwide edaphic data to model plant species niches: an assessment at a continental extent. PLoS ONE 12:e0186025. doi: 10.1371/journal.pone.0186025
Veloz, S. D. (2009). Spatially autocorrelated sampling falsely inflates measures of accuracy for presence-only niche models. J. Biogeogr. 36, 2290–2299. doi: 10.1111/j.1365-2699.2009.02174.x
Walther, G-R. (2010). Community and ecosystem responses to recent climate change. Philos. Trans. R. Soc. B 365, 2019–2024. doi: 10.1098/rstb.2010.0021
Wang, T., Hamann, A., Spittlehouse, D. L., and Murdock, T. Q. (2012). ClimateWNA-high-resolution spatial climate data for western North America. J. Appl. Meteorol. Climatol. 51, 16–29. doi: 10.1175/JAMC-D-11-043.1
Warren, D. L., and Seifert, S. N. (2011). Ecological niche modeling in Maxent: the importance of model complexity and the performance of model selection criteria. Ecol. Appl. 21, 335–342. doi: 10.1890/10-1171.1
Waterbury, B., and Potter, A. (2018). Integrating Strategic Conservation Approaches for the Monarch Butterfly in the State Wildlife Action Plans of Idaho and Washington. Boise, ID: Idaho Department of Fish and Game.
Waterbury, B., and Ruth, T. (2015). A Survey for Milkweed (Asclepias spp.) and Monarch Butterflies (Danaus plexippus) in Lemhi County, Idaho. Salmon, ID: Idaho Department of Fish and Game.
Whisenant, S. G. (1990). “Changing fire frequencies on Idaho's Snake River Plains: ecological and management implications,” in Proceedings Symposium on Cheatgrass Invasion, Shrub Die-Off, and Other Aspects of Shrub Biology and Management, eds E. D. McArthur, E. M. Romney, S. D. Smith, and P. T. Tueller (Las Vegas, NV: USDA Forest Service), 4–10.
Wiens, J. A., Stralberg, D., Jongsomjit, D., Howell, C. A., and Snyder, M. A. (2009). Niches, models, and climate change: assessing the assumptions and uncertainties. Proc.Natl. Acad. Sci. U. S. A. 106, 19729–19736. doi: 10.1073/pnas.0901639106
Woldemeskel, F. M., Sharma, A., Sivakumar, B., and Mehrotra, R. (2016). Quantification of precipitation and temperature uncertainties simulated by CMIP3 and CMIP5 models. J. Geophys. Res. Atmos. 121, 3–17. doi: 10.1002/2015JD023719
Woods, E. C., Hastings, A. P., Turley, N. E., Heard, S. B., and Agrawal, A. A. (2012). Adaptive geographical clines in the growth and defense of a native plant. Ecol. Monogr. 82, 149–168. doi: 10.1890/11-1446.1
Woodson, R. E. Jr. (1954). The North American species of Asclepias L. Ann. Mo. Bot. Gard. 41, 1–211. doi: 10.2307/2394652
Wright, A. N., Hijmans, R. J., Schwartz, M. W., and Shaffer, H. B. (2015). Multiple sources of uncertainty affect metrics for ranking conservation risk under climate change. Divers. Distrib. 21, 111–122. doi: 10.1111/ddi.12257
Xerces Society (2018). US Fish and Wildlife Service, Idaho Department of Fish and Game, and Washington Department of Fish and Wildlife. Data from: Western Monarch Milkweed Mapper Occurrence Database. Available onlinwe at: https://www.monarchmilkweedmapper.org
Xerces Society. (2014). Documenting Known and Potential Monarch Breeding Areas in the Western U.S. Available online at: http://www.xerces.org/milkweedsurvey/
Yackulic, C. B., Chandler, R., Zipkin, E. F., Royle, J. A., Nichols, J. D., Grant, E. H. C., and Veran, S. (2013). Presence-only modelling usingMAXENT: when can we trust the inferences? Methods Ecol. Evol. 4, 236–243. doi: 10.1111/2041-210x.12004
Yang, L. H., Ostrovsky, D., Rogers, M. C., and Welker, J. M. (2016). Intra-population variation in the natal origins and wing morphology of overwintering mwestern monarch butterflies Danaus plexippus. Ecography 39, 998–1007. doi: 10.1111/ecog.01994
York, H. A., and Oberhauser, K. S. (2002). Effects of duration and timing of heat stress on monarch butterfly (Danaus plexippus) (Lepidoptera: Nymphalidae) development. J. Kans. Entomol. Soc. 75, 290–298. Available online at: https://www.jstor.org/stable/25481789
Zalucki, M. P. (1982). Temperature and rate of development in Danaus plexippus L., and D. chrysippus L. (Lepidoptera: Nymphalidae). J. Aust. Entomol. Soc. 21, 241–246. doi: 10.1111/j.1440-6055.1982.tb01803.x
Zalucki, M. P., and Rochester, W. A. (2004). “Spatial and temporal population dynamics of monarchs Down-Under: lessons for North America,” in The Monarch Butterfly: Biology and Conservation, eds K. S. Oberhauser, and M. J. Solensky (Ithaca, NY: Cornell University Press), 219–228.
Keywords: monarch, showy milkweed, swamp milkweed, climate change, species distribution model, Idaho, Asclepias, Danaus plexippus
Citation: Svancara LK, Abatzoglou JT and Waterbury B (2019) Modeling Current and Future Potential Distributions of Milkweeds and the Monarch Butterfly in Idaho. Front. Ecol. Evol. 7:168. doi: 10.3389/fevo.2019.00168
Received: 29 December 2018; Accepted: 25 April 2019;
Published: 15 May 2019.
Edited by:
Wayne E. Thogmartin, United States Geological Survey, United StatesReviewed by:
Nathan Lemoine, Colorado State University, United StatesTyler Flockhart, University of Maryland Center for Environmental Science (UMCES), United States
Copyright © 2019 Svancara, Abatzoglou and Waterbury. This is an open-access article distributed under the terms of the Creative Commons Attribution License (CC BY). The use, distribution or reproduction in other forums is permitted, provided the original author(s) and the copyright owner(s) are credited and that the original publication in this journal is cited, in accordance with accepted academic practice. No use, distribution or reproduction is permitted which does not comply with these terms.
*Correspondence: Leona K. Svancara, bGVvbmEuc3ZhbmNhcmFAaWRmZy5pZGFoby5nb3Y=