 Mariëlle L. van Toor
 Alexis Avril1
 Jonas Waldenström
- 1Centre for Ecology and Evolution in Microbial Model Systems, Linnaeus University, Kalmar, Sweden
- 2SAS Institute Inc., Cary, NC, United States
- 3Department of Statistics, University of Missouri, Columbia, MO, United States
Many pathogens rely on the mobility of their hosts for dispersal. In order to understand and predict how a disease can rapidly sweep across entire continents, illuminating the contributions of host movements to disease spread is pivotal. While elegant proposals have been made to elucidate the spread of human infectious diseases, the direct observation of long-distance dispersal events of animal pathogens is challenging. Pathogens like avian influenza A viruses, causing only short disease in their animal hosts, have proven exceptionally hard to study. Here, we integrate comprehensive data on population and disease dynamics for low-pathogenic avian influenza viruses in one of their main hosts, the mallard, with a novel movement model trained from empirical, high-resolution tracks of mallard migrations. This allowed us to simulate individual mallard migrations from a key stopover site in the Baltic Sea for the entire population and link these movements to infection simulations. Using this novel approach, we were able to estimate the dispersal of low-pathogenic avian influenza viruses by migrating mallards throughout several autumn migratory seasons and predicted areas that are at risk of importing these viruses. We found that mallards are competent vectors and on average dispersed viruses over distances of 160 km in just 3 h. Surprisingly, our simulations suggest that such dispersal events are rare even throughout the entire autumn migratory season. Our approach directly combines simulated population-level movements with local infection dynamics and offers a potential converging point for movement and disease ecology.
1. Introduction
The ability of a disease to spread and persist in a population of susceptible hosts depends to a large extent on the interactions of infectious hosts with its conspecifics (e.g., Anderson and May, 1979; May and Anderson, 1979). In wild animals, the social system can predict the probability of a pathogen's success in establishing an outbreak, and the course that it takes (Sah et al., 2017). With increasing host immunity, however, the continued fate of the pathogen depends on its ability to gain access to new, susceptible populations, especially for “hit-and-run” pathogens (Hilleman, 2004). As most pathogens have only restricted mobility, they have to rely on their hosts for dispersal opportunities. Most free-living animal populations are highly mobile and, consequently, the host's movement patterns can be causative to the spread of a disease and shape the population structure of the pathogen (Altizer et al., 2011; Bauer and Hoye, 2014). Understanding and quantifying the movements undertaken by individuals of a host species is thus key to elucidating how a disease can permeate a group of susceptible individuals and overcome extinction risk through dispersal to new host populations (Daversa et al., 2017). Especially for pathogens that endanger wild populations (e.g., Blehert et al., 2009; Kilpatrick et al., 2010) or readily infect livestock or humans, illuminating pathogen dispersal is pivotal to understanding the dynamics of a disease and could ultimately lead to tools allowing to manage further spread.
Throughout the repeated infection of hosts, the replication, and transmission to the next susceptible individual, pathogens undergo genetic change and so the dispersal history leaves a trace in a pathogen's genome. Phylogenetic inference techniques can utilize this information to re-trace pathogen movement through space (Biek et al., 2007) or transmission and establishment across species borders (Streicker et al., 2010). In reverse, it is possible to infer the spread of a disease from host movements and put forward quantitative predictions for pathogen migration that can be evaluated using sequence data. This was elegantly demonstrated by Brockmann and Helbing (2013), who used a human migration network from air passenger traffic to predict the spread of human infectious diseases across the globe. Not only could they accurately predict the spatio-temporal patterns of a pandemic, but also demonstrated the possibility to identify its geographic source. Phylogeographic inference verified that the predictions of Brockmann and Helbing (2013) also reflect the actual dispersal history of the human influenza H3N2 (Lemey et al., 2014).
Thus, it is not surprising that the development of similar predictors from animal movement data have become a focus of interest (Allen and Singh, 2016; Jacoby and Freeman, 2016; Dougherty et al., 2018). Comprehensive data for the movements of wild animal hosts, however, are not as easily attainable as transport data for humans or livestock (see Knight et al., 2018). The best method is to use remote animal tracking (e.g., Hussey et al., 2015; Kays et al., 2015), which allows linking of animal movements with phylogeographic inference of pathogens. This method has been used to investigate the potential of migrating waterfowl to spread highly pathogenic avian influenza viruses in Asia (Tian et al., 2015). However, individual variation in movement strategies can be substantial, and it is unclear how many individuals are needed to represent an entire population. Similarly, immune parameters can differ substantially between species and individuals, and not every individual will be equally likely to transport an infectious agent over long distances. Considering that the dispersal of a pathogen and the establishment of an outbreak at a new location might be a rare event, being able to estimate population-level variation might be crucial to explain pathogen dispersal. Nevertheless, despite recent advances, large-scale tracking efforts are still costly, and the collection of animal movement data on a population level remains challenging. Thus, an important question in animal movement ecology is whether it is possible to infer the movements of unobserved individuals using data from few, well-known individuals. Using waterfowl migration data, van Toor et al. (2018) showed that a conditional movement model trained from empirical tracking data in combination with environmental information can be used to establish such quantitative null models for directed movements (Gotelli and Graves, 1996). Such a conditional movement model (e.g., empirical Random Track Generator, Technitis et al., 2016) allows for the simulation movements of unobserved individuals from empirical distributions, and can be adapted to accommodate several modes of movement. Through linking disease dynamics data to such simulations, it should thus be possible to establish a quantitative prediction for pathogen dispersal via animal movement. These predictions could be tested against actual pathogen movement as inferred from phylogeographic analyses in a similar way as demonstrated by Brockmann and Helbing (2013) and Lemey et al. (2014).
Here, we combine a movement model with host population dynamics and the infection dynamics of a common pathogen to predict virus dispersal via the migratory movements of a free-living host. The basis for this study is provided by a long-term monitoring and sampling scheme of waterfowl at the Ottenby Bird Observatory in South-East Sweden. The study area is an important stopover location for migratory mallards (Anas platyrhynchos, L. 1758), one of the main hosts for low-pathogenic avian influenza viruses (AIV, Webster et al., 1992; Olsen et al., 2006). Through repeated capture and sampling of birds, the scheme has provided a very detailed dataset of viral infections in birds (e.g., see Wallensten et al., 2007; Latorre-Margalef et al., 2009; Gunnarsson et al., 2012) and has been used to investigate the dynamics of different LPAIV subtypes in consecutive years (Latorre-Margalef et al., 2013; Wille et al., 2017), the epidemiological properties of infection (Avril et al., 2016), and the costs of hosts of being infected with LPAIV (Latorre-Margalef et al., 2009; Bengtsson et al., 2016). In addition, the capture-mark-recapture data collected for mallards have been used to estimate population size and emigration probabilities over entire autumn migration seasons (Avril et al., 2016; Wu et al., 2018) to establish patterns of migratory movements (e.g., Gunnarsson et al., 2012). Avril et al. (2016) could also show that the probability of mallards to become infected differs throughout autumn and between adult and juvenile birds, whereas recovery rate did not differ between age classes. Similarly, Avril et al. (2016) showed that infection status did not affect individual decisions about whether to migrate, and consequently birds infected with LPAIV are just as likely to migrate as healthy birds, making this an ideal system for studying virus dispersal by migrating mallards.
These previous results have established a comprehensive study system where much of the ecology of the host and the dynamics of LPAIV infections are relatively well known. Here, we add the migratory trajectories of mallards caught at Ottenby and train an empirical movement model from the tracking data that enables us to simulate migratory movements of unobserved individuals. Using this model and the previously established estimates for day-to-day population size, emigration rates, and the general migratory patterns established from ring recoveries (Gunnarsson et al., 2012), we simulate the migrations of the entire population of staging mallards throughout the autumn migratory seasons 2004–2008. Combining the spatio-temporal predictions of migratory movements with individual-based infection parameters (Avril et al., 2016), we use a susceptible-infected-recovered (SIR) model on the entire population to quantitatively estimate the dispersal of LPAIV through migrating mallards (Figure 1).
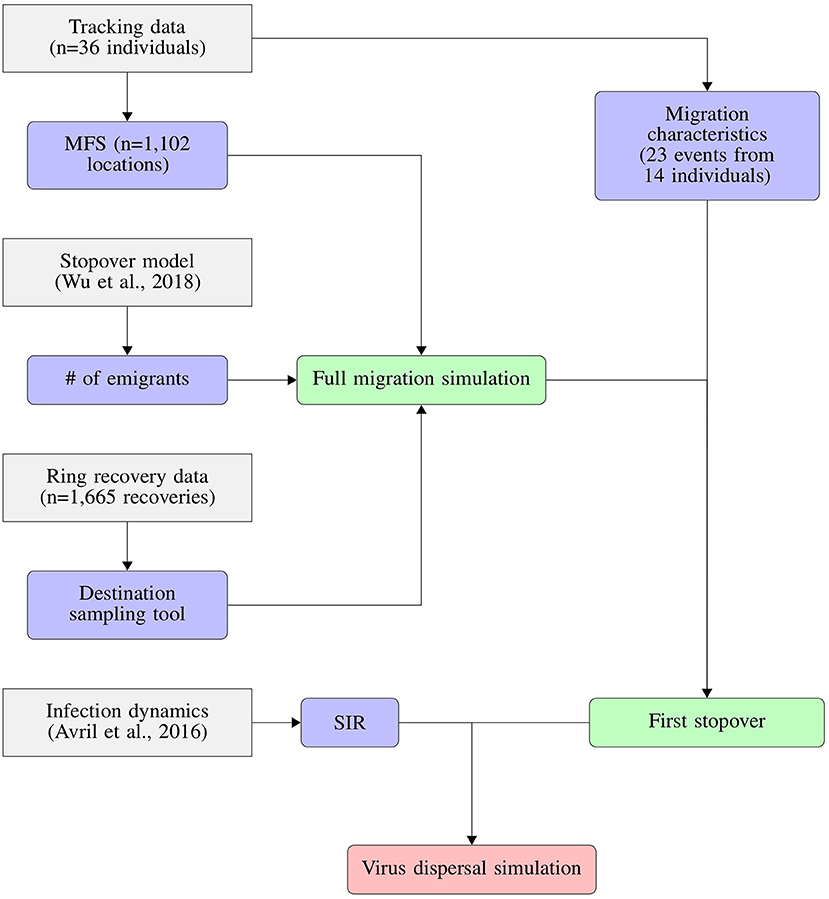
Figure 1. Conceptual flowchart showing how we combined tracking data, stopover model, ring recovery data and infection dynamics to predict the dispersal of LPAIV by migrating mallards. Tracking data were used to derive both migration characteristics like migration duration and distance, as well as the Mallard Flight Simulator (MFS). The implementation of the susceptible-infection-recovery model (SIR) is detailed in Figure 2.
2. Material and Methods
2.1. Study System and Long-Term Trapping of Mallards at Ottenby
Our study site was the Ottenby Bird Observatory (56.197° N, 16.399° E) at the southern tip of Öland, a southern Swedish island located in the Baltic Sea. The area is used by mallards mostly as a staging area during migration, especially during autumn migration after leaving their proposed breeding grounds in Finland, the Baltic States, and northwestern Russia (Gunnarsson et al., 2012). Individuals usually start arriving during September, with numbers peaking between mid-October and November. Mallards ringed at Ottenby mostly leave the site after a staging period and mostly spend their winter along the South-West shoreline of the Baltic Sea, but can continue their migration all the way to the Netherlands and France (as evidenced from ring recoveries, see also Gunnarsson et al., 2012).
At the Ottenby Bird Observatory, wild staging mallards have been captured and marked with rings from 1961 until 1980, and continuously since 2002. Birds are trapped in a large, baited swim-in trap containing a separate compartment housing domestic ducks to lure in wild mallards staging in the bay. Most of the ringing activity occurs during autumn migration when population sizes are highest (August through mid-December). During this period, the trap is visited daily and mallards are captured, measured, individually marked, and sampled for infections with influenza A viruses (Latorre-Margalef et al., 2009). Estimates of population size, emigration probability, infection as well as recovery probability have all been estimated from this population during autumn migration (Avril et al., 2016; Wu et al., 2018). This was also where ducks were captured for equipping with GPS/GSM-transmitters to collect the data required for the migration simulation model.
2.2. Mallard Flight Simulator
2.2.1. Characterizing Mallard Migrations From Tracking Data
From mid-October to the end of November in 2017, we equipped 34 mallards (25 males, 9 females) with solar-powered GPS/GSM-transmitters (OrniTrack-E25, Ornitela UAB, Vilnius, Lithuania) using teflon-tape harnesses (see Table S1). These tags weigh 25 grams and have an elevated solar panel to prevent shading by the scapular feathers. On average, females weighed 1004.4 ± 98.8 grams (mean ± s.d.) and males weighed 1271.2 ± 87.8 grams. Consequently, the weight of the tag corresponded to 2.5 ± 0.2% (mean ± s.d.) and 2.0 ± 0.1% of the body weight of females and males, respectively. The tags were programmed to record bursts of 15 GPS-locations with 1Hz frequency every hour, and every 2 h when battery level dropped below 75%. Below a battery level of 50%, the tags switched to record single GPS-locations instead of bursts. The permission to capture mallards and equip them with transmitters was granted by the Swedish Animal Research Ethics board (permit number ID 834). The tracking data collected for this study are available on the Movebank Data Repository under DOI 10.5441/001/1.3fv21n7m (van Toor et al., 2018). During the period from October 18, 2018 to December 04, 2018, the tags recorded a total of 100,343 locations, including 6,434 bursts of high-frequency GPS-locations providing detailed information about mallard movements. Displacement of individuals ranged from 12.92 km to 321.1 km excluding any movements beyond the first stopover (mean ± s.d.: 99.59±106.48 km).
All subsequent calculations and analyses were performed using the R environment (R Core Team, 2018). More detail and pseudocode are provided in the Supplementary Material.
We identified migratory events from the tracking data using hidden Markov models (R-package moveHMM v1.5, Michelot et al., 2016). As these models expect regularly sampled data, we only kept the first location of each GPS-burst, and included the missed fixes resulting from a reduction in sampling rate to once every 2 h. We explored multiple combinations for the numbers of states (2, 3, and 4 states), the distributions for step lengths (Gamma, Weibull, and Log-normal distribution) and turning angles (von Mises, wrapped Cauchy, or no distribution). We found that a three-state model with a Weibull distribution for step lengths and ignoring turning angles performed best. Note that final selection is ultimately based on agreement between the hypothesized and empirical distributions and a sensitivity analysis. The first state was characterized by very small step lengths (scale: β = 0.025 km) representing very short distance movements, whereas the second represented slightly longer movements (scale: β = 0.517 km). The third state showed the long step lengths on a scale of β = 46.794 km that we considered to be migratory movements.
We used the classification from the hidden Markov model (HMM) to inform the full trajectories (including the GPS-bursts) about the corresponding state identity. We then identified consecutive GPS-bursts classified as the third state as single migratory events (n = 84 GPS-bursts, and n = 1,102 locations in total). In total, we identified 23 migratory legs that were performed by 14 individuals (12 male individuals, and 2 females). The average displacement between the start and destination of these migratory movements was 125.4 ± 106.3 km (mean ± s.d.).
2.2.2. Establishing the Movement Model
We used the empirical Random Trajectory Generator (eRTG, Technitis et al., 2016) to simulate mallard migrations between fixed start- and end-locations. This movement model is conditional, i.e., it simulates the movement between two locations with a fixed number of steps based on a dynamic drift derived from a step-wise joint probability surface. The process is attracted to the destination location and the strength of attraction is modulated by the time left to reach the target. Thus, the eRTG is similar to a biased correlated random walk and can be best described as a mean-reverting Ornstein-Uhlenbeck process (Smouse et al., 2010, but also see Hooten et al., 2017 for a thorough overview of animal movement models). One main advantage of the eRTG is that it exclusively utilizes empirical distributions from the tracking data and so the trajectories it simulates retain the geometric characteristics of the empirical tracking data (Technitis et al., 2016). Consequently, if a destination cannot be reached within the realms of the empirical distributions derived from the movement data, the simulation fails rather than forcing the last step toward the destination. To inform our the eRTG, subsequently termed Mallard Flight Simulator or MFS, we calculated the required estimates using the 15-s GPS bursts of all migratory events identified from the tracking data. We computed step lengths and turning angles between the subsequent locations in each of the bursts. Additionally, we calculated the covariance between step lengths and turning angles, as well as the autocorrelation of both step lengths and turning angles at a lag of one location (the difference in step length and turning angles at a lag of one location). We decided to use the high-frequency GPS data for three reasons, namely (i) mallard migrations from Ottenby tend to be very short (2–3 h) and the underlying sampling frequency of GPS bursts (1 h for high battery levels, and 2 h for battery levels < 75%) would provide only a very limited sample size, (ii) GPS-bursts tend to provide related GPS-locations with high accuracy (Mills et al., 2006) and thus would produce better estimates of step lengths and turning angles. Simulating trajectories of flying or migrating mallards with a sampling rate of 1 s is, however, computationally demanding and thus we decided to thin the MFS for a 300 s (or 5 min) interval. To maintain realistic distributions of step length and turning angle, as well as their autocorrelation and covariance, we simulated a long unconditional trajectory with 1,000,000 steps using the sampling interval of 1 s. We subsequently thinned this long simulated trajectory to a sampling rate of 300 s and re-calculated the required estimates like step lengths and turning angles (see above) at the new, reduced sampling rate (see Supplementary Material for a sensitivity analysis). We used these 3,332 new estimates to inform our MFS.
2.3. Simulation of Mallard Migrations and Virus Dispersal
2.3.1. Ring Recovery Data for Mallards
We used recoveries from mallards ringed at the study site to identify areas where individuals spend the wintering period. The data contained information about the date of ringing, date and location of recovery, age and sex of 5,122 individuals in total, some of which have been recaptured more than once. We filtered the recoveries according to three rules, retaining only recoveries that were: (a) further than 50 km away from the original ringing site at Ottenby (to only retain migratory events), (b) from individuals that were originally ringed in the regular trapping period between mid-August and mid-December (to only retain fall migration events), and (c) from individuals that were marked and recovered during the autumn migration season (to retain recoveries after autumn migration). From these filtered mallard ring recoveries, containing 1,665 recovery locations, we computed a sampling layer of realistic wintering locations for mallard migration simulations. For each of the remaining entries in the data, we calculated the geographic distance and azimuth from the site of ringing (Ottenby) to the site of recovery. Subsequently, we calculated a 2D kernel density estimate for all distances and azimuths, using bin widths of 50 km for distance from Ottenby and 1° for azimuth (see Supplementary Material for additional details and a sensitivity analysis). We mapped the estimated densities for ring recoveries into geographical space using an azimuthal equidistant projection centered on Ottenby (see Figure S1). The resulting gridded map is a purposefully coarse representation of ring recoveries to be used for determining migration destinations.
2.3.2. Simulating the Autumn Migration of Mallards Departing From Ottenby
We simulated mallard migrations using the MFS with the following procedure: First, we randomly sampled a cell from the gridded ring recovery map weighted by the density values associated with each cell, and subsequently selected a random spatial location from the cell which would become the destination location for the simulated migration. We then sampled an average migration speed for the individual from a 2D kernel density of step lengths and turning angles, again weighted by the respective density. We used this average migration speed to determine the number of available steps for the simulation by dividing the geographic distance between Ottenby and the destination by the average migration speed (rounding up to the next higher number of steps). Finally, we initiated the MFS between Ottenby and the destination locations. In total, we repeated this process 250,000 times, which resulted in 108,379 trajectories that successfully reached their destination locations. These trajectories formed the basis for the subsequent simulation of virus dispersal from Ottenby.
2.3.3. Identification of Stopover Locations for the Simulated Migrations
The migratory behavior of mallards consists of (several) fast, directed, long-distance movements interspersed with extended staging periods at suitable stopover locations. For this study, we were exclusively interested in the migratory movements of mallards between Ottenby and the subsequent stopover location, representing a single migratory leg. Thus, we designed the MFS as a single-state movement model covering the migratory state that we identified in the HMM. However, due to extended staging periods characteristic of waterbird migrations, it is expected that LPAIV will only be dispersed to the first staging location post infection. Consequently, we included a post-hoc simulation of the first stopover decision of individuals after leaving Ottenby. We determined the first stopover locations using three different criteria: the along-track distance of migratory events (γ), the duration of migratory events (τ), and the distance to land. We calculated both the along-track distance and duration of migratory events from the classified tracking data, revealing that the average mallard covered a total distance of 134 ± 106 km (mean ± s.d.) in 3 ± 2 h (though our estimates of migratory duration are likely overestimating actual migratory duration due to the sampling rates of the tags). Subsequently, we tried to estimate and fit distribution functions to both γempirical and τempirical. For γempirical, we fit Weibull, Cauchy, and Log-normal distribution functions to γempirical (in kilometers) using the R-package MASS (version 7.3-47), and calculated the ΔAIC to help heuristically determine the distribution that best represented the observed migrations. We used the same approach for estimating the distribution of τempirical (in hours), and considered a Gamma, exponential, Log-normal, and Weibull distribution. We found that γempirical was best described by a Gamma distribution with a shape of k = 0.8 and scale of θ = 166.9 km, whereas τempirical was best described by a Weibull distribution with a shape of k = 1.4 and scale of θ = 3.3 h, with the final determination based on the agreement between the empirical and hypothesized distributions and a sensitivity analysis. We computed cumulative distribution functions for both γempirical and τempirical using the respective parameters.
Subsequently, we calculated the cumulative migratory distance (in kilometers) and duration (in hours) for every location of each simulated trajectory. Then, for every subsequent location j, we determined the probability that cumulative migratory distance and migratory duration at location j were part of the cumulative distribution functions of γempirical and τempirical. We used these probabilities to perform two binomial experiments with two potential outcomes: the continuation of migration, or the suspending of migration in favor of a staging period. Additionally, we used an administrative boundaries database (Global Administrative Areas v2.8) re-projected to the Ottenby-centered azimuthal equidistant projection to include the ducks' positions in relation to the coastline as part of the decisions about staging. To avoid artifacts and to account for ducks staging just off the coast, we expanded the coastline with a buffer of 1,000 meters. We then used a spatial overlay approach (R-package sp, version 1.2.7) to test for each location whether it was within 1,000 m of a coastline. For the first location of a simulated trajectory for which all three conditions were true, i.e., suspending migration under both the migratory distance and migratory duration criterion, as well as being within 1,000 m of the coast, the remaining trajectory was discarded prior to subsequent analyses. All retained locations of a simulated trajectory were considered to represent the potential migratory movement of a mallard between Ottenby and its next stopover location, between which the dispersal of low-pathogenic Influenza A viruses from Ottenby could occur.
2.3.4. Simulation of Infections With Low-Pathogenic Influenza A Viruses
Estimates of population size and the probability of individuals to emigrate from the population at any given day were available to us from a stopover model (Wu et al., 2018). Using the daily trapping data from Ottenby during the trapping seasons of 2004–2011, the stopover-model estimated the size of the population staging at Ottenby, N, on a daily basis, and the probability of each individual leaving the population, ζ, from 1 day to the next. Both the population size N and emigration probability ζ were estimated for three different age classes: juvenile birds, adult birds, and birds which could not be aged (unaged birds). Specifically, the estimates available to us were derived from a Bayesian semiparametric Jolly-Seber Model with time-varying capture, emigration, and entrance probabilities. For details about a similar model ignoring age classes for the trapping season 2011, please see Wu et al. (2018). Similarly, results from a different capture-mark-recapture model including the infection status of individuals with LPAIV were available from a previous study (Avril et al., 2016). This study provided us with estimates of the probability for each individual to become infected, λ, and to clear its infection, φ, for consecutive 2-day intervals for the trapping seasons from 2002-2008. We assumed that both the infection probability λ and the recovery probability φ remained constant during any given 2-day interval. Again, the probability for individuals to be become infected was estimated separately for juvenile, adult, and unaged birds. The probability to clear infections did not differ between age classes (Avril et al., 2016).
Estimates for both population size and emigration probability as well as infection and recovery probabilities were available for the autumn migratory seasons 2004–2008, so we simulated the dispersal of LPAIV for these five seasons. To estimate virus dispersal, we used a stochastic SIR model that we extended by an additional step that allowed individuals to emigrate from the staging population N (see Figure 2). All parameters [N(t), ζ(t), λ(t), and φ(t)] were directly sampled from the distributions returned from the model to propagate the uncertainty in the parameter estimates into the simulations of virus dispersal. During every trapping day t, an individual n ∈ N(t) could decide to leave the population with the emigration probability ζ(t). For every emigrating individual nemi, we randomly sampled a migratory trajectory from the set of simulated trajectories. We then performed a binomial experiment with two outcomes: the individual could become infected before emigrating with the probability λ(t), or not. For every infected migrant, we then calculated the duration of its migration to the next stopover location, and performed a second binomial experiment to test whether the individual would clear its infection before arrival at the stopover location. The probability of clearing infections was estimated for 2-day intervals, i.e., resembling the probability of an infected individual to clear its infection over a duration of 2 days. As the duration of migrations was well below 48 h, we assumed that during each migratory event, the probability of clearing an infection would be linearly proportional to the time since infection. Consequently, we calculated the time-adjusted probability of clearing an infection φ′(t), ranging from 0 for migrations with a duration of 0 h and φ(t) for a migration of 2 days, as
where φ(t) represents the recovery probability for the respective day of the trapping season, and τmig the duration of the migration in days. Every individual arriving at its stopover location while still being infected was considered a virus dispersal event. We replicated the process described above for each study year and day for a total of 10,000 times, which allowed us to calculate the uncertainty of our predictions of virus dispersal.
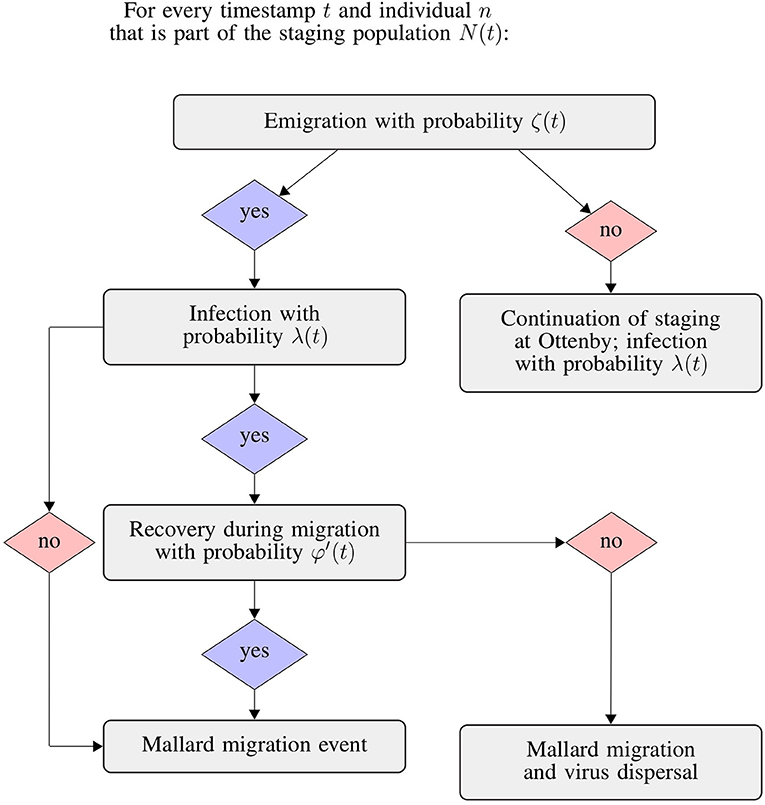
Figure 2. Flowchart of the integrated SIR and emigration simulation. We repeated this process for each individual mallard considered to be a part of the staging population N at day t of the respective trapping seasons.
2.4. Analysis
2.4.1. Dispersal Distances and Classification of High-Risk Areas
We determined migratory distances for the migration of uninfected, recovered, and infected individuals (actual virus dispersal events) by calculating the geographic distance between Ottenby and the respective stopover locations. We repeated this for all days during the trapping seasons of 2004–2008 for each of the 10,000 replicates of the process described above. We then determined areas of high risk of importing LPAIV via migrating mallards from Ottenby by combining the virus dispersal locations of all years, age classes, and day. We computed a hexagonal grid map around Ottenby with a maximum distance of 600 km away from Ottenby (diameter of hexagons: 20km), and used a spatial overlay approach (R-package sp, version 1.2.7) to determine the density of virus dispersal locations for each hexagon, excluding hexagons containing no virus dispersal locations. We classified each hexagon according to the density of dispersal events using four categories: low risk (density below the 50%-quantile), medium risk (density between the 50- and 75%-quantile), high risk (density between the 75- and 90%-quantile), and finally highest risk (density above the 90%-quantile of all observed densities).
We used the tracking data to perform a simple verification of the risk map classification. To do so, we calculated how often the tracked mallards staged in areas with low, medium, high, and highest risked, and compared these observations with expectations derived from a randomization approach. We first annotated the stopover locations of empirical trajectories of the tracked migratory mallards with the risk classification of the corresponding hexagon (the hexagon containing the respective stopover location), and calculated the proportion of individuals staging in low, medium, high, and highest risk areas. We had a total of 30 individuals for this analysis, and considered both individuals with their last location at least 10 km from Ottenby (n10 = 30) as well as individuals being at least 30 km from Ottenby (n30 = 16). As hexagon diameter was 20 km, we thereby excluded the hexagon containing the study site (for 10 km) and also the hexagons directly surrounding the study site (for 30 km). We then used a simple resampling approach to derive distributions of expected proportions, i.e., the proportion of ducks staging in the different risk categories if individuals distributed randomly in space. To do so, we randomly selected n10 = 30 and n30 = 16 hexagons and calculated the proportion for the different categories. We repeated this process 10,000 times in order to assess how well the risk map represented actual mallard movements and migrations.
2.4.2. Estimating the Number of Virus Dispersal Events Throughout Autumn Migration Seasons
We estimated the number of virus dispersal events throughout the season using the results from the 10,000 replicates of infection simulations. For each year, day of the migratory season, age class, and replicate, we counted the number of uninfected, infected, and recovered migrants. We then calculated the 25, 50, and 75% quantiles for these numbers across all 10,000 replicates.
3. Results
3.1. Dispersal of Mallards and LPAIV From Ottenby
Our simulations resulted in a total of 108,379 trajectories of potential mallard migrations. These simulations assumed continuous flight between the starting location (Ottenby) and the final destination sampled from the ring recovery density map. Out of these 108,379 trajectories, only 0.37% ended up at this final location without additional staging periods at stopover locations. Here, we only analyzed the initial leg of migration covering the distance between Ottenby and the subsequent stopover location which we identified using the process described above. After restricting the trajectories to the initial migratory leg, we found that mallards on average are expected to migrate to locations 167 km away from Ottenby (median geographic distance for all simulated trajectories, 25- and 75%-quantiles: [130, 300] km). The median duration of these migratory legs was 3.08 h (25- and 75%-quantiles: [2.58, 5.5] h), suggesting an average speed of about 15 m/s, or 54.5 km/h (compared to a median ground speed of 55 km/h for the tracked individuals observed during flight). Both the distance and duration of these initial migratory legs were well within the range of the distributions derived from the empirical tracking data (see Figures S2, S3), though long migratory distances of the simulated trajectories occurred slightly more often than in the Gamma distribution derived for migratory distances (Figure S2).
We simulated individual infections during migrations with simple SIR-models (Figure 2), and calculated dispersal distances for individuals arriving at the stopover location while being infected as an indicator for virus dispersal distances. We found that virus dispersal distances were slightly lower than mallard dispersal distances, with an overall median for all years of 160.3 km (25- and 75%-quantiles: [129.5, 296.8]). Despite different values of recovery probability for the years 2004–2008, we found that virus dispersal distances were similar across years, with a median of 159.3 km [129.4, 296.5] for 2004, 161.9 km [129.7, 297.2] for 2005, 157.4 km [129.3, 296.0] for 2006, 159.8 km [129.5, 296.7] for 2007, and 163.8 km [129.8, 297.7] for 2008.
We have summarized these results in Figure 3, which also shows that there is a distinct non-normal distribution for dispersal distances of both mallards and LPAIV. This pattern is a consequence of stopover locations of mallards frequently occurring at the shorelines of the Baltic Sea, and thus a consequence of the geographical features of the study site.
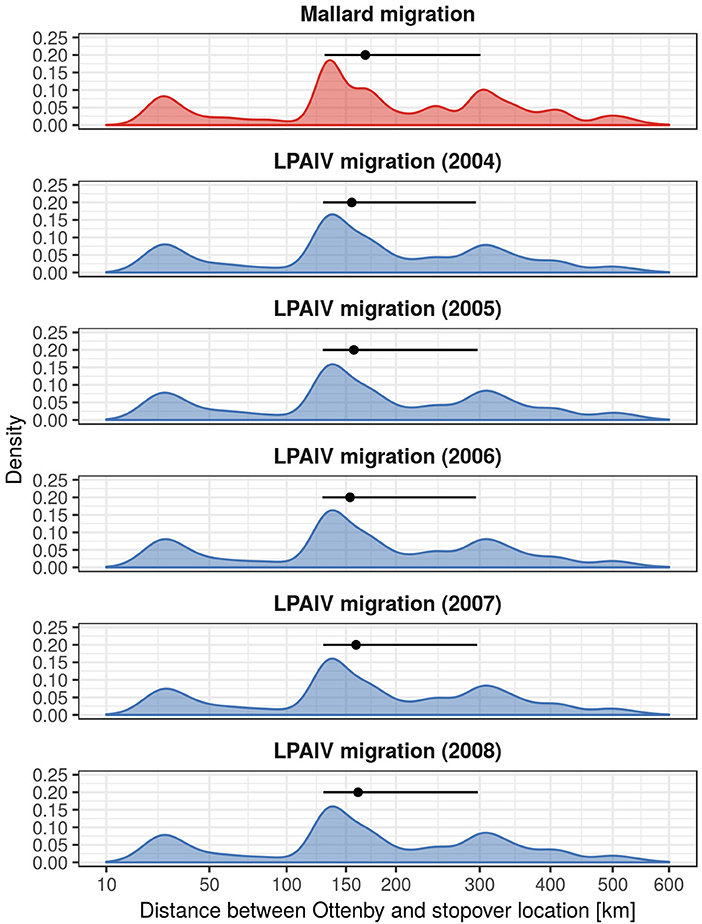
Figure 3. Migration distances of mallards migrating from Ottenby, and the dispersal distances of LPAIV. The density curves show the distribution of migratory distances of 10,000 randomly sampled migratory trajectories on a squareroot scale. The point ranges display the median and the 25- and 75%-quantiles, respectively. Notice the presence of multiple peaks in the distributions, which are a result of the shape of the lower Baltic and its coastlines. Density curves were produced using ggplot2 (Wickham, 2016) with default settings.
3.2. High-Risk Areas for LPAIV From Ottenby
In total, 295 hexagons with a 20 km diameter were the destination for at least one infected simulated mallard migration resembling a virus dispersal event. The area covered by these hexagons stretches across most of the shoreline of the Baltic Sea, reaching from the German coast in the Southwest up to the islands of Åland in the Northeast (see Figure 4). Out of this total of 295 hexagons, 147 were classified as low risk areas for importing LPAIV by migrating mallards, 74 were classified as medium risk, and 44 and 30 hexagons were classified as high risk and highest risk, respectively. The areas of highest risk were concentrated around the island of Öland close to the study site, Blekinge County and the Eastern coast of Skåne County as well as the island of Gotland (all Sweden). Further areas of highest risk are expected to be the island of Bornholm, Denmark, parts of the Northwestern shoreline of Poland, large parts of the Lithuanian shore, and the area around the island of Rügen, Germany.
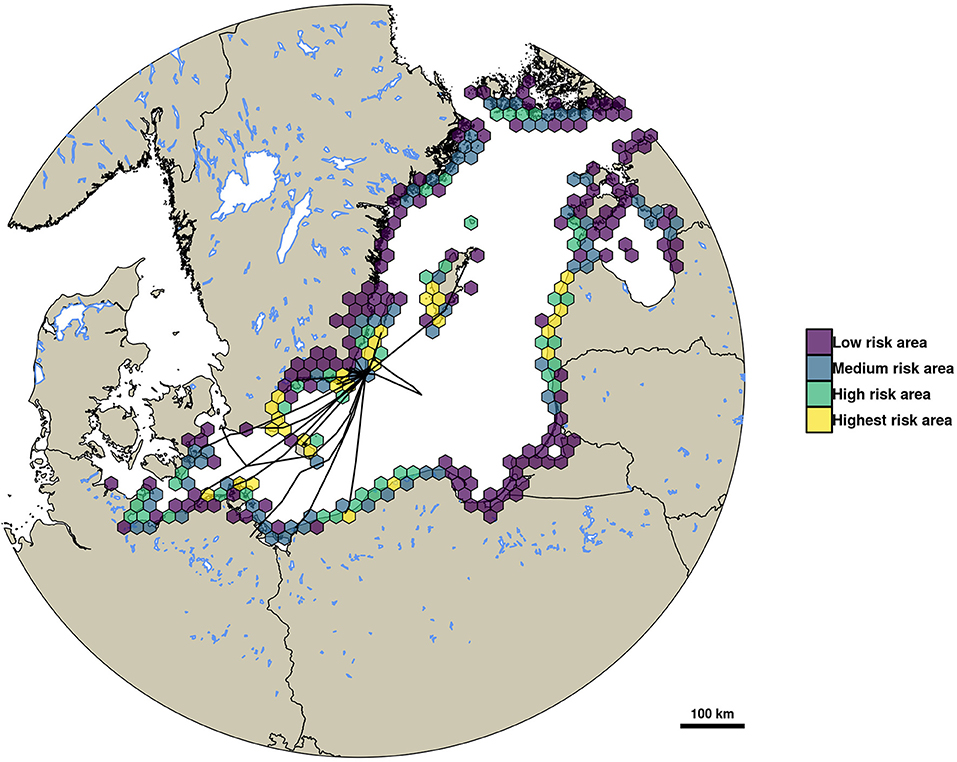
Figure 4. This map shows the risk of importing LPAIV by mallards from Ottenby during autumn migration based on simulated virus dispersal events. Risk was classified as low (density of virus dispersal events below the 50% quantile), medium (between 50 and 75%), high (between 75 and 90%), and highest risk (above 90% quantile). Overlaid are the migratory trajectories of tracked mallards up until their first leg of migration. Hexagon diameter is 20 km.
We then assessed the risk classification of stopover locations of the tracked ducks that were at least 10 and 30 km away from Ottenby using the randomization approach described in section 2.4.1 to generate empirical distributions of randomly chosen hexagons. Ducks were found in hexagons classified as highest risk more often than expected by chance, and were found in hexagons classified as low risk less often than expected by chance (see Figure 5 and Figure S4).
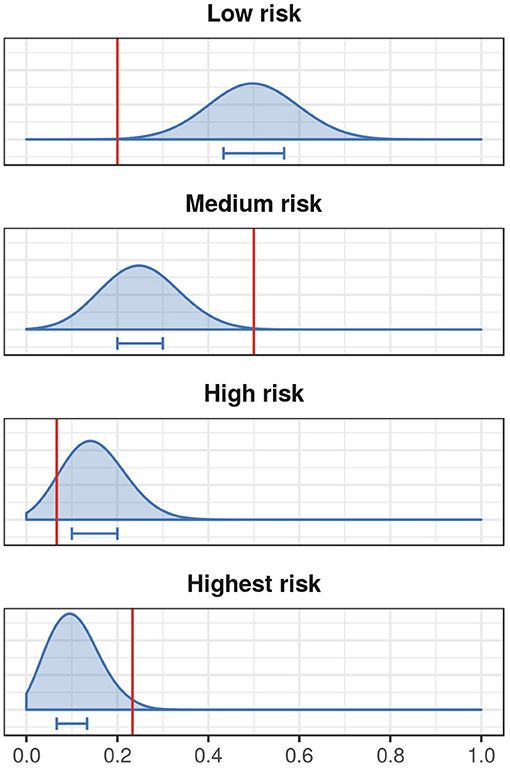
Figure 5. Risk classification of empirical mallard stopover locations that are at least 10 km away from the study site. Here we show the proportion of ducks ending in low, medium, high, and highest risk hexagons as red vertical lines, and the expected distribution from the randomization described in section 2.4.1 in blue. The blue horizontal bars represent the 25–75% quantiles of the distributions.
3.3. Virus Dispersal Throughout Autumn Migration
The total numbers of virus dispersal events from Ottenby differed by age and year (see Table 1). Our simulations suggest that throughout the autumn migratory season of 2004, there were about 10 independent dispersal events (25 & 75%-quantiles: [1, 91]) of LPAIV by mallards emigrating from Ottenby. In the subsequent years of 2005–2008, these estimates were similar, with 15 estimated dispersal events in 2005 [0, 62], one estimated dispersal event in both 2006 [0, 16] and 2007 [0, 6], and 9 estimated dispersal events in 2008 [3, 42]. Recovery from infection during migration was predicted to be very rare, and did not occur at all for the years 2006–2008 (Table 1). During 2004 and 2005, the 75% quantile indicated that recovery might happen in rare cases for juveniles, with a median of 0 [0, 1] recovery events for both 2004 and 2005. In general, virus dispersal events most frequently occurred through the migration of juvenile individuals, and least by adults. Throughout all years combined, a median of 27 virus dispersal events supposedly were carried out by juveniles (25- & 75%-quantiles: [4, 152]), whereas dispersal events by adult (median: 1, 25- & 75%-quantiles: [0, 13]) and unaged individuals (median: 8, 25- & 75%-quantiles: [0, 52]) were considerably lower (see also Table 1). Virus dispersal events did not occur randomly throughout the season, but were clustered in time; i.e., they were most likely to occur when a period of a large population size at Ottenby was followed by a pronounced emigration event (see Figure 6 and Figures S5–S8).
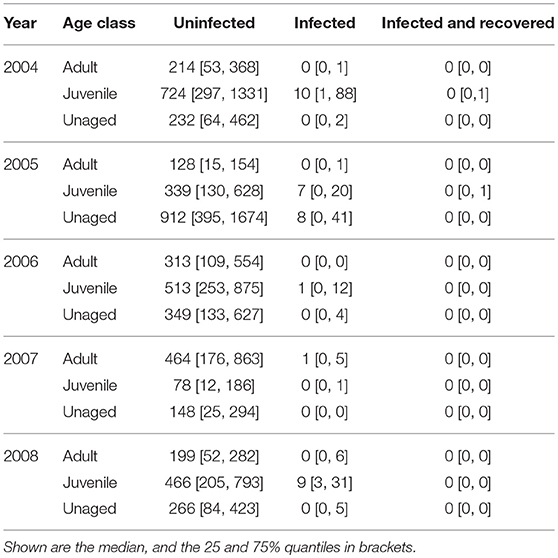
Table 1. Summary of the expected number of dispersal events for the autumn migratory seasons 2004–2008 broken down by age class.
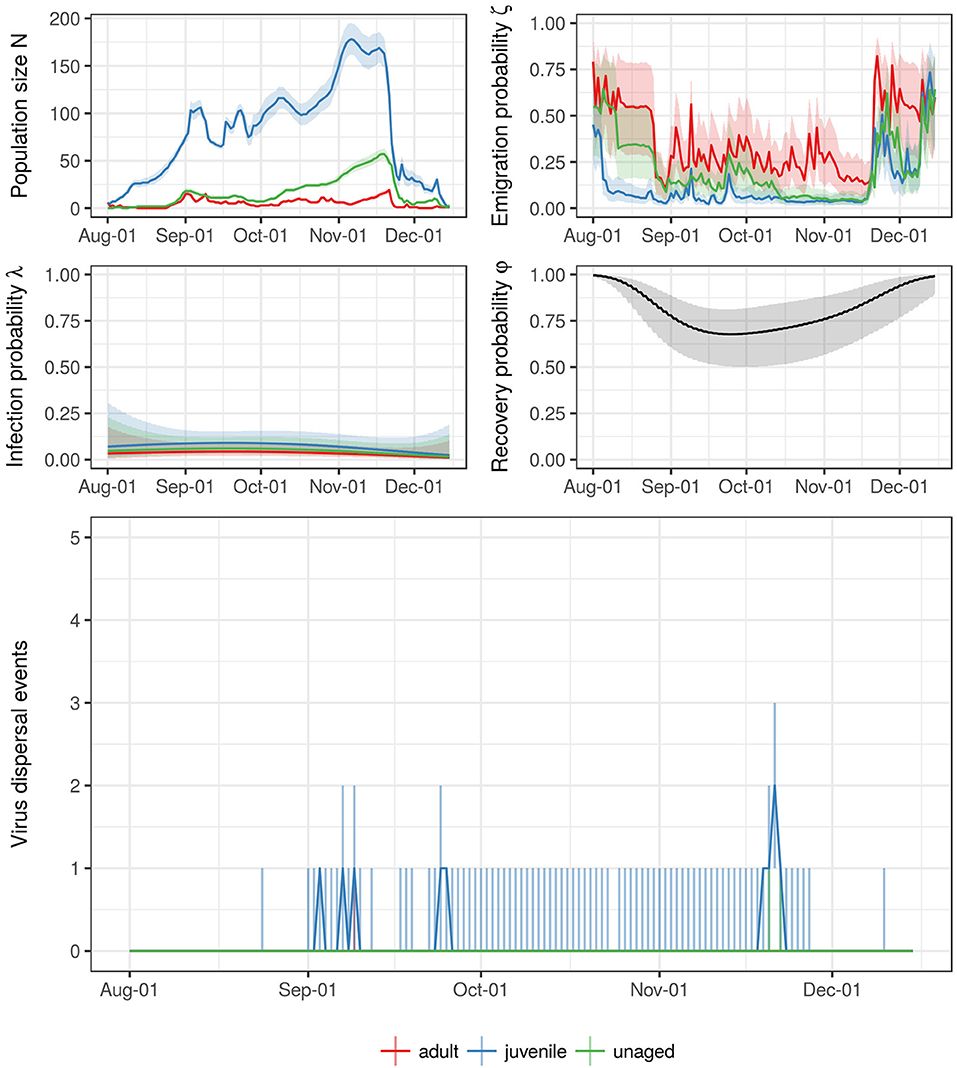
Figure 6. Summary for the entire trapping season of 2004. The top four figures show the estimates for the size of staging population (N) as well as the corresponding emigration, infection, and recovery probabilities (ζ, λ, and φ, respectively) thoughout the trapping season. The different colors correspond to the different age classes (but notice that recovery probability φ did not differ between age classes). The line represents the median (mean for ζ and φ) estimate and pointwise 95% confidence intervals. The bottom figure shows the estimate for the number of dispersal events throughout the trapping seasons. The line shows the median, the line range delineates the 25- and 75% quantiles.
4. Discussion
The mallard is an important reservoir host for the maintenance and dispersal of LPAIV in nature. The observed prevalence is usually high, especially during autumn when immunologically naive juveniles and migratory individuals enter the pool of potential hosts (Stallknecht et al., 1990; Wilcox et al., 2011; van Dijk et al., 2014; Verhagen et al., 2015), yet this species shows only few signs of disease when infected with LPAIV (e.g., Latorre-Margalef et al., 2009; Daoust et al., 2011; van Dijk et al., 2015; Bengtsson et al., 2016). While active surveillance using a sampling scheme like or similar to the long-term sampling scheme deployed at the Ottenby Bird Observatory is possible, the observation of actual dispersal events is hard to achieve. Consequently, estimating the capacity for infected hosts to carry the pathogen especially over long-distance movements, and understanding how pathogens like LPAIV can repeatedly and rapidly spread across entire continents, is challenging.
Our study overcomes this challenge by combining local population and infection dynamics with predictions of animal movement derived from an empirically informed conditional movement model. By integrating data from one of the best studied systems for infectious disease in a wild animal host, we were able to infer dispersal of LPAIV by migrating mallards, and estimate the occurrence of dispersal events throughout autumn migration. The key to being able to estimate virus dispersal for an entire staging population of mallards was the development of a MFS trained from empirical tracking data that allowed us to predict the migratory movements of unobserved individuals. Consequently, the accuracy of our results is dependent on how well the migrations simulated with the MFS reflect the actual migratory movements of mallards leaving from Ottenby. We combined the known wintering locations of mallards from an extensive ring recovery database with detailed information on migratory strategies from high-resolution tracking data to determine for how long, how far, and where simulated mallards should migrate. Similarly, the conditional movement model we used to build the MFS was trained from high-resolution empirical trajectories of mallards migrating from Ottenby. As a result, the simulated migrations resembled the empirical trajectories in overall distance and traveling speed (see Figures S2, S3), though potential sex differences were not considered in this study. As seen in Figure S2, the along-track distances of simulated migrations were slightly higher than that of empirical migrations. This was caused by the higher temporal resolution of the simulated trajectories (5-min intervals vs. 1-h intervals with 15-s GPS-bursts), but also reflects that we only observed one migration toward the North-East (in the first half of January) whereas such movements frequently occurred for the simulated trajectories. Our results might, however, be biased for several reasons. First, the number of recorded migratory movements was relatively small, and represented movements during a single autumn migration season. We were thus not able to assess year-to-year variability in migratory movements that could be caused by e.g., differing wind or climatic conditions. Furthermore, the empirical distributions derived from the migratory durations and distances were derived from a relatively small sample, and might not be representative of overall mallard migration patterns. However, we are confident that our tracking data sample is quite representative of autumn migrations from Ottenby, as the patterns derived from both the observed and simulated migrations corroborate previous tracking studies (van Toor et al., 2013) and ring recovery data (Gunnarsson et al., 2012). The ring recovery data might have also introduced a bias into our results. Most recoveries are the result of mallards being hunted, and might thus not reflect the entirety of wintering grounds visited by mallards staging at Ottenby. Furthermore, migrations in north-easterly directions are only expected for spring migrations, yet according to the ring recoveries, these movements can occur throughout autumn (see also Gunnarsson et al., 2012). Mild winters might also allow mallards to return to their breeding grounds early. However, these recoveries might also be a result of temporal inaccuracy, when rings are found without indication of time of death. Yet, assessing the risk classification of stopover locations observed from the tracking data revealed that mallards chose locations classified as highest risk more often than expected, whereas they traveled to areas classified as low risk less often than expected at random (see Figure 5 and Figure S4). This indicates that our approach was able to replicate the migratory strategies of mallards leaving Ottenby, and we are confident that the simulated migrations reflect the movements of the entire population during autumn.
By superimposing a SIR-model on simulated mallard migrations for the entire population, we found that mallards, after leaving the stopover site on Southern Öland, are expected to disperse LPAIV over an average distance of 160 km within just 3 h, and up to about 600 km (see Figure 3). Mallards are fast flyers, and thus dispersal distances for the virus are on average only slightly shorter than the migratory distances of uninfected individuals despite the ability of mallards to clear infections with LPAIV rapidly (Latorre-Margalef et al., 2009; Avril et al., 2016). It should be clear, however, that the virus dispersal simulations presented in this study were made under several assumptions: First, we assumed that the probability for an individual to recover from infection is proportional to time. This is a simplification of the course of an individual's infection with LPAIV. Yet, individual variation in time to clearing infections is substantial (e.g., Latorre-Margalef et al., 2009; Tolf et al., 2013), and dependent on previous exposure to the same or other strains or subtypes of LPAIV (e.g., Costa et al., 2010; Verhagen et al., 2015; Latorre-Margalef et al., 2017). We thus think that using a simplified process was justified, and does not overestimate time to recovery. The second assumption was that recovery from an infection with LPAIV happens just as quickly during migration as during staging, as it is currently unknown how migration affects the function of the immune system of dabbling ducks. Latorre-Margalef et al. (2009) showed that infection status did not affect migrating mallards apart from a slight loss in body weight, and Avril et al. (2016) could demonstrate that infection status did not affect the decision of mallards to migrate. Similarly, Bengtsson et al. (2016) found no differences in local movement between infected and uninfected mallards, and van Dijk et al. (2015) reported shorter daily movements of infected birds. It is hypothesized that the physiological burden of migration might lead to immunosuppression in birds (e.g., Weber and Stilianakis, 2007), and thus time to clearing an infection should become longer rather than shorter. However, a wind tunnel study with red knots (Calidris canutus, L. 1758) showed that long flights do not seem to influence the immune function in these birds (Hasselquist et al., 2007). Consequently, our assumption results in an under- rather than overestimation of virus dispersal distances, which indicates that virus dispersal distances might be entirely congruent with mid- to long-distance migratory movements of mallards. Overall, our results suggest that the mallard has the capacity to carry LPAIV over mid to long distances within just a few hours.
However, such dispersal events seem to be rare even when viewed from the perspective of an entire autumn migratory season, even though the size of the population of staging mallards at Ottenby can exceed several hundred individuals, and mostly consists of juvenile individuals (Figure 6; see also Avril et al., 2016). Especially these juveniles, who have not built up partial or total immunity against different subtypes of LPAIV yet (van Dijk et al., 2014), are highly likely to become infected with LPAIV during their stay at Ottenby (Figure 6; see also Avril et al., 2016). Yet, our simulations suggest that as little as a single dispersal event would be expected on average from mid-August through mid-December 2006 as well as 2007 (see Table 1). Our results indicated that during the period of 2004–2008, no more than 15 individual virus dispersal events occurred per season. Despite propagating the entire variation in the estimates of emigration, infection, and recovery probabilities into our simulations, the inter-quartile range for the number of estimated dispersal was relatively narrow, except for juveniles in 2004 (Table 1). Consequently, virus dispersal events occurred during times when many individuals emigrated from the population and infection probabilities were high, as the probability of virus dispersal can be approximated by the product of infection and emigration probability (see Figure 6 and Figures S5–S8). At Ottenby, the predominant wind direction is from the South-West to the North-East, opposing the main migratory direction of Ottenby mallards during autumn migration. Bengtsson (2016) could show that such mass emigration events mostly occurred when the wind deviated from its predominant pattern, blowing from the North and East to the South and West and thus providing mallards with tail winds. During this study, we observed that many of the tracked mallards initiated their migratory movements on days when the wind provided them with tail winds (personal observation, see also Figure S9), corroborating previous studies on the migrations of waterfowl (e.g., Bergman, 1978; Hedenström et al., 2002; Day et al., 2004). Similarly, as dabbling ducks require open water surfaces for feeding, and so cold spells resulting in the freezing of water bodies might induce movements during winter (Reperant et al., 2010; Sauter et al., 2010, 2012). Clearly, the question whether an environmental trigger like the switch from general wind direction in combination with an estimate of population size could serve as a predictor for mass emigration events for Ottenby could be pursued in future studies.
During this study, we could predict which areas are at risk of being the destination for infected mallards from Ottenby. We classified the destinations of virus dispersal events into different four risk categories, and highlighted areas that are predominantly expected to import LPAIV from Ottenby. Interestingly, some of the highest-risk areas were located along the coastline of the Baltic states. We think that again, this might be a result of potential movements during mild winters, or temporal inaccuracies in the ring recovery data. Some individuals also migrate north-east early, like the individual heading to the island of Gotland during early January (see Figure 4). However, as the trapping season at Ottenby ends in mid-December, usually due to the formation of ice in the bay, little is known about the prevalence of LPAIV in the residing mallard population for the period after mid-December. Should the virus be maintained in the population throughout winter, which has been shown for other wintering populations (e.g., Hill et al., 2012; Spivey et al., 2017), the dispersal of viruses along the spring migratory route toward the North-East is possible. However, for the period that the population and infection dynamics in this study system are known, these areas are unlikely to be the destination for infected mallards. Consequently, the focus should reside on the highest risk areas that were identified in the migratory corridor of true autumn migrations toward the South-West, which are located along the coast of Southern Sweden, South-East Denmark, and the coast of North-East Germany and North-West Poland.
In conclusion, our study integrated comprehensive data about population fluctuations, infection dynamics, and high-resolution tracking data to predict the dispersal of a highly infectious virus through a wild migratory host. This novel approach allowed for establishing quantitative estimates of pathogen dispersal at the level of an entire population, and throughout the entire autumn migration. While similarly comprehensive data for other areas and study systems might not be available, we think that predictions from our mallard migration simulator are transferable across space, especially given the lack of population structure in mallards (Kraus et al., 2013). We think that our approach may also be suitable for other species and questions as well. That is, using tracks from few well-studied individuals and generally more readily available ring recovery data, it could be possible to predict potentially important staging areas for species whose migration strategies might not be well known.
In the future, a better understanding of how mallards use wind conditions for migration and the correction of the mallard flight simulator for local wind conditions will make this tool applicable to a wider range of scenarios. We think that migration simulators like the MFS are extremely powerful in predicting past and future spread of infectious agents. This approach is not limited to low-pathogenic influenza viruses as shown here, but could also be used to infer potential dispersal of other pathogens, like highly pathogenic variants of avian influenza viruses. In future work, the MFS could be extended by including short-distance movements in addition to the migratory movements studied here. We think that our approach could facilitate the establishment of general migratory connectivity networks of mallards on a larger spatial scale, and thereby provide the possibility to derive predictors for disease dispersal like those shown by Brockmann and Helbing (2013). These predictions could then be tested against the virus dispersal history as reconstructed from sequence data and phylogeographic inference. Overall, we think that an approach that directly combines (simulated) movements on a population level with local infection dynamics might be a potential answer to the call for converging movement and disease ecology.
Author Contributions
MvT, AA, and JW conceived the study. MvT, AA, GW, SH, and JW contributed data to the study and wrote the manuscript. MvT analyzed the data.
Funding
This project has received funding from the European Union's Horizon 2020 research and innovation programme under grant agreement No 727922 (Delta-Flu).
Conflict of Interest Statement
The authors declare that the research was conducted in the absence of any commercial or financial relationships that could be construed as a potential conflict of interest.
The reviewer, CL, declared a past co-authorship with one of the authors, JW, to the handling editor.
Acknowledgments
This work would not have been possible without the support of the Ottenby Bird Observatory and the duck trappers Ulf Ottosson, Tim van der Meer, and Sita van Hoorn, who helped us catch ducks for tagging. We would like to thank Mindaugas Dagys and his Ornitela team for the excellent support with the programming and handling of tags. We are thankful to the two reviewers for their help with improving this manuscript. This is contribution no. 309 from the Ottenby Bird Observatory.
Supplementary Material
The Supplementary Material for this article can be found online at: https://www.frontiersin.org/articles/10.3389/fevo.2018.00208/full#supplementary-material
References
Allen, A. M., and Singh, N. J. (2016). Linking movement ecology with wildlife management and conservation. Front. Ecol. Evol. 3:155. doi: 10.3389/fevo.2015.00155
Altizer, S., Bartel, R., and Han, B. A. (2011). Animal migration and infectious disease risk. Science 331, 296–302. doi: 10.1126/science.1194694
Anderson, R. M., and May, R. M. (1979). Population biology of infectious diseases: part I. Nature 280, 361–367. doi: 10.1038/280361a0
Avril, A., Grosbois, V., Latorre-Margalef, N., Gaidet, N., Tolf, C., Olsen, B., et al. (2016). Capturing individual-level parameters of influenza A virus dynamics in wild ducks using multistate models. J. Appl. Ecol. 53, 1289–1297. doi: 10.1111/1365-2664.12699
Bauer, S., and Hoye, B. J. (2014). Migratory animals couple biodiversity and ecosystem functioning worldwide. Science 344:1242552. doi: 10.1126/science.1242552
Bengtsson, D. (2016). Stopover Ecology of Mallards: Where, When and How to Do What? PhD thesis, Linnaeus University Press.
Bengtsson, D., Safi, K., Avril, A., Fiedler, W., Wikelski, M., Gunnarsson, G., et al. (2016). Does influenza A virus infection affect movement behaviour during stopover in its wild reservoir host? R. Soc. Open Sci. 3:150633. doi: 10.1098/rsos.150633
Bergman, G. (1978). Effects of wind conditions on the autumn migration of waterfowl between the White Sea area and the Baltic region. Oikos 30, 393–397. doi: 10.2307/3543488
Biek, R., Henderson, J. C., Waller, L. A., Rupprecht, C. E., and Real, L. A. (2007). A high-resolution genetic signature of demographic and spatial expansion in epizootic rabies virus. Proc. Natl. Acad. Sci. U.S.A. 104, 7993–7998. doi: 10.1073/pnas.0700741104
Blehert, D. S., Hicks, A. C., Behr, M., Meteyer, C. U., Berlowski-Zier, B. M., Buckles, E. L., et al. (2009). Bat white-nose syndrome: an emerging fungal pathogen? Science 323, 227–227. doi: 10.1126/science.1163874
Brockmann, D., and Helbing, D. (2013). The hidden geometry of complex, network-driven contagion phenomena. Science 342, 1337–1342. doi: 10.1126/science.1245200
Costa, T. P., Brown, J. D., Howerth, E. W., and Stallknecht, D. E. (2010). Effect of a prior exposure to a low pathogenic avian influenza virus in the outcome of a heterosubtypic low pathogenic avian influenza infection in mallards (Anas platyrhynchos). Avian Dis. 54, 1286–1291. doi: 10.1637/9480-072210-Reg.1
Daoust, P.-Y., Kibenge, F. S., Fouchier, R. A., Van De Bildt, M. W., Van Riel, D., and Kuiken, T. (2011). Replication of low pathogenic avian influenza virus in naturally infected mallard ducks (Anas platyrhynchos) causes no morphologic lesions. J. Wildl. Dis. 47, 401–409. doi: 10.7589/0090-3558-47.2.401
Daversa, D., Fenton, A., Dell, A., Garner, T., and Manica, A. (2017). Infections on the move: how transient phases of host movement influence disease spread. Proc. R. Soc. Lond. B Biol. Sci. 284:20171807. doi: 10.1098/rspb.2017.1807
Day, R. H., Rose, J. R., Prichard, A. K., Blaha, R. J., and Cooper, B. A. (2004). Environmental effects on the fall migration of Eiders at Barrow, Alaska. Mar. Ornithol. 32, 13–24.
Dougherty, E. R., Seidel, D. P., Carlson, C. J., Speigel, O., and Getz, W. M. (2018). Going through the motions: incorporating movement analyses into disease research. Ecol. Lett. 21, 588–604. doi: 10.1111/ele.12917
Gotelli, N. J., and Graves, G. R. (1996). Null Models in Ecology. Washington, DC: Smithsonian Institution.
Gunnarsson, G., Latorre-Margalef, N., Hobson, K. A., Van Wilgenburg, S. L., Elmberg, J., Olsen, B., et al. (2012). Disease dynamics and bird migration—linking mallards Anas platyrhynchos and subtype diversity of the influenza A virus in time and space. PLoS ONE 7:e35679. doi: 10.1371/journal.pone.0035679
Hasselquist, D., Lindström, Å., Jenni-Eiermann, S., Koolhaas, A., and Piersma, T. (2007). Long flights do not influence immune responses of a long-distance migrant bird: a wind-tunnel experiment. J. Exp. Biol. 210, 1123–1131. doi: 10.1242/jeb.02712
Hedenström, A., Alerstam, T., Green, M., and Gudmundsson, G. A. (2002). Adaptive variation of airspeed in relation to wind, altitude and climb rate by migrating birds in the Arctic. Behav. Ecol. Sociobiol. 52, 308–317. doi: 10.1007/s00265-002-0504-0
Hill, N. J., Takekawa, J. Y., Ackerman, J. T., Hobson, K. A., Herring, G., Cardona, C. J., et al. (2012). Migration strategy affects avian influenza dynamics in mallards (Anas platyrhynchos). Mol. Ecol. 21, 5986–5999. doi: 10.1111/j.1365-294X.2012.05735.x
Hilleman, M. R. (2004). Strategies and mechanisms for host and pathogen survival in acute and persistent viral infections. Proc. Natl. Acad. Sci. U.S.A. 101(Suppl. 2):14560–14566. doi: 10.1073/pnas.0404758101
Hooten, M. B., Johnson, D. S., McClintock, B. T., and Morales, J. M. (2017). Animal Movement: Statistical Models for Telemetry Data. Boca Raton, FL: CRC Press.
Hussey, N. E., Kessel, S. T., Aarestrup, K., Cooke, S. J., Cowley, P. D., Fisk, A. T., et al. (2015). Aquatic animal telemetry: a panoramic window into the underwater world. Science 348:1255642. doi: 10.1126/science.1255642
Jacoby, D. M. P., and Freeman, R. (2016). Emerging network-based tools in movement ecology. Trends Ecol. Evol. 31, 301–314. doi: 10.1016/j.tree.2016.01.011
Kays, R., Crofoot, M. C., Jetz, W., and Wikelski, M. (2015). Terrestrial animal tracking as an eye on life and planet. Science 348:aaa2478. doi: 10.1126/science.aaa2478
Kilpatrick, A. M., Briggs, C. J., and Daszak, P. (2010). The ecology and impact of chytridiomycosis: an emerging disease of amphibians. Trends Ecol. Evol. 25, 109–118. doi: 10.1016/j.tree.2009.07.011
Knight, S. M., Bradley, D. W., Clark, R. G., Gow, E. A., Bélisle, M., Berzins, L. L., et al. (2018). Constructing and evaluating a continent-wide migratory songbird network across the annual cycle. Ecol. Monogr. 88, 445–460. doi: 10.1002/ecm.1298
Kraus, R. H., Hooft, P., Megens, H.-J., Tsvey, A., Fokin, S. Y., Ydenberg, R. C., et al. (2013). Global lack of flyway structure in a cosmopolitan bird revealed by a genome wide survey of single nucleotide polymorphisms. Mol. Ecol. 22, 41–55. doi: 10.1111/mec.12098
Latorre-Margalef, N., Brown, J. D., Fojtik, A., Poulson, R. L., Carter, D., Franca, M., et al. (2017). Competition between influenza a virus subtypes through heterosubtypic immunity modulates re-infection and antibody dynamics in the mallard duck. PLoS Pathog. 13:e1006419. doi: 10.1371/journal.ppat.1006419
Latorre-Margalef, N., Grosbois, V., Wahlgren, J., Munster, V. J., Tolf, C., Fouchier, R. A., et al. (2013). Heterosubtypic immunity to influenza A virus infections in mallards may explain existence of multiple virus subtypes. PLoS Pathog. 9:e1003443. doi: 10.1371/journal.ppat.1003443
Latorre-Margalef, N., Gunnarsson, G., Munster, V. J., Fouchier, R. A. M., Osterhaus, A. D. M. E., Elmberg, J., et al. (2009). Effects of influenza A virus infection on migrating mallard ducks. Proc. R. Soc. Lond. B Biol. Sci. 276, 1029–1036. doi: 10.1098/rspb.2008.1501
Lemey, P., Rambaut, A., Bedford, T., Faria, N., Bielejec, F., Baele, G., et al. (2014). Unifying viral genetics and human transportation data to predict the global transmission dynamics of human influenza H3N2. PLoS Pathog. 10:e1003932. doi: 10.1371/journal.ppat.1003932
May, R. M., and Anderson, R. M. (1979). Population biology of infectious diseases: part II. Nature 280, 455–461. doi: 10.1038/280455a0
Michelot, T., Langrock, R., and Patterson, T. A. (2016). moveHMM: an R package for the statistical modelling of animal movement data using hidden Markov models. Methods Ecol. Evol. 7, 1308–1315. doi: 10.1111/2041-210X.12578
Mills, K. J., Patterson, B. R., and Murray, D. L. (2006). Effects of variable sampling frequencies on GPS transmitter efficiency and estimated wolf home range size and movement distance. Wildl. Soc. Bull. 34, 1463–1469. doi: 10.2193/0091-7648(2006)34[1463:EOVSFO]2.0.CO;2
Olsen, B., Munster, V. J., Wallensten, A., Waldenström, J., Osterhaus, A. D., and Fouchier, R. A. (2006). Global patterns of influenza A virus in wild birds. Science 312, 384–388. doi: 10.1126/science.1122438
R Core Team (2018). R: A Language and Environment for Statistical Computing. Vienna: R Foundation for Statistical Computing.
Reperant, L. A., Fučkar, N. S., Osterhaus, A. D. M. E., Dobson, A. P., and Kuiken, T. (2010). Spatial and temporal association of outbreaks of H5N1 influenza virus infection in wild birds with the 0 C isotherm. PLoS Pathog. 6:e1000854. doi: 10.1371/journal.ppat.1000854
Sah, P., Mann, J., and Bansal, S. (2017). Disease implications of animal social network structure: a synthesis across social systems. J. Anim. Ecol. 87, 546–558. doi: 10.1111/1365-2656.12786
Sauter, A., Korner, P., Fiedler, W., and Jenni, L. (2012). Individual behavioural variability of an ecological generalist: activity patterns and local movements of Mallards Anas platyrhynchos in winter. J. Ornithol. 153, 713–726. doi: 10.1007/s10336-011-0788-9
Sauter, A., Körner-Nievergelt, F., and Jenni, L. (2010). Evidence of climate change effects on within-winter movements of European Mallards Anas platyrhynchos. Ibis 152, 600–609. doi: 10.1111/j.1474-919X.2010.01028.x
Smouse, P. E., Focardi, S., Moorcroft, P. R., Kie, J. G., Forester, J. D., and Morales, J. M. (2010). Stochastic modelling of animal movement. Philos. Trans. R. Soc. Lond. B Biol. Sci. 365, 2201–2211. doi: 10.1098/rstb.2010.0078
Spivey, T. J., Lindberg, M. S., Meixell, B. W., Smith, K. R., Puryear, W. B., Davis, K. R., et al. (2017). Maintenance of influenza A viruses and antibody response in mallards (Anas platyrhynchos) sampled during the non-breeding season in Alaska. PLoS ONE 12:e0183505. doi: 10.1371/journal.pone.0183505
Stallknecht, D. E., Shane, S. M., Zwank, P. J., Senne, D. A., and Kearney, M. T. (1990). Avian influenza viruses from migratory and resident ducks of coastal Louisiana. Avian Dis. 34, 398–405. doi: 10.2307/1591427
Streicker, D. G., Turmelle, A. S., Vonhof, M. J., Kuzmin, I. V., McCracken, G. F., and Rupprecht, C. E. (2010). Host phylogeny constrains cross-species emergence and establishment of rabies virus in bats. Science 329, 676–679. doi: 10.1126/science.1188836
Technitis, G., Weibel, R., Kranstauber, B., and Safi, K. (2016). “An algorithm for empirically informed random trajectory generation between two endpoints,” in GIScience 2016: Ninth International Conference on Geographic Information Science (Montreal, QC).
Tian, H., Zhou, S., Dong, L., Van Boeckel, T. P., Cui, Y., Newman, S. H., et al. (2015). Avian influenza H5N1 viral and bird migration networks in Asia. Proc. Natl. Acad. Sci. U.S.A. 112, 172–177. doi: 10.1073/pnas.1405216112
Tolf, C., Latorre-Margalef, N., Wille, M., Bengtsson, D., Gunnarsson, G., Grosbois, V., et al. (2013). Individual variation in influenza A virus infection histories and long-term immune responses in mallards. PLoS ONE 8:e61201. doi: 10.1371/journal.pone.0061201
van Dijk, J. G., Hoye, B. J., Verhagen, J. H., Nolet, B. A., Fouchier, R. A., and Klaassen, M. (2014). Juveniles and migrants as drivers for seasonal epizootics of avian influenza virus. J. Anim. Ecol. 83, 266–275. doi: 10.1111/1365-2656.12131
van Dijk, J. G. B., Kleyheeg, E., Soons, M. B., Nolet, B. A., Fouchier, R. A. M., and Klaassen, M. (2015). Weak negative associations between avian influenza virus infection and movement behaviour in a key host species, the mallard Anas platyrhynchos. Oikos 124, 1293–1303. doi: 10.1111/oik.01836
van Toor, M. L., Hedenström, A., Waldenström, J., Fiedler, W., Holland, R. A., Thorup, K., et al. (2013). Flexibility of continental navigation and migration in european mallards. PLoS ONE 8:e72629. doi: 10.1371/journal.pone.0072629
van Toor, M. L., Kranstauber, B., Newman, S. H., Prosser, D. J., Takekawa, J. Y., Technitis, G., et al. (2018). Integrating animal movement with habitat suitability for estimating dynamic landscape connectivity. Landscape Ecol. 33, 879–893. doi: 10.1007/s10980-018-0637-9
van Toor, M. L., Ottosson, U., van der Meer, T., van Hoorn, S., and Waldenström, J. (2018). Data From: As the Duck Flies - Estimating the Dispersal of Low-Pathogenic Avian Influenza Viruses by Migrating Mallards. Movebank Data Repository.
Verhagen, J. H., Höfle, U., van Amerongen, G., van de Bildt, M., Majoor, F., Fouchier, R. A. M., et al. (2015). Long-term effect of serial infections with H13 and H16 low-pathogenic avian influenza viruses in black-headed gulls. J. Virol. 89, 11507–11522. doi: 10.1128/JVI.01765-15
Wallensten, A., Munster, V. J., Latorre-Margalef, N., Brytting, M., Elmberg, J., Fouchier, R. A., et al. (2007). Surveillance of influenza virus A in migratory waterfowl in Northern Europe. Emerg. Infect. Dis. 13:404. doi: 10.3201/eid1303.061130
Weber, T. P., and Stilianakis, N. I. (2007). Ecologic immunology of avian influenza (H5N1) in migratory birds. Emerg. Infect. Dis. 13:1139. doi: 10.3201/eid1308.070319
Webster, R. G., Bean, W. J., Gorman, O. T., Chambers, T. M., and Kawaoka, Y. (1992). Evolution and ecology of influenza A viruses. Microbiol. Rev. 56, 152–179.
Wilcox, B. R., Knutsen, G. A., Berdeen, J., Goekjian, V., Poulson, R., Goyal, S., et al. (2011). Influenza-A viruses in ducks in northwestern Minnesota: fine scale spatial and temporal variation in prevalence and subtype diversity. PLoS ONE 6:e24010. doi: 10.1371/journal.pone.0024010
Wille, M., Latorre-Margalef, N., Tolf, C., Stallknecht, D. E., and Waldenström, J. (2017). No evidence for homosubtypic immunity of influenza H3 in Mallards following vaccination in a natural experimental system. Mol. Ecol. 26, 1420–1431. doi: 10.1111/mec.13967
Keywords: avian influenza virus, low pathogenic, migration, Ottenby, population-level, simulation, virus dispersal, wild bird
Citation: van Toor ML, Avril A, Wu G, Holan SH and Waldenström J (2018) As the Duck Flies—Estimating the Dispersal of Low-Pathogenic Avian Influenza Viruses by Migrating Mallards. Front. Ecol. Evol. 6:208. doi: 10.3389/fevo.2018.00208
Received: 16 May 2018; Accepted: 21 November 2018;
Published: 04 December 2018.
Edited by:
Nichola J. Hill, Tufts University, United StatesReviewed by:
Briana Abrahms, Southwest Fisheries Science Center (NOAA), United StatesCamille Lebarbenchon, Université de la Réunion, France
Copyright © 2018 van Toor, Avril, Wu, Holan and Waldenström. This is an open-access article distributed under the terms of the Creative Commons Attribution License (CC BY). The use, distribution or reproduction in other forums is permitted, provided the original author(s) and the copyright owner(s) are credited and that the original publication in this journal is cited, in accordance with accepted academic practice. No use, distribution or reproduction is permitted which does not comply with these terms.
*Correspondence: Mariëlle L. van Toor, marielle.vantoor@lnu.se
Jonas Waldenström, jonas.waldenstrom@lnu.se