- 1Key Laboratory of Geographic Information Science, Ministry of Education, School of Geographical Science, East China Normal University, Shanghai, China
- 2Department of Geography, Delhi School of Economics, University of Delhi, New Delhi, India
- 3Department of Environmental and Geographical Science, University of Cape Town, Cape Town, South Africa
- 4College of Geography and Environmental Sciences, Zhejiang Normal University, Jinhua, China
Land transformation is caused by natural as well as anthropogenic driving forces and its impact on the regional environment is a key issue in understanding the relationship between society and the environment. Here, we investigate Land Use Land Cover (LULC) change over four decades, based on Landsat satellite imagery for 1987, 1997, 2007, and 2017, for the Barddhaman district of West Bengal, India. In total, six land use and land cover types have been identified. Over the period in question, there are notable increases in the area under built-up land, plantations and water bodies, whereas there has been a marked decrease in forest cover, agricultural land, and in bare land. The diverse effects of land transformation on the natural environment have been assessed using Land Surface Temperature (LST), Normalized Difference Vegetation Index (NDVI), Normalized Difference Water Index (NDWI), Leaf Area Index (LAI), Effective Roughness Length (ERL), and Surface Albedo (SA). Overall, mean annual LST increased by 2.91°C during the study period, while there were reduced values for vegetation indices and an increase in the water index over the period 1987–2017. LAI and ERL both exhibit notable decreases, although the pattern was not uniform across the study area. For example, LAI values increased over time in the Kalna, Memari, Jamalpur, Ausgram, and Kanksa regions. In Faridpur-Durgapur, Raniganj, Asansol, and Raina, increases in surface albedo and ERL were more marked than in other regions. Negative correlations are found between LST-NDVI and NDVI-NDWI, while there is no correlation between LST and NDWI. During the period 1987–2017, NDVI values have declined, although the NDWI shows no clear trend. LULC change is shown to have had a series of negative impacts on the environment of the Barddhaman district. In response, technological, economic, policy, or legislation measures are needed to restore degraded ecosystem services in the district as well as other areas where similar impacts are experienced.
Introduction
Land use change, land cover conversion and land use management interventions have greatly altered a large proportion of the earth’s surface to meet increasing demands for natural resources (Vitousek, 1997; Foley et al., 2005; Rahman et al., 2012; Song et al., 2018). Rising human population is the main driving force directly responsible for land use and land cover (LULC) change in any region (Briassoulis, 2009). Land use change is often associated with ecosystem degradation although, if judiciously managed, it may improve ecosystem quality (Koellner and Scholz, 2008). Urbanization, unplanned industrialization and associated rapid population growth have obvious negative effects on the regional environment (Kurucu and Chiristina, 2008) and inappropriate land use practices also have deleterious effects on natural systems (Gupta and Roy, 2012). On the other hand, increases in vegetation, particularly in forest cover and in water bodies, may have more positive effects on the natural environment (Trombulak and Frissell, 2000; Myhre et al., 2013; Sahim, 2018).
Several previous studies have described air quality and its impact on the surrounding environment of Barddhaman (Reddy and Ruj, 2003; Gupta et al., 2009; Chatterjee, 2011; Banerjee, 2013; Palit et al., 2013; Roy et al., 2015; Chattopadhyay et al., 2017; Dey et al., 2017). Others have used remote sensing or census data to describe land use and land cover change arising from urban and industrial expansion (Sikdar et al., 2004; Chatterjee et al., 2012; Gupta and Roy, 2012; Banerjee, 2013). However, none of these studies has thus far considered the impact of land use and land cover change on the range of environmental indicators that are the focus of this study.
The process of land use land cover (LULC) change can take place naturally or anthropogenically at scales ranging from local to regional. One of the most widely reported drivers is population increase and urbanization associated with related demands on land. Typically, as is shown in this study, a rapid increase in built up area results in widespread land use and land cover change with intendent negative impacts on a wide range of environmental indicators, including LST, NDVI, NDWI, and LAI. Ultimately, such processes are unsustainable and eventuate a decrease in overall environmental health in a region.
The diverse environmental impacts of LULC have been investigated by various means, including remote sensing assessment of surface changes using, for example, LAI, LST, NDVI, and NDWI (Gao, 1996; Fu, 2003; Feddema et al., 2005; Bonan, 2008; Oliver and Moorcroft, 2014; Laxmi, 2015; Baeza and Paruelo, 2020). LST is often utilized in studies of global temperature change, as well as in hydrological, geo-biophysical and LULC investigations (Cihlar, 2000; Mehdi et al., 2016; Zhang et al., 2016a; Alexander, 2020). In this study, LST, NDVI and NDWI have been utilized, as well as the relationships between them, as these indices integrate a range of environmental variables. For example, LST is influenced by vegetation cover, the albedo effect, soil moisture content (Charney et al., 1977; Arbia et al., 1998) and soil temperature (NASA, 2017).
The Barddhaman district is one of the most important industrial regions of India (Higher Education Department, 1997). There were just 18 industrial units in the district before the 1990s, but this had increased to 38 by 2015, accompanied by an increase in the size of the industrial area from 2133 acres to 4581 acres, including an industrial park (Higher Education Department, 1997; Economic Review of 2011-12, 2013; Msme-Development Institute, 2016). A substantial proportion of this new industrial land was converted from agriculture (Bureau of Applied Economics and Statistics, 1995/2006/2015). As such, there have been substantial land use changes arising from industrial expansion in the district which are representative of rapidly industrialized regions in India and in the developing world in general. Much of the rest of the district is still occupied by agricultural land, followed by plantation and built-up land, while only a relatively small proportion is occupied by forest cover, which has been subject to significant clearance between 1987 and 2017.
Recent changes in land use are known to have been both substantial and rapid but there has to date been no assessment of their nature, rate and scale, or indeed of their possible broader environmental impacts. The main aim of this research, therefore, is to describe and account for the changing spatial and temporal patterns of LULC in the Barddhaman district between 1987 and 2017and to assess the impact of LULC change on key environmental parameters, including LST, NDVI and NDWI.
Study Area
The Barddhaman district of West Bengal is located between 22°56′ and 23°53′N and 86°48′ and 88°25′E. The district is bounded to the north by Birbhum, Murshidabad and a part of Bihar, to the east by Nadia, to the west by Dhanbad; to the south the district is bounded by Hooghly, Bankura, and Purulia districts of West Bengal (Higher Education Department, 1997; Annual Administrative Report of Barddhaman Collectorate (Office of the District Magistrate and Collector, 2014; Figure 1).
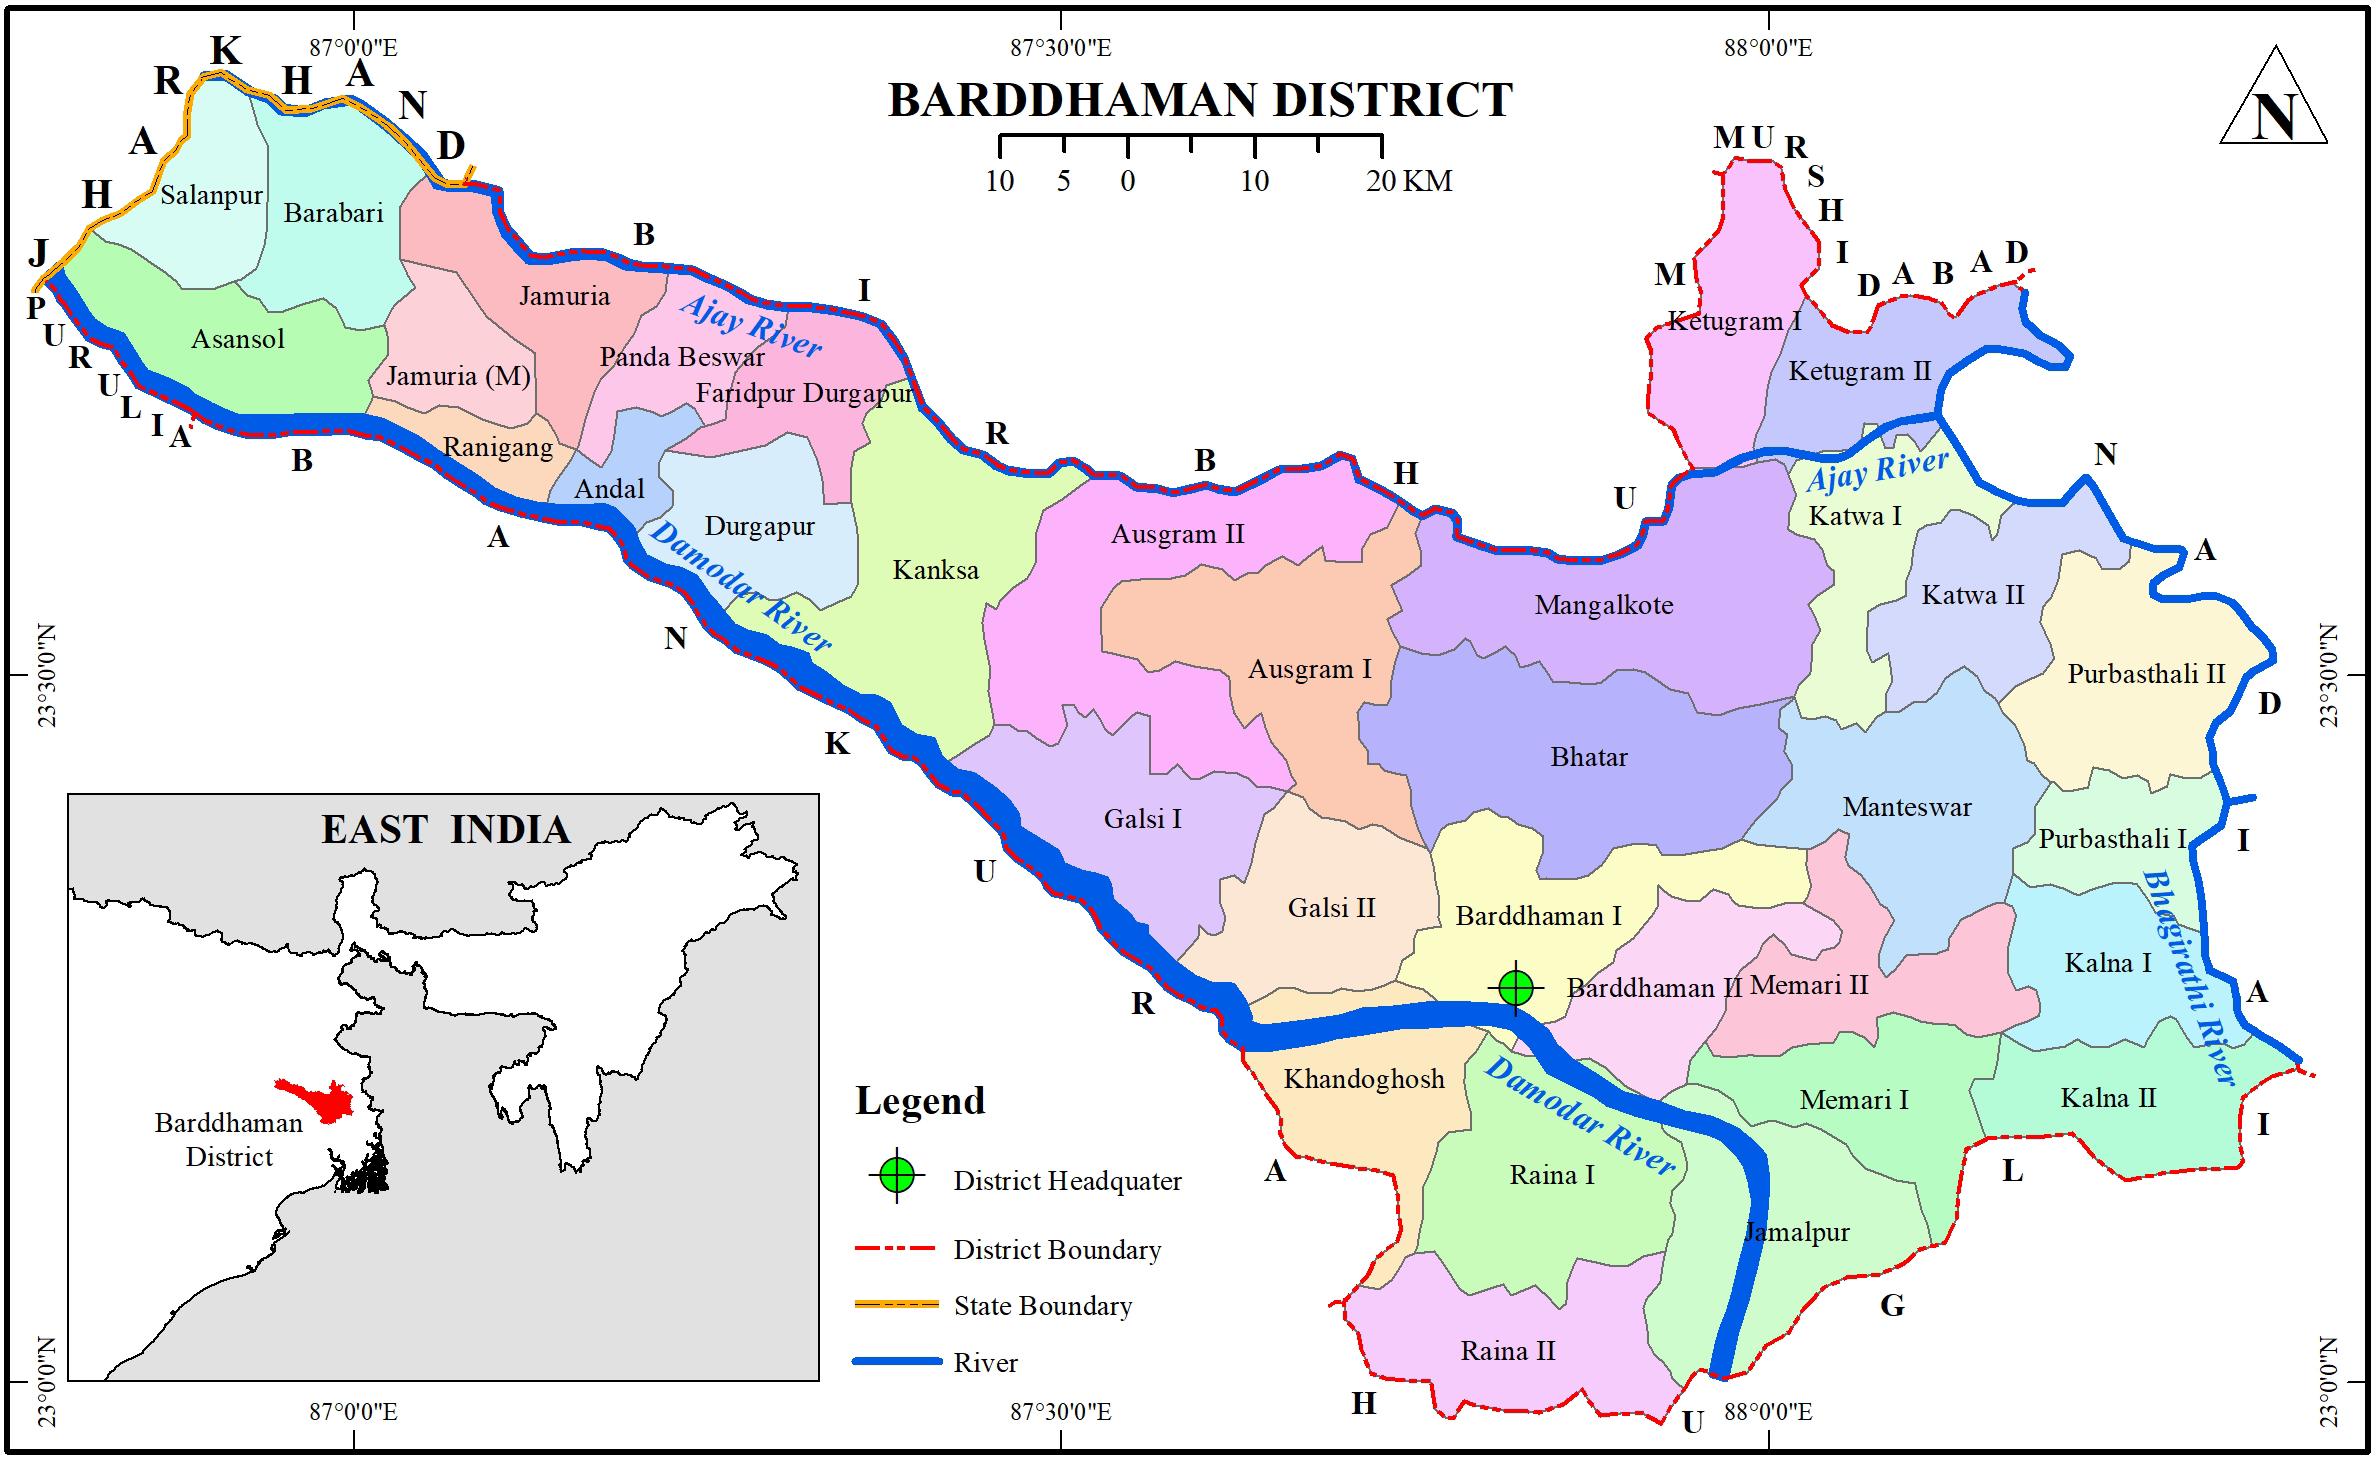
Figure 1. Locational and administrative map of Bardhhaman district. Source: Survey of India and the National Informatics Centre (NIC), 2017.
The climate is broadly speaking of the warm savanna type, with mean daily temperatures of the district in summer of around 30, and 20°C in winter, while mean annual rainfall approximates 1500 mm with much of this falling in the monsoon season from June to mid-September (Higher Education Department, 1997). Topography is varied, as the area is transitional between the undulating Jharkhand plateau in the west and the alluvial plain of the Ganga-Brahmaputra to the north and east. Overall, soils are typically rich in clay, although sandier soils are associated with the alluvial plains (Annual Administrative Report of Barddhaman (Office of the District Magistrate and Collector, 2014). According to the most recent (2011) census of India, the total population of Barddhaman district was 7,723,663 with a population density of 1,099 per km2. Barddhaman is the third and seventh most populous district of West Bengal and India respectively, and the proportion of its population living in urban areas increased from 36.9 to 39.9% between 2001 and 2011 (Census of India, 2011). Conditions in Barddhaman are suited to both agriculture and industrial development. Some 58% of the total population is dependent on primary economic activities, especially agriculture and, in terms of mineral resources, Barddhaman is regarded as one of the premier districts in India (Economic Review of 2011-12, 2013).
Materials and Methods
The purpose of the study is to evaluate the impact of LULC change, using several indicators, on a number of environmental variables. The LULC study was based on supervised classification of satellite imagery from Landsat 5 Thematic mapper (TM) Landsat 8 OLI/TIRS (Li et al., 2013) for the years 1987, 1997, 2007, and 2017. The data products for surface albedo, LAI, ERL, including LULC were calculated for the month of May. Surface albedo and ERL were calculated with time averaged 0.25° data sets taken from the OMI model, Global Modeling and Assimilation Office, NASA, whereas MODIS 8 day time-averaged data at 250 m resolution were obtained for LAI.
In this study, six major LULC classification types were identified based on the USGS-LULC classification system. Remote sensing, when incorporated with GIS, enables accurate land use classification and change over time (Richards, 1993). LAI, surface albedo, and the effective roughness length were also measured to account for the spatio- temporal variation of vegetation cover and temperature effect on the surrounding environment.
Data Analysis
In addition, radiometric correction including Haze reduction, Noise reduction and several other atmospheric corrections have been processed in ERDAS and ArcMap for better estimation of land use and land cover. Maximum Livelihood techniques were used for Supervised Classification. In all, 300 random samples were used for Kappa Accuracy Assessment, whereby more than 80% Kappa values were obtained. Six categories of land use and land cover were identified from the Landsat datasets. For the purpose of this study, a total of 30 LST random samples were taken to measure the trend in LST under different land uses and land covers for different years. The calculation of LST is presented in section “Calculation of LST” in detail. NDVI values were divided into the three categories viz. < 0, 0–0.255, and > 0.255; NDWI values were categorized into < 0, 0–0.1, and > 0.1. MODIS data products with 8 days time-averaged with 250 m spatial resolution has been processed for this study for LAI. On the other hand, surface albedo and effective roughness length with 0.25° time-averaged data sets were directly processed by the spatial analysis tool in ArcMap. Finally, a correlation matrix analysis, indicating correlation coefficients and level of statistical significance was constructed to investigate the nature of relationships between the multiple variables.
A total of 100 random points (N = 100) was sampled for each of the indicators in order to achieve this (Figure 8). The correlation matrix shows that LST and NDVI are negatively correlated, that there is a strong negative correlation between NDVI and NDWI, and that there is no correlation between LST and NDWI. A strong negative correlation is evident between NDVI and NDWI. The relationship between LST and NDVI is negative (degree of correlation or R2 = 0.054 and regression function: y = 20.5 + [−]3.31 × x), no correlation is observed between LST and NDWI (degree of correlation or R2 = 0.024 and regression function: y = 20.34 + 2.38 × x), NDVI and NDWI are very markedly negatively correlated (degree of correlation or R2 = 0.734 and regression function: y = 0.02 + [−]0.93 × x) (Figure 8 and Table 4). Only NDWI and NDVI are positively correlated (degree of correlation or R2 = 0.234 and regression function: y = 0.08 + 0.51 × x) (Figure 8 and Table 4).
Calculation of LST
Land surface temperature was calculated for the month of May, a largely cloud-free month in the Bardhhaman district. In total, 30 random pixel samples were taken to measure the trend in LST for years 1987, 1997, 2007, and 2017. Five different LST categories were identified in this study, viz. < 25.50 Celsius (c), 25.51–27.15 c, 27.16–28.85 c, 28.86–30.50 c, and > 30.50 c.
Calculation of Radiance
Thermal infrared for Landsat 8 and Thermal band for Landsat 5 were used in this study and radiance calculated using the raster calculator tool in Arc GIS. Following this step, Landsat 8 OLI and TIRS band (Barsi et al., 2014) data were converted to TOA spectral radiance using the radiance rescaling factors provided in the metadata file (USGS, 2017).
Where:
Lλ = TOI spectral radiance [watts/(m2 * srad* μm)]
ML = band specific multiplicative rescaling factor (actually thermal infrared band)
Qcal = quantized and calibrated standard product pixel values (DN)
AL = the band specific additive rescaling factor.
Conversion to at- Satellite Brightness Temperature
The following equation was used to calculate the satellite brightness temperature.
Where:
BT = satellite brightness temperature
K1and K2 = stand for the band specific thermal conversion constants
ln = log number (formula tools in raster calculator, ArcGIS)
Lλ = radiance
273.15 = conversion factor Kelvin to Celsius.
The NDVI Method for Emissivity Correction
The emissivity correction was obtained via NDVI. The proportion of the vegetation (PV) and its emissivity (ε) were calculated from the following formulae.
NDVI = (NIR–VIS)/(NIR + VIS)
Calculating the Proportion of Vegetation
The proportion of vegetation (PV)was calculated using the following formula using computed values forradiance, satellite temperature and the vegetation index.
Pv = [(NDVI–NDVImin)/(NDVImax–NDVImin)]2 Where:
Pv = proportion of vegetation
NDVImin = minimum value of NDVI
NDVImax = maximum value of NDVI.
Calculating Land Surface Emissivity (LSE)
Land Surface Emissivity [LSE (ε)] calculation is required in order to estimate LST, since the LSE is a proportional factor that scales radiance to predict emitted radiance, and LSE is the efficiency of transmitting thermal energy across the surface into the atmosphere (Jiménez-Munoz et al., 2006). LSE was calculated as follows:
Where:
εv and εs = emissivity of the vegetation and soil, respectively
C = represents the surface roughness (C = 0for homogenous and flat surfaces) taken as a constant value of 0.005
Pv = proportion of vegetation
0.004 and 0.986 = constant value.
Land Surface Temperature (LST)
Finally, land surface temperature was calculated from the following formula:
LSTs = BT/1 + w * (BT/p) * ln (e)
Where:
LSTc = land surface temperature in degrees centigrade
BT = satellite brightness temperature
1 = constant factor
w = wavelength of emitted radiance (11.5μm)
p = h * c/s (1.438 * 10–2 m K) or constant value of p = 14380
ln = log number
(e) = emissivity.
Normalized Difference Water Index (NDWI)
NDWI measures changes related to water bodies, using green and near infra-red (NIR) wavelengths (McFeeters, 1996) as follows:
NDWI = (Green–NIR)/(Green + NIR).
Leaf Area Index (LAI)
LAI is calculated as per Maynard and Royer (2004).
Where:
fi = the fractional area of each LULC category i,
= the roughness length,
Zb = the height of the first atmospheric model level above the ground (i.e., 65 m).
Results
LULC Change
Figure 2 and Table 1 reveal that agricultural land has declined between 1987 and 2017by 28,805 hectares, representing almost 12% of the original total. The rate of conversion of agricultural land appears to have increased, with 10,421 hectares lost between 1997 and 2007, and a further 13,524 hectares between 2007 and 2017. By contrast, built–up land almost doubled in area between 1987 and 2017, increasing from 14,123 hectares (20.96%), 20,618 hectares (25.31%) and 29,369 hectares (28.76%) for the periods 1987–1997, 1997–2007 and 2007–2017 respectively. The increase has been continuous, but most pronounced within the last ten years (Table 1 and Figure 2).
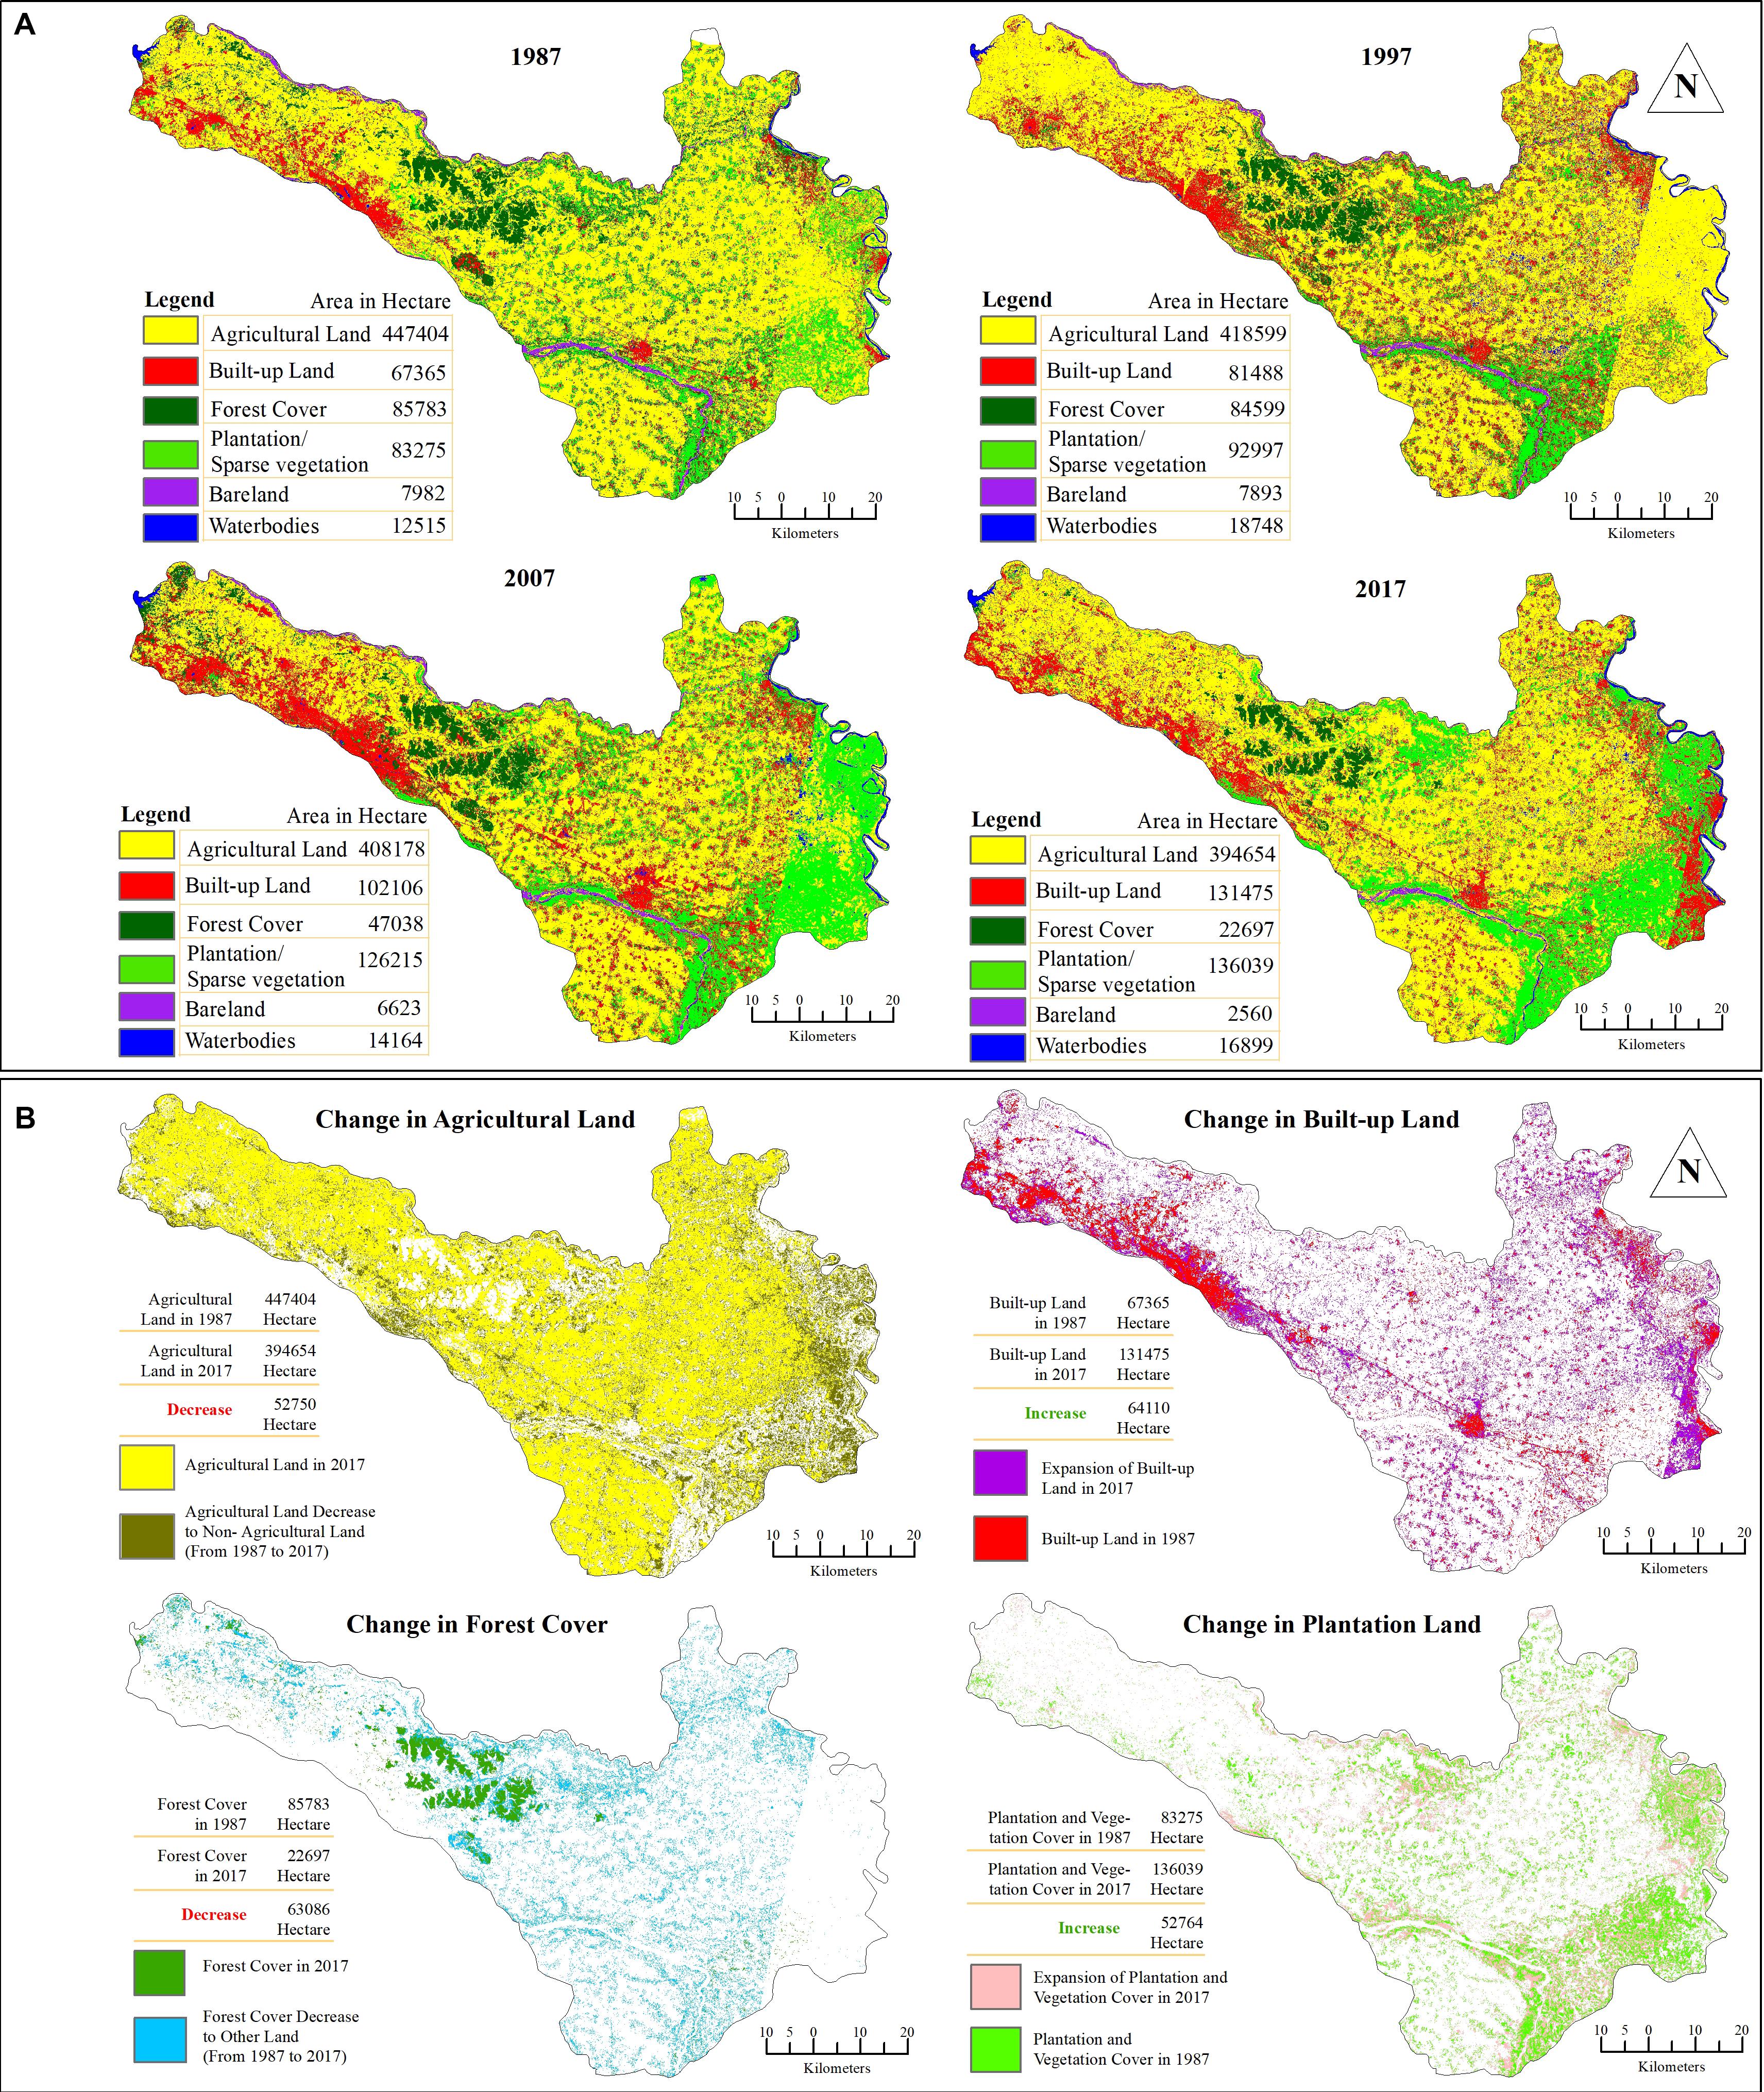
Figure 2. (A) LULC (1987, 1997, 2007, and 2017). (B) LULC change (1987–2017). Author, 2019. (Landsat 5 and 8 satellite imagery, USGS). Author, 2019. (Area calculated from satellite Landsat imagery by supervised classification method in Erdas Imagine 14 and ArcGIS).
Forest cover decreased by 73.54% from 1987 to 2017, recording especially high losses in the last decade. The most significant reductions in forest cover of the Barddhaman district were especially prominent in northern Durgapur, but also marked in Ausgram and Kanksa. Plantations increased between 1987 and 2017 by 52,764 hectares (63.36%), with higher expansion rates between 1997 and 2007 than in other periods (Table 1 and Figure 2).
Accuracy Assessment
The overriding assumption in any image accuracy assessment procedure is that the area for which it is conducted is representative of the entire area mapped from remotely sensed data (Congalton, 1991; Jensen, 2015). Kappa accuracy assessment is carried out to reflect the difference between actual agreement and the agreement expected by chance, and is an important statistical method in the process of analyzing remote sensing quantitative data (Congalton, 2004). A Kappa value of 0.85 means that there is 85% better agreement than by chance alone (Congalton and Mead, 1986). The LULC classified images used in this study result in Kappa values of 0.8209, 0.8012, 0.8437, and 0.8485 in 1987, 1997, 2007, and 2017, respectively, whereas the overall accuracy exceeds 80% throughout and may be regarded as acceptable (Bharatkar and Patel, 2013).
Land Use Land Cover Change Detection Matrix (1987–2017)
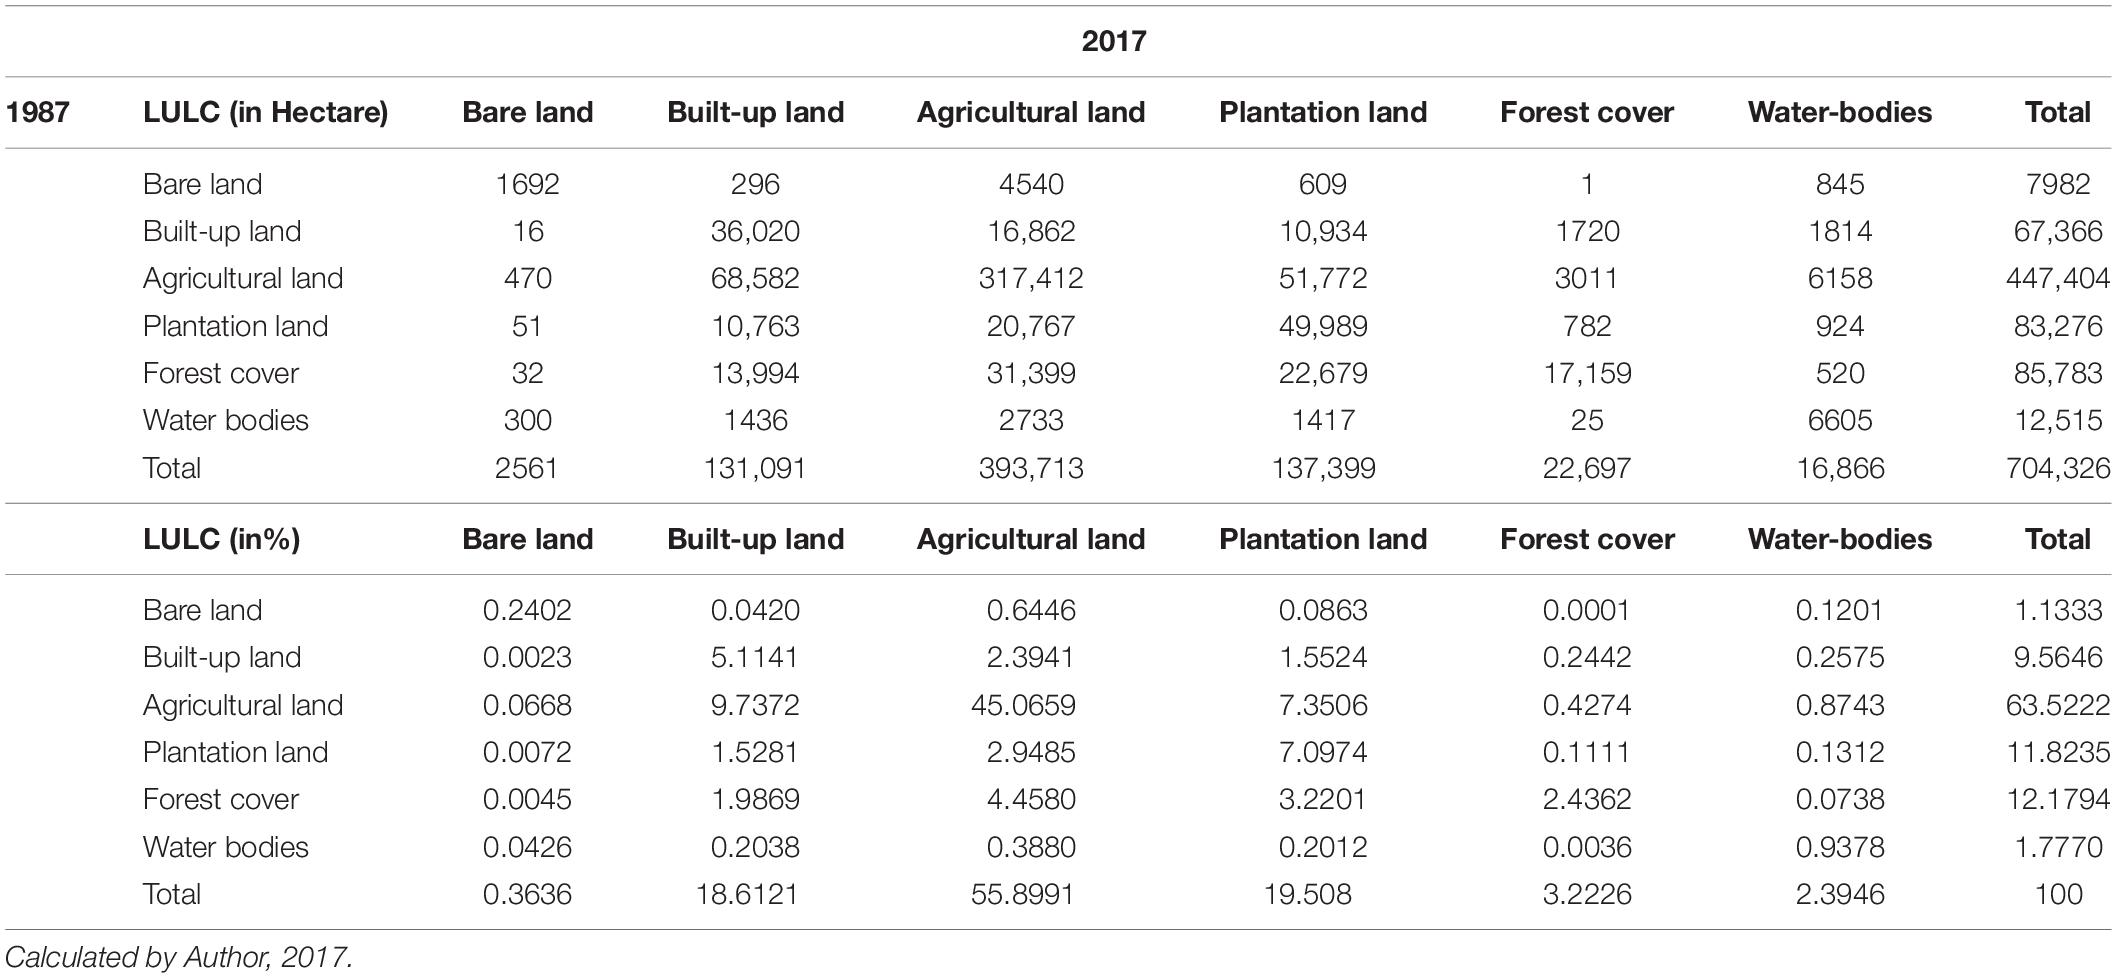
The LULC change detection matrix (Table 2) presents data revealing changes that occurred in each category over the 30 years period under consideration. The matrix indicates considerable change in agricultural land followed by plantation and built-up land. A substantial proportion of agricultural land has been converted into built-up land and plantations. Table 2 also indicates major changes in dense forest cover.
Spatial and Temporal Change of LST, NDVI, NDWI, and LAI
In 1987, the highest and lowest LSTs recorded for May were 36.24 and 15.27°C, respectively. Figure 3 shows that, by 2017, the maximum LST was almost 3.0°C higher than 30 years earlier during the same month. Minimum temperatures also increased, from 15.27°C in 1987 to 16.66°C in 2017.
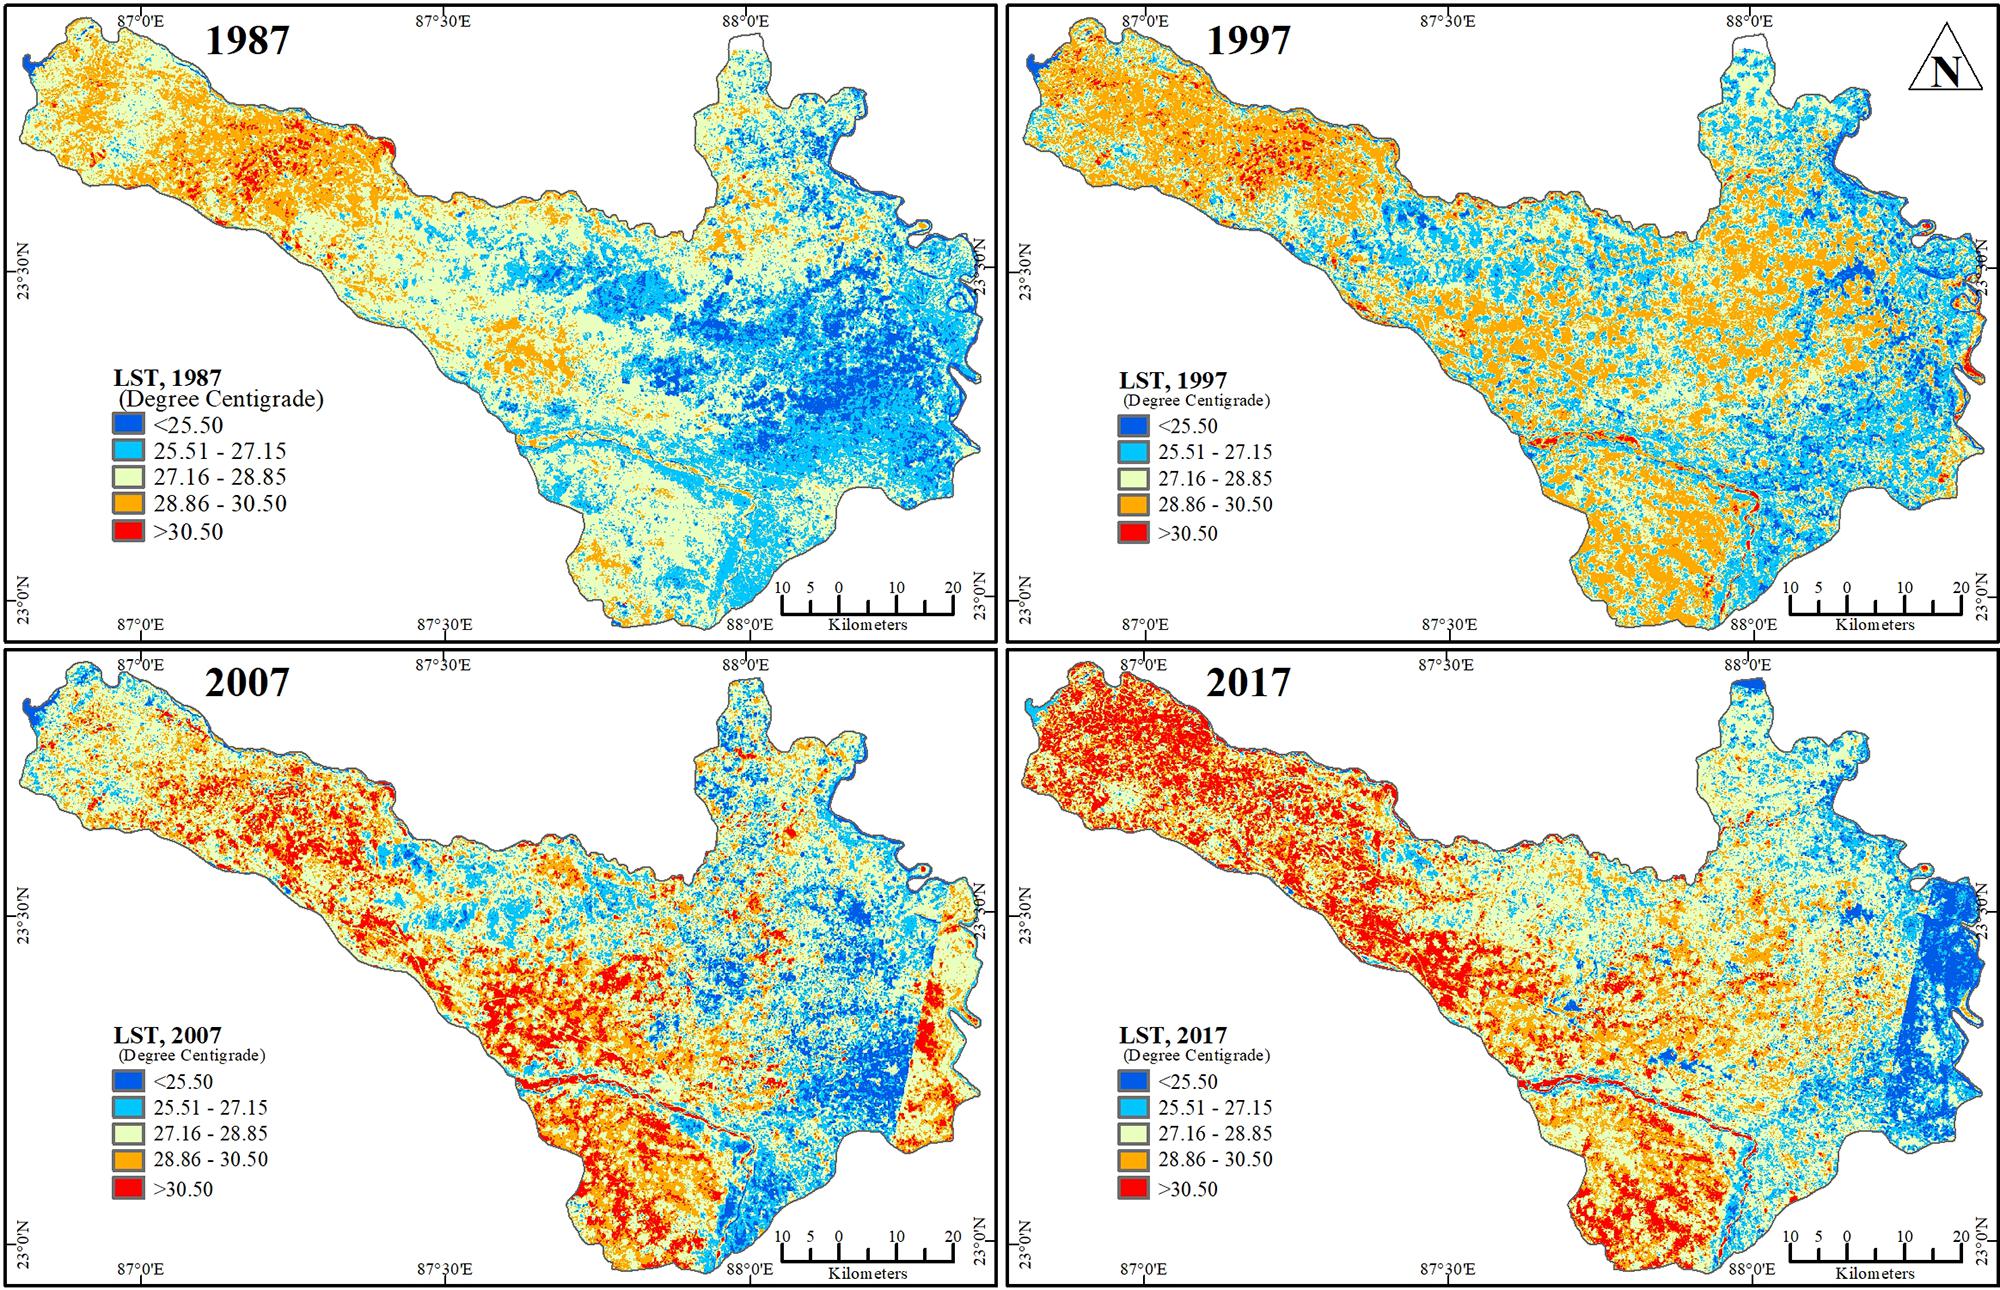
Figure 3. LST of Barddhaman district (1987, 1997, 2007, and 2017). Source: Author, 2019. (Landsat 5 and 8 satellite imagery, USGS).
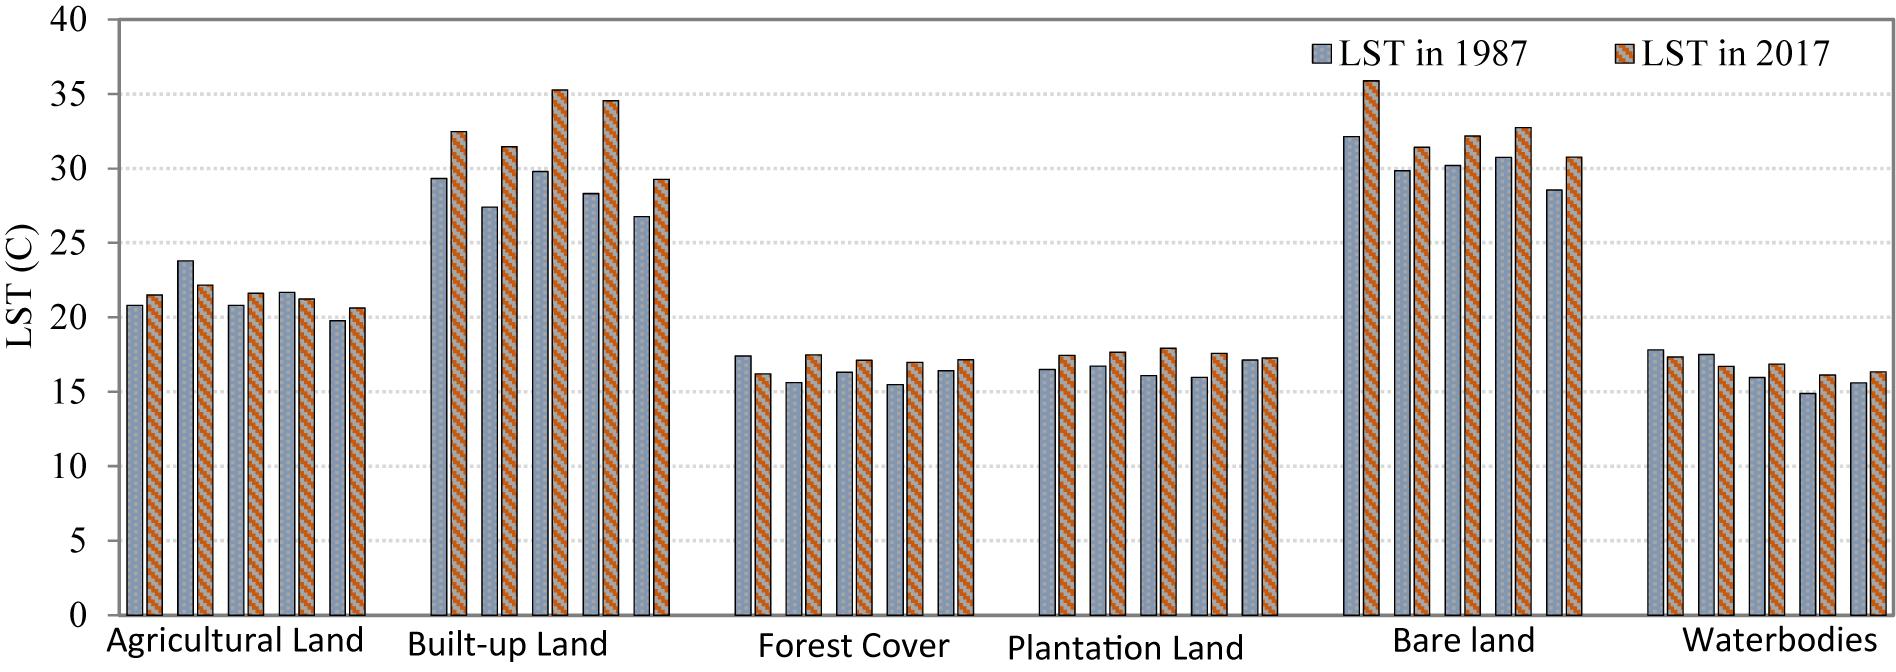
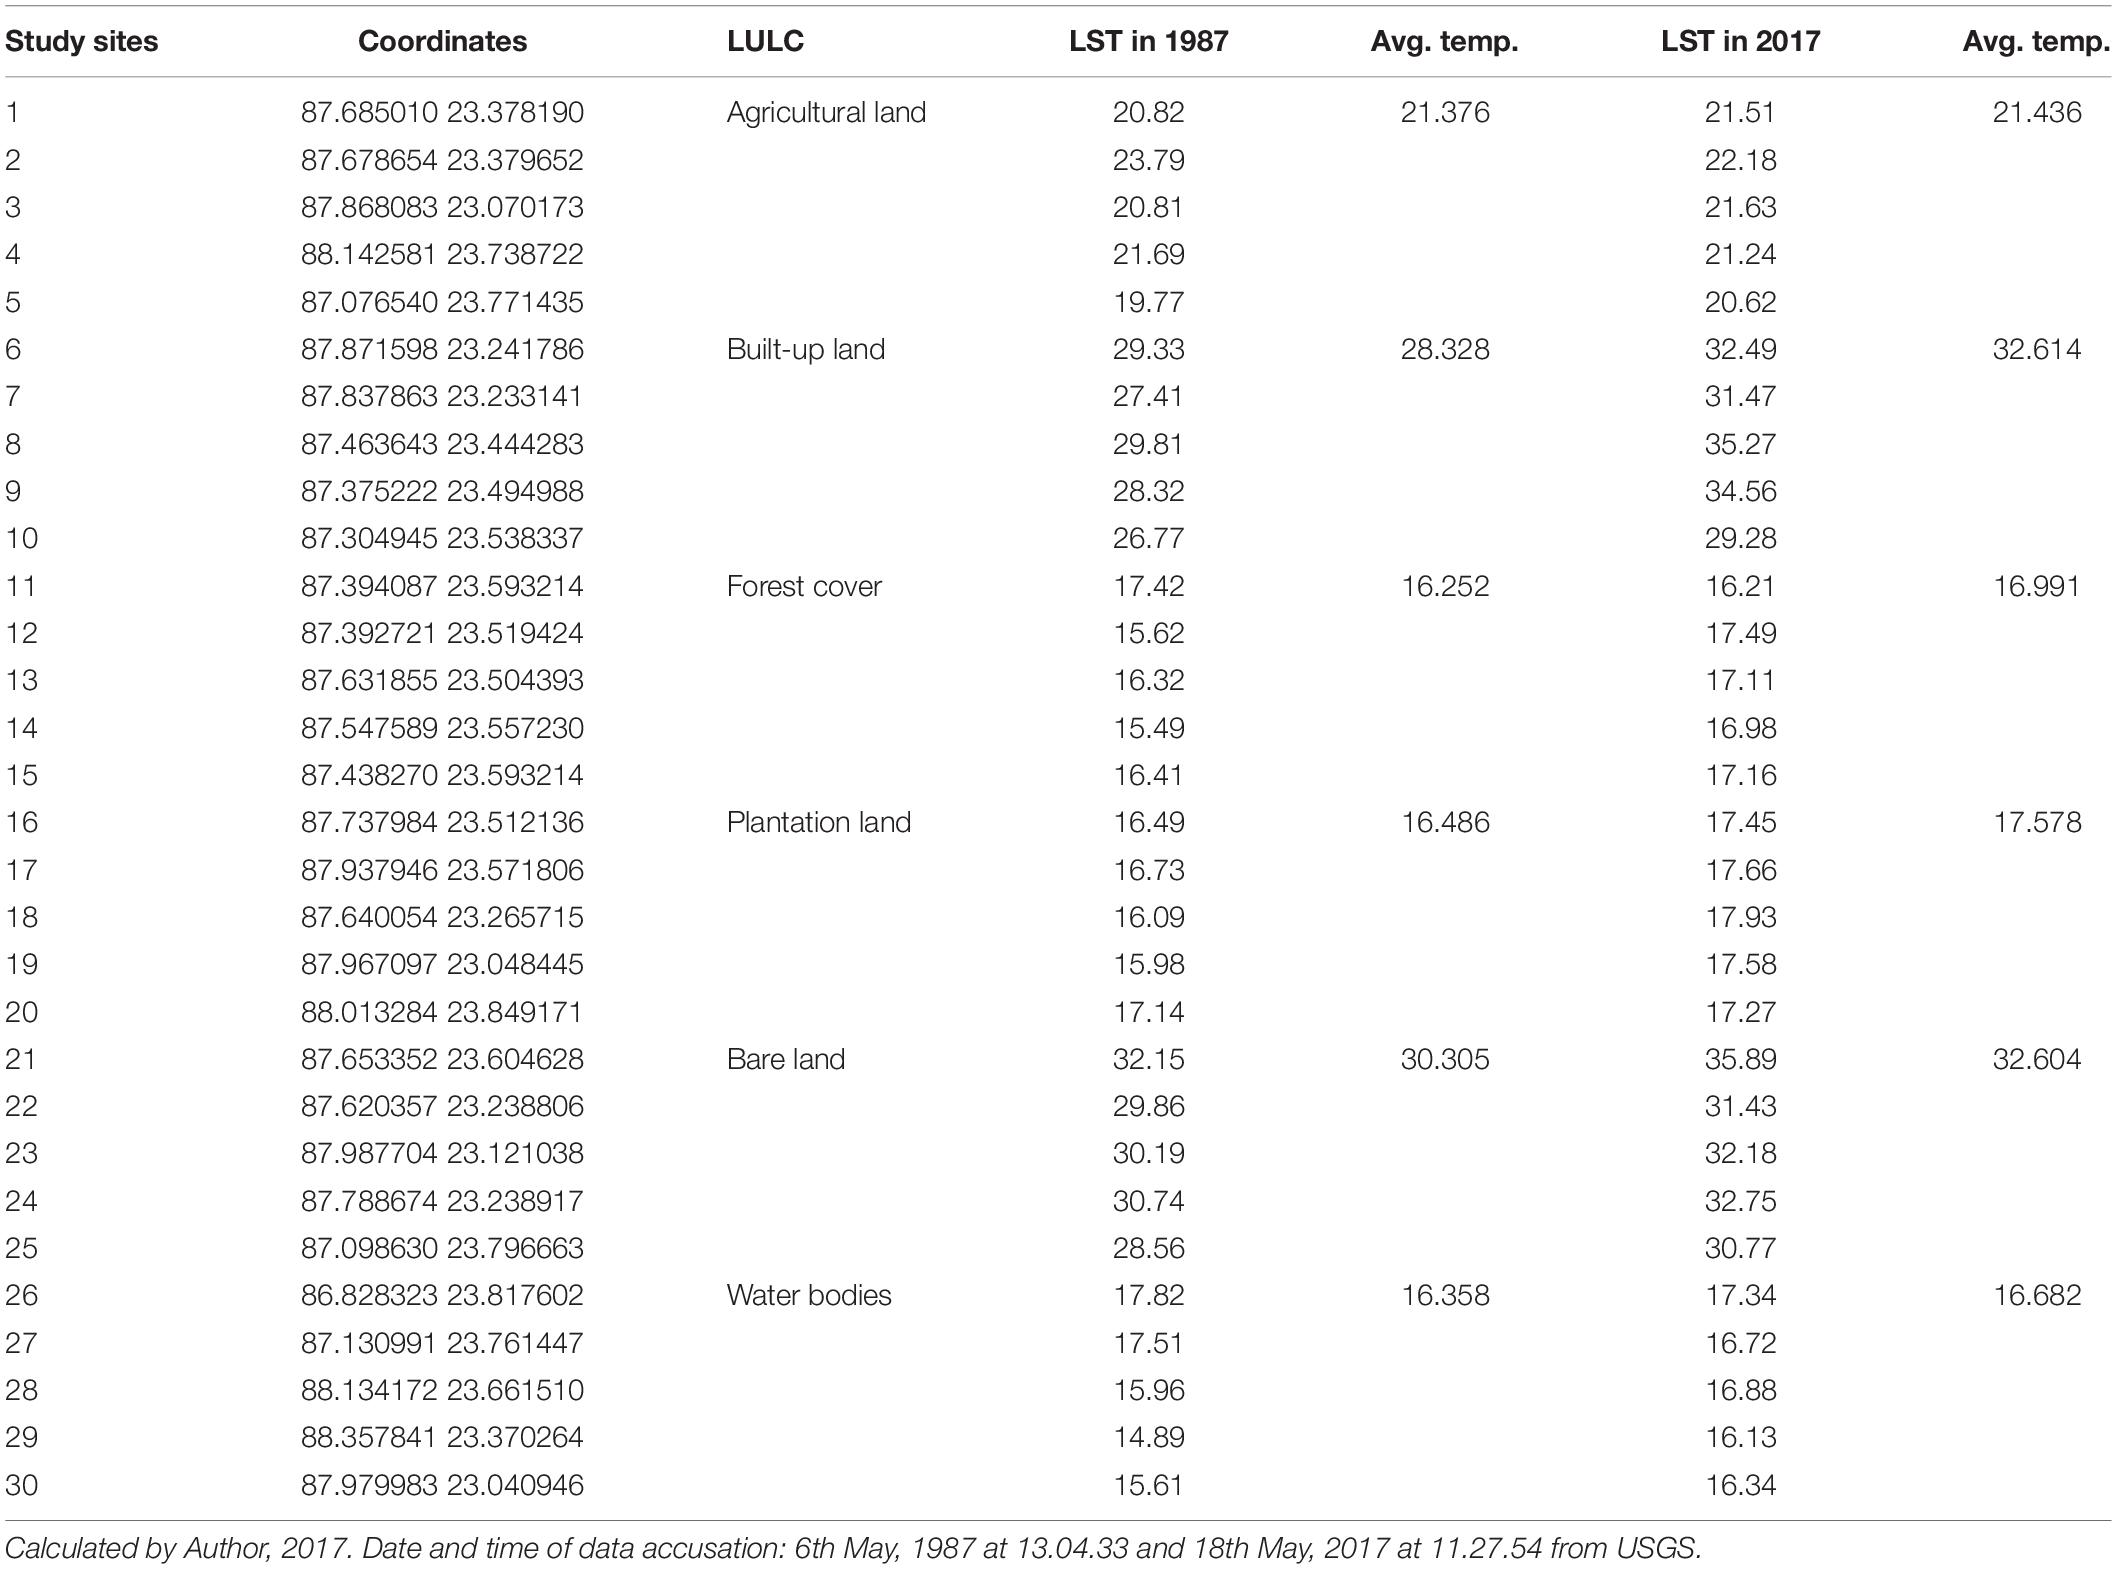
Notably, LST values were higher on built-upland than on any other LULC type (Figure 4 and Table 3). The mean monthly LST of agricultural land was 21.37°C in 1987 and 21.43°C in 2017, while the mean temperature of built-up land increased by about 4.29°C. The mean monthly temperature of plantation land was 16.48°C in 1987 and 17.57°C in 2017, an increase of 1.09°C, while there was an increase of around 0.75°C on land occupied by forest. The mean LST of water bodies was 16.35°C in 1987 and 16.68°C in 2017. The lowest rate of increase in LST is found in water bodies and under forest cover.
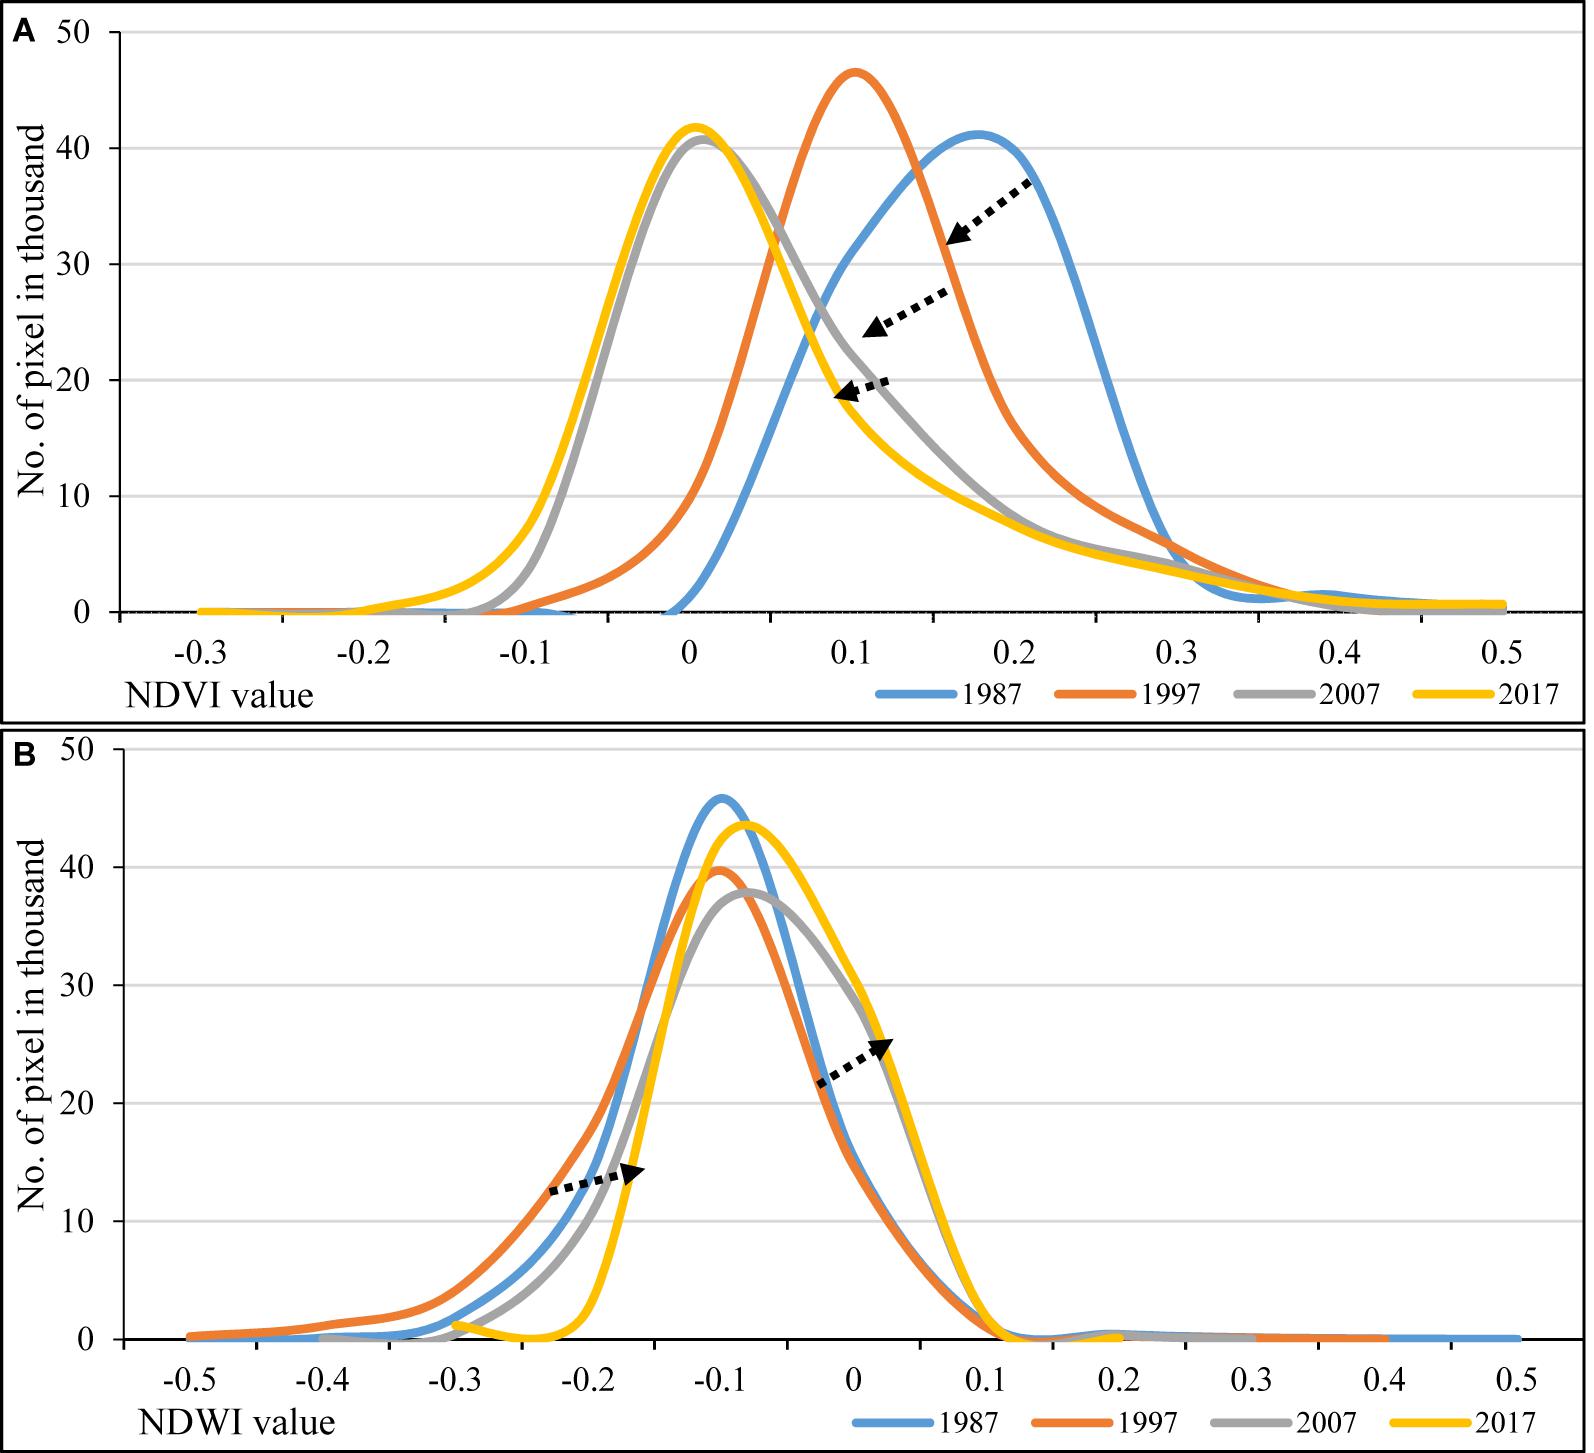
Pixel values of NDVI for three different categories (below 0, 0–0.255 and above 0.255) show spatial and temporal variation across the region. In general, NDVI exhibits a negative trend during the period 1987–2017 (Figures 5, 10A). The most notable change occurred in the Kanska, Faridpur Durgapur and Ausgram regions, where vegetation cover is highest. The south-eastern part of the district especially was subject to substantial increases in the areas of plantation land between 1987 and 1997, although after this date 1997, NDVI values decreased (Figure 5).
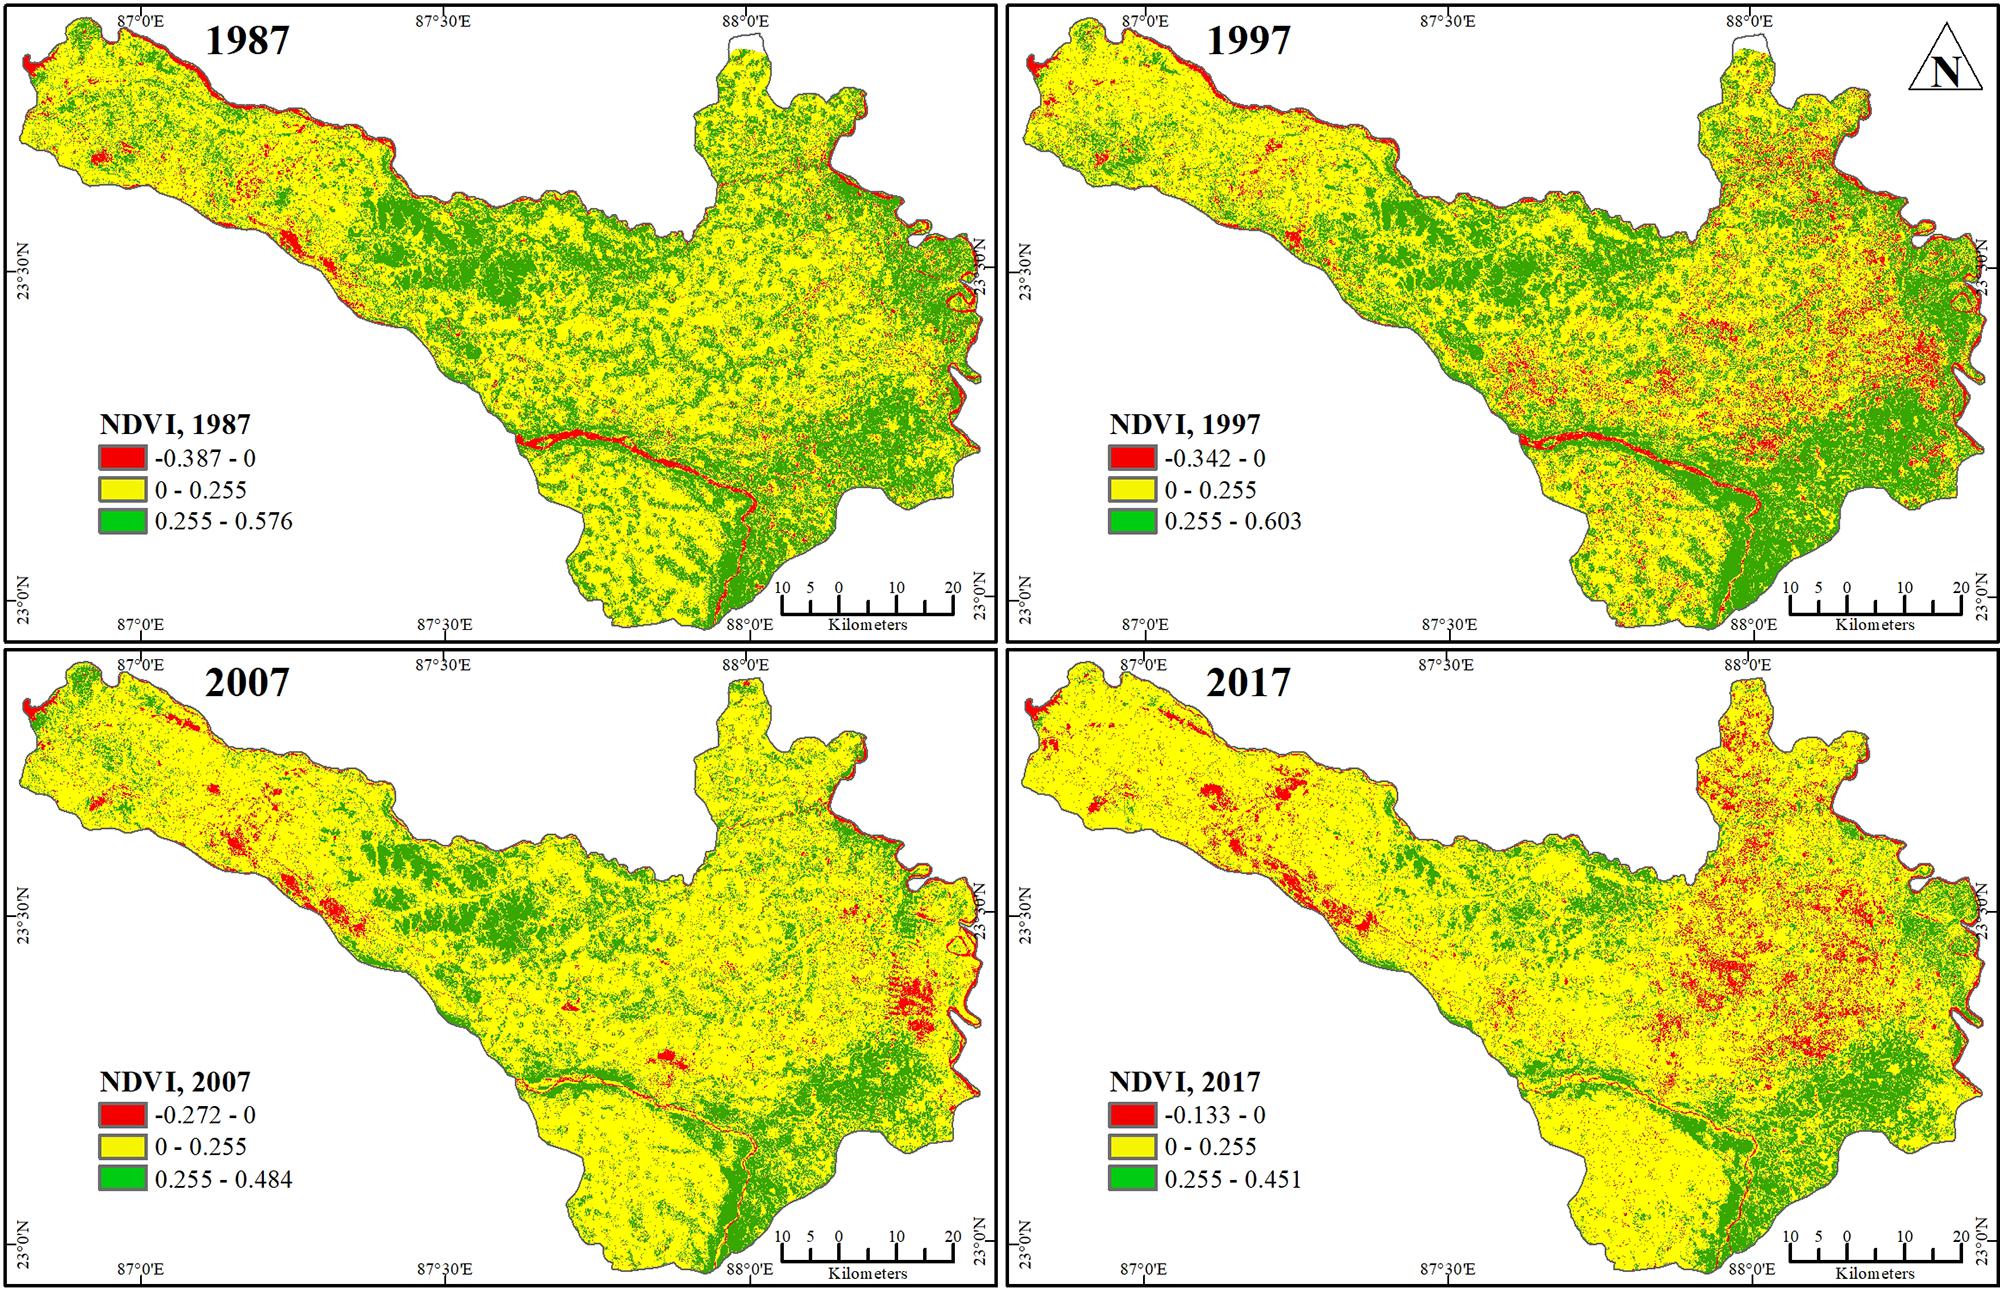
Figure 5. Normalized Difference Vegetation Index (NDVI). Author, 2019. (Landsat 5 and 8 satellite imagery, USGS).
NDWI values from 1989 to 2017 indicate that the total area and depth of water bodies, including rivers, lakes, ponds and wetlands, increased between 1987 and 2017 (Figure 6).
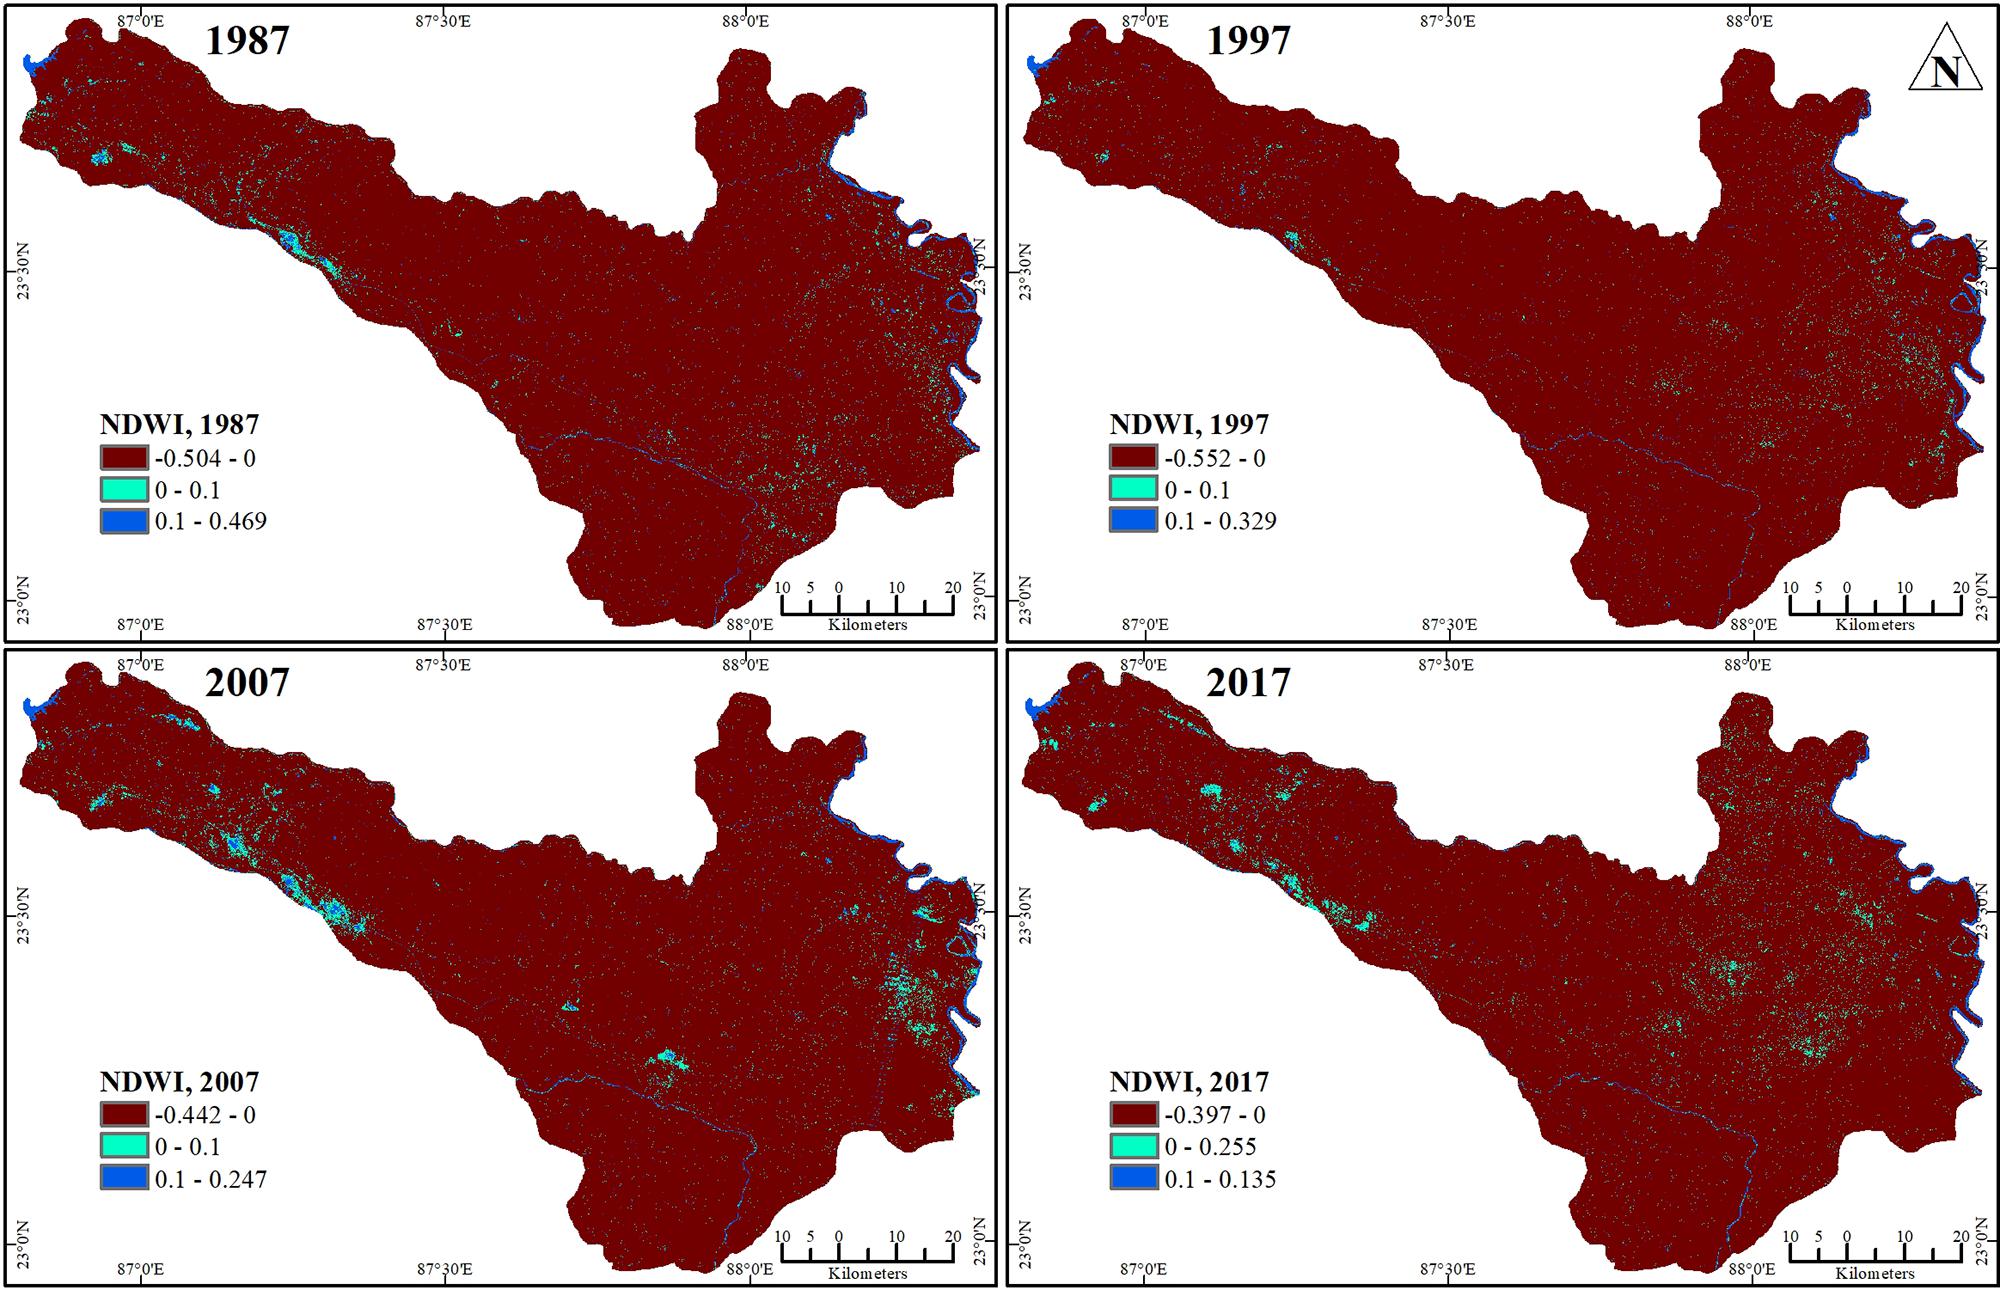
Figure 6. Normalized Difference Water Index (NDWI). Author, 2019. (Landsat 5 and 8 satellite imagery, USGS).
Leaf Area Index (LAI) is the total one-sided (or one half of the total all-sided) green leaf area per unit ground surface area (Chen and Black, 1992) and is a measure of biological productivity.
Figure 7 illustrates that LAI and effective roughness length show a decreasing trend between 1987 and 2017 in the Barddhaman district. Higher LAI values are found in the south-eastern parts (Kalna-Memari-Jamalpur) as well as in the Ausgram- Kanksa region (Figure 7A). Conversely, surface albedo shows a notable increase in these same regions (Figure 7B). Change in surface albedo and effective roughness length values in Faridpur Durgapur, Raniganj, Asansol, and Raina was greater than in other regions of the district over the period (Figure 7C).
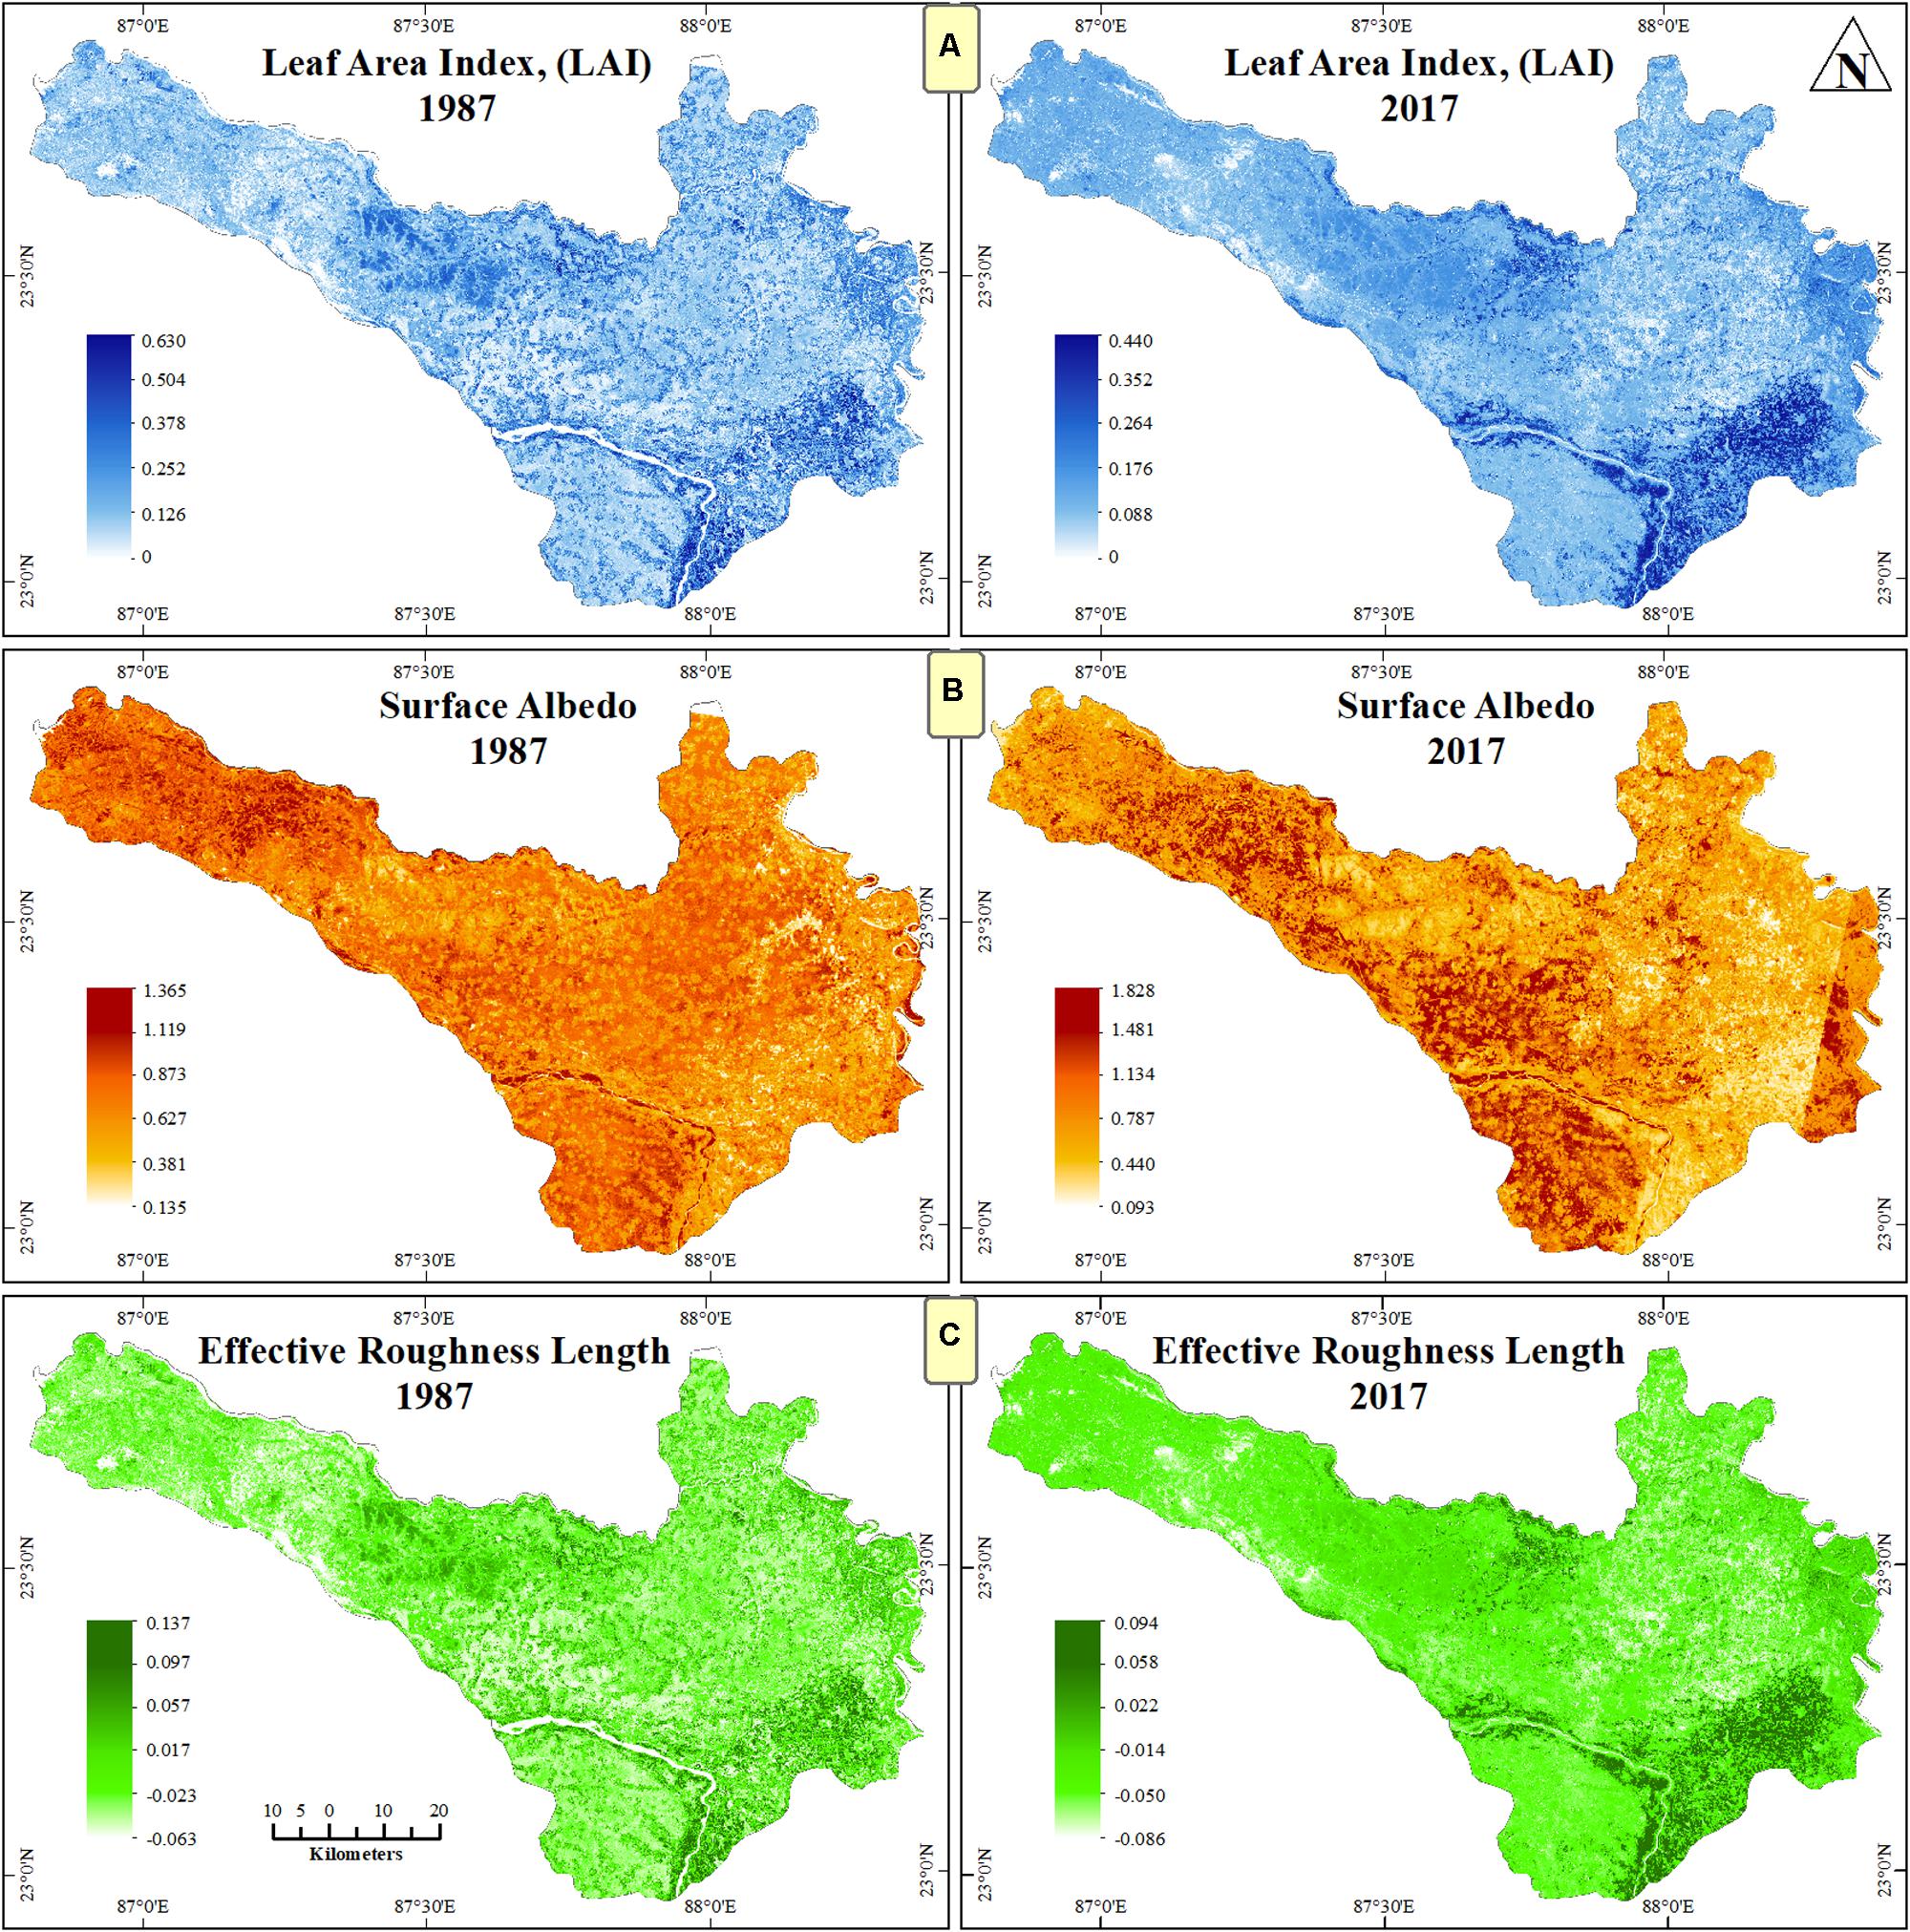
Figure 7. Differences in (A) Annual mean LAI, (B) Land surface albedo (×), and (C) Effective roughness length (unit: m) in two difference year (1987 and 2017) using 8 days time average with 250 m spatial resolution taken from MODIS product for LAI; time average with 0.25° data sets taken from the OMI model, AVHRR data for SA and ERL (Loveland et al., 2000).
Multiple Correlation Matrix Analysis of LST, NDVI, and NDWI
With the help of correlation matrix analysis (Figure 8 and Table 4), the relationships between LST with NDVI, LST with NDWI and NDVI with NDWI have been established to further analyses the characteristics of change over time (Cohen, 1960).

Figure 8. Multiple correlation analysis of LST, NDVI, NDWI, (N = 100, Significant Correlation at the 0.01 level), of Barddhaman district, 2017. Method Testified in ArcGIS, Erdas Imagine Software, Microsoft Excel and SPSS.
Discussion
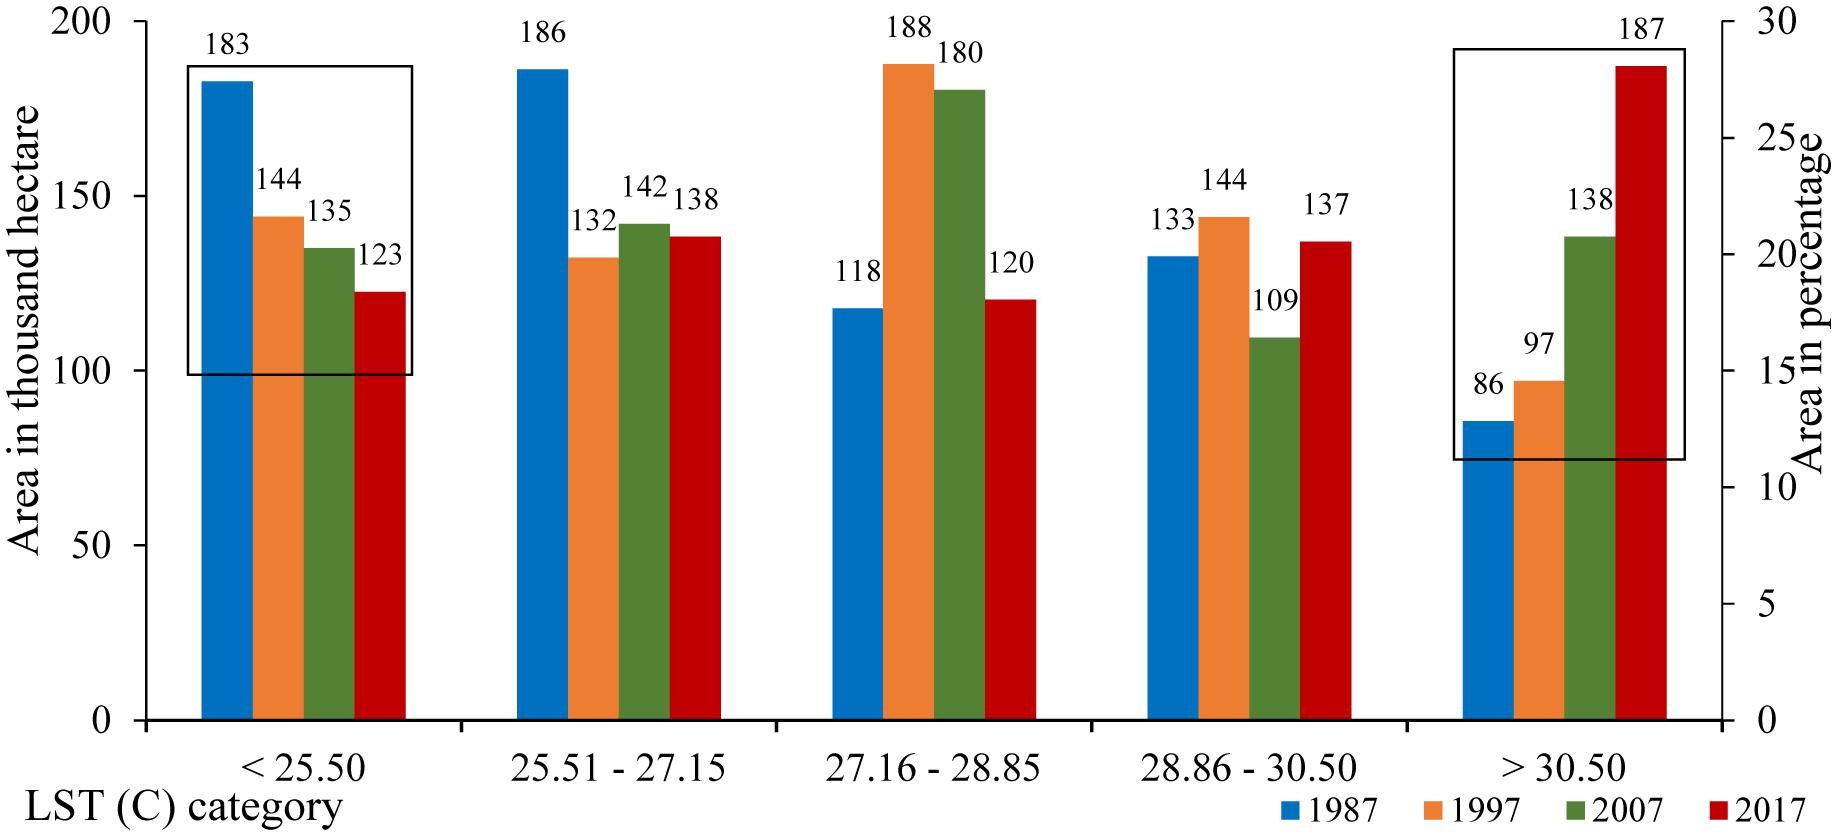
The study reveals conspicuous decreasing trends in agricultural land, forest cover and bare land in the Barddhaman district over the period 1987–2017, in particular due to the expansion of built-up land, whereas there is a less consistent increasing trend recorded in areas occupied by plantations and water bodies (Figure 2). Numerous previous studies have also noted marked losses of agricultural land and forest cover due to urban expansion in South Asia (e.g., Nor et al., 2017; Aoshima et al., 2018) most notably in urban regions of India (Moghadam and Helbich, 2013). Published statistics are compatible with the observed changes; the Barddhaman (Bureau of Applied Economics and Statistics, 1995/2006/2015) and Higher Education Department (1997) report that more than 25% of the land was developed and that forest cover declined more than 65% within the last three decades. LULC change has been accompanied by an overall increase in LST of 2.91°C. The analysis reveals that, over the period under consideration, there are consistently increased temperatures across the district. Of the five LST categories, the areas with values < 25.50 decreased most markedly. The second (25.51–27.15), third (27.16–28.85) and fourth (28.86–30.50) LST categories were more variable, but a marked increasing trend was found in the > 30.50 category. The analysis clearly depicts that, between 1987 and 2017, temperatures increased across the district overall (Figure 9).
NDVI, LAI and effective roughness length all show a decreasing trend over the period in question. These observations are consistent with the findings of Cao et al. (2015) and Mahmood et al. (2010) among others, who also note adverse environmental effects of land conversation, including on LST. Indeed, many studies have concluded that LST is negatively correlated with forest cover (or any other green space in general), while built-up land is positive correlated with temperature (Mallick and Rahman, 2012). The findings of this study confirm that LSTs are higher, and increase more markedly, in areas of lower vegetation cover (Figures 3, 5). The cooling effects of vegetation are well known and the authorities need to take this into account in urban planning and design (Hang and Rahman, 2018). The diverse negative effects of land transformation on the natural environment are revealed in this study which records increased LST mainly as a consequence of the loss of forest cover and the increase in built-up land (Figures 2, 10A). This is also evident in changes in various biophysical parameters, including LAI (Figure 7A) and NDVI which has decreased in recent decades (Figure 10A).
Forest cover decline has been most prominent in Panda Beswar, Faridpur, Kanksa, and Ausgram regions (Figure 2), mainly due to the expansion of agricultural land (Figure 2A), an observation also recorded in the Bureau of Applied Economics and Statistics (1995/2006/2015). The maximum expansion of built-up land was found in Durgapur, Raniganj and Asansol urban regions, associated with loss of agricultural and bare land which may have accentuated the observed increases in LST in this region (Figures 2, 3). This is consistent with many other studies (for example Kurucu and Chiristina, 2008; Fang et al., 2016; Zhang et al., 2016b) that demonstrate the expansion of built-up land negatively impacting the overall environment. Interestingly, there is a notable positive trend in NDWI from 1987 to 2017 (Figure 10B).
Conclusion
In the wider context of global environmental change, consideration of the actual and potential future impacts of land-use/cover transformation is necessary. Land is a vital but limited resource and its capacity for restoration following transformation may be constrained. In analyzing diverse aspects of LULC change and its impact on the environment in the Barddhaman district, it is concluded that the western parts (Raniganj, Asansol- Durgapur industrial regions) are highly impacted by inappropriate land use practices; much of the agricultural and plantation land in these regions has been built-up for residential, commercial and industrial development.
While there are some positive indications in terms of environmental conditions in the south-eastern parts of the district, where plantations and water bodes have increased, forest cover has rapidly decreased, most notably in Kanska, Faridpur Durgapur, and Ausgram regions of the district. Built-up land has also increased substantially, effectively doubling between 1987 and 2017. There are clear signs of the deleterious impacts, especially in the increased LST values. The implications are such that the district authorities need to establish mitigation measures and raise awareness of the local people regarding land-use practices. The negative effects of LULC change on the environment manifest at site−specific level but can have implications at regional scales and beyond. Thus, the main role of the district administration and other policy making bodies is to implement evidence-based practices to transform land into a productive and sustainable system that can be effective to the future without adverse effects on environment.
Data Availability Statement
Publicly available datasets were analyzed in this study. This data can be found here: https://earthexplorer.usgs.gov/.
Author Contributions
SR and PK: data collection and software. SR, PK, and RS: conceptualization. SR: methodology, data curation, writing data source, and methodology. SR, PK, and RC: formal analysis and writing introduction. PK and RC: investigation. SR, MM, PK, and RC: resources. SR, PK, and MM: writing results discussion and conclusion. SR and MM: referencing. MM: review and editing. PK, RS, and RC: supervision. All authors have read and agreed to the published version of the manuscript.
Funding
This study was conducted with the support of the Department of Geography, Delhi School of Economics, University of Delhi and School of Geographical Science, East China Normal University. This research was funded by the National Key Research and Development Program of China (2017YFC1503001) and the National Social Science Fund of China (20ZDA085).
Conflict of Interest
The authors declare that the research was conducted in the absence of any commercial or financial relationships that could be construed as a potential conflict of interest.
Acknowledgments
We would like to thank the National Key Research and Development Program of China (2017YFC1503001) and the National Social Science Fund of China (20ZDA085) for providing funding. We would also like to thank United States Geological Survey (USGS) for proving free access data. We would also like to thank the two reviewers for their constructive comments and suggestions which immensely helped us to improve the manuscript.
References
Alexander, C. (2020). Normalised difference spectral indices and urban land cover as indicators of land surface temperature (LST). Int. J. Appl. Earth Observ. Geoinform. 86:102013. doi: 10.1016/j.jag.2019.102013
Aoshima, I., Uchida, K., Ushimaru, A., and Sato, M. (2018). The influence of subjective perceptions on the valuation of green spaces in Japanese urban areas. Urban For. Urban Green. 34, 166–174. doi: 10.1016/j.ufug.2018.06.018
Arbia, G., Griffith, D., and Haining, R. (1998). Error propagation modelling in raster GIS: overlay operations. Int. J. Geograph. Inform. Sci. 12, 145–167. doi: 10.1080/136588198241932
Baeza, S., and Paruelo, J. M. (2020). Land use/land cover change (2000-2014) in the Rio de la Plata grasslands: an analysis based on MODIS NDVI time series. Remote Sens. 12:381. doi: 10.3390/rs12030381
Banerjee, R. (2013). Expansion or over growth of municipal area: a case study of Burdwan Municipality, Burdwan District, West Bengal, India. Int. J. Curr. Res. 5, 59–64.
Barsi, J. A., Lee, K., Kvaran, G., Markham, B. L., and Pedelty, J. A. (2014). The spectral response of the Landsat-8 operational land imager. Remote Sens. 6, 10232–10251. doi: 10.3390/rs61010232
Bharatkar, P. S., and Patel, R. (2013). Approach to accuracy assessment tor RS image classification techniques. Int. J. Sci. Eng. Res. 4, 79–86.
Bonan, G. B. (2008). Forests and climate change: forcing, feedbacks, and the climate benefits of forests. Science 320, 1444–1449. doi: 10.1126/science.1155121
Briassoulis, H. (2009). Factors influencing land-use and land-cover change. UNESCO Encyclopaedia Life Support Syst. 1, 126–146.
Bureau of Applied Economics and Statistics (1995/2006/2015). District Statistical Handbook of Barddhaman District. Kolkata: Government of West Bengal, 104–106.
Cao, Q., Yu, D., Georgescu, M., Han, Z., and Wu, J. (2015). Impacts of land use and land cover change on regional climate: a case study in the agro-pastoral transitional zone of China. Environ. Res. Lett. 10:124025.
Census of India (2011). District Census Hand Book. Office of the Registrar General and Census Commissioner, Ministry of Home Affairs, Government of India. Available online at: https://censusindia.gov.in/2011census/dchb/DCHB.html (accessed June 28, 2017).
Charney, J., Quirk, W. J., Chow, S. H., and Kornfield, J. (1977). A comparative study of the effects of albedo change on drought in semi-arid regions. J. Atmos. Sci. 34, 1366–1385. doi: 10.1175/152004691977034<1366:acsote<2.0.co;2
Chatterjee, S. (2011). Source, dispersal and impacts of airborne pollutants: a case study of mangalpur industrial complex, Raniganj. J. Hum. Ecol. 35, 195–201. doi: 10.1080/09709274.2011.11906407
Chatterjee, S., Dey, M., Prakasam, C., and Biswas, B. (2012). Assessment of land use land cover changes through satellite remote sensing: a case study of Purbasthali I&II blocks, Burdwan district, West Bengal, India. Int. J. Curr. Res. 4, 257–266.
Chattopadhyay, S., Bnaerjee, S., Gupta, S., Saha, R., and Gupta, N. (2017). Spatial and temporal variation of total suspended particulate matter in Burdwan Town, West Bengal, India. Trends Biosci. 10, 1497–1501.
Chen, J. M., and Black, T. A. (1992). Defining leaf area index for non-flat leaves. Plant Cell Environ. 15, 421–429. doi: 10.1111/j.1365-3040.1992.tb00992.x
Cihlar, J. (2000). Land cover mapping of large areas from satellites: status and research priorities. Int. J. Remote Sens. 21, 1093–1114. doi: 10.1080/014311600210092
Cohen, J. (1960). A coefficient of agreement for nominal scales. Educ. Psychol. Meas. 20, 37–46. doi: 10.1177/001316446002000104
Congalton, R. G. (1991). A review of assessing the accuracy of classifications of remotely sensed data. Remote Sens. Environ. 37, 35–46. doi: 10.1016/0034-4257(91)90048-b
Congalton, R. G. (2004). “Putting the map back in map accuracy assessment,” in Remote Sensing and GIS Accuracy Assessment, eds R. S. Lunetta and J. G. Lyon Boca (Boca Raton, FL: CRC Press), 1–11. doi: 10.1201/9780203497586.ch1
Congalton, R. G., and Mead, R. (1986). A review of three discrete multivariate analysis techniques used in assessing the accuracy of remotely sensed data from error matrices. IEEE Trans. Geosci. Remote Sens. 4, 169–174. doi: 10.1109/tgrs.1986.289546
Dey, S., Gupta, S., Sibanda, P., and Chakraborty, A. (2017). Spatio-temporal variation and futuristic emission scenario of ambient nitrogen dioxide over an urban area of eastern india using GIS and coupled AERMOD–WRF model. PLoS One 12:e0170928. doi: 10.1371/journal.pone.0170928
Fang, C., Liu, H., and Li, G. (2016). International progress and evaluation on interactive coupling effects between urbanization and the eco-environment. J. Geograph. Sci. 26, 1081–1116. doi: 10.1007/s11442-016-1317-9
Feddema, J. J., Keith, W. O., Gordon, B. B., Linda, O. M., Lawrence, E. B., Gerald, A. M., et al. (2005). The importance of land-cover change in simulating future climates. Science 310, 1674–1678. doi: 10.1126/science.1118160
Foley, J. A., DeFries, R., Asner, G. P., Barford, C., Bonan, G., Carpenter, S. R., et al. (2005). Global consequences of land use. Science 309, 570–574. doi: 10.1126/science.1111772
Fu, C. (2003). Potential impacts of human-induced land cover change on East Asia monsoon. Glob. Planet. Change 37, 219–229. doi: 10.1016/s0921-8181(02)00207-202
Gao, B. (1996). NDWI- a normalized difference water index for remote sensing of vegetation liquid water from space. Remote Sens. Environ. 58, 257–266. doi: 10.1016/s0034-4257(96)00067-63
Gupta, S., Chattopadhyay, S., Saha, R. N., and Roy, S. (2009). Ambient air quality status of Burdwan town, West Bengal. Poll Res. 28, 643–647.
Gupta, S., and Roy, M. (2012). Land use/land cover classification of an urban area - a case study of Burdwan Municipality, India. Int. J. Geomatics Geosci. 2, 1–13. doi: 10.9734/jgeesi/2018/42185
Hang, H. T., and Rahman, A. (2018). Characterization of thermal environment over heterogeneous surface of National Capital Region (NCR), India using LANDSAT-8 sensor for regional planning studies. Urban Clim. 24, 1–18. doi: 10.1016/j.uclim.2018.01.001
Higher Education Department (1997). District Gazetteer of Burdwan. Kolkata: West Bengal District Gazetteers, Government of West Bengal.
Jensen, J. R. (2015). Introductory Digital Image Processing. A Remote Sensing Perspective, 4 Edn. Englewood Cliffs: Prentice Hall.
Jiménez-Munoz, J. C., Sobrino, J. A., Gillespie, A., Sabol, D., and Gustafson, W. T. (2006). Improved land surface emissivities over agricultural areas using ASTER NDVI. Remote Sens. Environ. 103, 474–487. doi: 10.1016/j.rse.2006.04.012
Koellner, T., and Scholz, R. D. (2008). Assessment of land use impacts on the natural environment. Int. J. Life Cycle Assess. 13, 32–48. doi: 10.1007/s11367-006-0292-292
Kurucu, Y., and Chiristina, N. K. (2008). Monitoring the impacts of urbanization and industrialization on the agricultural land and environment of the Torbali, Izmir region, Turkey. Environ. Monit. Assess. 136, 289–297. doi: 10.1007/s10661-007-9684-9684
Laxmi, G. (2015). Geospatial technology in environmental impact assessments-retrospective. Present Environ. Sustain. Dev. 9, 139–148. doi: 10.1515/pesd-2015-2031
Li, W., Du, Z., Ling, F., Zhou, D., Wang, H., Gui, Y., et al. (2013). A comparison of land surface water mapping using the Normalized Difference Water Index from TM, ETM+ and ALI. Remote Sens. 5, 5530–5549. doi: 10.3390/rs5115530
Loveland, T. R., Reed, B. C., Brown, J. F., Ohlen, D. O., Zhu, Z., Yang, L., et al. (2000). Development of a global land cover characteristics database and IGBP discover from 1 km AVHRR data. Int. J. Remote Sens. 21, 1303–1330. doi: 10.1080/014311600210191
Mahmood, R., Pielke Sr, R. A., Hubbard, K. G., Niyogi, D., Bonan, G., Lawrence, P., et al. (2010). Impacts of land use/land cover change on climate and future research priorities. Bull. Am. Meteorol. Soc. 91, 37–46. doi: 10.1175/2009BAMS2769.1
Mallick, J., and Rahman, A. (2012). Impact of population density on the surface temperature and micro-climate of Delhi. Curr. Sci. 102, 1708–1713.
Maynard, K., and Royer, J. F. (2004). Effects of realistic land cover change on a greenhouse - warmed African climate. Clim. Dyn. 22, 343–358. doi: 10.1007/s00382-003-0371-z
McFeeters, S. K. (1996). The use of the normalized difference water index (NDWI) in the delineation of open water features. Int. J. Remote Sens. 17, 1425–1432. doi: 10.1080/01431169608948714
Mehdi, B., Zarkesh, M. K., Arasteh, P. D., and Hosseini, A. (2016). Assessment of urban heat island based on the relationship between land surface temperature and land use/land cover in Tehran. Sustain. Cities Soc. 23, 94–104. doi: 10.1016/j.scs.2016.03.009
Moghadam, H. S., and Helbich, M. (2013). Spatiotemporal urbanization processes in the megacity of Mumbai, India: a Markov chains-cellular automata urban growth model. Appl. Geogr. 40, 140–149. doi: 10.1016/j.apgeog.2013.01.009
Msme-Development Institute (2016). District Industrial Profile Report. Kolkata: Ministry of MSME, Government of India.
Myhre, G., Shindell, D., Bréon, F. M., Collins, W., Fuglestvedt, J., Huang, J., et al. (2013). Anthropogenic and natural radiativeforcing. Clim. Change 423, 658–740.
NASA (2017). A Long-Term Consistent Multi-Satellite Soil Moisture ESDR With Uncertainty Information. Available online at: https://earthdata.nasa.gov/esds/competitive-programs/measures/long-term-soil-moisture-esdr (accessed March 17, 2018).
Nor, A. N. M., Corstanje, R., Harris, J. A., and Brewer, T. (2017). Impact of rapid urban expansion on green space structure. Ecol. Indic. 81, 274–284. doi: 10.1016/j.ecolind.2017.05.031
Office of the District Magistrate and Collector (2014). Annual administrative report of Burdwan Collectorate 2012-2013. Kolkata: District Magistrate & District Collector, Government of West Bengal.
Oliver, T. H., and Moorcroft, D. M. (2014). Interactions between climate change and land use change on biodiversity: attribution problems, risks, and opportunities. Wiley Interdiscip. Rev. Clim. Change 5, 317–335. doi: 10.1002/wcc.271
Palit, D., Kar, D., Misra, P., and Banerjee, A. (2013). Assessment of air quality using several bio monitors of selected sites of Durgapur, Burdwan district by air pollution tolerance index approach. Indian J. Sci. Res. 4, 149–152.
Rahman, A., Kumar, S., Fazal, S., and Siddiqui, M. A. (2012). Assessment of land use/land cover change in the North-West district of Delhi using remote sensing and GIS techniques. J. Indian Soc. Remote Sens. 40, 689–697. doi: 10.1007/s12524-011-0165-164
Reddy, G. S., and Ruj, B. (2003). Ambient air quality status in Raniganj-Asansol area, India. Environ. Monit. Assess. 89, 153–163. doi: 10.1023/a:1026070506481
Roy, N., Chowdhury, P., Dutta, S., Garain, R., and Das, T. (2015). Air quality analysis by suspended particulate matter in urban and rural areas of burdwan district. JAST Rev. Multidiscip. Res. J. 1, 88–91.
Sikdar, P. K., Chakraborty, S., Adhya, E., and Paul, P. K. (2004). Land use/land cover changes and groundwater potential zoning inand around raniganj coal mining area, bardhaman District, West Bengal –A GIS and remote sensing approach. J. Spatial Hydrol. 4, 1–24.
Song, X., Hansen, M. C., Stehman, S. V., Potapov, P. V., Tyunkvina, A., Vermote, E. F., et al. (2018). Global land change from 1982 to 2016. Nature 560, 639–643. doi: 10.1038/s41586-018-0411-9
Trombulak, S. C., and Frissell, C. A. (2000). Review of ecological effects of roads on terrestrial and aquatic communities. Conserv. Biol. 14, 18–30. doi: 10.1046/j.15231739.2000.99084.x
Vitousek, P. M. (1997). Human domination of earth’s ecosystems. Science 277, 494–499. doi: 10.1126/science.277.5325.494
Zhang, W., Xu, Z., and Guo, W. (2016a). The impacts of land-use and land-cover change on tropospheric temperatures at global and regional scales. Earth Interact. 20, 1–23. doi: 10.1175/ei-d-15-0029.1
Keywords: environmental change, surface albedo, LULC, LST, LAI, NDVI, NDWI
Citation: Rahaman S, Kumar P, Chen R, Meadows ME and Singh RB (2020) Remote Sensing Assessment of the Impact of Land Use and Land Cover Change on the Environment of Barddhaman District, West Bengal, India. Front. Environ. Sci. 8:127. doi: 10.3389/fenvs.2020.00127
Received: 07 May 2020; Accepted: 16 July 2020;
Published: 07 August 2020.
Edited by:
Ioan Cristian Ioja, University of Bucharest, RomaniaReviewed by:
Marcelo Sacardi Biudes, Federal University of Mato Grosso, BrazilSimona R. Gradinaru, University of Bucharest, Romania
Copyright © 2020 Rahaman, Kumar, Chen, Meadows and Singh. This is an open-access article distributed under the terms of the Creative Commons Attribution License (CC BY). The use, distribution or reproduction in other forums is permitted, provided the original author(s) and the copyright owner(s) are credited and that the original publication in this journal is cited, in accordance with accepted academic practice. No use, distribution or reproduction is permitted which does not comply with these terms.
*Correspondence: Pankaj Kumar, cGFua2FqZHNlZHVAZ21haWwuY29t
†ORCID: Saidur Rahaman, orcid.org/0000-0002-1593-272X
 Saidur Rahaman
 Pankaj Kumar
 Ruishan Chen1
