- 1School of Atmospheric Sciences, Nanjing University, Nanjing, China
- 2Key Laboratory of Mesoscale Severe Weather, Ministry of Education, Nanjing University, Nanjing, China
Using Weather Research and Forecasting model (WRF) simulations with different initial soil moisture (ISM) conditions, we investigate the sensitivity to ISM for the three severe heat wave events that dominated eastern China in 2003, 2007, and 2013. The control simulations are able to reproduce the spatial distributions and the daily evolutions for each of the three heat waves but apparently underestimate their amplitudes, intensities, and spatial extensions. The decreased ISM could cause an enhancement on heat waves with increased amplitudes, extents and intensities, while it has insignificant influence on the spatial distributions and temporal variations. The responses of heat waves are generally decreasing with the increasing ISM, controlled by different regimes in the surface soil moisture-temperature relationship. Through enhanced sensible flux as well as reduced latent cooling, the initial soil dryness locally strengthens the surface warming and the further drying of the soil. The three heat waves were all dominated by high-pressure systems in the mid-troposphere. The reduced ISM forces positive anomalies of geopotential height at mid-troposphere and negative anomalies at lower levels, leading to an enhanced thickness of the atmosphere. Such a thickened atmosphere can strengthen the anomalous high-pressure systems, favoring the maintenance of severe heat waves. This acts as a positive feedback between atmospheric circulation, surface warming, and soil dryness.
Introduction
Characterized by a period of consecutive days with abnormally high temperatures, heat waves have been known as one of the typical extreme weather events across the world (Perkins, 2015). The severe 1995 Chicago heat wave, the 2003 European heat wave, and the 2010 Russian heat wave caused disastrous impacts on humans, socio-economic development and the ecological environment (Whitman et al., 1997; Conti et al., 2005; Dole et al., 2011). For example, the severe European heat wave in 2003 killed more than 25,000 people and caused enormous economic losses (García-Herrera et al., 2010; Alexander, 2011). With continuing global warming, such extreme heat wave events are expected to be more frequent and severe in the coming decades (Meehl and Tebaldi, 2004).
Great efforts have been made in understanding the underlying mechanisms of heat waves, which is instrumental for the short-term prediction of heat waves. It is widely accepted that heat waves are generally dominated by persistent high-pressure systems (e.g., Huth, 2000; Black et al., 2004; Tomczyk and Ewa, 2015). Under the control of blocking highs, warm air over mid-high latitudes cannot mix with cold air and warm air builds up, eventually causing the extreme warmth, such as the great heat wave in Russia in 2010 (Matsueda, 2011). Besides the typical blocking highs, anomalous high-pressure systems associated with Rossby wave propagations are also favorable for sustaining a heat wave (Pezza et al., 2012; Wang et al., 2017a). Although anomalous high-pressure systems are a fundamental ingredient for a heat wave to occur, the coupling with the land surface also plays a crucial role (Fischer et al., 2007a,b; Teuling et al., 2010). In general, soil moisture is mostly considered when investigating the impacts of land surface processes (Fischer et al., 2007b; Seneviratne et al., 2010). The impacts of soil moisture on surface air temperature are mostly expected to be induced by its role for evapotranspiration in soil moisture-limited regimes, depicted in the relationship between soil moisture and evaporative fraction (EF), the ratio of latent heat flux to the total available energy (Seneviratne et al., 2010; Berg et al., 2014). In general, characterized by EF, two evapotranspiration regimes exist. A soil moisture-limited regime in which the available surface energy is relatively abundant for evaporation or transpiration while the content of soil moisture is limited (θ < θCRIT, see the conceptual framework of Figure 5 in Seneviratne et al., 2010). In this case, EF increases when the content of soil moisture increases, and an energy-limited regime is one in which the soil moisture is abundant (θ > θCRIT) and EF is independent of the increasing soil moisture. Accordingly, three regimes of the soil moisture-temperature relationship are obtained based on the evapotranspiration regimes: the wet regime, the transitional regime and the dry regime. In the wet regime (θ > θCRIT), EF is independent of soil moisture. In the transitional regime (θWILT ≤ θ ≤ θCRIT), EF reacts effectively to the changes of soil moisture. In this case, the dryness of the soil results in very low EF, with the constrained total energy used by the latent heat flux and more energy available for sensible heating. Thus, the near-surface air temperature would increase (Lorenz et al., 2010; Seneviratne et al., 2010; Alexander, 2011). However, in the dry regime (θ < θWILT), neither evapotranspiration will take place nor will any feedback. On the other hand, in the soil moisture-limited regime, the near-surface warming will amplify decreases in soil moisture, which induces a positive feedback cycle between atmospheric heating and further drying of soil conditions (Fischer et al., 2007b; Alexander, 2011). Moreover, the dry soil also favors the maintenance of upper-air anticyclonic circulations (Fischer et al., 2007b; Zampieri et al., 2009). Dry soil conditions along with persistent high-pressure systems would amplify the soil moisture-temperature feedback and enhance surface warming (Rohini et al., 2016).
The anomalies of soil moisture can last for weeks or even months (Koster and Suarez, 2001; Hu and Feng, 2004). Such long memory of the soil moisture and the resulting climate persistence are important for the prediction of extreme climate events like droughts and heat waves (Kim and Wang, 2007; Lorenz et al., 2010). Various studies investigated the impacts of soil moisture on temperatures through model simulations (e.g., Hirschi, 2011; Zeng et al., 2014; Vogel et al., 2017). It was reported that the model differences induced by initial soil moisture were far more important than those induced by various land surface physical parameterizations and the evolution of soil moisture itself (Trier et al., 2008). The intrinsic impacts of initial soil moisture on extreme temperatures have been revealed in previous studies. Through a northward propagation, drought in late spring from the Mediterranean regions can cause a further increase of high temperatures during summer in continental Europe (Zampieri et al., 2009). By perturbing the spring soil moisture, Fischer et al. (2007b) showed that the loss of soil moisture induced by precipitation deficit in preceding months contributed to the exceptionally high temperature anomalies in the European summer of 2003. Through numerical simulations, Ferranti and Viterbo (2006) demonstrated that the atmospheric response during the 2003 European summer to the initial soil water conditions extended up to 2 months, greatly exceeding the impact of the ocean boundary forcing.
Previous studies mostly concentrated on high temperatures from the whole summer (June, July, and August), whereas heat waves are usually defined as several consecutive days with abnormally high temperatures, dominating a large area, and characterized by different durations, impacted areas and intensities (e.g., Ren et al., 2012; Wang et al., 2017b). The impacts of initial soil moisture on the formation/occurrence and development of heat wave events, specifically on their characteristics including duration, impacted area and intensity, have received limited attention. Therefore, in this study, we focus on three extreme heat wave events in 2003, 2007, and 2013 in Eastern China, which are featured by different durations, spatial extents, and intensities, and all caused serious damage to the social economy (e.g., Tan et al., 2007; Sun X. et al., 2014; Xia et al., 2016). We investigate the impacts of initial soil moisture (hereafter ISM) on the heat wave characteristics through sensitivity experiments using the Weather Research and Forecast (WRF) model. In this study, heat waves are identified based on the definition in Wang et al. (2017b). The detailed information for the three heat waves will be given in section Methods and Data. Section Methods and Data introduces the methodology, data, and experimental design. Section Results documents the results and analyses. The last section presents the summary and conclusions of this research.
Methods and Data
Study Area and the Three Heat Wave Events
Under the control of a subtropical high in summer, eastern China is vulnerable to frequent extreme high temperatures (Ding et al., 2010; Sun Y. et al., 2014; Wang et al., 2017a). Moreover, the heavy populations and the large urban areas in eastern China exacerbate the impacts of heat waves on society and human health (Freychet et al., 2017). More importantly, abundant observational meteorological data are accessible in eastern China. Hence, this study aims to provide an insight into the effects of ISM on temperature responses in eastern China and as well as a broader region.
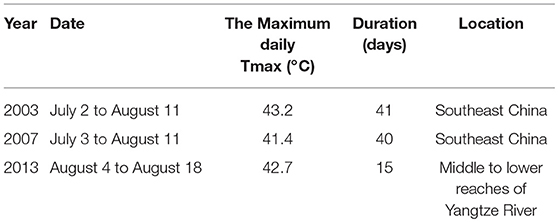
Extreme hot temperatures struck eastern China in the summers of 2003, 2007, and 2013, and caused severe consequences for society. The three high temperature events are identified according to the heat wave definition from Wang et al. (2017b), consisting of an absolute temperature metric of 35°C, a temporal duration of at least 3 days and a demanded spatial extension with more than 20 neighbored stations, any two of which are within a distance of 250 km. The three heat waves began on July 2, July 3, and August 4 and lasted for 41, 40, and 15 days, respectively. The maximum daily surface temperatures during the three heat wave processes were all beyond 40°C. Their detailed information is listed in Table 1.
Model and Experimental Design
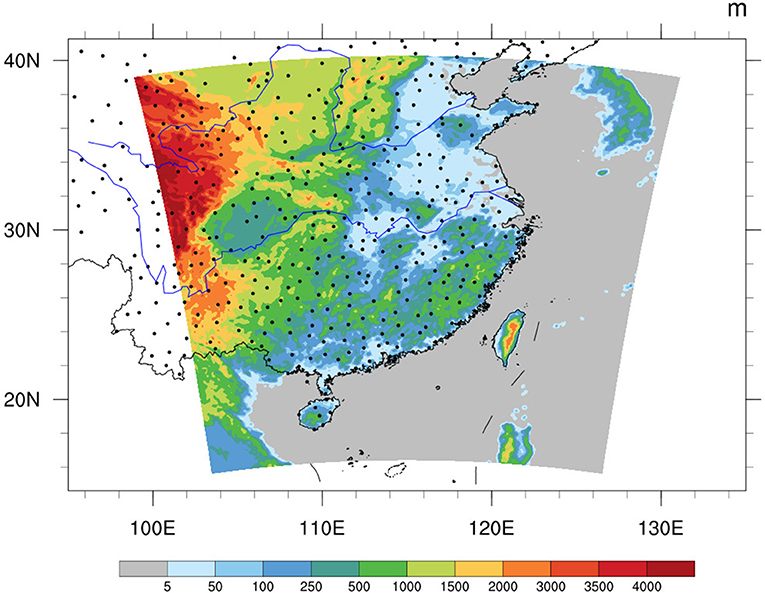
In this study, the WRF model version 3.8 (Skamarock et al., 2008) was utilized for the numerical simulations. The following parameterizations were used: the two-stream correlated-k distribution Rapid Radiative Transfer Model (RRTMG; Iacono et al., 2008) for the radiation schemes, the Yonsei University (YSU) boundary layer parameterization scheme (Hong et al., 2006), the revised Monin–Obukhov surface layer (Jiménez et al., 2012), the cloud microphysics of WRF Single-Moment 5-class scheme (WSM5; Hong et al., 2004), the unified Noah land-surface model (Chen and Dudhia, 2001) and the cumulus parameterization based on the Kain–Fritsch scheme (Kain and Fritsch, 1990). The simulation domain is shown in Figure 1 and includes 300 × 300 grid points with a horizontal resolution of 9 km. The vertical resolution is 34 non-uniform layers with 50 hPa at the top of the atmospheric columns.
Following Vivoni et al. (2009), to vary the initial soil moisture in WRF, we multiplied the initial soil moisture field by a factor (α) ranging from 0.25 to 1.25 (i.e., 0.25, 0.50, 0.75, 1.00, and 1.25; five sensitivity cases, from dry to wet condition). Compared to the control run (CTL, and α = 1), simulations with α < 1 represent dryer conditions while simulations with α > 1 represent wetter conditions. For each of the heat wave events, five sensitivity experiments were conducted with the modified ISM (in total 15 simulations). There are four soil layers (0–5, 5–25, 25–70, and 70–150 cm thickness). The α factor is applied to the total volumetric soil moisture content at each grid point for each soil layer. For the model's spin up, five sensitivity simulations with different ISM conditions were set up about 10 days before the beginning date of each heat wave process (Table 1). Specifically, for the three heat waves, the initial dates were June 21 in 2003, June 23 in 2007, and July 12 in 2013.
The Data
The WRF simulations are driven by the National Centers for Environmental Prediction (NCEP) Final (FNL) Operational Global Analysis data (1° by 1° resolution) at 3 h intervals (00:00, 03:00, 06:00, 09:00, 12:00, 15:00, 18:00, and 21:00 UTC) for the initial and lateral meteorological boundary conditions. The initial soil moisture data are derived from the Global Land Data Assimilation System (GLDAS), which constrains multiple land surface models with ground and satellite observation-based datasets, with the goal of accurate simulation of water and energy cycle states and fluxes (e.g., Syed et al., 2008).
According to Wang et al. (2017b), heat waves are defined based on the maximum of daily surface air temperature (Tmax). The daily observed Tmax from meteorological sites are used to validate the WRF simulations. The dataset is provided by the China Meteorological Administration (CMA). The locations of observational stations are shown in Figure 1 (black dots). For the simulations, we focus on the daily maximum of 2 m surface air temperature (T2m), which usually occurs at ~14:00 or 17:00 Beijing Time (i.e., 06:00 and 09:00 UTC). To investigate the anomalies of upper-level atmospheric circulations during heat waves, a geopotential height of 500 hPa (H500) is used, derived from the new Japanese 55-year Reanalysis (JRA-55) at 1.25° × 1.25° resolution (Ebita et al., 2011).
Results
Model Validation
In this section, we first evaluate the ability of the WRF model to simulate the observed heat wave events, and then investigate the impacts of changing ISM on the characteristics of the three heat waves. Figure 2 shows the spatial distributions of the averaged Tmax during the three heat wave periods in the observation and in the five sensitivity simulations with different ISM conditions. The model temperatures are interpolated into the observation sites using the bilinear interpolation method. Heat waves in 2003 and 2007 dominated southeastern China (Figures 2A,G) and the 2013 heat wave was centered over the middle to lower reaches of Yangtze River, with an averaged Tmax above 35°C (Figure 2M). For each of the three events (Figures 2B-F,H-L,N-R), the spatial patterns of the simulated heat waves do not vary significantly to different ISM conditions, whereas the magnitude of the averaged Tmax and the spatial extension of high temperatures increase gradually with decreasing ISM. In addition, it is noted that for the three observed heat waves, the CTL simulations can reasonably capture their spatial distributions but generally underestimate the amplitudes of averaged Tmax (Figures 2E,K,Q).
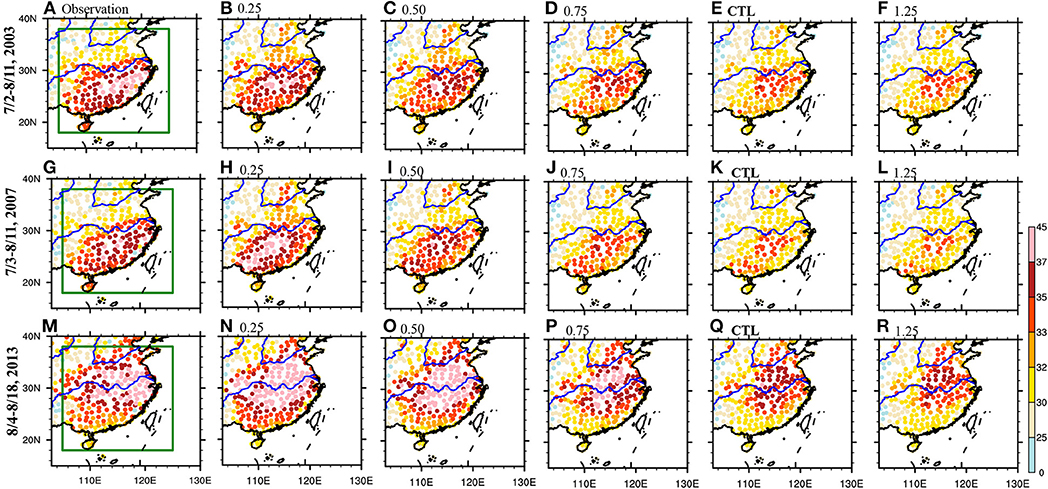
Figure 2. The average daily Tmax (unit: °C) during the three heat waves in the observation (A,G,M), and in five sensitivity simulations initialized with different initial soil moisture (B–F, H–L, N–R). The green box indicates the region (18°–38°N, 105°–123°E).
The spatial correlations, biases in the number of high-temperature stations with averaged Tmax higher than 35°C (simulations minus the observations), and the root mean square errors (RMSEs) between the observed and the simulated averaged Tmax in five sensitivity experiments for the three heat waves are given in Table 2. All the statistical values herein and the following area-averaged results (e.g., in Figure 5) are derived from the bounded region (105°-125°E, 18°-38°N) in Figure 2 (green box), which apparently covers the major regions of the three heat waves. For each of the three heat waves, the spatial correlations between the averaged Tmax in the observation and that in the sensitivity simulations with different ISM conditions are of similar values, which are all above 0.70 and significant at the 95% confidence level. The results indicate that all the five sensitivity simulations are able to reproduce the spatial pattern of the observed heat waves. However, biases are seen in the magnitudes and extensions of heat waves between the observation and the simulations. We can see that all three CTL simulations underestimate the number of high temperatures (average exceeding 35°C); in other words, the extension of high temperatures for the three observed heat waves are underestimated in the CTL simulations. This potentially indicates a certain overestimation of surface soil moisture with the GLDAS data, as Vivoni et al. (2009) suggested that the soil moisture initializations toward the dryer end (α < 1.0) are considered more realistic with respect to field observations. For the three heat waves, the simulated number of high temperatures decreases gradually with increasing ISM. In addition, for the 2003 heat wave, the underestimation of the number of high temperatures is found in all five sensitivity simulations, indicating an overestimation of realistic surface soil moisture existing in all five sensitivity simulations. For the 2007 heat wave, the underestimation of the number of high temperatures is found in the four simulations with α from 1.25 to 0.50, but becomes negligible in the driest simulation (α = 0.25). A similar phenomenon is found for the 2013 heat wave, whereby the underestimation of high temperatures is seen for the simulations with α from 1.25 to 0.75, whereas it becomes negligible in the simulation with α = 0. 50 and turns into overestimation in the simulation with α = 0.25. Such results indicate a transition from overestimation to underestimation of the surface soil moisture. For the spatial distributions of averaged Tmax for the three heat waves in 2003, 2007, and 2013, the most realistic simulation among the five sensitivity experiments with the highest spatial correlation and the lowest RMSE is the simulation of α = 0.25, 0.50, and 0.50, respectively.
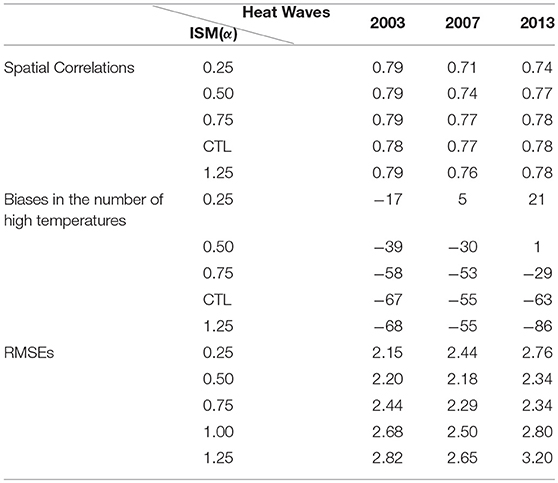
Table 2. The spatial correlations, the biases in the number of stations with averaged Tmax higher than 35°C (simulated results minus the observations) and the RMSEs between the observed and the simulated averaged Tmax in five sensitivity experiments for the three heat waves.
Figure 3 shows the scatterplot and linear trend of the averaged Tmax and the surface soil moisture (0–5 cm) at the observational sites in the bounded region (105°-125°E, 18°-38°N) during the three heat waves. It is obvious that, overall, there is a decreasing trend in the averaged Tmax, with the increasing surface soil moisture for the three heat wave events (negative R-value in Figures 3A–C). In addition, the decreasing trends of the averaged Tmax decline gradually with increasing ISM in the 2003 and 2007 heat waves, implying a transition from the transitional regime to the wet regime in the soil moisture-temperature relationship (Figures 3A,B), whereas the decreasing rates of high temperature in the 2013 heat wave are very significant in all five simulations with different ISM conditions (Figure 3C). Furthermore, the linear trends of the averaged Tmax in the five sensitivity simulations for the 2013 heat wave are approximately twice those for the 2003 and 2007 heat waves. Therefore, it can be inferred that, with increasing ISM, the land surface in the 2003 and 2007 heat waves is more easily able to enter the wet regime than that in the 2013 heat wave. The surface soil moisture in the CTL simulations for the three heat waves is shown in Figure 4. The averaged surface soil moisture from the CTL simulation for the 2013 heat wave (Figure 4C) is apparently lower than that from the CTL simulations of the 2003 and 2007 heat waves over most of eastern China (Figures 4A,B), which strongly supports our above supposition. Therefore, the impacts of soil moisture on high temperatures on the CTL and wet simulations in the 2003 and 2007 heat waves should be obviously weaker compared to those from the 2013 heat wave and will be discussed in detail in the next.
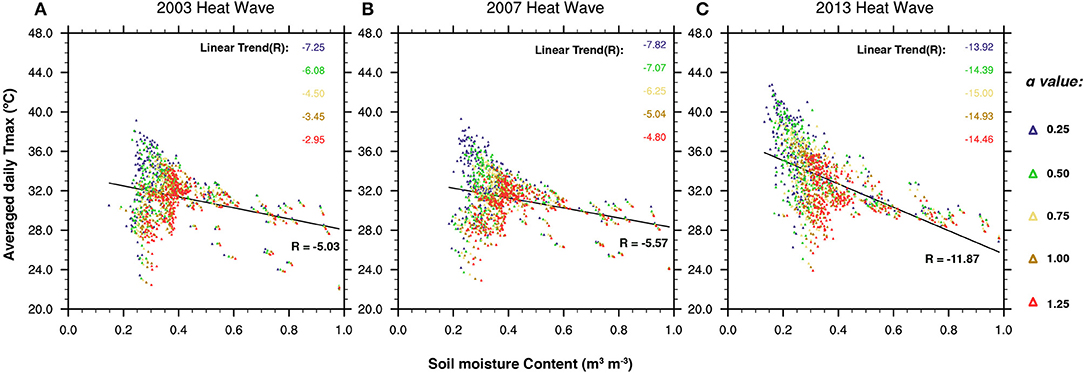
Figure 3. The scatterplot and linear trend between the average daily Tmax and the average daily mean surface soil moisture (0–5 cm) at the observational sites over the region (18°-38°N, 105°-123°E) in the five sensitivity simulations with different ISM. (A–C) Represent the three heat wave events. The R values (unit: °C) in each panel represent the overall linear trend (black font) and the individual linear trend (colored fonts) in each sensitivity simulation, respectively.
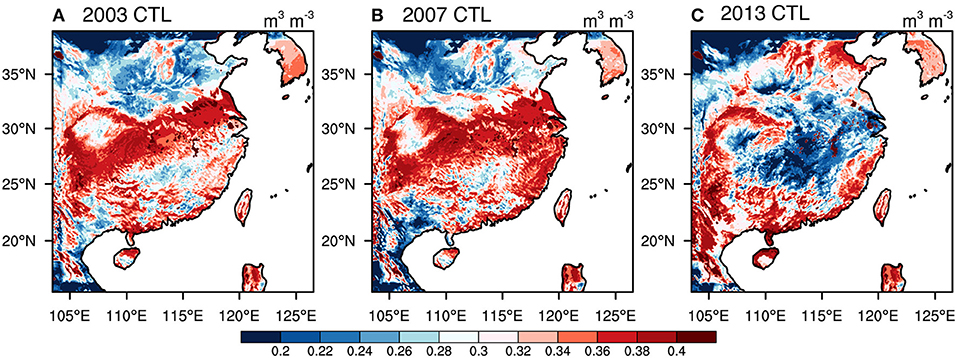
Figure 4. The average surface soil moisture (0–5 cm, unit: m3m−3) at the CTL simulation during the three heat waves (A–C).
To quantitatively characterize the daily variations of heat waves, we define three heat wave indices: heat wave mean temperature (HWMT), heat wave number (HWN) and heat wave accumulated intensity (HWI). For a specific date during a heat wave process, the HWMT means the area-averaged Tmax. The HWN means the number of stations with Tmax higher than 35°C. The HWI means the sum of deviations between Tmax and the 35°C threshold at all stations with Tmax higher than 35°C. The three indices are all calculated over the region (105°-125°E, 18°-38°N). Figure 5 exhibits the daily HWMT, HWN HWN, and HWI in the observation and the five sensitivity simulations with different ISM conditions, respectively. For the daily HWMT in the 2003 heat wave (Figure 5A), the four simulations with α ranging from 0.50 to 1.25 underestimate the daily HWMT throughout the whole heat wave period, consistent with the underestimation of the number of high temperatures in Table 2, while the driest simulation with α = 0.25 overestimates the daily HWMT during a short period of the heat wave. The magnitude of daily HWMT generally decreases during the heat wave period, with an increasing ISM of α ranging gradually from 0.25 to 1.25. On the other hand, all five sensitivity experiments show high capacity to capture the temporal variability of the daily HWMT, with temporal correlations higher than 0.85 (shown in Table 3). The results are similar for the daily HWN and HWMI in the 2003 heat wave (Figures 5B,C). The five sensitivity simulations with different ISM conditions show an ability to characterize the daily evolutions of HWN and HWI, with significant temporal correlations around 0.80 (Table 3). However, the underestimations of HWN and HWI during the heat wave period are also remarkable in the sensitivity experiments, and the underestimations increase gradually along with increasing ISM. The results indicate that the initial soil moisture shows insignificant effects on the temporal variability of heat waves, but pronouncedly affects their amplitudes, spatial extensions and intensities.

Table 3. The temporal correlations between the observed and the simulated daily heat wave indices initialized with different soil moisture (α).
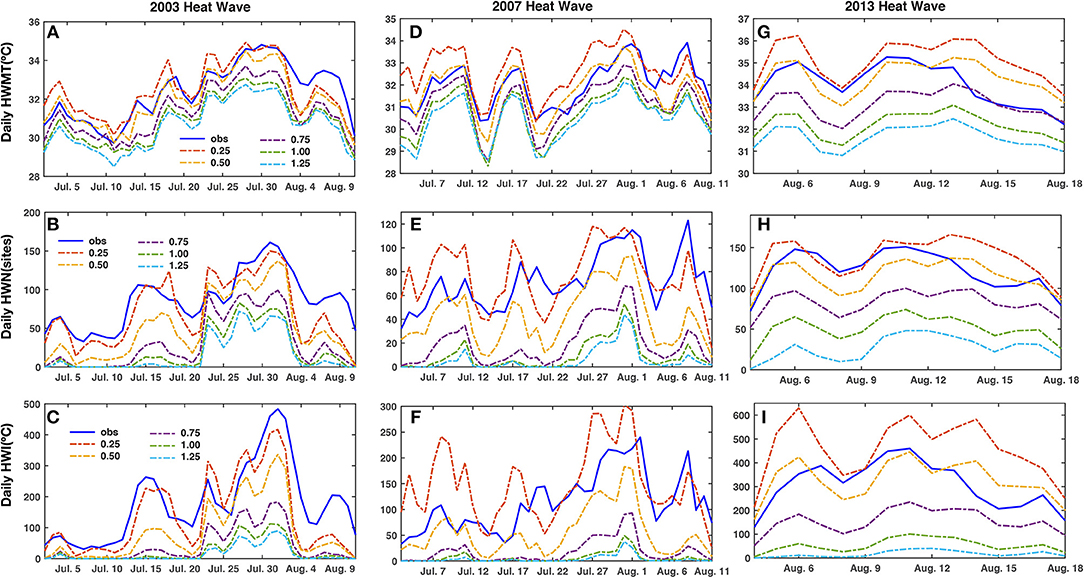
Figure 5. The daily variations of area-averaged HWMT(A,D,G), HWN (B,E,H), and HWI (C,F,I) over the region (18°-38°N, 105°-123°E) in the observation and in the five sensitivity simulations during the three heat waves.
For the 2007 heat wave, the CTL simulation shows an underestimation for the daily HWMT throughout the heat wave period, indicating an overestimation of the surface soil moisture. Moreover, the three other simulations with α = 0.50, 0.75, and 1.25 also demonstrate obvious underestimations of HWMT throughout the whole heat wave period, whereas the driest simulation with α = 0.25 overestimates the daily HWMT during most of the heat wave period. Additionally, the magnitude of daily HWMT in five sensitivity experiments decreases gradually, with α ranging from 0.25 to 1.25. Particularly, all five simulations with different ISM conditions can reasonably simulate the temporal variability of daily HWMT for the 2007 heat wave, with significant correlations above 0.75 (Table 3). Similar results are found for the daily HWN and HWI during the 2007 heat wave (Figures 5E,F). All five sensitivity experiments with different ISM conditions can reasonably characterize the daily variations of HWN and HWI, with significant temporal correlations mainly above 0.6 and 0.4, respectively. Moreover, the CTL run and the simulations of α = 0.50, 0.75 and 1.25 show apparent underestimations of the HWN and HWI. The underestimations are the worst in the CTL and the wet simulation with α = 1.25, which fails to reproduce the existence of high temperatures above 35°C at several dates of the heat wave period. The driest simulation with α = 0.25 overestimates the daily HWN and HWI during most of the heat wave period.
For the 2013 heat wave, the CTL simulation shows obvious underestimations of the HWMT, HWN, and HWI (Figures 5G–I). The wet simulation with α = 1.25 and the dry simulation with α = 0.75 also underestimate the magnitude of HWMT, HWM and HWI, whereas the dry simulation with α = 0.50 shows both underestimations and overestimations for the three heat wave indices during the heat wave period, and the driest simulation with α = 0.25 tends to overestimate these heat wave characteristics during most of the heat wave period. Moreover, the temporal correlations between the simulated and observed daily HWMT, HWN and HWI are mainly above 0.60 in the five sensitivity experiments for the 2013 heat wave, significant at the 95% confidence level.
Sensitivity of Heat Waves to Soil Moisture Initialization
It was shown above that the CTL simulation is able to capture the spatial distributions and daily evolutions for each of the three heat waves but apparently underestimates their amplitudes, intensities and spatial extensions. Different ISM conditions show insignificant effects on the spatial distributions and temporal variations of heat waves, but they pronouncedly affect the magnitudes of high temperatures, spatial extensions and intensities. In this section, we will discuss the response of high temperatures to the different ISM conditions in detail.
Figure 6 illustrates the changes of averaged Tmax during the three heat waves caused by a decrease in the initial soil moisture between the two contiguous simulations, represented by 0.25–0.50 (α), 0.50–0.75 (α), 0.75–1.00 (α), 1.00–1.25 (α). During the three heat wave processes (three rows), prominent increases in Tmax with reduced initial soil moisture are mainly located within the heat wave territories. It is worth mentioning that the increases in Tmax imply an increase in both the amplitude and the extent of a heat wave, as shown in Figure 2. Moreover, for the three heat waves, the magnitudes and spatial extents of the temperature increases induced by reduced ISM are generally higher in 0.25–0.50 (α) and 0.50–0.75 (α) than those in 0.75–1.00 (α) and 1.00–1.25 (α), with the exception of the 2013 heat wave, where the spatial extent of temperature changes in 0.75–1.00 (α) is comparable or slightly larger than that of temperature changes in the 0.25–0.50 (α). The root mean square deviations (RMSDs) for the averaged Tmax differences between two contiguous simulations over the region (18°-38°N, 105°-123°E) are shown in Table 4. Consistent with those depicted in Figure 6, the RMSDs in 0.25–0.50 (α) and 0.50–0.75 (α) are higher than those in 0.75–1.00 (α) and 1.00–1.25 (α) in the 2003 and 2007 heat waves, with the exception that the RMSD in 0.75–1.00 (α) is slightly higher than that in 0.25–0.50 (α) in the 2013 heat wave. As mentioned above, with increasing soil moisture, the soil moisture-temperature relationship during the three heat waves experiences a transition from the transitional regime to the wet regime, in which EF and surface temperature become less sensitive to the change of soil moisture content. Therefore, the changes in the averaged Tmax caused by reduced initial soil moisture generally decrease from dryer to wetter simulations. Additionally, as addressed above, the CTL and wet simulations for the 2003 and 2007 heat waves are more likely to enter the wet regime than those for the 2013 heat wave. Thus, the responses of high temperatures to the ISM conditions decreases in the 0.75–1.00 (α) and 1.00–1.25 (α) in the 2003 and 2007 heat waves are much weaker or negligible (Figures 6C,D,G,H) compared to those in the 2013 heat wave (Figures 6K,L).
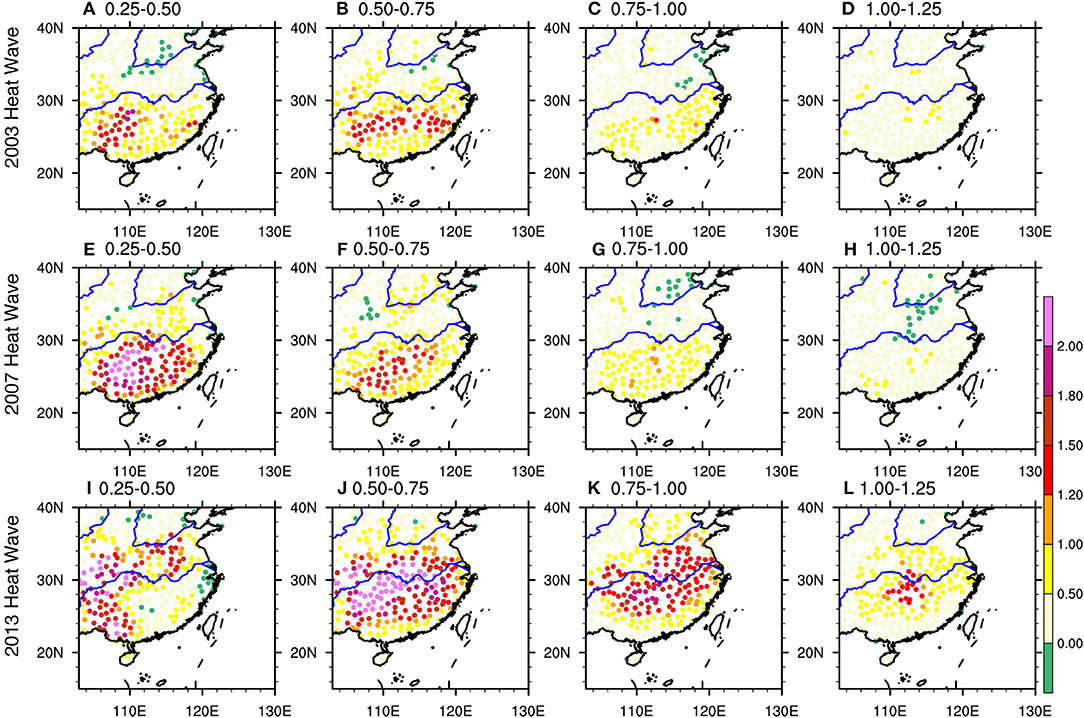
Figure 6. The spatial distributions of changes in average daily Tmax for the three heat waves, with decreased initial soil moisture in two contiguous simulations (A–D for the 2003 heat wave, E–H for the 2007 heat wave and I–L for the 2013 heat wave).

Table 4. The RMSD for the averaged Tmax between two contiguous sensitivity simulations with different ISM (α) over the region (18°-38°N, 105°-123°E).
Figure 7 demonstrates the daily variations of the changes in HWMT, HWN, and HWI caused by ISM decreases between two consecutive simulations. Consistent with the results in Figure 6, for the three heat waves, the daily HWMT, HWN, and HWI changes caused by the ISM reductions are mostly higher in 0.25–0.50 (α) and 0.50–0.75 (α) than those in 0.75–1.00 (α) and 1.00–1.25 (α), with the exception that the changes of HWMT and HWN in 0.75–1.00 (α) are relatively higher than those in 0.25–0.50 (α) at several dates during the 2013 heat wave. In particular, the changes of HWMT, HWN, and HWI in the 2003 and 2007 heat waves (Figures 7A–F), and the changes of HWMT in the 2013 heat wave (Figure 7G) are negligible (close to zero) in the pairs of simulations [1.00–1.25 (α)]. Therefore, for the 2003 and 2007 heat waves, the correlations of all three heat wave indices with the observations are of similar values in the CTL simulation and the wetter simulation, with α = 1.25 (Table 3). The same happens for the HWMT for the 2013 heat waves (Table 3). However, the changes in heat wave indices induced by decreased ISM cannot be ignored in the dryer simulations (Figure 7), which are very likely to influence the temporal variations of heat wave indices. It's noted that compared with the CTL simulations, the correlations of HWMT in the 2003 heat wave and almost all the three heat wave indices from the 2007 and 2013 heat waves become lower in the dryer simulations with the decreasing ISM (Table 3).
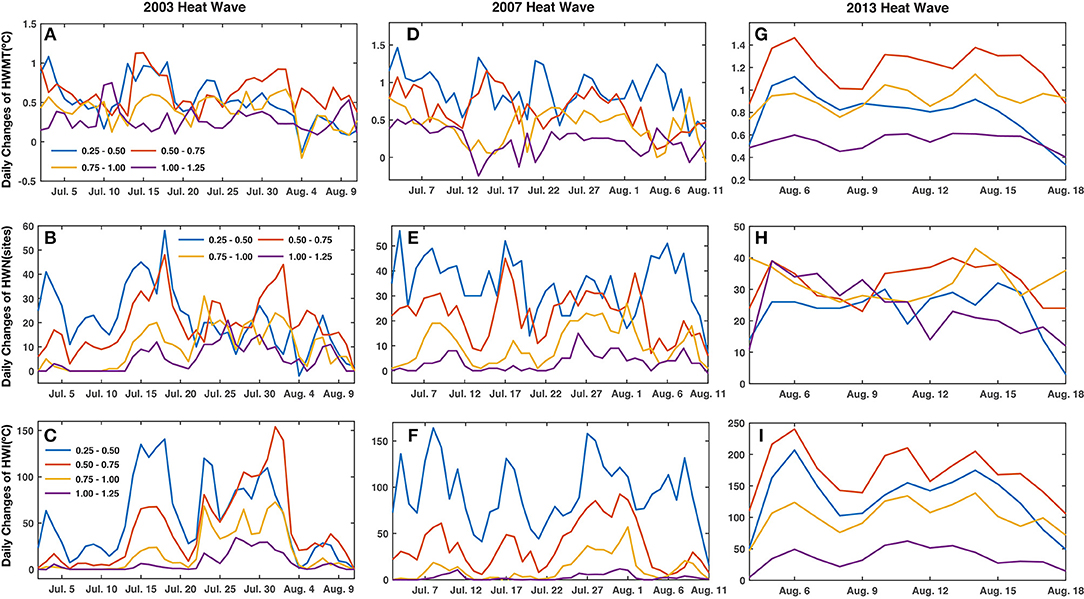
Figure 7. The daily variations of the changes in area-averaged HWMT (A,D,G), HWN (B,E,H) and HWI (C,F,I) over the region (18°-38°N, 105°-123°E) caused by initial soil moisture decreases in two contiguous simulations.
In short, the above results demonstrate that different ISM conditions can significantly influence the amplitudes, spatial extensions, and intensities of heat wave events, whereas they show relatively fewer impacts on their spatial distributions and temporal variations. The response of heat waves to changing ISM is dominated by the different regimes in the soil moisture-temperature relationship, characterized by the varying behaviors of the evaporative fraction (Seneviratne et al., 2010).
It is increasingly argued that the internal variability (IV) of a regional model should be considered in the assessment of a climate change signal (Giorgi and Bi, 2000; Christensen et al., 2001). Here, to ascertain whether the IV has impacts on the high temperature changes induced by different ISM conditions, we designed a set of sensitivity experiments with a perturbation in their initial dates. That is, for each heat wave event, nine simulations with the more realistic surface soil moisture condition (α = 0.5) were conducted with a varying initial date, i.e., a lead time of 8 to 0 days to the CTL simulation. For example, for the 2003 heat wave, with α fixed at 0.5, the nine sensitivity experiments were initialized from 13 to 21 June 2003, respectively. Comparative analyses on the nine simulations enable us to assess the impacts of IV. Taking the heat wave in 2003 for example, Figure S1 exhibits the averaged (a-i) and maximum daily Tmax (j) during the heat wave period (Table 1) in the nine simulations with different initial dates. It was found that IV has insignificant effects on the spatial and temporal variations of high temperatures, as the spatial pattern and daily evolution of maximum Tmax show negligible differences among the nine simulations. Thus, it can be concluded that the results of the impacts of ISM on the three heat waves are robust.
Explanations for the Sensitivity
The above results provide robust evidence for the impacts of initial soil moisture on the three observed heat waves with different durations, extensions and intensities. In the following part, systematical analyses are made to discuss the related mechanisms.
Soil Moisture Changes
Figure 8 shows the spatial patterns for the decreases in averaged daily surface soil moisture (0–5cm) between two contiguous simulations [i.e., 0.25–0.50(α), 0.50–0.75 (α), 0.75–1.00 (α), 1.00–1.25 (α)] during the three heat wave events. We focus on the surface soil moisture (first 5 cm), as it is more strongly correlated to heat fluxes than the total column moisture (Berg et al., 2014). The soil moisture changes in the other soil layers (i.e., at 5–25 cm, 25–70 cm, and 70–150 cm thickness) show similar patterns to the surface layer but with higher magnitudes (Figures S2–S4). For the three heat waves (three rows in Figure 8), the spatial distributions of the decreases in soil moisture coincide with those of the increases in Tmax (Figure 6), consistent with the soil moisture-temperature feedback loop whereby higher temperatures tend to cause more evaporation demand, and thus lead to further drying of the soil (Seneviratne et al., 2010; Alexander, 2011). Additionally, due to the coupling with the upper-level high-pressure system, the positive feedback between surface soil moisture loss, evapotranspiration decrease, and temperature increase can be amplified (Fischer et al., 2007a). Figures 9A–C show the anomalies of averaged H500 during the three heat waves (removing the summer climatology during 1971–2000) with JRA-55 reanalysis. It is clear that in the mid-troposphere, the three heat waves are dominated by positive H500 anomalies, which may strengthen the subtropical high. The anomalous upper-level circulations favor the maintenance of heat wave events and enhance the positive feedback between surface soil moisture loss and temperature increases (Fischer et al., 2007a; Pezza et al., 2012).
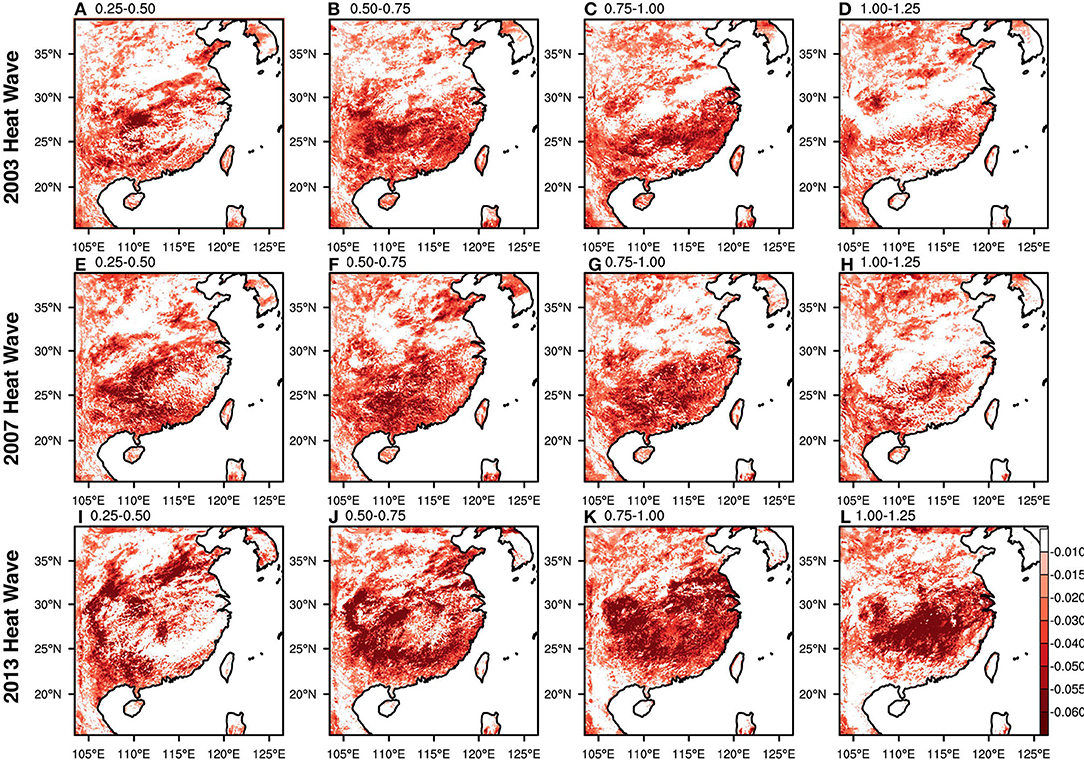
Figure 8. Same as in Figure 6 but for the average daily mean surface soil moisture (0–5cm: unit: m3m−3) during the three heat waves (A–D for the 2003 heat wave, E–H for the 2007 heat wave, and I–L for the 2013 heat wave).
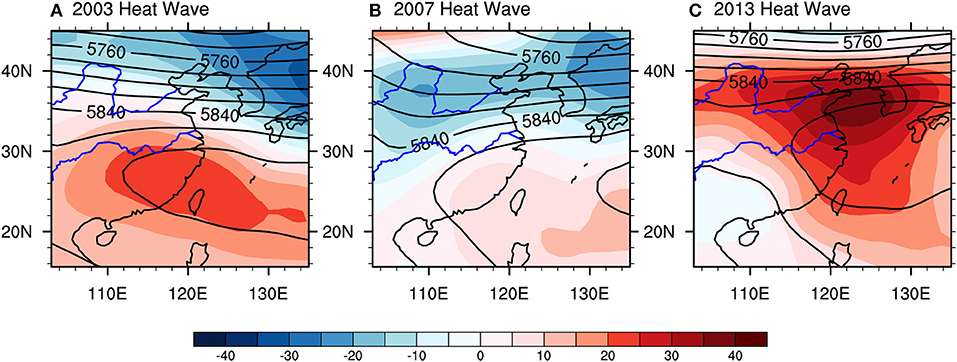
Figure 9. The anomalies (units: m, shading) and the average of H500 (units: m, contour) during the three heat waves (A–C) in JRA-55 reanalysis (removing the summer climatology during 1971–2000).
The corresponding daily variations of the regional averaged surface soil moisture differences between the two contiguous simulations during the three heat waves are shown in Figure 10. It is found that the surface soil moisture differences in the pair of simulations 1.00–1.25 (α) are clearly lower than the other pairs of simulations for the three heat waves, especially for the 2003 and 2007 heat waves (Figures 10A,B). Because of the wetter land surface in the 2003 and 2007 heat waves compared to the 2013 heat wave (Figure 4), the wet experiments for the 2003 and 2007 heat waves are more likely to reach the water-holding capacity. In this case, the soil moisture would be instantaneously removed from the grid box through runoff. Besides, the surface soil moisture differences in the pair of simulations 0.25–0.50 (α) are generally lower than those in the pair of simulations 0.50–0.75 (α) and 0.75–1.00 (α) for the three heat waves, even lower than the 1.25–1.00 (α) in the 2013 heat wave. This is possibly due to the precipitation during the three heat waves, captured in the model (Figure S5). Previous studies have suggested that the sensitivity of runoff with respect to soil moisture decreases with lower soil moisture content (i.e., Seneviratne et al., 2006). Accordingly, the precipitation-induced soil moisture anomalies increase with lower soil moisture content, which weakens the soil moisture differences caused by imposed perturbation in dryer simulations [i.e., 0.25–0.50 (α)]. Such a phenomenon is also seen in Figure 8.
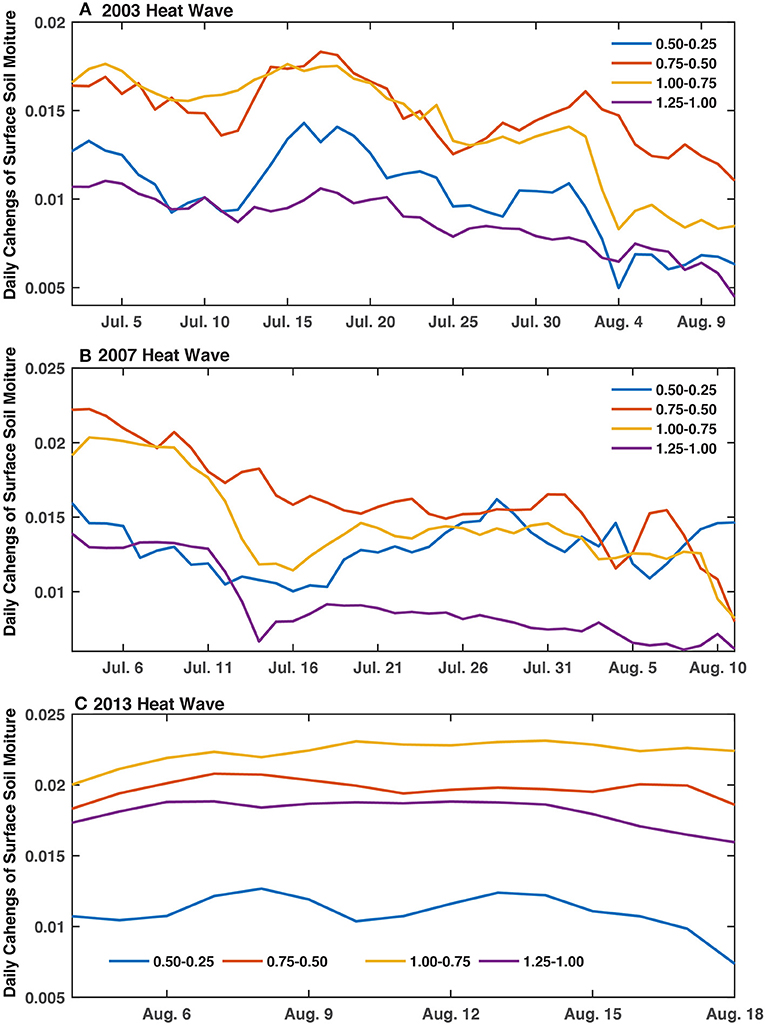
Figure 10. Same as in Figure 7, but for daily mean surface soil moisture (0–5cm, unit: m3m−3). (A–C) Represent the three heat wave events.
Heat Flux Response
Most of the inferred impacts of soil moisture for the climate system are induced by its role for evapotranspiration E (or latent heat flux λE, where λ is the latent heat of vaporization) in soil moisture-limited regimes (e.g., Seneviratne and Stöckli, 2008; Seneviratne et al., 2010). The decreased evaporation with reduced soil moisture would lead to increased air temperature through affecting the land surface energy. According to Seneviratne et al. (2010), the land surface energy balance can be expressed as:
where Rn is the net radiation, λE is the latent heat flux, SH is the sensible heat flux, and G is the ground heat flux at the surface. The net radiation Rn is defined as follows:
where the SWin represents the incoming shortwave radiation, SWout is the outgoing shortwave radiation (equals to SWin *λ, where λ is the albedo), the LWin is the incoming longwave radiation, and LWoutis the outgoing longwave radiation. LWout from the surface is εσT4 − (1 − ε)LWin, sum of the surface emission and reflected down-welling long wave radiation incident on the surface. ε is the emissivity of the land surface. σ and T refer to the Stefan-Boltzmann constant (5.67 × 10⁻⁸Wm−2K−4) and land surface temperature, respectively. Therefore, the land surface energy balance can be rewritten as:
Equation (3) demonstrates that soil moisture plays a key role for the land surface energy balance and thus for the changes of land surface temperature through its impacts on the energy partioning at the surface. Therefore, the relative contribution of each item in the right hand of Equation (3) for the changes of surface air temperature can be obtained through analyzing their response to soil moisture.
Taking the 2013 heat wave as an example, Figure 11 shows the changes of each energy component in Equation (3) caused by decreases in soil moisture between two dry simulations [0.25–0.50(α)]. The LH and G are multiplied by −1 for the convenience of comparison. It is demonstrated that the SWin shows few changes over the heat wave territory but a negative tendency south of the heat wave territory (Figure 11A). The LWin shows positive changes over the heat wave territory (Figure 11B) while its magnitude is much less than the LH changes (Figure 11C). The deficit of LH over heat wave territory can be largely compensated by increased SH (Figure 11D). Compared with the other energy components, the G shows insignificant changes over the research domain when soil moisture decreases (Figure 11E). Therefore, the results show that the impacts of soil moisture on the land surface energy balance are effectuated mainly by affecting the partioning of LH and SH. The soil moisture loss can limit the total energy used by the latent heat flux, and more energy is available for sensible heating. The increased SH enables the warming of the near-surface atmosphere (shown in Figure 6I), accompanied by increased LWout over the heat wave territory (Figure 11F). It should be noted that the results are similar for the heat waves in 2003 and 2007. This suggests that the changes in Tmax (Figure 6) can be reasonably well-explained by the changes in land surface energy balance, induced by initial soil moisture decreases.
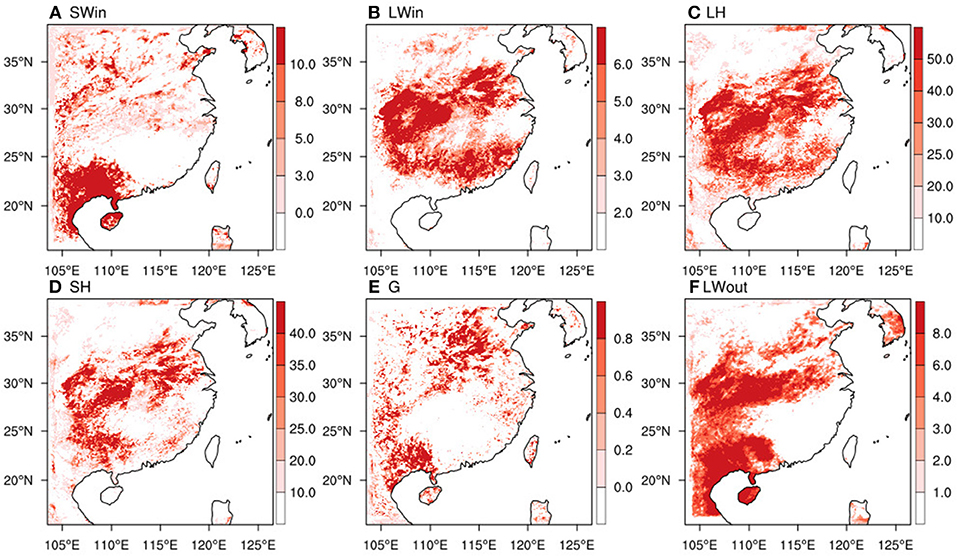
Figure 11. Changes in average SWin (A), LWin (B), LH (C), SH (D), G (E), and LWout (F) during the 2013 heat wave caused by soil moisture reduction [0.25–0.50(α)].
Furthermore, we investigate the temporal variations of regionally averaged LH and SH changes caused by the ISM decreases between two contiguous simulations during the three heat waves (Figure 12). The LH changes are multiplied by −1 for the convenience of comparison. For the three heat waves, the changes in LH and SH are higher in 0.25–0.50 (α) and 0.50–0.75(α), followed by the changes in 0.75–1.00(α), and the changes in 1.00–1.25(α) are the least, indicating the transition from a transitional regime to the wet regime in the land surface. Additionally, the spatial correlations between the changes of daily LH/SH and the changes of daily Tmax induced by reduced ISM are mainly significant and of higher values in the pairs of simulations 0.25–0.50 (α) and 0.50–0.75(α) than those in 0.75–1.00(α) and 1.00–1.25(α) during the three heat waves (not shown). The results indicate that the imposed impacts of ISM on high temperatures through affecting the land surface energy balance are weakened over wetter land surfaces.

Figure 12. Same as in Figure 7, but for the daily mean LH (A,C,E) and SH (B,D,F).
Atmospheric Circulation Response
It has been demonstrated that high-pressure systems dominated eastern China during the three heat waves (Figure 9). Moreover, soil conditions are able to influence the continental-scale atmosphere circulation, leading to the domination of extreme high temperature events (Ferranti and Viterbo, 2006; Fischer et al., 2007b). Here, to broadly represent the response of atmospheric circulation to the initial soil moisture, Figure 13 shows the 925 hPa (H925) and H500 anomalies caused by initial soil moisture reduction between the very dry and wet simulations [0.25–1.25 (α)]. It is shown that the soil moisture affects geopotential height from the surface to the mid-troposphere. With reduced ISM, the H925 is substantially reduced during each of the three heat waves, with varying magnitudes. The shape and location of the anomaly corresponds well to the changes in temperature shown in Figure 4, implying the existence of a surface heat low caused by strong surface heating (Ferranti and Viterbo, 2006; Fischer et al., 2007b). The expanded air induced by surface heating lifts the pressure levels in the middle and upper troposphere (Zeng et al., 2014). As shown in Figures 13A–C, H500 is generally enhanced by reduced initial soil moisture, with positive anomalies above the location of the surface heat low for the three heat waves. In turn, the enhanced thickness of the atmosphere from the surface to upper levels associated with soil dryness may strengthen the anomalous circulation pattern (Figure 9), and favor local warming (Figure 6) and the further drying of the soil, implying a positive feedback mechanism between soil moisture, upper-level circulation and surface temperatures (Fischer et al., 2007a).
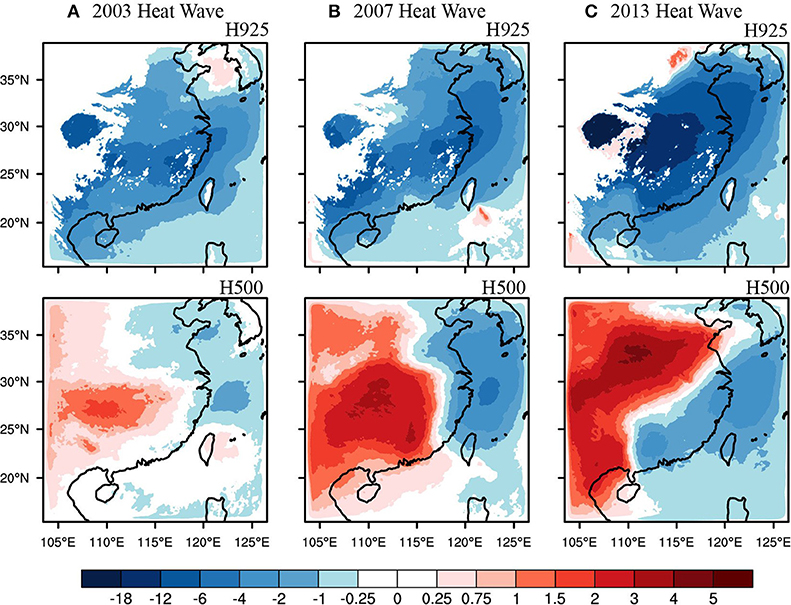
Figure 13. The differences of average daily H500 and H925 (units: m) between the driest and wettest simulations [0.25–1.25 (α)] during the three heat waves (A–C).
Summary and conclusions
In this study, we investigated the impacts of initial soil moisture on the three severe observed heat wave events in 2003, 2007, and 2013 through WRF simulations. The observed heat waves in 2003 and 2007 dominated over southeastern China and the 2013 heat wave was centered over the middle and lower reaches of the Yangtze River. Results show that the CTL simulation is able to reproduce the spatial distributions and the daily evolutions for each of the three heat waves but apparently underestimates their amplitudes, intensities, and spatial extensions. Different ISM contents show insignificant impacts on the spatial distributions and temporal variations of heat waves but pronouncedly affect their magnitudes, spatial extensions, and intensities. Specifically, the average daily Tmax in the three heat waves increases gradually with alongside decreasing ISM. During the heat wave periods, the daily HWMT, HWN, and HWI show apparent increases with the decreased initial soil moisture. In addition, the responses of heat waves are decline gradually with increasing soil moisture, implying a transition from the transitional regime to the wet regime in the soil moisture-temperature relationship. The internal variability in the regional climate model shows insignificant effects on the spatial and temporal variations of high temperatures. Thus, it is concluded that the analyses of the impacts of ISM on the three heat waves are robust.
To explain the sensitivity of the three heat waves to ISM, we investigated the responses of land surface energy and atmospheric circulations to the different ISM contents. Results show that the surface energy balance, especially the partitioning of LH and SH flux, is changed by different ISM contents. With decreased ISM, LH is reduced, and the decrease of energy is compensated by the increased SH, which leads to near-surface warming and further dryness of land. However, such impacts are weakened over the wetter land surface.
The three heat waves were all dominated by anomalous high-pressure systems. The decreased soil moisture may enhance a positive anomaly of geopotential height at the upper levels and thus make the anomalous pattern more persistent. However, a negative anomaly is usually forced over the lower levels due to the strong surface heating. Thus, the thickness of the associated atmosphere is increased from the surface to upper levels. Such a thickened atmosphere associated with soil moisture dryness will further strengthen the local warming and drying.
Author Contributions
JT provided the conceptualization. PW did the main computation and analyses. QZ and YY helped in polishing the manuscript.
Funding
This work is jointly funded by the National Key Research and Development Program of China (2018YFA0606003, 2016YFA0600303) and the National Natural Science Foundation of China (41375075, 91425304 and 41575099). This work is also supported by the Chinese Jiangsu Collaborative Innovation Center for Climate Change. The observational data of meteorological stations are provided by the China Meteorological Administration (CMA).
Conflict of Interest Statement
The authors declare that the research was conducted in the absence of any commercial or financial relationships that could be construed as a potential conflict of interest.
Acknowledgments
The authors also acknowledge with thanks the organizations of NCEP and GLDAS for providing the driving fields in the simulations.
Supplementary Material
The Supplementary Material for this article can be found online at: https://www.frontiersin.org/articles/10.3389/fenvs.2019.00018/full#supplementary-material
References
Alexander, L. (2011). Climate science: extreme heat rooted in dry soils. Nat. Geosci. 4, 12–13. doi: 10.1038/ngeo1045
Berg, A., Lintner, B. R., Findell, K. L., Malyshev, S., Loikith, P. C., and Gentine, P. (2014). Impact of soil moisture–atmosphere interactions on surface temperature distribution. J. Clim. 27, 7976–7993. doi: 10.1175/JCLI-D-13-00591.1
Black, E., Blackburn, M., Harrison, G., and Hoskins, B, and, Methven, J. (2004). Factors contributing to the summer 2003 European heatwave Weather 59, 217–223. doi: 10.1256/wea.74.04
Chen, F., and Dudhia, J. (2001). Coupling an advanced land surface-hydrol- ogy model with the Penn State-NCAR MM5 modeling system part I: model implementation and sensitivity. Mon. Wea. Rev. 129, 569–585. doi: 10.1175/1520-0493(2001)129 < 0569:CAALSH>2.0.CO;2
Christensen, O., Gaertner, M. A., Prego, J. A., and Polcher, J. Internal variability of regional climate models. Climate Dyn. (2001). 17, 875–887. doi: 10.1007/s003820100154
Conti, S., Meli, P., Minelli, G., Solimini, R., Toccaceli, V., Vichi, M., et al. (2005). Epidemiologic study of mortality during the Summer 2003 heat wave in Italy. Environ. Res. 98, 390–399. doi: 10.1016/j.envres.2004.10.009
Ding, T., Qian, W., and Yan, Z. (2010). Changes in hot days and heat waves in China during 1961–2007. Int. J. Climatol. 30, 1452–1462. doi: 10.1002/joc.1989
Dole, R., Hoerling, M., Perlwitz, J., Eischeid, J., Pegion, P., Zhang, T., et al. (2011). Was there a basis for anticipating the 2010 Russian heat wave? Geophy. Res. Lett. 38:L06702. doi: 10.1029/2010GL046582
Ebita, A., Kobayashi, S., Ota, Y., Moriya, M., Kumabe, R., Onogi, K., et al. (2011). The Japanese 55-year reanalysis “JRA-55”: an interim report. Sola 7, 149–152. doi: 10.2151/sola.2011-038
Ferranti, L., and Viterbo, P. (2006). The European summer of 2003: sensitivity to soil water initial conditions. J. Clim. 19, 3659–3680. doi: 10.1175/JCLI3810.1
Fischer, E. M., Seneviratne, S., Vidale, P., Lüthi, D., and Schär, C. (2007b). Soil moisture-atmosphere interactions during the 2003 European summer heat wave. J. Clim. 20, 5081–5099. doi: 10.1175/JCLI4288.1
Fischer, E. M., Seneviratne, S. I., Lüthi, D., and Schär, C. (2007a). Contribution of land-atmosphere coupling to recent European summer heat waves. Geophy. Res. Lett. 34, 125–141. doi: 10.1029/2006GL029068
Freychet, N., Tett, S., Wang, J., and Hegerl, G. (2017). Summer heat waves over Eastern China: dynamical processes and trend attribution. Environ. Res. Lett. 12:024015. doi: 10.1088/1748-9326/aa5ba3
García-Herrera, R., Díaz, J. R. M., Luterbacher, T. J., and Fischer, E.M. (2010). A review of the European summer heatwave of 2003. Crit. Rev. Environ. Sci. Technol. 40, 267–306. doi: 10.1080/10643380802238137
Giorgi, F., and Bi, X. (2000). A study of internal variability of a regional climate model. J. Geophys. Res. 105, 29503–29521. doi: 10.1029/2000JD900269
Hirschi, M. (2011). Observational evidence for soil-moisture impact on hot extremes in southeastern Europe. Nat. Geosci. 4, 17–21. doi: 10.1038/ngeo1032
Hong, S.Y., Dudhia, J., and Chen, S. H. (2004). A revised approach to ice microphysical pro- cesses for the bulk parameterization of clouds and precipitation. Monthly Weather Rev. 132, 103–120. doi: 10.1175/1520-0493(2004)132 < 0103:ARATIM>2.0.CO;2
Hong, S.Y., Noh, Y., and Dudhia, J. (2006). A new vertical diffusion pack- age with an explicit treatment of entrainment processes. Monthly Weather Rev. 134, 2318–2341. doi: 10.1175/MWR3199.1
Hu, Q., and Feng, S. (2004). A role of the soil enthalpy in land memory. J. Clim. 17, 3633–3643. doi: 10.1175/1520-0442(2004)017 < 3633:AROTSE>2.0.CO;2
Huth, R. (2000). A GCM simulation of heat waves, dry spells, and their relationships to circulation. Clim. Change 46, 29–60. doi: 10.1023/A:1005633925903
Iacono, M. J., Delamere, J. S., Mlawer, E. J., Shephard, M. W., Clough, S. A., and Collins, W. D. (2008). Radiative forcing by long-lived greenhouse gases: calculations with the AER radiative transfer models. J. Geophys. Res. 113:D13103. doi: 10.1029/2008jd009944
Jiménez, P. A., Dudhia, J., González-Rouco, J. F., Navarro, J., Montávez, J. P., and García-Bustamante, E. (2012). A revised scheme for the WRF surface layer formulation. Monthly Weather Rev. 140, 898–918. doi: 10.1175/MWR-D-11-00056.1
Kain, J.S., and Fritsch, J. M. (1990). A one-dimensional entraining/detraining plume model and its application in convective parameterization. J. Atmos. Sci. 47, 2784–2802
Kim, Y., and Wang, G. (2007). Impact of initial soil moisture anomalies on subsequent precipitation over North America in the coupled land atmosphere model CAM3 CLM3. J. Hydrometeorol. 8, 513–33. doi: 10.1175/JHM611.1
Koster, R.D., and Suarez, M. J. (2001). Soil moisture memory in climate models. J. Hydrometeor. 2, 558–570. doi: 10.1175/1525-7541(2001)002 < 0558:SMMICM>2.0.CO;2
Lorenz, R., Jaeger, E. B., and Seneviratne, S. I. (2010). Persistence of heat waves and its link to soil moisture memory. Geophys. Res. Lett. 37, 384–397. doi: 10.1029/2010GL042764
Matsueda, M. (2011). Predictability of euro-russian blocking in summer of 2010. Geophys. Res. Lett. 38:L06801. doi: 10.1029/2010GL046557
Meehl, G. A., and Tebaldi, C. (2004). More intense, more frequent, and longer lasting heat waves in the 21st century. Science 305, 994–997. doi: 10.1126/science.1098704
Perkins, S.E. (2015). A review on the scientific understanding of heatwaves—their measurement, driving mechanisms, and changes at the global scale. Atmos. Res. 164, 242–267. doi: 10.1016/j.atmosres.2015.05.014
Pezza, A.B., Rensch, P. V., and Cai, W. (2012). Severe heat waves in Southern Australia: synoptic climatology and large scale connections. Clim. Dyn. 38, 209–224. doi: 10.1007/s00382-011-1016-2
Ren, F., Cui, D., Gong, Z., Wang, Y., Zou, X., Li, Y., et al. (2012). An objective identification technique for regional extreme events. J. Clim. 25, 7015–7027. doi: 10.1175/JCLI-D-11-00489.1
Rohini, P., Rajeevan, M., and Srivastava, A. K. (2016). On the variability and increasing trends of heat waves over India. Sci. Rep. 6:26153. doi: 10.1038/srep26153
Seneviratne, S.I., Corti, T., Davin, E. L., Hirschi, M., Jaeger, E. B., Lehner, I., et al. (2010). Investigating soil moisture–climate interactions in a changing climate: a review. Earth Sci. Rev. 99, 125–161. doi: 10.1016/j.earscirev.2010.02.004
Seneviratne, S.I., Koster, R.D., Guo, Z., Dirmeyer, P.A., Kowalczyk, E., Lawrence, D., et al. (2006). Soil moisture memory in AGCM simulations: analysis of global land–atmosphere coupling experiment (GLACE) data. J. Hydrometeorol. 7, 1090–1112. doi: 10.1175/JHM533.1
Seneviratne, S.I., and Stöckli, R. (2008). “The role of land-atmosphere interactions for climate variability in Europe,” in Climate Variability and Extremes during the Past 100 years, eds S. Bronnimann, J. Luterbacher, T. Ewen, H. F. Diaz, R. S. Stolarski, and U. Neu (Dordrecht: Springer), 179–193.
Skamarock, W. C., Klemp, J. B., Dudhia, J., Gill, D.O., Barker, D. M., Duda, M. G., et al. (2008). A Description of the Advanced Research WRF Version 3. NCAR Technical Notes, NCAR/TN-4751STR
Sun, X., Sun, Q., Zhou, X., Li, X., Yang, M., Yu, A., et al. (2014). Heat wave impact on mortality in Pudong New Area, China in 2013. Sci. Total Environ. 493, 789–794. doi: 10.1016/j.scitotenv.2014.06.042
Sun, Y., Zhang, X., Zwiers, F. W., Song, L., Wan, H., Hu, T., et al. (2014). Rapid increase in the risk of extreme summer heat in Eastern China. Nat. Clim. Change 4, 1082–1085. doi: 10.1038/nclimate2410
Syed, T. H., Famiglietti, J. S., Rodell, M., Chen, J., and Wilson, C. R. (2008). Analysis of terrestrial water storage changes from GRACE and GLDAS. Water Resourc. Res, 44, W02433:doi: 10.1029/2006WR005779
Tan, J., Zheng, Y., Song, G., Kalkstein, L.S., Kalkstein, A.J., and Tang, X. (2007). Heat wave impacts on mortality in Shanghai, 1998 and 2003. Int. J. Biometeorol. 51, 193–200. doi: 10.1007/s00484-006-0058-3
Teuling, A.J., Seneviratne, S.I., Stöckli, R., Reichstein, M., Moors, E., and Ciais, P. (2010). Contrasting response of European forest and grassland energy exchange to heatwaves. Nat. Geosci. 3, 722–727. doi: 10.1038/ngeo950
Tomczyk, A. M., and Ewa, B. (2015). Heat waves in Central Europe and their circulation conditions. Int. J. Climatol. 36, 770–782. doi: 10.1002/joc.4381
Trier, S. B., Chen, F., Manning, K. W., Lemone, M. A., and Davis, C. A. (2008). Sensitivity of the PBL and precipitation in 12-day simulations of warm-season convection using different land surface models and soil wetness conditions. Monthly Weather Rev. 136, 2321–2343. doi: 10.1175/2007MWR2289.1
Vivoni, E.R., Tai, K.W., and Gochis, D.J. (2009). Effects of initial soil moisture on rainfall generation and subsequent hydrologic response during the North American monsoon. J. Hydrometeorol. 10, 644–664. doi: 10.1175/2008JHM1069.1
Vogel, M. M., Orth, R., Cheruy, F., Hagemann, S., Lorenz, R., van den Hurk, B. J. J. M., et al. (2017). Regional amplification of projected changes in extreme temperatures strongly controlled by soil moisture-temperature feedbacks. Geophys. Res. Lett. 44, 1511–1519. doi: 10.1002/2016GL071235
Wang, P., Tang, J., Sun, X., Wang, S., Wu, J., Dong, X., et al. (2017a). Heatwaves in China: definitions, leading patterns and connections to large-scale atmospheric circulation and SSTs. J. Geophys. Res. Atmos. 122, 10679–10699 doi: 10.1002/2017JD027180
Wang, P., Tang, J., Wang, S., Dong, X., and Fang, J. (2017b). Regional heatwaves in china: a cluster analysis. Clim. Dyn. 1–17. doi: 10.1007/s00382-017-3728-4
Whitman, S., Good, G., Donoghue, E. R., Benbow, N., Shou, W., and Mou, S. (1997). Mortality in Chicago attributed to the July 1995 heat wave. Am. J. Publ. Health 87, 1515–1518. doi: 10.2105/AJPH.87.9.1515
Xia, J., Tu, K., Yan, Z., and Qi, Y. (2016). The super-heat wave in eastern China during July–August 2013: a perspective of climate change. Int. J. Climatol. 36, 1291–1298. doi: 10.1002/joc.4424
Zampieri, M., D'Andrea, F., Vautard, R., Ciais, P., Nobletducoudré, N. D., and Yiou, P. (2009). Hot European summers and the role of soil moisture in the propagation of Mediterranean drought. J. Clim. 22, 4747–4758. doi: 10.1175/2009JCLI2568.1
Keywords: initial soil moisture, heat waves, WRF, soil moisture-temperature relationship, land-atmosphere interaction
Citation: Wang P, Zhang Q, Yang Y and Tang J (2019) The Sensitivity to Initial Soil Moisture for Three Severe Cases of Heat Waves Over Eastern China. Front. Environ. Sci. 7:18. doi: 10.3389/fenvs.2019.00018
Received: 14 September 2018; Accepted: 30 January 2019;
Published: 19 February 2019.
Edited by:
Hans Von Storch, Helmholtz Centre for Materials and Coastal Research (HZG), GermanyReviewed by:
Juan Pedro Montávez, University of Murcia, SpainStefan Hagemann, Helmholtz Centre for Materials and Coastal Research (HZG), Germany
Copyright © 2019 Wang, Zhang, Yang and Tang. This is an open-access article distributed under the terms of the Creative Commons Attribution License (CC BY). The use, distribution or reproduction in other forums is permitted, provided the original author(s) and the copyright owner(s) are credited and that the original publication in this journal is cited, in accordance with accepted academic practice. No use, distribution or reproduction is permitted which does not comply with these terms.
*Correspondence: Jianping Tang, anB0YW5nQG5qdS5lZHUuY24=
 Pinya Wang
 Qi Zhang
 Yi Yang1,2
 Jianping Tang