- 1Institute for Plant Nutrition and Soil Science, Christian-Albrechts-Universität zu Kiel, Kiel, Germany
- 2Institute of Soil Landscape Research, Leibniz Centre for Agricultural Landscape Research, Müncheberg, Germany
Macroscopic biopores, like earthworm burrows or channels which remain after a root decayed, act as preferential flow paths for water, gas, and heat transport processes, and viewing at agricultural production, as preferential elongation paths for plant roots. These processes result in intense alterations of the soil volume and its composition that surrounds the pores. The effects of these processes were analyzed at small-scale and physico-chemical soil parameters, i.e., relative oxygen diffusion coefficient (Ds/DO), oxygen partial pressure pO2, Eh and pH of biopore walls, were measured. The analyses were carried out on undisturbed soil samples with different colonization history, excavated from a haplic Luvisol derived from loess. Soil resistance to penetration was determined simultaneously with Ds/DO and pO2 using a coupled, self-developed approach, and four matric potentials (namely, Ψm = −1 kPa; −3 kPa; −6 kPa or −30 kPa) were considered. We hypothesized that physico-chemical soil parameters in biopore walls were altered due to differing influences on the soil aggregation. Aggregation was visualized with scanning electron microscopy, classified and used to explain differences in–soil properties. Plant roots and earthworms altered aggregation next to biopore surfaces in a contrasted way, either by enhancing aggregates diversity or homogenizing it. Roots led to the formation of subpolyeders while earthworms formed subplates. Pore functions of microaggregates were comparable to those of larger scale, and subpolyeders showed much more favorable soil properties in terms of soil aeration (Ds/Do, pO2). Replicates of all parameters scattered intensely and showed deviations up to several orders of magnitude in case of Ds/DO underlining the large variability of soil properties in biopore walls.
Introduction
Preferential elongation paths for plant roots (Passioura, 2002; McKenzie et al., 2009) and preferential flow paths like earthworm burrows and root channels (Jarvis, 2007) are hot spots of soil microorganisms (Hoang et al., 2016; Banfield et al., 2017), for nutrient turnover (Hoang et al., 2016) and exchange processes within the plant-soil-atmosphere-continuum. The surrounding soil volumes of these biopores differ not only in a linguistic way from the soil matric but biologically, chemically, and physically alterations are known. The drilosphere is a 1–2 mm thick layer (Bouché, 1975; reviewed by Brown et al., 2000) that surrounds earthworm burrows. The formation of soil linings, which are rich in organic carbon (Don et al., 2008; Banfield et al., 2017) and dark in color, caused by deposed earthworm casts make the alteration of this soil volume visible to the naked eye. Biologically, chemically, and physically alterations in the aggregation of the soil become even more obvious when visualized with the help of scanning electron microscopy (SEM). SEM micrographs give general information about textural and mineralogical properties, particle shape and surface roughness and can be used as a supplemental, visualizing method to interpret and understand microstructural changes (Baumgarten et al., 2013). Biologically alterations show in elevated populations of e.g., nitrifying bacteria (Parkin and Berry, 1999) and result in enhanced nitrogen turnover rates. Since decades, research focuses on the rhizosphere that is the region of soil in the vicinity of plant roots in which the chemistry and microbiology is influenced by their growth, respiration, and nutrient exchange. Most plants live together with other microorganisms (e.g., in symbiosis) leading to elevated numbers of many microorganisms groups while there are specialized microorganisms causing the decay of the root. The soil microbial community is not the only soil property that is heavily altered next to living (Rhizosphere) or decaying roots (Detritusphere) in soils, because these biological alterations go along with chemical and physical alterations (schematized in Figure 1). For example, decreased oxygen partial pressures (pO2) caused by the consumption of oxygen (O2) by aerobic soil microorganisms coincides with the release of carbon dioxide (CO2). This results in a decrease in pH because of the reaction of CO2 with water to carbonic acid (H2CO3). Beside these biologically and chemically alterations, roots and earthworms release and incorporate organic matter into the soil volume that surrounds the cavities. Thereby they alter e.g., the chemical composition in terms of the ratio of hydrophobic and hydrophilic functional groups (C–H/C=O ratio), even after the root decayed completely (Haas et al., 2018) or the replenishment of earthworm casts stopped. The alteration of the C–H/C = O ratio goes along with changes in contact angles (Fér et al., 2016; Haas et al., 2018), resulting in altered in water contents (Figure 1). The latter one has a large impact on e.g., the oxygen diffusion coefficient of soils due to the 10,000 times higher diffusion coefficient of oxygen in air, compared to that one in water (Glinski and Stepniewski, 1985), resulting in a complex system of chemical, physical, and biological interactions (Figure 1). The dynamic of the system “soil” becomes obvious by considering direct physical alterations of the drilosphere and the rhizosphere/detritusphere, which can have biological, chemical or physical causes. Earthworms move via peristalsis, which is a radially symmetrical contraction and relaxation of muscles propagating in a waveform along the body of the earthworm. In consequence of the muscles contraction the hydrostatic skeleton expands radially, thereby anchoring to the wall of the burrow, leading to mechanical stress application on the pore wall of the earthworm burrow. Plant roots apply even higher radial stresses [in between 2.4 MPa (Bengough and Mullins, 1990) and 0.06–0.195 MPa (Keudel and Schrader, 1999)]. Two kinds of physical processes need to be distinguished. (I) Shearing occurs when mechanical stresses are applied in non-rectangular direction to the surface of stress application. Shearing occurs with both, the moving action of an earthworm through its cavity or with the formation of a root channel by a growing root. Aggregates disrupt with exceeding the shear resistance leading to the formation of smaller aggregates and shear cracks which are low in tortuosity and high in connectivity, leading to an increased soil volume well-connected to the biopore. (II) If the stress application is rectangular to the surface of e.g., the biopore wall, no shear forces occur. Here, two kinds of deformation processes can occur in soils, namely, elastic deformation (the internal soil rigidity is not exceeded, the deformation is reversible), and plastic deformation. The latter one is characterized by exceeding the internal soil rigidity which coincides with aggregate failure, and an irreversible loss of pore volumes and functions. Consequently, a decreased hydraulic and air conductivity or a decreased biological activity is known due to the loss of pore volumes (for more details see Horn and Fleige, 2003 or Haas et al., 2016).
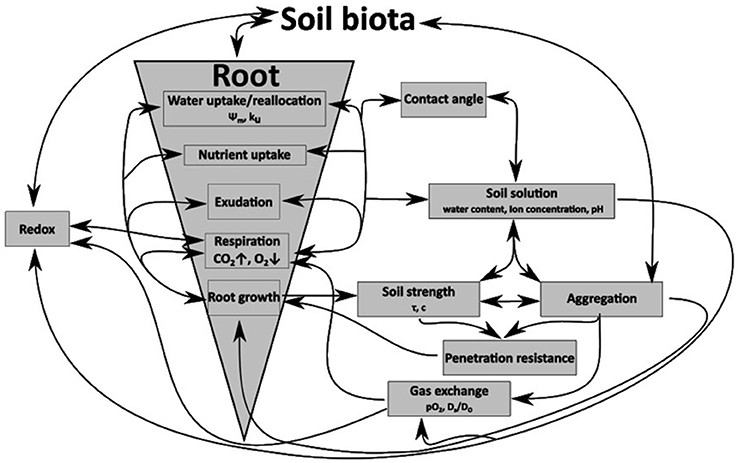
Figure 1. Schematic diagram of the interactions between roots, growth processes, and interactions with the mineral soil phase and their influence of physico-chemical soil properties.
Plastic soil deformation is needed to permanently expand the cavity of the earthworm, or to form the root channel even if it coincides with the blockage of lateral side pores (Pagenkemper et al., 2013). Plastic deformation can be expected to be more intense in the drilosphere, compared with the rhizosphere, caused by the much faster movement of earthworms (Ruiz et al., 2015). Repeated mechanical stress application in vertical biopores can result in the formation of vertically orientated platy structures with relatively well-connected pores. Platy structures are formed when initial plastic deformation is followed by finally elastic deformation.
However, soil compaction also leads to a shift in pore-space distribution (Becher, 1994; Riggert et al., 2017) whereby positive water pressures can be observed (Fazekas and Horn, 2005). Positive water pressures combined with shearing forces which occur due to the cone-shaped tip of the body of earthworms lead to a completely homogenization of soil aggregates, followed by swelling, and the blockage of smaller lateral side-pores. With the reduction of positive water pressures the soil begins to shrink again because the beforehand shear stress induced a mostly homogenized grain size distribution with proportional shrinkage behavior. Continuous but water-saturated pores are formed during such shrinkage. In general, these processes occur in the rhizosphere, too.
Crack-forming processes enhance the soil development also next to biopores, by swelling and shrinkage. In the rhizosphere the number of swelling and shrinkage cycles is enhanced by the hydraulic lift (Vetterlein and Marschner, 1993), which is a redistribution of water from wet to drier soil volumes. The water uptake of plant roots can dry the soil to a matric potential of approximately −1,500 kPa, leading to the formation of shrinkage-induced very rigid cracks. Fine root hairs, which penetrate the soil, result in the creation of new, and highly connected, lateral side pores. Furthermore, whenever a new surface is created, swelling pressures can occur, leading to the formation of new cracks after the pressure dissipated. Thus, crack forming processes result in highly connected pores, with a low tortuosity, altered pore geometry and pore size distribution. These alterations directly influence physico-chemical parameters like the aeration (in terms of pO2 and oxygen diffusivity) or to related parameters like Eh and pH and the penetration resistance (Figure 1). The microbiological community of biopore walls, for example, depends on the history of the biopore (Banfield et al., 2017), thus an indirect influence on soil development (aggregation) can be expected, since soil biota is linked to aggregate dynamics (see a review of Six et al., 2004).
We therefore formulated the following hypotheses:
- Soil next to biopore walls shows altered physical properties (soil aggregation and penetration resistance) along with altered physico-chemical soil properties (i.e., altered oxygen diffusivity, pO2, Eh, and pH values).
- These alterations depend on the history of the biopore (e.g., root or earthworm induced or colonized) and, with a view to earthworm burrows, on the duration of the colonization of the biopore [short-time (<6 months) or long-time].
The objective of this paper is to quantify the alteration of physico-chemical parameters like oxygen diffusivity, pO2, Eh, and pH of biopore walls to better understand exchange and mass transport processes in soils.
To investigate these alterations, small-scaled analyses are conducted. (I) Combining a micromanipulator and a force sensor resulted in a (completely automated) measurement system enabling us to determine oxygen diffusivities or concentrations (pO2) with coupled measurements of the soil penetration resistances in increments of 100 μm in distance from the biopore surface. (II) An enhanced approach of Uteau et al. (2015) enabled us to determine both, pH and Eh, with a spatial resolution of 100 μm by using a computer numerical controlled (CNC) mill for small-scaled soil displacement. (III) Differences in aggregation were visualized with the help of a scanning electron microscope and the soil structure was classified.
Materials and Methods
Soil Material
In total 96 soil cores (3 cm in diameter, 10 cm in height) were excavated in September 2014 from two layers (Bt-1 from 0.45 to 0.55 m and Bt-2 from 0.55 to 0.65 m) from a haplic Luvisol (IUSS Working Group WRB, 2006) in four repetitions (i.e., from four pits) of a totally randomized trial (Kautz et al., 2014) at the experimental area of the Campus Klein-Altendorf (50°37′9″ N 6°59′29″ E, University of Bonn, Germany). The site is characterized by a maritime climate with temperate humid conditions (9.6°C mean annual temperature, 625 mm annual rainfall). Main soil properties are listed in Table 1. The Bt horizon is characterized by accumulated clay, leached from the A-horizon (0–0.27 m) and the E horizon (0.27–0.41 m).
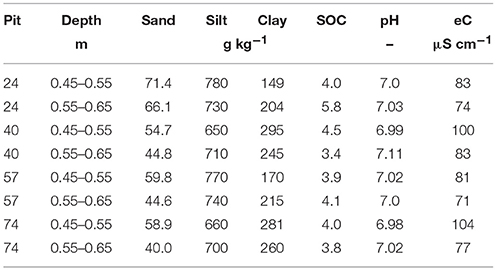
Table 1. Sand, silt, clay, as well as, soil organic carbon (SOC) contents in g kg−1 soil, as well as, pH, and electrical conductivity (eC) in μS cm−1 of the four pits where soil cores were excavated from a loess-derived Luvisol, Klein-Altendorf near Bonn, Germany.
Chicory (Cichorium intybus L. “Puna,” 5 kg ha−1 seeding rate) had been grown in these trials for the last 3 years. With its herringbone or monopodial branching root systems C. intybus L. penetrates deeply into the subsoil exploring for water and nutrient supply (Kautz et al., 2012). Macroscopic biopores remained in the soil after the roots decayed. Biopores with three different histories were considered: the type of the biopore was classified with the help of an endoscopice. Herefore, a videoscope (Karl Storz GmbH, Tuttlingen, Germany, outer diameter of 3.8 mm, with a 0° direction of view and a flare angle of 80°) was carefully inserted into the macroscopic biopore (Athmann et al., 2013; Kautz et al., 2014). For more details about the used equipment see Athmann et al. (2013). Biopore walls differed visually in dependency to their “history:”
- Macroscopic biopores colonized and/or created by a plant root [C. intybus L., (R)] contained residues of decayed roots (<1 mm), frequently showed a very porous filling (macropore root soil), and/or had a very porous pore wall with root residues.
- Biopores colonized and/or created by an earthworm [long-term colonization of Lumbricus terrestris, (EW)] showed wavy surfaces created by the peristaltic movement of the earthworm. Fresh or slightly decayed plant residues were visible and/or the wall appeared to be very dark in color due to carbon enrichment.
- Classification of biopores colonized and/or created by a plant root followed by short-term (<6 months) colonization of L. terrestris, (REW) was ensured by classifying R pores, followed by the artifical colonization with L. terrestris, the feeding with rye residues, and a periodic monitoring of the feeding reception.
Only macroscopic biopores with diameters of >5 mm sufficient for measurements were considered as sampling object. Biopores were discarded whenever the history could not be determined exactly. Furthermore, the videoscope was not inserted into the investigated soil layer but was inserted several centimeters above. The orientation of the biopores were assumed to be vertical. Not all samples could be investigated because some biopores ended within a few centimeters or due to samples failure at the final cutting process in the laboratory, or due to the occurrence of larger numbers of coarse particles (stones) making measurements with glass electrodes impossible. The number of investigated samples is shown in Table 2.
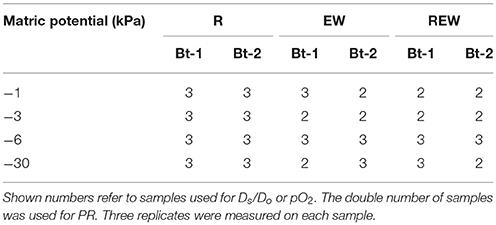
Table 2. Number of investigated samples of biopores colonized and/or created by chicory (Cichorium intybus L.) roots (R), colonized and/or created by Lumbricus terrestris (EW), and biopores colonized and/or created by a plant root followed by colonization of L. terrestris (REW) for samples from Bt-1 (0.45–0.55 m soil depth) and Bt-2 (0.55–0.65 m soil depth) for defined matric potential (kPa).
Soils were drained to defined matric potentials (Ψm = −30 kPa), scanned with the help of a μ-CT (μCT Nanotom© 180; GE Sensing & Inspection Technologies GmbH, Wunstorf, Germany), saturated again and drained to defined matric potentials (Ψm = −1 kPa; −3 kPa; −6 kPa or −30 kPa) for measurements of oxygen diffusivities or oxygen concentration profiles and coupled penetration resistance. In case of pH and Eh the samples were drained to Ψm = −1 kPa. After drainage samples were cut vertically into two halves creating two sample sets. While set A was used in this study, set B was used for relating soil organic matter composition to soil water repellency (Haas et al., 2018).
Coupled Measurement of Penetration Resistance and O2 Diffusivity or O2 Distribution
The measurement system is schematized in Figure 2. Clark-Type O2 microelectrodes (OX-100, UNISENSE A/S, Aarhus, Denmark) connected to a 16 bit AD-converter (4 channel Multimeter, UNISENSE A/S, Aarhus, Denmark) were used to measure the oxygen partial pressure (pO2), and to determine the relative oxygen diffusion coefficient (Ds/DO), defined as the ratio of the oxygen diffusion coefficient in the soil (Ds) to that one of oxygen in free air (DO = 0.201 cm2 s−1) at given temperature and atmospheric pressure conditions (Glinski and Stepniewski, 1985). Data were normalized to laboratory conditions (20°C and 101.25 kPa atmospheric pressure).
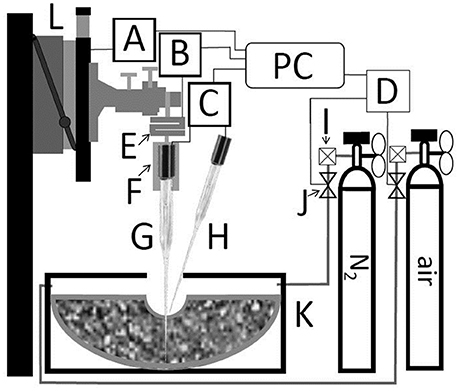
Figure 2. Schematic representation of coupled measurement of penetration resistance and either oxygen diffusivity or oxygen distribution. Motorized micromanipulator (L) with motor driver (A). S-shaped force sensor (E) with A/D-converter (B). Customized mount (F) with electrode 2 (G) placed in soil. Electrode 1 (H) placed at soil surface. Both electrodes were connected to UniSense multimeter (C). Microcontroller board (D) controlled magnet valves (J). The outflow of gas bottles is regulated with flowmeter (I). (A), (B), (C), and (D) are connected to a personal computer (PC) with UniSense software controlled by self-developed software.
A motorized micromanipulator (MM33, MC-232, and MMS, UNISENSE A/S, Aarhus, Denmark) was used to place O2 electrodes in defined distances from the biopore wall. Instead of mounting the O2 electrode directly to the micromanipulator a customized mount was milled. That mount holds the electrode penetrating the soil (bottom) and a threated bar (top) which is connected to a S-shaped force sensor with strain gauge (KD24s, ME-measurement systems GmbH, Germany). The latter one is connected to the micromanipulator and to a 16-bit A/D-converter (GSV-1, ME-measurement systems GmbH, Germany) which is connected to the measuring PC. The force sensor showed with increasing forces a linear loss in height (2 mm at 10 N). That loss in height was automatically corrected by self-developed software, written in Python 2.7 scripting language (Python Software Foundation, 2017) to ensure that the measurements were performed in correct distance from the biopore wall. To automatize the measurement the reading of the sensor was fetched using PySerial (a python package, Python Software, Python Software Foundation, 2017). The soil penetration resistance (PR) was calculated according to Equation (1):
with soil penetration resistance PR (Pa), the measured force f (N) and the area of the penetrating electrode A (m2) in each distance from the biopore surface x. Microscopy images of the tips of the electrodes were used to determine the diameter in increments of 100 μm in distance from the electrodes tip.
By penetrating the soil, air in the electrode tip gets compressed. Therewith, a temporarily peak in O2 concentration can be observed, whenever the electrode proceeds to the next measurement depth. This behavior of the electrode can be used to find the samples surface: Whenever the tip of an electrode hits the surface of the soil sample a temporarily peak in O2 concentration can be observed followed by a sharp decrease in O2 concentration. This occurrence is linked with the air-filled volume in the sensor tip which fades off depending on the local air permeability. The peak usually occurred for <10 s. Because of differences in water-saturation we found 30 s to be long enough for stable and reliable measurement readings.
Oxygen diffusivities for (un-)saturated soil were determined according to Equation 2 (Rappoldt, 1995):
with DS = diffusion coefficient of O2 in soil (m2 s−1); DO = diffusion coefficient in air (m2 s−1); ε = gas-filled porosity (m3 m−3); ω angular frequency(s−1); d = damping depth (m, see Equation 3). For determining the O2 diffusivity, a one-dimensional O2 concentration wave is applied at the surface of the soil sample. This is achieved by periodically flushing the measurement chamber with either nitrogen or air. Magnetic valves had been used to control the outflow of gas containers and to alternate the O2 concentration in the measurement chamber. Two gases were used: N2 (AlphaGaz 1, Air Liquide) for lowering the O2 concentration or synthetic air (20.5 ± 0.5% O2 in N2, AlphaGaz 1, Air Liquide) to rise pO2 to (more or less) atmospheric pO2. Each valve (12 V) was operated by using a simple circuit containing a NPN-transistor (TIP 120), a resistor (10 k Ω) and a microcontroller board (Arduino Uno). The Arduino Uno was programmed using the Arduino software in a way where it opens valve 1, valve 2 or none of both valves after it received a defined signal by the self-developed software using PySerial (a python package, Python Software Foundation, 2017). With the help of two O2 electrodes (electrode 1 is placed at the soil surface, and electrode 2 is placed in defined distances from the biopore surface) a phase shift ϕ(x) between the concentration waves can be observed, showing a delay in depth × relative to the surface wave (Rappoldt, 1995). In general, the amplitude of the concentration wave decreases exponentially with increasing distance from the biopore, whereas the phase shift increases linearly. Equation (3) was used to calculate the damping depth d (Rappoldt, 1995):
With phase shift ϕ(x) in depth x. Once d is known, Equation (2) is used to calculate the diffusivity DS.
PyAutoIT (Xu, 2017) is a python module which needs AutoIt v3 (Bennett and the AutoIt Team, 2017), a freeware BASIC-like scripting language designed for automating the Windows GUI and general scripting. PyAutoIT was used to completely automatize the measurement by simulating keystrokes and mouse movements for controlling the software (Sensor Trace Pro) of the UniSense multimeter with highest precision in time domain. NumPy (NumPy developers, 2017)1 was used for data evaluation and the calculation of the phase shift ϕ(x). This setup enabled us to determine both parameters (Ds/DO and pO2) within 0–3,500 μm in distance from the biopore surface in increments of 100 μm, or for PR with a spatial resolution of ≤5 μm. Values of PR are presented as means for each increment (0–100 μm; 100–200 μm, …, 3,400–3,500 μm).
Air-filled porosities (ε) were calculated by subtracting the weight of the saturated sample of the weight of the drained sample followed by division with the corrected sample volume calculated from x-ray microtomography. In this study, the corrected sample volume is defined by the difference of the total sample volume and the volume of the macroscopic biopore (calculated from CT-data by Wittig et al., unpublished).
Redox Potentials and pH Measurements
For measuring pH and Eh the manual approach applied by Uteau et al. (2015) was refined to a semi-automatic procedure using a computer numerical controlled (CNC) mill to which a twisted drill was attached. Therewith, we were able to scrape off the uppermost soil material with a high spatial resolution (increments of the used stepper motors equals 8 μm).
Calibration of Micro-Electrodes and Mirco-Sensors
A two point calibration was applied for all used micro-electrodes and micro-sensors. For Clark type O2 electrodes the zero point (0 kPa) was reached with an anoxic solution (2 g sodium ascorbate diluted in 100 mL of 0.1 M NaOH), while pO2 = 20.95 kPa were assumed for a well aerated (by bubbling ambient air into the water) aqueous calibration solution. Eh and pH microelectrodes were calibrated by placing both, the reference electrode and the redox microelectrode tips to quinhydrone redox buffers (pH 4 equal to 470 mV and pH 7 equal to 295 mV at 20°C).
Scanning Electron Microscope (SEM) and Description of the Soils Structure
Scanning electron microscopy (SEM) was performed with CamScan CS 44 (CamScan Ltd., Cambridgeshire, UK). SEM micrographs were obtained at 15 keV. Monochrome photographs were taken with an integrated reflex camera. A detailed description of SEM, microanalysis with 200 or 700 magnification factors and their applications are given in Goldstein (2003). The soil structure was described using a system (Babel et al., 1995) which is based on soil physical theory and can be applied on various scales. Four levels are needed to describe aggregate properties (size, shape, movement, packing and surface). The fifth level describes further soil properties like the pore water pressure.
Statistical Analyses
The statistical software R (R Core Team, 2017) was used to evaluate the data. The data evaluation started with the definition of an appropriate statistical mixed model (Laird and Ware, 1982; Verbeke and Molenberghs, 2000) for the logarithmized Ds/DO-values. The assumption that logarithmized Ds/DO-values were normally distributed distributed and homoscedastic are based on a graphical residual analysis.
The statistical model included the history of the biopore (referred as history, as shown in section Material and Methods), the sampling depth (0.45–0.55 m and 0.55–0.65 m) and the distance from the biopore surface (0–3,500 μm), as fixed factors according to the following equation:
with a, b, and c as fitting parameter, e is Euler's number, i and j for the histories of the biopores and the depths, and dist for the distance from the biopore surface (10−3 m). Model for penetration resistance and O2 partial pressure behaved analogously to DS/DO. All regression coefficients are shown in Table 3. The covariates (and potential interaction effects) are based on a model selection. Assuming a split-plot design random effects were defined by the pits and suitable interaction effects with the history of the biopore, the sampling depths and with the soil core. Based on this model, a pseudo-R2 was calculated (Nakagawa and Schielzeth, 2013) and an analysis of covariances (ANCOVA) was conducted (Cochran, 1957).

Table 3. Regression coefficients according to Equation (4) for penetration resistance (PR, Pa), relative oxygen diffusion coefficient (Ds/DO) and oxygen partial pressure (pO2) for biopores colonized and/or created by chicory (Cichorium intybus L.) roots (R), colonized and/or created by Lumbricus terrestris (EW), and biopores colonized and/or created by a plant root followed by colonization of L. terrestris (REW) for samples from Bt-1 (0.45–0.55 m soil depth) and Bt-2 (0.55–0.65 m soil depth).
Results and Discussion
Differences in aggregation were confirmed by scanning electron microscope (SEM) micrographs, shown in Figure 3. For R pores (i.e., colonized and/or created by a plant root), a very porous surface can be observed in comparison with surfaces of EW or REW (colonized and/or created by L. terrestris for long-term or short-term, respectively). Round-shaped lateral pores (marked with “a”) are visible for all pore types and at both magnification factors (namely, 200 and 700) and are possibly created by lateral side roots (Roose et al., 2016) or soil fauna. Shrinkage induced cracks can be observed next to these round-shaped pores and for very plane and homogenous surfaces of REW. With a magnification factor of 700 the first and second crack generation becomes visible (marked with “b”). These soil systems are biologically altered by e.g., fungal hyphae (“c”). Platy structures are marked with “d.” SEM micrographs underline the very different soil structure for biopore with differing histories and are helpful to explain the results of coupled measurement of penetration resistance and O2 diffusivity or O2 distribution.
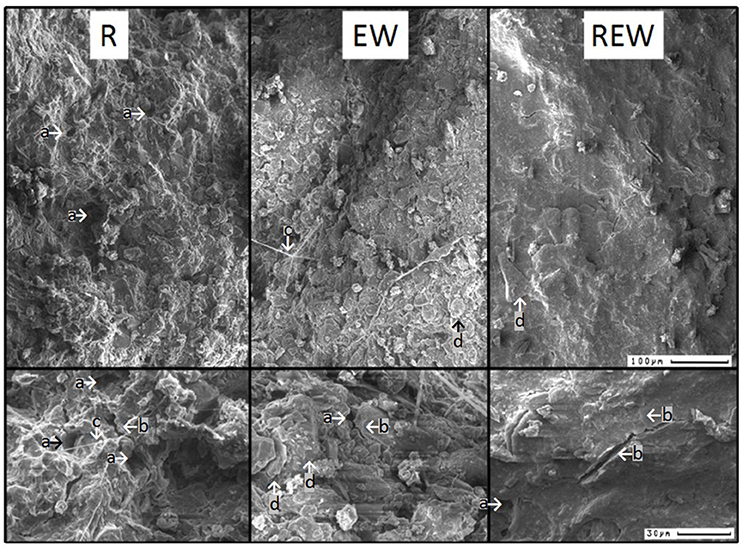
Figure 3. Exemplary scanning electron microscope images of biopore walls [pore colonized by root (R), colonized by L. terrestris (EW), and (REW) just like R but followed by short-term (<6 months) colonization of L. terrestris]. Using a magnification factor of 200 (upper-row) or 700 (lower row), a very porous surface for R can be observed in comparison with surfaces of EW or REW. Exemplary pores, created by lateral side roots are marked with “a,” exemplary shrinkage-induced cracks (due to root water uptake or initial shrinkage) with “b.” Fungal hyphae networks are indicated by “c.” Platy structures are clearly visible for EW (d).
Following the soil structure classification system by Babel et al. (1995) first the size of the aggregate is defined by the amount of occurring cracks. Biopore walls of R and EW were classified as microaggregated because two or more cracks were found within a distance of 100 μm (Figure 3), while REW was classified as microcoherent were no or one crack showed within a distance of 100 μm. The second level defines the shape of the aggregates. Micro-aggregates at the surfaces of R showed subpolyeders (all three axes are of approximately equal length with mostly rounded edges and some planes), while those of EW and REW showed micro-aggregates where two axis are larger than the third one. Micro-aggregates of EW and REW were classified as subplates (edges rounded, planes visible) and plates (aggregate sharp edged), respectively. With the third level the movement and packing of aggregates is considered: R and REW were classified as original, because aggregates were not rearranged after the formation of stress and shear induced cracks. EW aggregates were classified as rearranged, due to the repeated earthworms moving action. Within the fourth level the surface of the aggregates is described. The porosity decreased in the order R > EW > REW. R and EW were classified as porous [with both, biological and physical induced cracks (by shrinkage and swelling)]. REW showed dense surfaces, with cracks caused by two shrinkage and swelling-cycles, which resulted in the formation of primary and (rectangular to these cracks) secondary cracks (Figure 3). Surfaces of R consisted of randomly arranged particles (classified as rough). REW showed oriented particles (classified as smooth). A new class was needed to describe the surfaces of EW. Here, orientated particles formed porous surfaces EW (namely, porous and rough). Two other parameters which refer to the grain size distribution or the color were not considered. The pore water pressure at time of observation is classified as dry (namely pF ≥ 3.5) for all types, since SEM was performed on air-dried samples. For the same reason the strength of the micro-aggregates can be classified as strong, because the soil can only be deformed at high forces.
The model output of the statistical analysis for the penetration resistance as a measure of soil stability is shown in Figure 4. PR showed highly significant (p < 0.001) interactions with the history of the pore, the matric potential, the distance from the biopore surface and the sampled depth. Interestingly, the chemical composition (in terms of hydrophobic and hydrophilic functional groups) of these biopore walls showed highly significant (p < 0.001) interactions with the history of the pore, the matric potential, the distance from the biopore surface and the sampled depth, as also mentioned by Haas et al. (2018). PR increased with increasing drainage (more negative matric potential, Figure 4, Table 3). This is especially distinctive for the upper depth (Bt-1, 0.45–0.55 m), and reflects the more pronounced aggregate development caused by swelling and shrinkage (Becher, 1991, 1994) at this depth compared to the deeper one. Values for PR of earthworm colonized pore walls (R) exceed the maximum pressure L. terrestris is able to apply to soils (195 kPa according to Keudel and Schrader, 1999). This increased PR is possibly caused by calcite, released from specialized esophageal glands of L. terrestris (Lankester, 1865). Calcite can influence PR not only by enhancing the soil development by altering the biological activity in soils (Mordhorst et al., 2017) but also by forming crusts on the aggregate surface and by coagulating primary particles. Biological crusts also may have caused these altered PR (Chamizo et al., 2015). This intensified aggregate development led to highest PR for the surface of the biopore (distance = 0 μm), indicated by the negative slope of the curve (EW, Bt-1). The negative slope which is also found for R (Bt-1) reflects the intensified aggregate development, caused by both, an intensified shrinkage caused by root water-uptake, and an increased number of swelling-and-drying-cycles caused by hydraulic lift (Vetterlein and Marschner, 1993). The PR of REW in Bt-1 and of all types of biopores in Bt-2 behaved in an opposite way: The lowest PR was found at the surface of the biopore wall possibly caused by homogenization and the coinciding loss of soil strength at higher water contents. Further possible explanations are the generally increasing water contents with depth at field condition (for Bt-2) or with increased water content caused by exudates (REW, Bt-1). Gerard et al. (1982) computed regression models (stepwise) for both, root growth and soil strength, as dependent variables, using soil type, soil depth, clay content, bulk density, voids, and water content as independent variables. The considered soil types were a sandy loam and a clay loam. Soil strength was significantly influenced by voids, and clay content, while root growth was additionally influenced by volumetric water content, whereas decreasing soil strength were found with increasing clay content, voids and water content or decreasing soil depth. In this study, the statistical analysis of PR only confirms the influence of water contents on soil strength on the micro scale. This is caused by but the lack of information about small scaled differences in clay content and total or air-filled porosity which were assumed to be homogeneous within a single sample. Small scaled differences in pore volumes or textural differences can be determined with the help of micro X-ray computed tomography (Peth et al., 2010; Rogasik et al., 2014) or infrared spectroscopy (Leue et al., 2010; Stenberg et al., 2010), respectively.
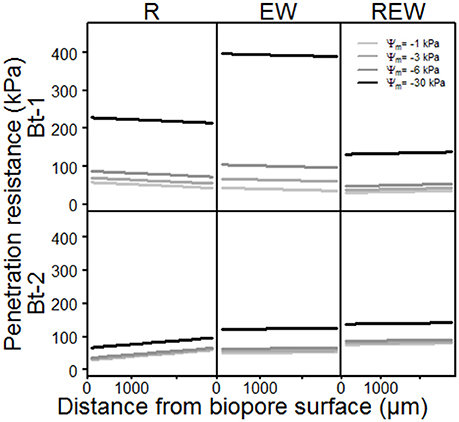
Figure 4. Model output of the statistical analysis of penetration resistance of biopore walls [pore colonized by root (R), colonized by L. terrestris (EW) and (REW) just as R but followed by short-term (<6 months) colonization of L. terrestris] as a function of matric potential.
Consequences of small-scaled differences in aggregation for Ds/DO are shown exemplarily for three replicated measurements within the same biopore wall (Figure 5). This earthworm burrow showed deviations up to several orders of magnitude for the replicates of Ds/DO. The minimum value of 6 × 10⁻⁶ indicates a water-filled (Glinski and Stepniewski, 1985) and/or a tortuous or not well-connected pore system while the maximum value of 0.14 is higher than those measured on soil cores by Mordhorst et al. (2017).
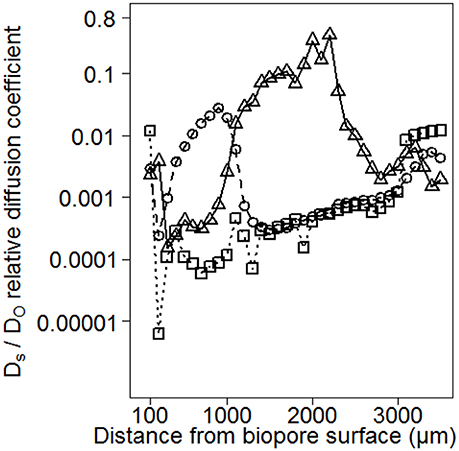
Figure 5. Consequences of small-scaled differences in aggregation for Ds/DO exemplarily for three replicated measurements within the same biopore wall. Deviations up to several orders of magnitude are observed for the replicates.
Consequences of differences in aggregation on pore functions are shown in Figures 6A,B and Table 3 for Ds/DO, and for pO2, for biopore walls and their surrounding soils in dependency of the considered matric potentials (Ψm = −1 kPa; −3 kPa; −6 kPa and −30 kPa). Both parameters (Ds/DO and pO2) showed highly significant (p < 0.001) interactions with the history of the biopore, the matric potential, the distance from the biopore surface and the sampled depth. In general, Ds/DO increases with decreasing (more negative) matric potential, and whenever the pore wall had been influenced by an earthworm, higher Ds/DO values can be observed for Bt-1 compared to Bt-2. Biopore walls that had been colonized by a plant root (R) showed the highest values for Ds/DO which can be found in 0 mm distance from the biopore surface (Bt-1), or within 0–3,500 μm (Bt-2).
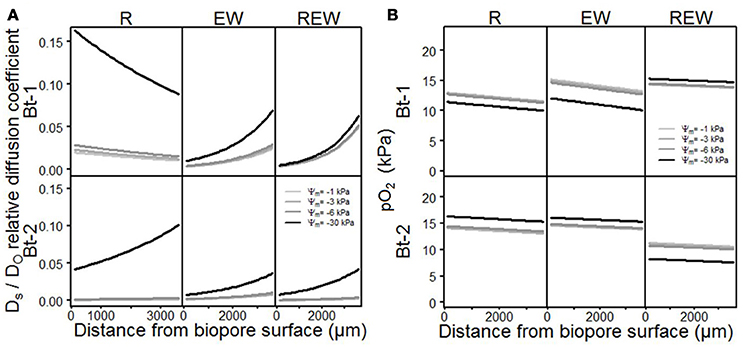
Figure 6. Model output of the statistical analysis for (A) relative diffusion coefficient Ds/DO ratio of soil oxygen diffusion coefficient (DS) to air (DO) and (B) oxygen partial pressure pO2, of biopore walls [pore colonized by root (R), colonized by L. terrestris (EW) and (REW) just as R but followed by short-term (<6 months) colonization of L. terrestris] as a function of matric potential.
In the sphere of plant roots, root water uptake and root water redistribution enhanced the aggregation leading to the formation of highly connected shrinkage cracks. The pore-size distribution is also altered by decaying lateral side roots and fine roots whereas highly-connected coarse are created. This effect is especially visible in Bt-1 (R). The shift of pore functionality is especially distinctive for REW where further drainage from −1 to −6 kPa had almost no influence on already high values of Ds/DO for the wettest condition (Ψm = −1 kPa) proving the alteration of pore functions by earthworms. For R in Bt-1 a more pronounced influence of the drainage can be observed by a more pronounced increase of Ds/DO with more negative matric potential (e.g., from Ψm = −1 to −3 kPa) if compared with the deeper depth or with the other biopore types. This reflects an increased pore function for pores >300 μm to 50 μm (corresponding to the drainage to Ψm = −1 and to Ψm = −6 kPa) and follows the root length density as measured after 2 years of C. intybus (Perkons et al., 2014). The higher Ds/DO of Bt-1 compared with Bt-2 can be explained by the intensified soil structure development with decreasing depth, providing a more continuous pore system.
The influence of earthworms on aggregation, which include processes like homogenization of the surrounding soil volume by shearing, smearing and therewith occurring blockage of smaller lateral side pores (see also Pagenkemper et al., 2013), is also reflected by alterations in pore functions (Horn and Fleige, 2003). It can be confirmed for the micro-scale by reduced values for Ds/DO for biopores of EW and REW-type, as well as aggregation of biopore walls of the REW-type which was more homogenous than that of the R-type (Figure 3).
These altered pore functions alter the gas composition, consequently. The oxygen partial pressure (pO2) decreased with increasing distance from the biopore surface (Figure 6B) and decreased with increasing water content (REW in Bt-1, R and EW in Bt-2). This is in accordance with Zausig and Horn (1992) and can be explained by the lower diffusion coefficient for O2 in water compared to air. The remaining variants (R and EW in Bt-1 and REW in Bt-2) behaved contrarily. Here, lower pO2 was found with decreasing water content (more negative matric potential). This can also be found when studying some literature attentively (e.g., Zausig et al., 1993) but has never been discussed so far. A possible explanation is: If a micro sensor is inserted into an almost water-saturated soil the degree of water-saturation can increase because an additional volume is added to the soil. With the resulting shift in pore-space distribution larger pores become thinner due to compaction (Becher, 1994; Riggert et al., 2017) and positive water pressure can occur. Furthermore, due to the cone-shaped tip shearing occurred leading to the homogenization of soil aggregates and with that to swelling. The following reduction of the positive water pressure results in the formation of coarser and continuous interaggregate pores. The soil solution that is found in these regions, saturated with water but poor in O2, is mixed with soil solution of the aggregates' exterior, where higher pO2 is expected (Horn, 1994). These processes will not occur if the water content is lower (Ψm = −30 kPa), because of the larger aggregate stability. This results in lower values for pO2 with lower water contents.
Ecological Impact of Altered Pore Functions and Gas Composition
How far changes in aggregation, the arrangement of particles within the pore wall and differences in pore size distribution interact with the kind and intensity of the living organisms or the decaying roots can be elucidated with the Eh and pH pattern. Exemplary results for Eh and pH are shown in Figure 7. For both parameters, there were only weak (0.05 ≤ p ≤ 0.1) statistical interactions with the distance from the biopore surface, the history of the biopore and the depth. Representative results show that pH of the biopore wall decreases from EW to REW to R (Figure 7A). In distances >1,000 μm from the biopore wall, differences between the histories could not be found. The pH values next to R-type biopores showed an intense scattering in the range from 6.2 to 7.1. Higher pH values may be caused by released calcite by earthworms, while lower pH values next to R-type biopores are caused by the plants release of H+.
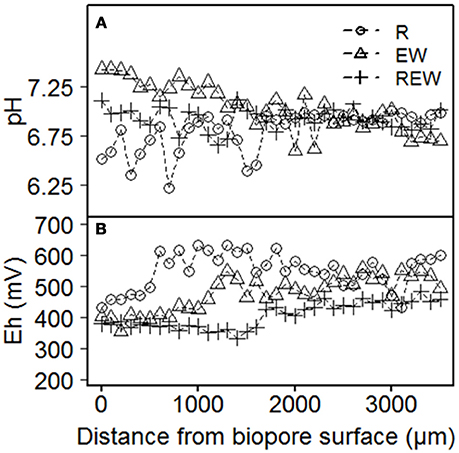
Figure 7. Exemplary results of (A) pH and (B) Eh of biopore walls [pore colonized by root (R), colonized by L. terrestris (EW) and (REW) equal to R but followed by colonization of L. terrestris]. Samples drained to Ψm = −1 kPa.
Eh-values for biopore surfaces (=0 μm) were in a close range (380–430 mV) and increased tendentially with increasing distance from the biopore surface. Thus, Eh-values can be classified (Zhi-Guang, 1985) as oxidizing (>400 mV; O2 predominant) or weakly reducing (400 mV to 200 mV; O2, nitrate-N and Mn(II, IV) reduced). An expected decrease of Eh with increasing distance from the biopore surface (caused by weaker aeration) was not found within 3,500 μm in distance from the biopore surface. Shown values were not corrected for pH. R-type biopores showed the highest values for Eh and increased within a distance <1,000 μm from the biopore surface, whereas those of the EW-type biopore increased after approximately 1,000 μm and those of the REW-type biopore within 1,500 μm. Such a pattern may reflect the increased organic carbon content next to biopore surfaces and the increased aeration due to lateral side roots (in case of R-type biopore).
Redox potentials were in the same range as those of Zausig et al. (1993) who investigated soil rich in clay, namely an Udert and an Udifluvent soil. Zausig et al. (1993) found anoxic aggregate centers that were not always accompanied by a decrease in redox potential and assumed that these effects are induced by different microbial activities as well as by differing redox buffering systems of the investigated soils. If we consider the dynamics in the drilosphere much lower redox potentials were expected, because of the disruption of aggregates, the following release of organic carbon and the subsequent oxidation of these molecules.
Under consideration of further methodological limitations which may affect the actual in situ aeration and redox reactions we may include the disadvantage of the applied pO2 and Eh measuring procedure under laboratory conditions with the relatively high pO2 and Eh-values due to (a) the removal of soil and therewith decreased distances for diffusion and (b) the increased pO2 under laboratory conditions, compared with the pO2 under field conditions. The effect of these parameters need further research in order to quantify such side effects.
Conclusions
This study aimed at quantifying the effects of micro-aggregation within macroscopic biopore walls on physico-chemical parameters such as oxygen diffusivity, oxygen partial pressure, Eh, and pH. The conclusions are as follows:
(I) The refined measurement approach allowed the coupled determination of penetration resistance with either oxygen diffusivity or oxygen partial pressure. The automation improved the measurement system by controlling the precision of spatial and temporal resolution of the measurement steps. The use of cylindrical-shaped electrodes was found superior over cone-shaped electrodes because of the lower shearing.
(II) Biopore history-dependent differences in the morphology of micro-aggregates were confirmed with the help of scanning electron microscopy. Both, plant roots and earthworms alter soil structure next to biopore surfaces with contradictory impact: soil structure formation is enhanced by roots while aggregates are homogenized by earthworms with a consecutive reformation.
(III) Differences in aggregation were found to result in differences in pore functions. The observed alterations in structure by roots and earthworms impact on pore functions responsible for water flow and gas transport processes (i.e., pore-size distribution, tortuosity, connectivity, and pore geometry). While these relationships were already known for the mesoscale (cm-to-m), they were confirmed here for the microscale (μm-to-mm).
(IV) The Eh and pH mm-scale patterns can be used as indicator for interactions of microbial colonization, soil structure, and soil rooting conditions.
The results improved understanding of interactions between soil physico-bio-chemical properties at the scale of micro-aggregates or macropore walls.
Author Contributions
All authors listed have made a substantial, direct and intellectual contribution to the work, and approved it for publication.
Conflict of Interest Statement
The authors declare that the research was conducted in the absence of any commercial or financial relationships that could be construed as a potential conflict of interest.
Acknowledgements
This study was funded by the German Research Foundation (DFG), Bonn, under grants PAK 888. We thank Timo Kautz and the staff of the Institute of Organic Agriculture in Bonn for assistance with the field work. Many thanks to the reviewers for their very helpful comments.
Footnotes
1. ^Available online at: http://www.numpy.org/
References
Athmann, M., Kautz, T., Pude, R., and Köpke, U. (2013). Root growth in biopores–evaluation with in situ endoscopy. Plant Soil 371, 179–190. doi: 10.1007/s11104-013-1673-5
Babel, U., Benecke, P., Hartge, K. H., Horn, R., and Wiechmann, H. (1995). “Determination of soil structure at various scales,” in Soil Structure, Its Development and Function, eds K. H. Hartge, and B. A. Stewart (Boca Raton, FL: CRC Press), 1–10.
Banfield, C. C., Dippold, M. A., Pausch, J., Hoang, D. T. T., and Kuzyakov, Y. (2017). Biopore history determines the microbial community composition in subsoil hotspots. Biol. Fertil. Soils 9, 54 doi: 10.1007/s00374-017-1201-5
Baumgarten, W., Dörner, J., and Horn, R. (2013). Microstructural development in volcanic ash soils from South Chile. Soil Till. Res. 129, 48–60. doi: 10.1016/j.still.2013.01.007
Becher, H. H. (1991). Observations on soil aggregates following measurements of penetration resistance. Soil Tech. 4, 351–362. doi: 10.1016/0933-3630(91)90013-D
Becher, H. H. (1994). Soil compaction around a small penetrating cylindrical body and its consequences. Soil Tech. 7, 83–91. doi: 10.1016/0933-3630(94)90009-4
Bengough, A., and Mullins, C. (1990). Mechanical impedance to root growth: a review of experimental techniques and root growth responses. J. Soil Sci. 41, 341–358. doi: 10.1111/j.1365-2389.1990.tb00070.x
Bennett, J., and the AutoIt Team. (2017). AutoIt. Available online at: https://www.autoitscript.com/site/autoit/
Bouché, M. B. (1975). “Action de la faune sur les etats de la matiere organique dans les ecosystemes,” in Humification et Biodegradation, eds G. Kilbertius, O. Reisinger, A. Mourey and J. A. C. da Fonseca (Sarreguemines: Pierron), 157–168.
Brown, G. G., Barois, I., and Lavelle, P. (2000). Regulation of soil organic matter dynamics and microbial activity in the drilosphere and the role of interactions with other edaphic functional domains. Eur. J. Soil Biol. 36, 177–198. doi: 10.1016/S1164-5563(00)01062-1
Chamizo, S., Rodríguez-Caballero, E., Cantón, Y., Asensio, C., and Domingo, F. (2015). Penetration resistance of biological soil crusts and its dynamics after crust removal: relationships with runoff and soil detachment. Catena 126, 164–172. doi: 10.1016/j.catena.2014.11.011
Don, A., Steinberg, B., Schöning, I., Pritsch, K., Joschko, M., and Gleixner, G. (2008). Organic carbon sequestration in earthworm burrows. Soil Biol. Biochem. 40, 1803–1812. doi: 10.1016/j.soilbio.2008.03.003
Fazekas, O., and Horn, R. (2005). Zusammenhang zwischen hydraulischer und mechanischer Bodenstabilität in Abhängigkeit von der Belastungsdauer. J. Plant Nutr. Soil Sci. 168, 60–67. doi: 10.1002/jpln.200421381
Fér, M., Leue, M., Kodešová, R., Gerke, H. H., and Ellerbrock, R. H. (2016). Droplet infiltration dynamics and soil wettability related to soil organic matter of soil aggregate coatings and interiors. J. Hydrol. Hydromech. 64, 111–120. doi: 10.1515/johh-2016-0021
Gerard, C. J., Sexton, P., and Shaw, G. (1982). Pyhsical factors influencing soil strength and root growth. Agron J. 74, 875–879. doi: 10.2134/agronj1982.00021962007400050025x
Glinski, J., and Stepniewski, W. (1985). Soil Aeration and its Role for Plants. Boca Raton, FL: CRC Press.
Goldstein, J. I. (2003). Scanning Electron Microscopy and X-ray Microanalysis, 3rd Edn. New York, NY: Kluwer Academic/Plenum Publishers.
Haas, C., Gerke, H. H., Ellerbrock, R. H., Hallett, P. D., and Horn, R. (2018). Relating soil organic matter composition to soil water repellency for soil biopore surfaces different in history from two Bt horizons of a Haplic Luvisol. Ecohydrology 2018:e1949. doi: 10.1002/eco.1949
Haas, C., Holthusen, D., Mordhorst, A., Lipiec, J., and Horn, R. (2016). Elastic and plastic soil deformation and its influence on emission of greenhouse gases. Int. Agrophys. 30, 173–184. doi: 10.1515/intag-2015-0088
Hoang, D. T. T., Pausch, J., Razavi, B. S., Kuzyakovam, I., Banfield, C. C., and Kuzyakov, Y. (2016). Hotspots of microbial activity induced by earthworm burrows, old root channels, and their combination in subsoil. Biol. Fertil. Soils 52, 1105–1119. doi: 10.1007/s00374-016-1148-y
Horn, R. (1994). “Effect of aggregation of soils on water, gas and heat transport,” in Flux Control in Biological Systems, ed E. D. Schulze (San Diego, CA: Academic Press), 335–364.
Horn, R., and Fleige, H. (2003). A method for assessing the impact of load on mechanical stability and on physical properties of soils. Soil Till. Res. 73, 89–99. doi: 10.1016/S0167-1987(03)00102-8
IUSS Working Group WRB (2006). World Reference Base for Soil Resources, World Soil Resources Reports No 103. Rome: FAO.
Jarvis, N. J. (2007). A review of non-equilibrium water flow and solute transport in soil macropores: principles, controlling factors and consequences for water quality. Eur. J. Soil Sci. 58, 523–546. doi: 10.1111/j.1365-2389.2007.00915.x
Kautz, T., Amelung, W., Ewert, F., Gaiser, T., Horn, R., Jahn, R., et al. (2012). Nutrient acquisition from arable subsoils in temperate climates: a review. Soil Biol. Biochem. 57, 1003–1022. doi: 10.1016/j.soilbio.2012.09.014
Kautz, T., Lüsebrink, M., Pätzold, S., Vetterlein, D., Pude, R., Athmann, M., et al. (2014). Contribution of anecic earthworms to biopore formation during cultivation of perennial ley crops. Pedobiologia 57, 47–52. doi: 10.1016/j.pedobi.2013.09.008
Keudel, M., and Schrader, S. (1999). Axial and radial pressure exerted by earthworms of different ecological groups. Biol. Fertil. Soils 29, 262–269.
Laird, N. M., and Ware, J. H. (1982). Random-effects models for longitudinal data. Biometrics 38, 963–974.
Leue, M., Ellerbrock, R. H., Bänninger, D., and Gerke, H. H. (2010). Impact of soil microstructure geometry on DRIFT spectra: comparisons with beam trace modelling. Soil Sci. Soc. Am. J. 74, 1976–1986. doi: 10.2136/sssaj2009.0443
McKenzie, B. M., Bengough, A. G., Hallett, P. D., Thomas, W. T. B., Forster, B., and McNicol, J. W. (2009). Deep rooting and drought screening of cereal crops: a novel fieldbased method and its application. Field Crops Res. 112, 165–171. doi: 10.1016/j.fcr.2009.02.012
Mordhorst, A., Zimmermann, I., Fleige, H., and Horn, R. (2017). Changes in soil aeration and soil respiration of simulated grave soils after quicklime application. J. Plant Nutr. Soil Sci. 180, 53–164. doi: 10.1002/jpln.201600351
Nakagawa, S., and Schielzeth, H. (2013). A general and simple method for obtaining R2 from generalized linear mixed-effects models. Methods Ecol. Evol. 4, 133–142. doi: 10.1111/j.2041-210x.2012.00261.x
Pagenkemper, S. K., Peth, S., Uteau Puschmann, D., and Horn, R. (2013). “Effects of root-induced biopores on pore space architecture investigated with industrial X-ray computed tomography,” in Soil-Water-Root Processes: Advances in Tomography and Imaging, eds S. H. Anderson and J. W. Hopmans (Madison, WI: American Society of Agronomy), 69–96.
Parkin, T. B., and Berry, E. C. (1999). Microbial nitrogen transformations in earthworm burrows. Soil Biol. Biochem. 31, 1765–1771. doi: 10.1016/S0038-0717(99)00085-1
Passioura, J. B. (2002). Soil conditions and plant growth. Plant Cell Environ. 25, 311–318. doi: 10.1046/j.0016-8025.2001.00802.x
Perkons, U., Kautz, T., Uteau, D., Peth, S., Geier, V., Thomas, K., et al. (2014). Root-length densities of various annual crops following crops with contrasting root systems. Soil Till. Res. 137, 50–57. doi: 10.1016/j.still.2013.11.005
Peth, S., Nellesen, J., Fischer, G., and Horn, R. (2010). Non-invasive 3D analysis of local soil deformation under mechanical and hydraulic stresses by μCT and digital image correlation. Soil Till. Res. 111, 3–18. doi: 10.1016/j.still.2010.02.007
Python Software Foundation. (2017). Python Language Reference, Version 2.7. Available online at: www.python.org
Rappoldt, C. (1995). Measuring the millimetre-scale oxygen diffusivity in soil using microelectrodes. Eur. J. Soil Sci. 46, 169–177. doi: 10.1111/j.1365-2389.1995.tb01824.x
R Core Team. (2017). R: A Language and Environment for Statistical Computing. Vienna: R Foundation for Statistical Computing. Available online at: http://www.R-project.org/
Riggert, R., Fleige, H., Kietz, B., Gaertig, T., and Horn, R. (2017). Dynamic stress measurements and the impact of timber harvesting on physical soil properties. Aust. Forestry 80, 255–263. doi: 10.1080/00049158.2017.1347981
Rogasik, H., Schrader, S., Onasch, I., and Gerke, H. H. (2014). Micro-scale dry bulk density variation around earthworm (Lumbricus terrestris L.) burrows based on X-ray computed tomography. Geoderma 213, 417–477. doi: 10.1016/j.geoderma.2013.08.034
Roose, T., Keyes, S. D., and Daly, K. R. (2016). Challenges in imaging and predictive modeling of rhizosphere processes. Plant Soil 407, 9–38. doi: 10.1007/s11104-016-2872-7
Ruiz, S., Or, D., and Schymanski, S. J. (2015). Soil penetration by earthworms and plant roots—mechanical energetics of bioturbation of compacted soils. PLoS ONE 10:e0128914. doi: 10.1371/journal.pone.0128914
Six, J., Bossuyt, H., Degryze, S., and Denef, K. (2004). A history of research on the link between (micro)aggregates, soil biota, and soil organic matter dynamics. Soil Till. Res. 79, 7–31. doi: 10.1016/j.still.2004.03.008
Stenberg, B., Rossel, R. A. V., Mouazen, A. M., and Wetterlind, J. (2010). Visible and near infrared spectroscopy in soil science. Adv. Agron. 107, 163–215. doi: 10.1016/S0065-2113(10)07005-7
Uteau, D., Hafner, S., Pagenkemper, S. K., Peth, S., Wiesenberg, G. L. B., Kuzyakov, Y., et al. (2015). Oxygen and redox potential gradients in the rhizosphere of alfalfa grown on a loamy soil. J. Plant Nutr. Soil Sci. 178, 278–287. doi: 10.1002/jpln.201300624
Verbeke, G., and Molenberghs, G. (2000). Linear Mixed Models for Longitudinal Data. New York, NY: Springer.
Vetterlein, D., and Marschner, H. (1993). Use of a microtensiometer technique to study hydraulic lift in a sandy soil planted with pearl millet (Pennisetum americanum (L.) Leeke). Plant Soil 149, 275–282. doi: 10.1007/BF00016618
Xu, J. (2017). PyAutoIt 0.3. Available online at: https://pypi.python.org/pypi/PyAutoIt/0.3
Zausig, J., and Horn, R. (1992). Soil water relations and aeration status of single soil aggregates, taken from a gleyic vertisol. Z. Pflanz. Bodenkunde 155, 237–245.
Zausig, J., Stepniewski, W., and Horn, R. (1993). Oxygen concentration and redox potential gradients in unsaturated model soil aggregates. Soil Sci. Soc. Am. J. 57, 908–916. doi: 10.2136/sssaj1993.03615995005700040005x
Keywords: diffusion, oxygen partial pressure, pH, redox potential, biopores, root channel, earthworm burrow
Citation: Haas C and Horn R (2018) Impact of Small-Scaled Differences in Micro-Aggregation on Physico-Chemical Parameters of Macroscopic Biopore Walls. Front. Environ. Sci. 6:90. doi: 10.3389/fenvs.2018.00090
Received: 04 May 2018; Accepted: 20 July 2018;
Published: 10 August 2018.
Edited by:
Andrea Carminati, University of Bayreuth, GermanyReviewed by:
Frédéric Rees, Institut National de la Recherche Agronomique Centre Montpellier, FranceMartin Leue, Leibniz-Zentrum für Agrarlandschaftsforschung (ZALF), Germany
Copyright © 2018 Haas and Horn. This is an open-access article distributed under the terms of the Creative Commons Attribution License (CC BY). The use, distribution or reproduction in other forums is permitted, provided the original author(s) and the copyright owner(s) are credited and that the original publication in this journal is cited, in accordance with accepted academic practice. No use, distribution or reproduction is permitted which does not comply with these terms.
*Correspondence: Christoph Haas, Yy5oYWFzQHNvaWxzLnVuaS1raWVsLmRl
 Christoph Haas
 Rainer Horn