 Zhou Yuan
 Xinwei Liao
- School of Petroleum Engineering, China University of Petroleum, Beijing, China
In the process of CO2 enhanced oil recovery (CO2-EOR), CO2 interacts with formation brine containing high concentrations of scale-forming ions to produce inorganic salt precipitation, which blocks the rock pore throats, changes the characteristics of the reservoir, and thereby reduces the oil recovery rate. In this study, a series of experiments on the static reaction of CO2–formation brine was conducted. The amounts of precipitation formed from the interaction of CO2–formation brine under various conditions were tested. Using the PHREEQC software, the mathematical characterization formulas between the precipitation amount and various environmental factors (e.g., temperature, pressure difference, scale-forming ion concentration, and pH) were established. On this basis, a numerical simulation model of CO2 flooding in a typical area of oil field C was established. The distribution of inorganic salt precipitation during continuous gas flooding was predicted, and the effect of inorganic salt precipitation on oil field recovery was analyzed.
Introduction
As indicated by relevant studies on CO2 flooding for enhanced oil recovery (EOR), the injected CO2 is involved in strong chemical reactions with the formation brine, and the generated precipitates block the rock pore throats and reduce the porosity and the permeability of the reservoir. This leads to significant changes in the physical properties of the formation rocks (Fischer et al., 2010; Zhao et al., 2010; Liu et al., 2012; Yu et al., 2012; Alam et al., 2014; Lu et al., 2016) and thereby lowers the oil recovery rate.
The laboratory experiment is the most commonly used method to investigate the CO2–brine interaction. The research results by Wigand et al. (2008), Ketzer et al. (2009), Fischer et al. (2010), and Wandrey et al. (2011) are the most representative. Studies have shown that the reaction between CO2 and formation brine is reversible, the equilibrium of which is affected by temperature, pressure, and the mineralization degree of the formation brine. Inorganic carbonate precipitates are formed in the case of over-equilibrium.
Upon dissolving in the formation brine, most CO2 still exist in the form of free molecules, while only a small fraction of CO2 combines with the formation brine to form carbonic acid (H2CO3). Due to the dissociation of H2CO3, bicarbonate () and carbonate () ions are further generated, which then interact with scale-forming ions in the formation brine to produce inorganic carbonate precipitation (e.g., CaCO3 and MgCO3).
Sbai (2011) described the kinetic mechanism of solid particle suspension in porous media and suggested that these particles may cause clogging of the pores. Shiraki and Dunn (2000), Assayag et al. (2009), Bacci et al. (2010) and Luquot et al. (2012) conducted a series of CO2 core displacement experiments under reservoir conditions. The experiments indicated that when CO2 is injected into geological reservoirs, it reacts with the formation brine to form carbonates, and the precipitation of carbonates significantly affects the porosity and the permeability of the formation rocks.
Employing numerical simulation technology, Zeidouni (2009) simulated the carbonate precipitation phenomenon during the CO2 flooding process and evaluated the impact of salt precipitation on oil field development. Yang et al. (2010) and Delshad et al. (2010) also conducted corresponding studies to simulate CO2 distribution during the CO2-EOR process.
At present, most studies are qualitative research studies that have not quantified the influencing factors of the precipitation amount. Based on previous research results, in this paper, the influences of various environmental factors (e.g., pressure difference, temperature, and scale-forming ion concentration) on precipitation formation from the reaction of CO2 and brine were investigated quantitatively. Meanwhile, using the PHREEQC software, the effect of pH values was also simulated, and the corresponding exponential mathematical characterization formula was established via mathematical regression. On this basis, the Eclipse E300 module was used with the mathematical characterization formula to correct mathematical model parameters, optimize reservoir engineering parameters, simulate the distribution pattern of inorganic salt precipitation generated during the CO2-EOR process in a block of oil field C, and determine the effect of precipitation on the oil field’s ultimate recovery rate.
Determination of Precipitation Amount After the Interaction of CO2 and Formation Brine
Experimental Method and Procedure
In this experiment, formation water, taken from three wells in a block of oil field C (the water properties are shown in Table 1), was used as the medium. Afterward, CO2 was injected into a high-temperature and high-pressure reaction device (Figure 1) filled with 100 ml formation water until saturation was reached. Using the ISCO pump to raise the pressure of the device to the target pressure (8–16 MPa), it was put into the thermostat, and the pressure and the temperature (20–80°C) were kept stable and left to stand for 6 days. Subsequently, the pressure was released to atmospheric pressure and the system was left still for 1 day, followed by the determination of ion concentrations, precipitation composition, and precipitation amount.
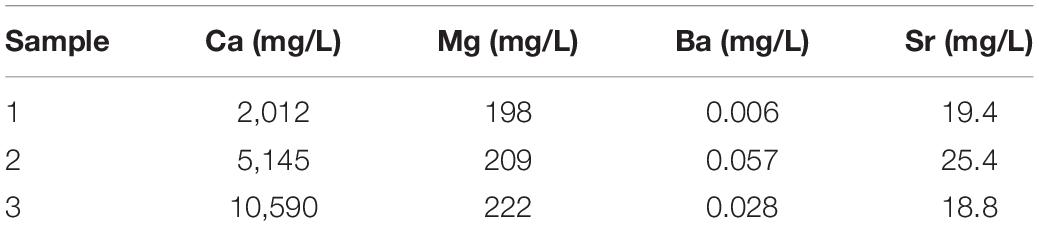
Table 1. The scale-forming ion analysis of the formation of brine sample.
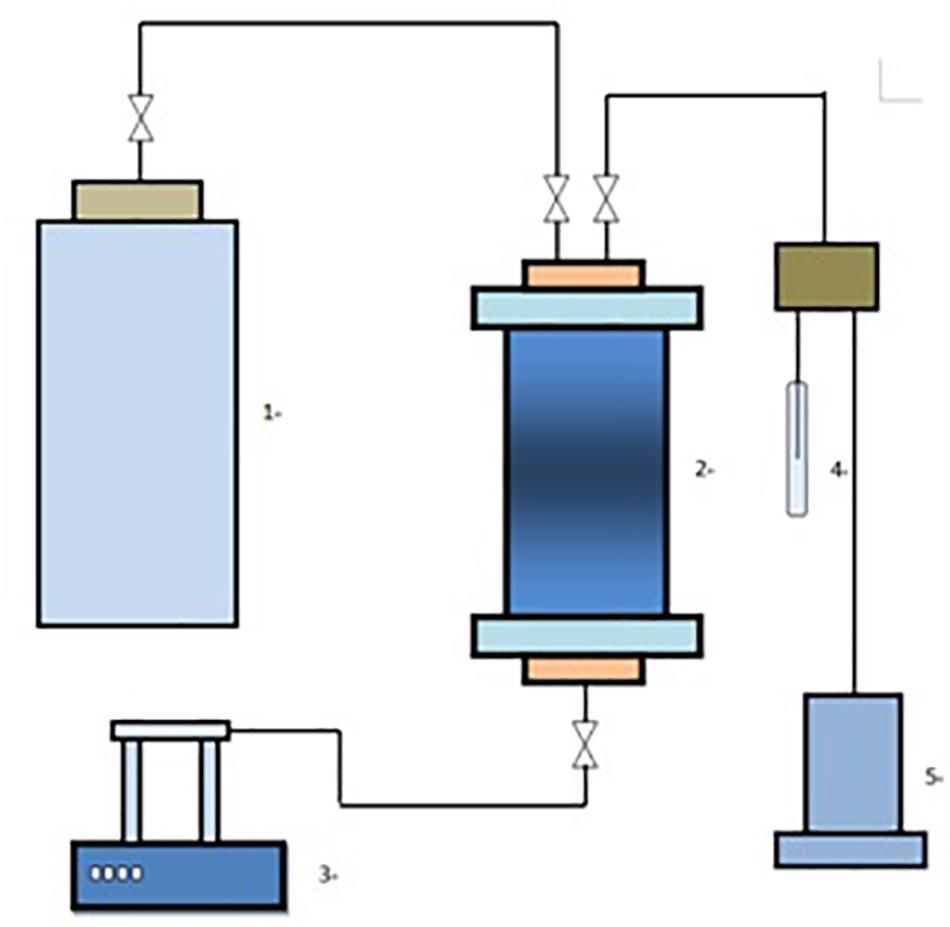
Figure 1. Schematic diagram of the experimental device. (1, CO2 gas tank; 2, high-temperature and high-pressure reactor; 3, ISCO pump; 4, test tube; 5, return pressure buffer).
The scale-forming ions in the formation brine sample were mainly Ca2+, Mg2+, Ba2+, and Sr2+. Among them, Ca2+ was the main component, taking up 95% of the total scale-forming ions, followed by Mg2+. The concentrations of Ba2+ and Sr2+ were very low.
Experimental Results
According to the principle of orthogonal experiment design, three brine samples with varied properties were employed for static experiments under different temperature (20, 30, 50, and 80°C) and pressure difference (8, 10, 12, and 16 MPa) conditions.
The concentrations of Ca2+ in the initial formation brine and the liquid samples taken out of the system each time were determined by inductively coupled plasma emission spectrometry. By subtracting the Ca2+ concentration in the initial formation brine from the Ca2+ concentration of each liquid sample, the variation of the Ca2+ concentration under different temperature and pressure conditions was obtained, which was then used to calculate the mass of CaCO3 precipitation based on the molecular weight of the precipitate.
Since the experimental pressure was too high to measure the pH value of the solution, the PHREEQC software was applied to fit the experimental and the simulation results of the precipitation amount under different pH conditions to obtain a complete set of data. The experimental and the simulation results are shown in Table 2.
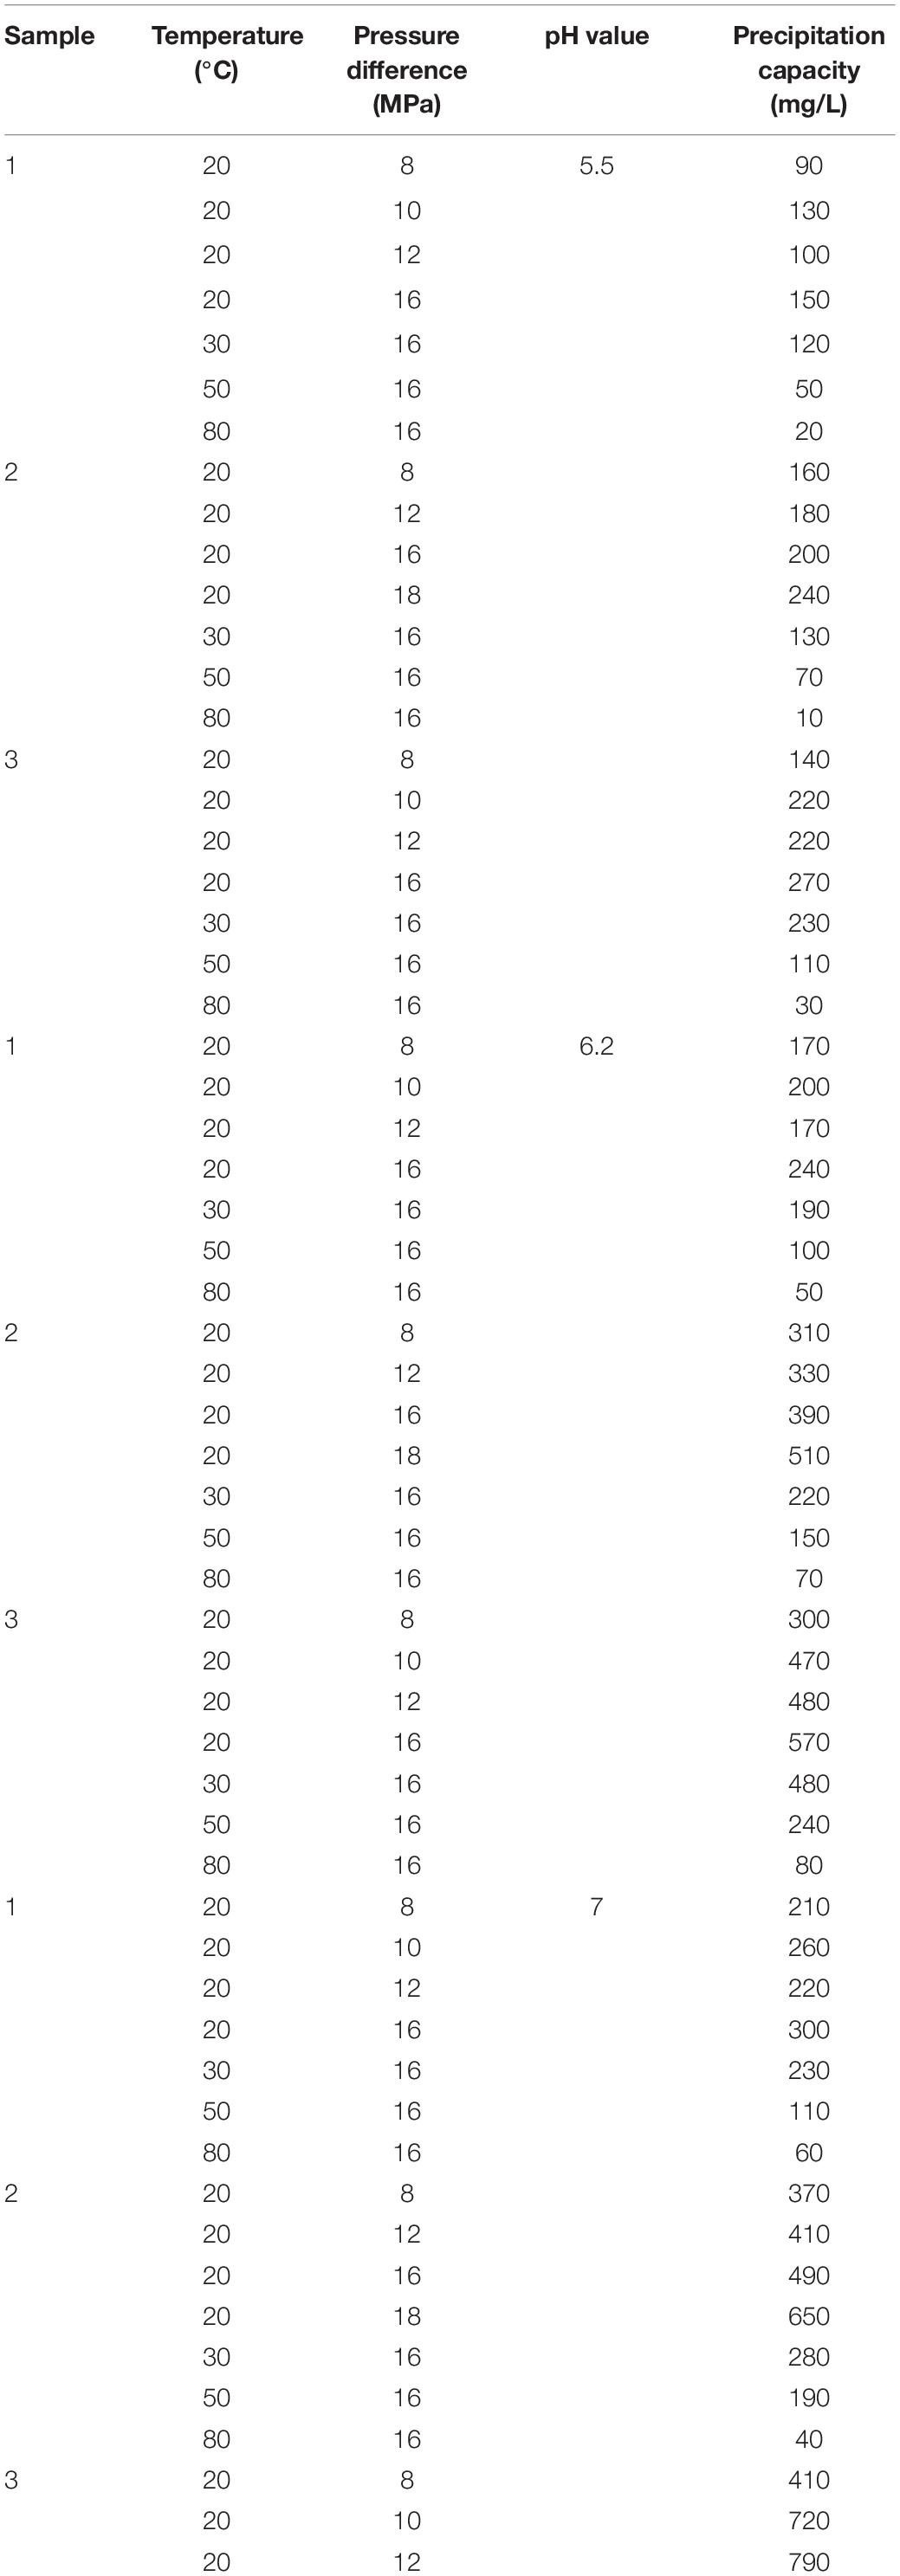
Table 2. The experimental and the simulation results of the precipitation amount.
In order to confirm the presence of inorganic carbonate, the precipitates produced in the experiment were processed and tested for elemental composition (Figure 2). The main elements in the precipitates were C, O, and Ca and a small amount of Mg. The main inorganic salt precipitate produced by the reaction was CaCO3, with the rest being CaCl2 and MgCl2. The ratio of the three precipitates (CaCO3:CaCl2:MgCl2) was 10:0.25:1. The specific concentrations are shown in Table 3.
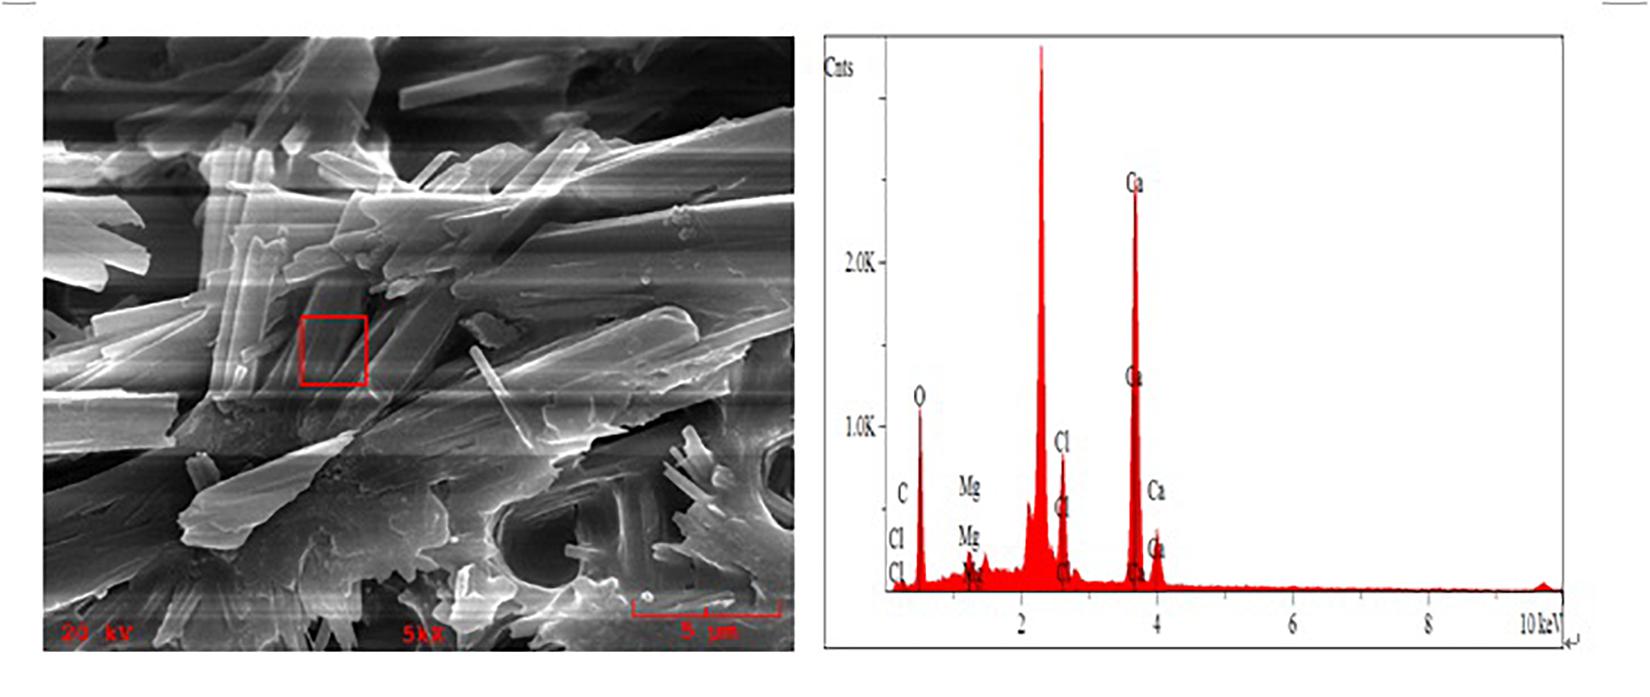
Figure 2. SEM images and energy spectrum of the precipitates.
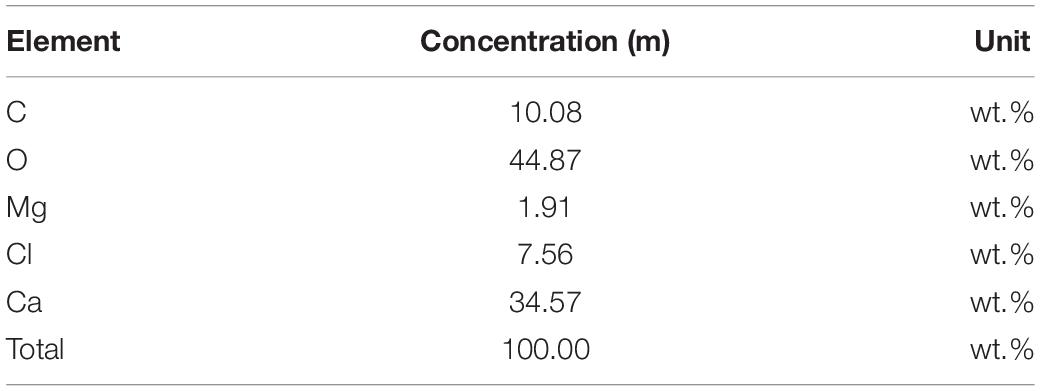
Table 3. Elemental composition of the precipitates generated from CO2–formation brine interaction.
Precipitation Factor Analysis and Mathematical Characterization Method of CO2–Formation Brine Interaction
Analysis of Mechanism and Influencing Factors of Precipitation Formation From CO2–Formation Brine Interaction
Reaction Mechanism
The precipitation formation from CO2–formation brine interaction can be described by the following chemical reactions:
The precipitation and the dissolution of inorganic salts is a chemical equilibrium process. According to the chemical equations, the reversible reactions are affected by the concentrations of , , Ca2+, and H+ in the solution.
Therefore, the conversion form of the CO2–brine system must be clarified first.
Gaseous CO2 dissolves in brine and forms H2CO3:
H2CO3 then further ionizes:
Based on Eqs (4–6), the following equations can be obtained:
KCO_2 is the equilibrium constant for the dissolution of CO2, while K1 and K2 are the equilibrium constants for H2CO3 dissociation and dissociation, respectively. The values in the square brackets represent the activity of each ion.
Under ambient temperature conditions, only H2CO3 exists in acidic (pH < 4.5) brine, while mainly exists in an alkaline (8.34 < pH < 12) environment. As for neutral, weakly acidic, and weakly alkaline brine, the main species is HCO3–, without the presence of . Moreover, this phenomenon is very weakly affected by temperature or fluid pressure (Zai-Hua and Dreybrodt, 2005).
The pH value of the formation brine used in this study is 6.2 at normal temperature and pressure. Thus, the ionization of Eq. 6 would not proceed. Therefore, it can be determined that the precipitation mechanism of the CO2–formation brine interaction is as described by reactions (1) and (2).
It is generally considered that as long as the ion product of CaCO3 is greater than its solubility product, CaCO3 will precipitate. However, in actuality, CaCO3 will only precipitate and deposit when the supersaturated state is exceeded. This is because CaCO3 is a slightly soluble inorganic salt, and in its saturated solution, the supersaturation is often significantly greater than the solubility, causing the crystal nuclei to cease growing after nucleation. Therefore, only extremely high ion concentrations in the solution enable the growth and the precipitation of crystal nuclei.
Analysis of Influencing Factors
Influence of temperature
Figure 3 shows that temperature has a significant impact on the production of precipitation; the higher the temperature, the less precipitation there is. Moreover, the amount of precipitation is more sensitive to temperature when the scale ion content is high.
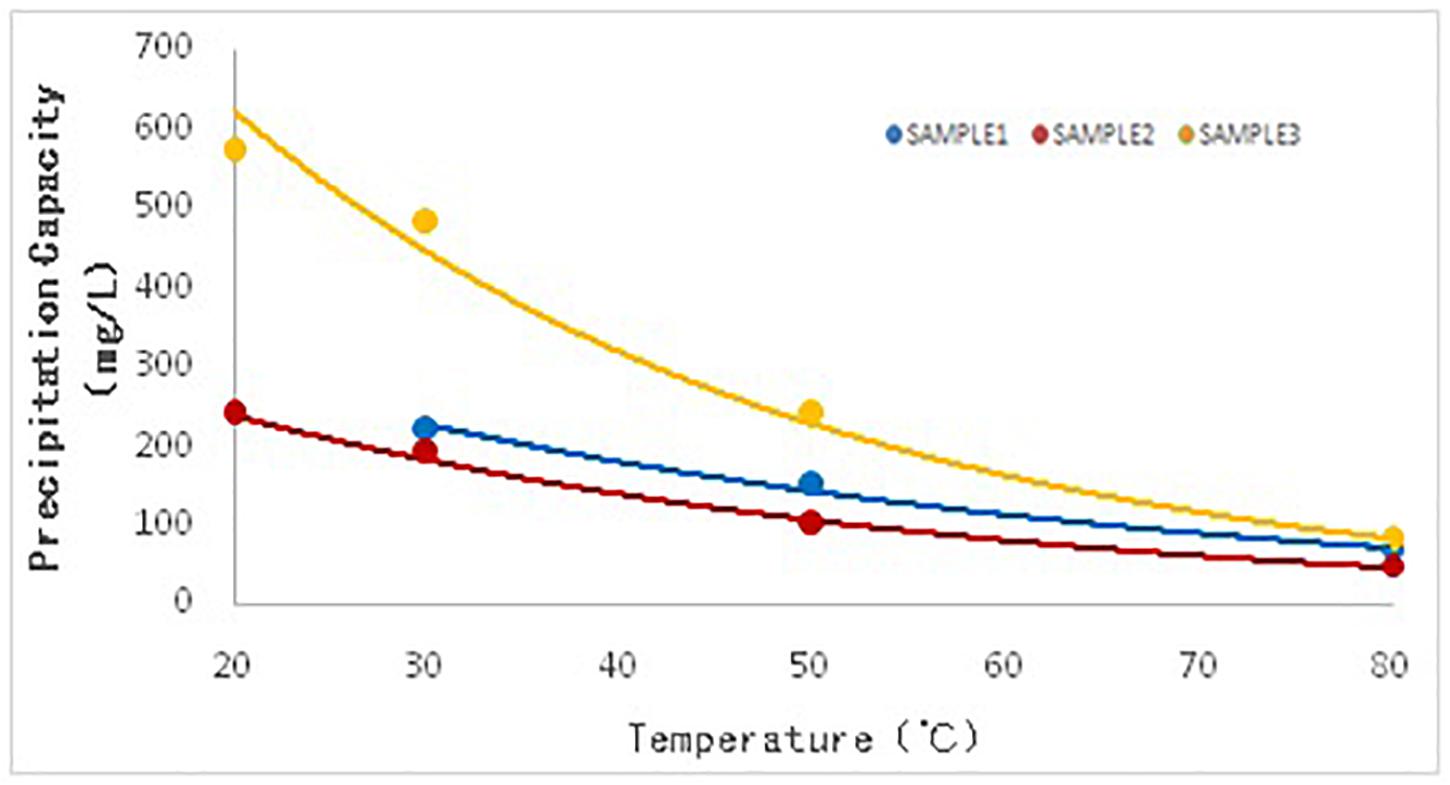
Figure 3. The relationship between temperature and the precipitation capacity of inorganic salt.
The phenomenon is evidently closely related to the solubility of the CO2–formation brine system (i.e., temperature has a significant influence on H2CO3 formation from the dissolution of CO2 in brine).
With a constant PCO_2, KCO_2 is inversely proportional to temperature. This is because temperature is inversely proportional to CO2 solubility in brine, and the activity of H2CO3 decreases when temperature increases, leading to a lower HCO3– concentration from its dissociation. Even if the chemical reaction rate increases upon temperature elevation (Shukla et al., 2010), the total amount of CaCO3 precipitates will still decrease.
Influence of pressure difference
A pressure increase does not lead to precipitation; conversely, precipitates appear upon lowering the pressure. This is because a higher pressure means a higher PCO_2, under a constant temperature. The activity of H2CO3 in the CO2–formation brine system improves with a higher PCO_2, which indirectly results in a higher activity of H+ and thus increased acidity of the solution. Moreover, the solubility product of CaCO3 is proportional to PCO_2. Thereby, even if the amount of CaCO3 produced increases, it will only reach a saturated stable state without precipitation.
When the pressure starts to decrease, PCO_2decreases, implying a lower solubility product of CaCO3. Thus, CaCO3 crystals grow and precipitate out of the solution.
Influence of scale-forming ion concentration
From Figure 5, we can see that the greater the scale ion content, the more sediment will be formed.
This is caused by the oversaturation of CaCO3. The CaCO3 saturation formula is:
where SC is the saturation degree of CaCO3, KC is the activity product of CaCO3, and the values inside the square brackets represent the activity of each ion.
The increased concentration of scale-forming ions implies a higher concentration of free Ca2+ ions, and the solution is highly supersaturated in terms of Ca2+, which results in higher nucleation and growth rate of CaCO3 (Al Nasser and Al Salhi, 2014). According to formula (10), SC increases, promoting the generation and the precipitation of CaCO3. The activity of H+ decreases rapidly with the increase of Ca2+ concentration, which is also very beneficial to the formation of CaCO3.
It needs to be noted that in “Practical Aspects of CO2 Flooding,” Perry and Charles (2002) pointed out that the salinity of the brine also affects the solubility of CO2; specifically, the higher the salinity, the lower the solubility. However, in the current experiment, CO2 dissolves in brine to form H2CO3, which then dissociates to generate HCO3–. The HCO3– ions then react with the large amount of Ca2+ in the solution to form CaCO3, which in turn causes more CO2 to dissolve in brine and promotes the formation of more CaCO3. The CaCO3 generated will then precipitate after supersaturation is reached.
Influence of pH
Glenn and Reginald (2003) believes that the dissolution of CO2 in formation brine from the formation fluids lowers the pH value of the formation brine and that CaCO3, a weak acid salt, is greatly affected by the pH value, which is the main controlling factor of generation from H2CO3 dissociation. A higher pH value leads to increased HCO3– concentration and enhanced HCO3– activity and thereby an increase in the amount of CaCO3.
Mathematical Characterization Method of Precipitation Amount From CO2–Formation Brine Interaction
According to Figures 4–6, the inorganic salt precipitation amount has an exponential relationship with temperature, pressure difference, and scale-forming ion concentration. The following mathematical formulas can be used:
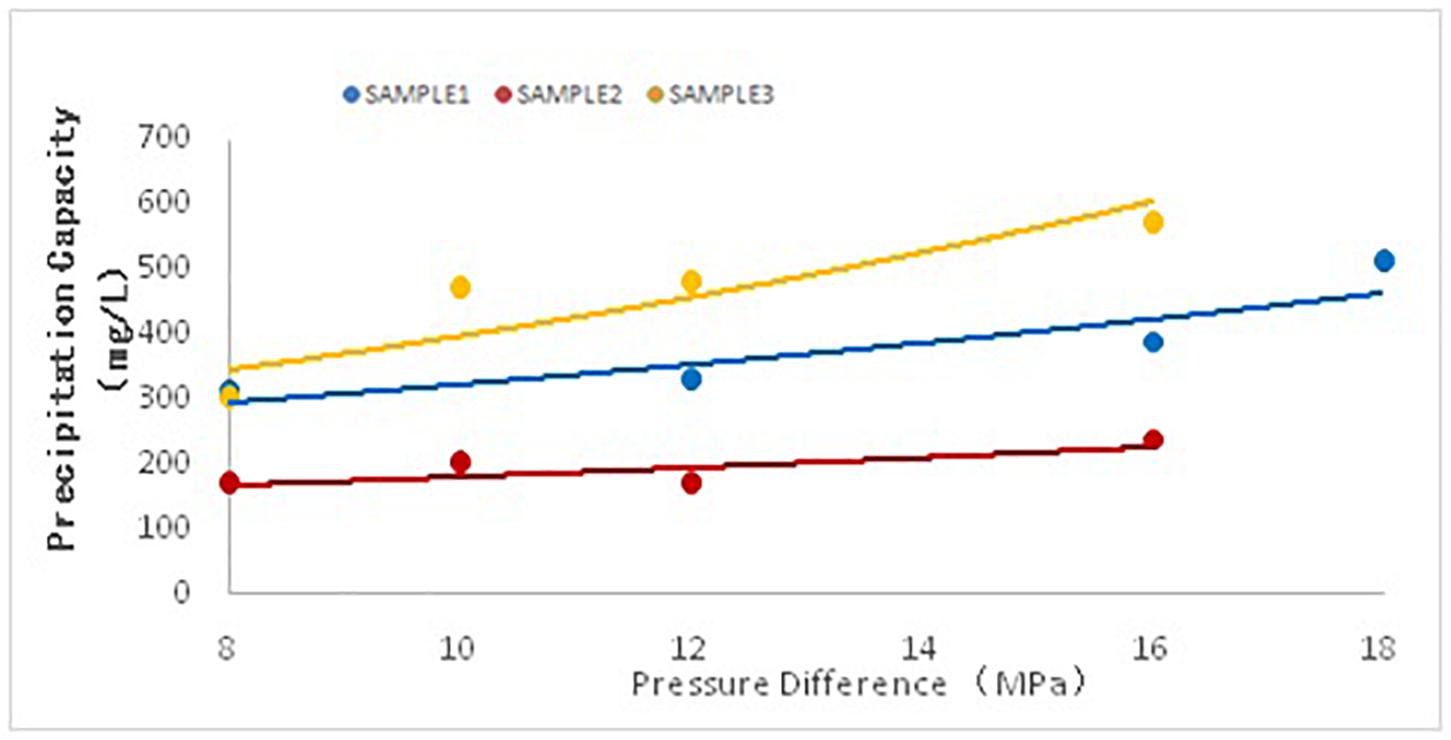
Figure 4. The relationship between pressure difference and precipitation capacity.
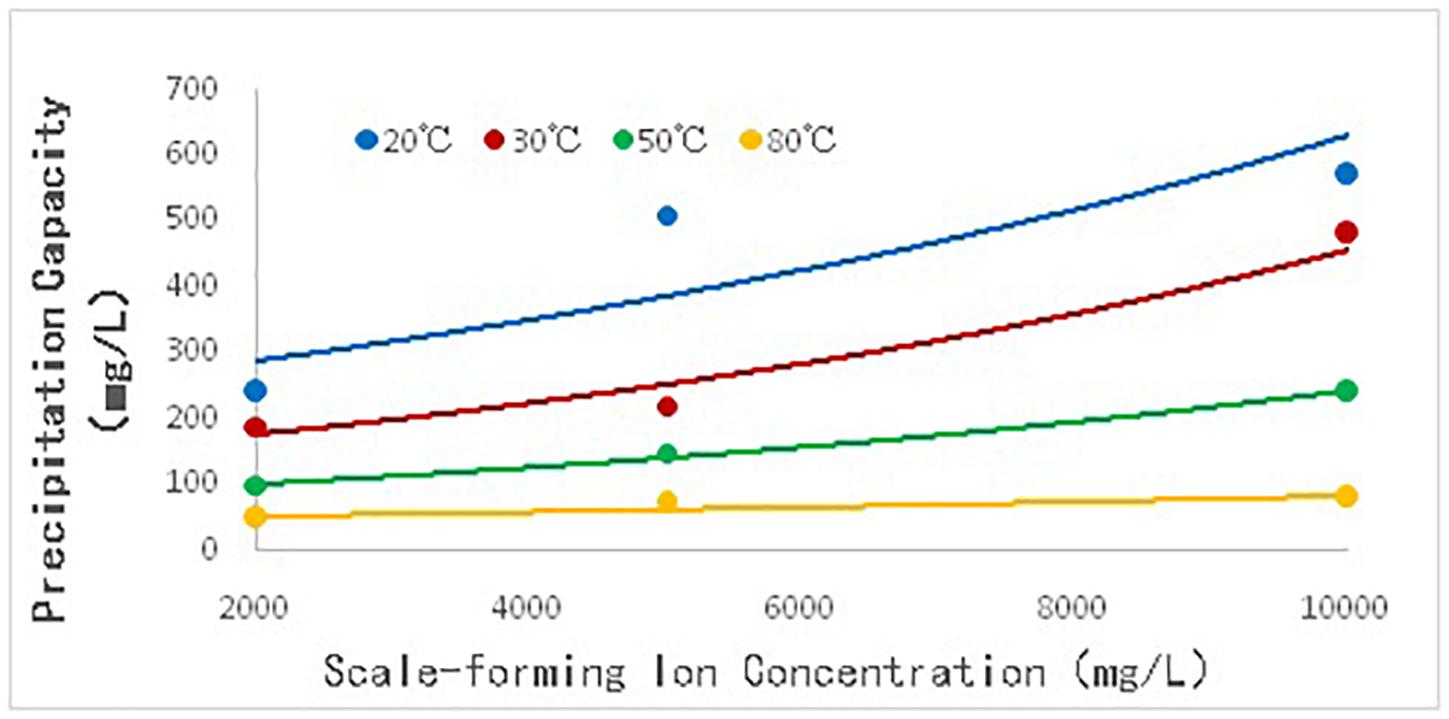
Figure 5. The relationship between scale-forming ion content and precipitation capacity.
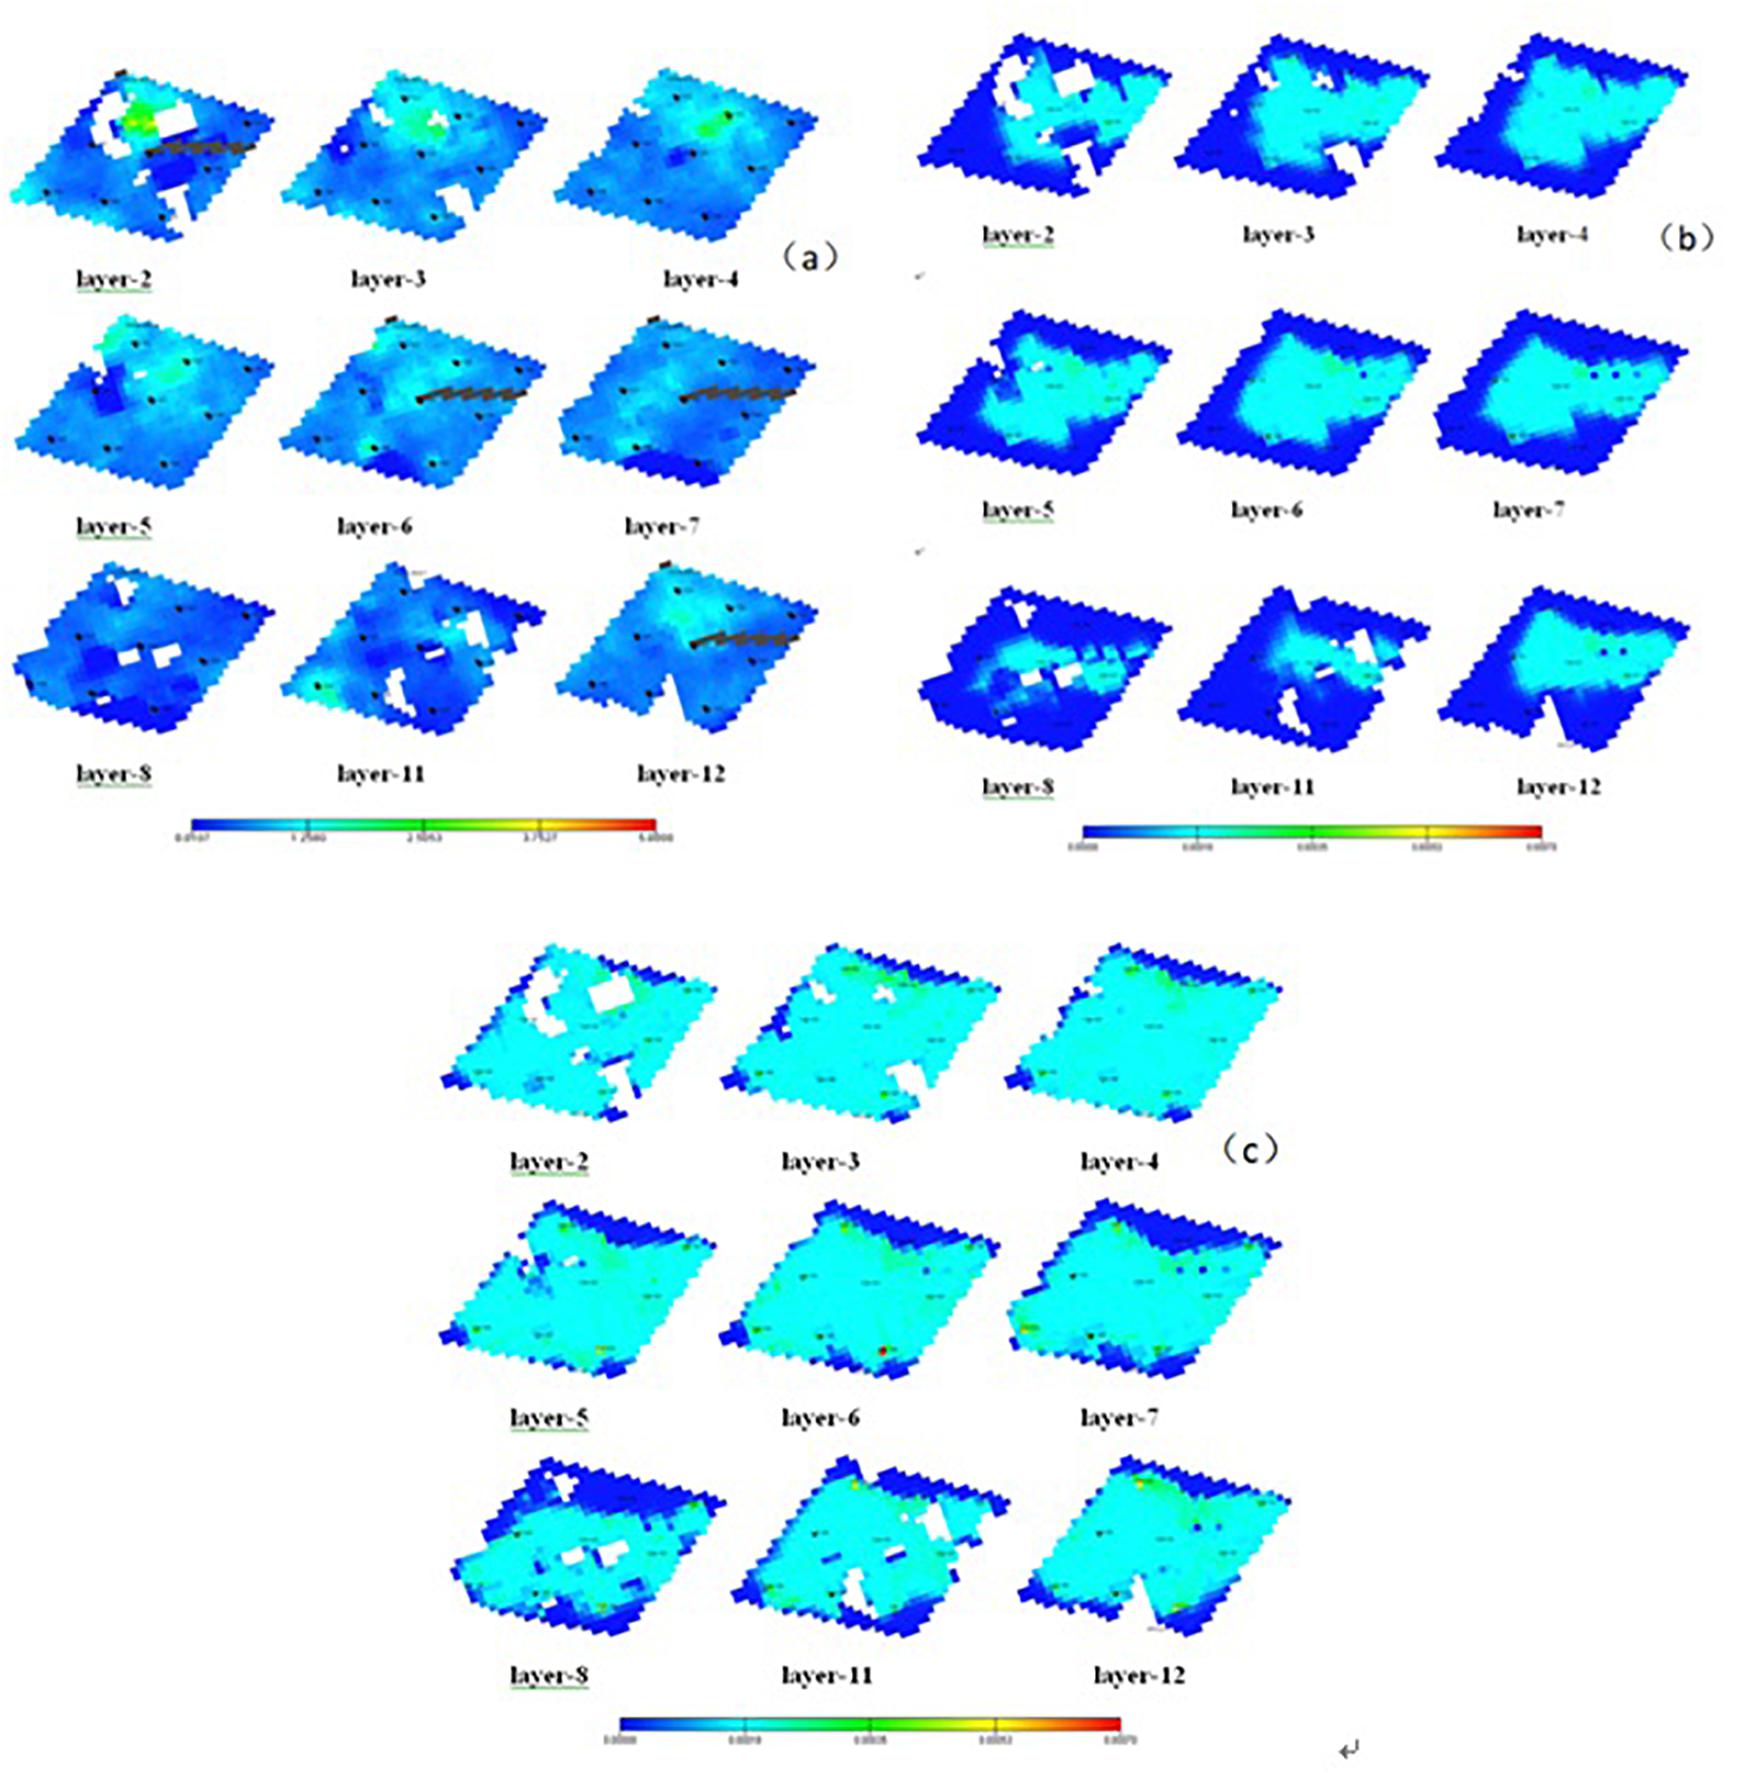
Figure 6. (A) Formation permeability at different horizons. (B) Inorganic salt precipitation distribution after 10 years of production. (C) Inorganic salt precipitation distribution after 40 years of production.
y = aebx (11)
Take the logarithm of both sides of (Eq. 11):
lgy = lga + bx (12)
Assign Y as lgy:
Y = lga + bx (13)
Equation 13 is a linear equation where Y changes linearly with X, and the data in Table 3 were substituted into Eq. 13 for linear regression. Each X value has a corresponding actual value Y1 and predicted value Y2. In order to minimize the square of the difference between the two values, set:
(14)
Expand the brackets and take the average value:
(15)
By solving the partial derivatives of Q toward a and b, respectively, and assigning 0 to the partial derivatives, the solution formulas of a and b were obtained:
(16)
As suggested by Table 4, the standard error is very small, indicating a high parameter accuracy. The corresponding P-value is less than 0.05–0.0001, and the confidence of the model is as high as 95–99.99%.
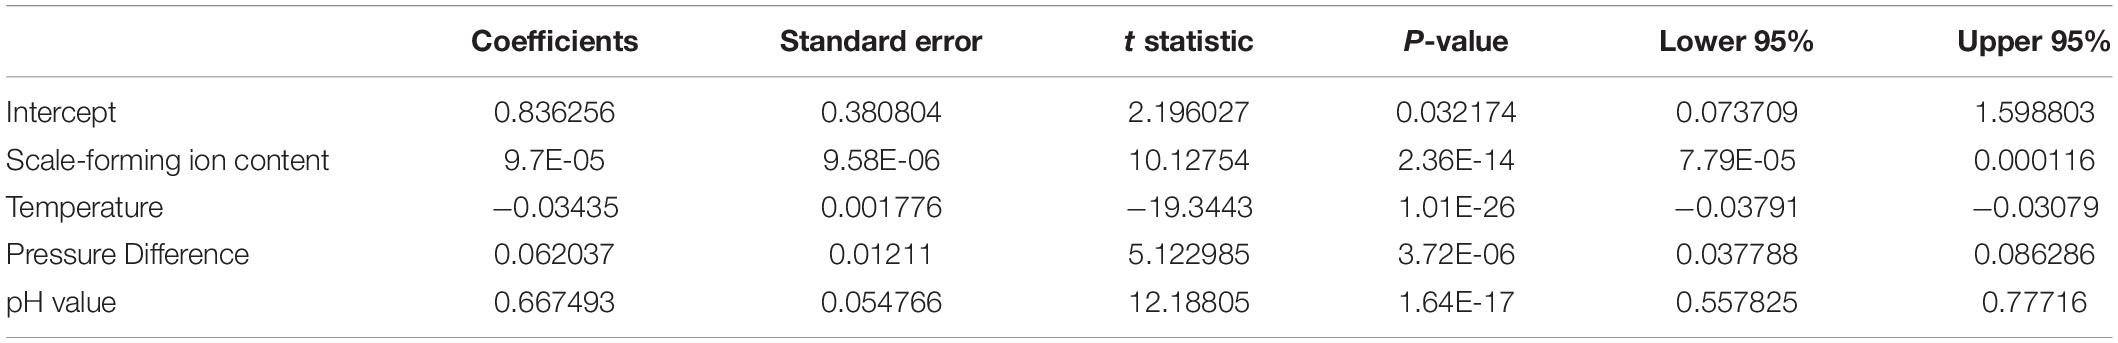
Table 4. Regression parameters.
Therefore, the quantitative characterization equation of inorganic salt precipitation can be obtained:
where y is the precipitation amount (mg), T is the temperature (°C), ΔP is the pressure difference (MPa), M is the concentration of scale-forming ions (mg/L), and pH is the pH value of the solution.
Analysis of Influence of Precipitation From CO2–Formation Brine Interaction on Oil Field Development
Establishment of Reservoir Numerical Model Considering Inorganic Salt Precipitation
The reservoir in a block of oil field C has an average porosity of 10.01% and a permeability of 0.3 mD. It is classified as an ultra-low permeability reservoir with an extremely low asphaltene concentration. The formation brine contains a high concentration of calcium ions (12,150 mg/L). The burial depth of the reservoir is 2,700–2,900 m, with the formation temperature and pressure being 80°C and 21 MPa, respectively. Meanwhile, the comprehensive brine cut is 53%. The research block is a rhombic anti-nine-point well pattern with a water drive recovery factor of 35.4%, and there is a high permeability zone connecting the injection and the production well inside the well pattern.
First, a suspended precipitation module was established, which simulated the precipitation formation with the production well. Thereby, the precipitation amount generated by the CO2–brine interaction could be directly output through the software. Then, the precipitation amount was fitted using Eq. 17 to obtain the key parameter: the reactant H2O coefficient and the chemical reaction rate constant. On this basis, an adsorbed precipitation module was established for simulating the precipitation effect.
The CaCO3 precipitation reaction is determined by the chemical reaction equation and the reaction rate. The chemical reaction equation is realized by adjusting the chemical reaction coefficient of the reactant and the product, and the specific process is as follows.
Chemical reaction equation:
SRri: reaction coefficient of reactant Ci
SPri: reaction coefficient of product Ci
Reaction rate:
Vb: rock pore volume
Ar: reaction rate constant
Er: reaction energy
R: gas constant
T: temperature
nri: component index
Suppose the initial solid saturation is 0 and the final output solid saturation is the resulting precipitation saturation, the effect of solid deposition on fluidity is obtained. Changes in fluidity can also reflect changes in permeability.
xpc: molar fraction of components
ks: fluidity multiplier in the presence of solids
krp: relative permeability of phase p
Sp: saturation of phase p
bp: molar density of phase p
μp: viscosity of phase p
ks: reduced mobility caused by solid adsorption blocking pore throat
The model parameters are shown in Table 5.
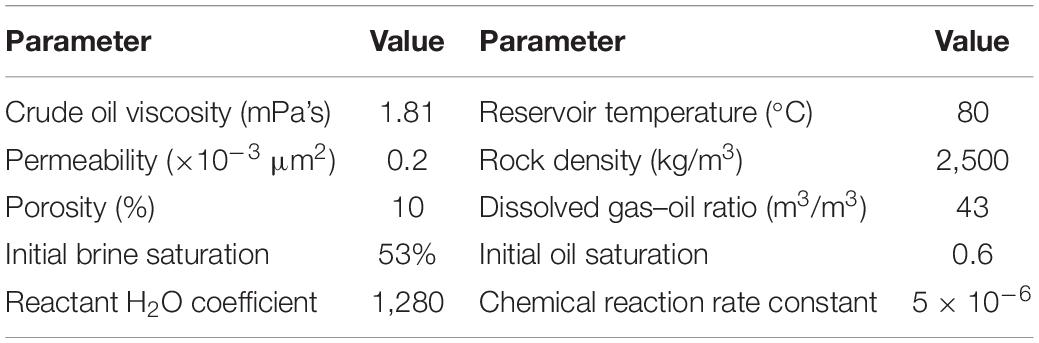
Table 5. Model parameters.
Evaluation of the Influence of Inorganic Salt Precipitation on Development
By simulating the production situation after 10 and 40 years, the inorganic salt precipitation distribution and its influence on the reservoir were obtained, as shown in Figure 6.
Figure 6 displays the precipitation distribution in the reservoir after production. Upon CO2 injection, precipitation first occurs near the high-permeability zone. After 10 years of production, precipitates are gradually formed in the area, with relatively high permeability. In the 40th year, the precipitates are widely distributed in a large area in the research block and reach a maximum value at the production well and its surrounding area. This precipitation trend is because CO2 is first injected along the high-permeability zone where the fluid pressure is relatively high and the CO2 solubility is large in brine. Then, the soluble bicarbonate [Ca(HCO3)2] is formed rapidly from the reaction of CO2 and scale-forming ions in the formation brine. In the presence of a pressure difference in the formation, the reaction equilibrium shifts toward the direction of precipitation, thereby generating calcium carbonate precipitates. The pressure difference at the production well and its surrounding area is the largest, which explains the highest precipitation amount.
Figure 7 shows the distribution of fluidity change in the reservoir at the 40th year of CO2-EOR. The fluidity of the study block decreases generally. This is because, during gas flooding, the pressure in the formation decreases gradually, resulting in the gradual generation of precipitation, which blocks the pore throats and reduces the fluidity.

Figure 7. Coefficient of fluidity change at the 40th year of the CO2 enhanced oil recovery.
Figure 8 illustrates the recovery rate change during the CO2-EOR process with and without considering precipitation. As suggested by the figure, precipitation already has a great impact from the early stage of oil field development, which is mainly due to the rapid reaction of CO2–brine. As the development continues, more and more precipitates are generated, blocking the pore throats and reducing the recovery rate. The recovery rate excluding the influence of precipitation was 46%, and it dropped by 7 to 39% when the influence of precipitation was considered.
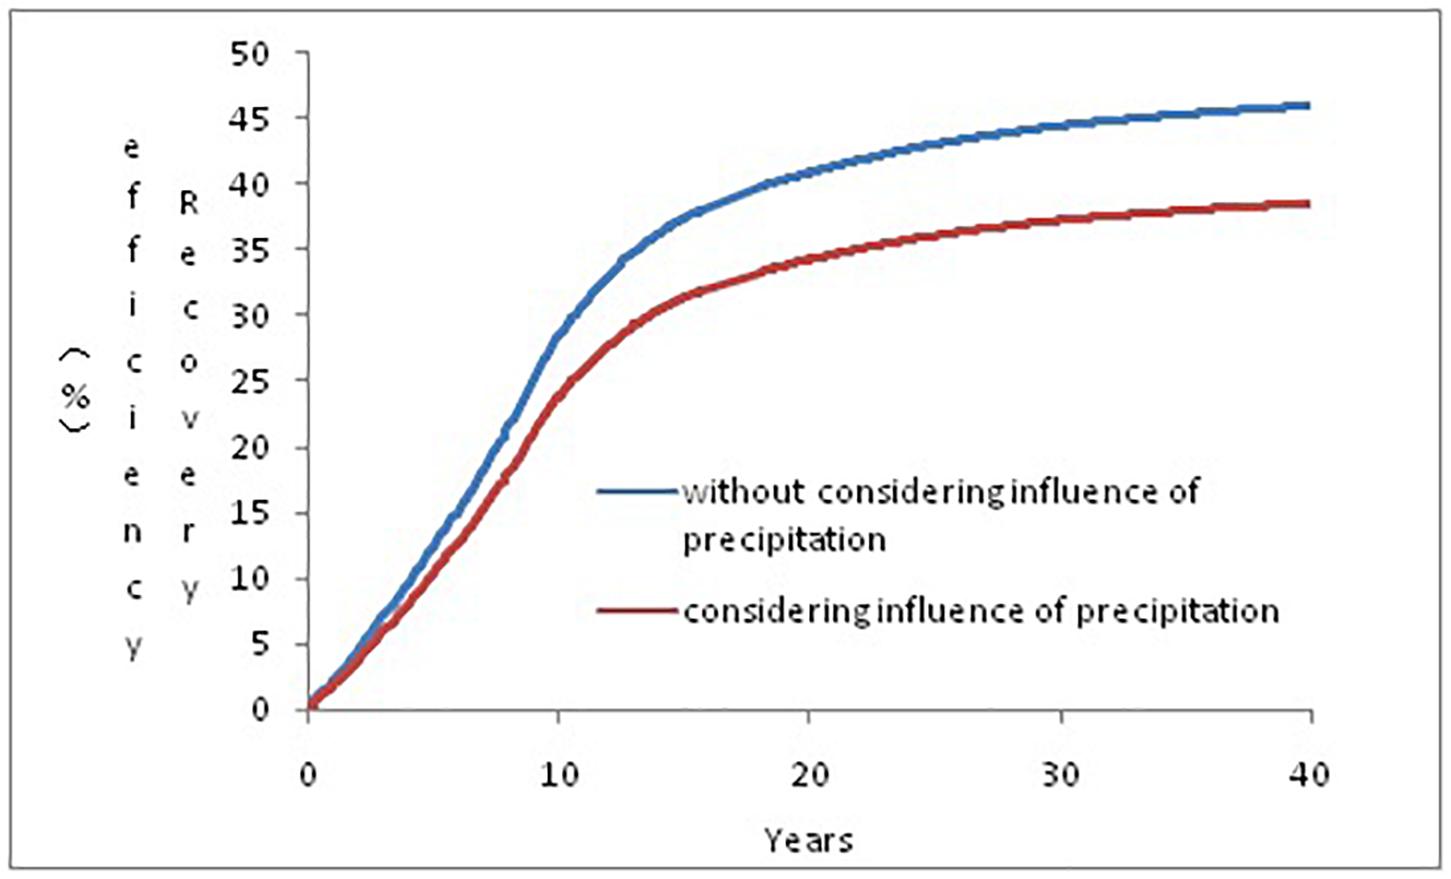
Figure 8. Recovery rate at the 40th year with and without considering the influence of precipitation.
Conclusion
(1) In this paper, based on the static CO2–brine immersion experiment, the reaction laws of the CO2–formation brine system under various pressure difference, temperature, and scale-forming ion concentration conditions were studied. A greater pressure difference led to a larger amount of precipitation, while a higher temperature favored a smaller precipitation amount. Meanwhile, under constant pressure and temperature, greater concentrations of scale-forming ions in the formation brine led to the formation of larger amounts of precipitation.
(2) Quantitative research was conducted on the precipitation amount, and the corresponding exponential mathematical characterization formula was obtained.
(3) According to the numerical model, upon CO2 injection, precipitation first occurs near the injection well. As CO2 continues to migrate to the production well, the corresponding area has the highest precipitation amount.
(4) By employing the modified numerical model, the oil recovery in a block of oil field C was predicted. The recovery rate considering precipitation was 39%, while that excluding the influence of precipitation was 46%, with the difference being 7%. The poor development of the oil field considering precipitation is due to the universal deposition of the precipitates generated from the CO2–formation brine interaction in the reservoir.
Data Availability Statement
The raw data supporting the conclusions of this article will be made available by the authors, without undue reservation.
Author Contributions
All authors listed have made a substantial, direct and intellectual contribution to the work, and approved it for publication.
Conflict of Interest
The authors declare that the research was conducted in the absence of any commercial or financial relationships that could be construed as a potential conflict of interest.
References
Al Nasser, W. N., and Al Salhi, F. H. (2014). Kinetics determination of calcium carbonate precipitation behavior by inline techniques. Powder Technol. 270, 548–560. doi: 10.1016/j.powtec.2014.05.025
Alam, M., Hjuler, M., Christensen, H., and Fabricius, I. (2014). Petrophysical and rock-mechanics of CO2 injection for enhanced oil recovery: experimental study on chalk from South Arne field. North Sea. Pet. Sci. Eng. 122, 468–487. doi: 10.1016/j.petrol.2014.08.008
Assayag, N., Matter, J., Ader, M., Goldberg, D., and Agrinier, P. (2009). Water-rock interactions during a CO2 injection field-test:Implications on host rock dissolution and alteration effects. Chem. Geol. 265, 227–235. doi: 10.1016/j.chemgeo.2009.02.007
Bacci, G., Korre, A., and Durucan, S. (2010). An experimental and numerical investigation into the impact of dissolution/precipitation mechanisms on CO2 injectivity in the wellbore and far field regions. Int. J. Greenh. Gas Control 5, 579–588. doi: 10.1016/j.ijggc.2010.05.007
Delshad, M., Wheeler, M. F., and Kong, X. (2010). A Critical Assessment of CO2 Injection Strategies in Saline Aquifers. Tulsa: Society of Petroleum Engineers.
Fischer, S., Liebscher, A., Wandrey, M., and The CO2 Sink Group, (2010). CO2–brine–rock interaction -First results of long-term exposure experiments at in situ P–T conditions of the Ketzin CO2 reservoir. Chem. Erde 70, 155–164. doi: 10.1016/j.chemer.2010.06.001
Glenn, T. H., and Reginald, T. (2003). The experimental determination of solubilities. Chem. Int. 25, 30–33.
Ketzer, J. M., Iglesias, R., Einloft, S., Dullius, J., Ligabue, R., and Lima, V. (2009). Water–rock–CO2 interactions in saline aquifers aimed for carbon dioxide storage: experimental and numerical modeling studies of the Rio Bonito Formation (Permian), southern Brazil. Appl.Geochem. 24, 760–767. doi: 10.1016/j.apgeochem.2009.01.001
Liu, F., Lu, P., Griffith, C., Hedges, S. W., Soong, Y., Hellevang, H., et al. (2012). CO2–brine–cap rock interaction: reactivity experiments on Eau Claire shale and a review of relevant literature. Int. J. Greenh. Gas Control 7, 153–167. doi: 10.1016/j.ijggc.2012.01.012
Lu, J., Nicot, J.-P., Mickler, P. J., Ribeiro, L. H., and Darvari, R. (2016). Alteration of Bakken reservoir rock during CO2-based fracturing—an autoclave reaction experiment. Unconv. Oil Gas Resour. 14, 72–85. doi: 10.1016/j.juogr.2016.03.002
Luquot, L., Andreani, M., Gouze, P., and Camps, P. (2012). CO2 percolation experiment through chlorite/zeolite—rich sandstone (Pretty Hill Formation–Otway Basin–Australia). Chem. Geol. 294–295, 75–88. doi: 10.1016/j.chemgeo.2011.11.018
Perry, J., and Charles, F. (2002). Practical Aspects of CO2 Flooding. Tulsa: Society of Petroleum Engineers.
Sbai, M. A. (2011). Numerical modeling of formation damage by two-phase particulate transport processes during CO2injection in deep heterogeneous porous media. Adv. Water Resour. 34, 62–82. doi: 10.1016/j.advwatres.2010.09.009
Shiraki, R., and Dunn, T. L. (2000). Experimental study on water–rock interactions during CO2 flooding in the Tensleep Formation, Wyoming, USA. Appl. Geochem. 15, 265–279. doi: 10.1016/s0883-2927(99)00048-7
Shukla, R., Ranjith, P., Haque, A., and Choi, X. (2010). A review of studies on CO2 sequestration and caprock integrity,2010. Fuel 89, 2651–2664. doi: 10.1016/j.fuel.2010.05.012
Wandrey, M., Fischera, S., Zemkea, K., Liebschera, A., Scherfb, A. K., Hillebrandb, A. V., et al. (2011). Monitoring petrophysical, mineralogical, geochemical and microbiological effects of CO2 exposure–Results of long-term experiments under in situ conditions. Energy Procedia 4, 3644–3650. doi: 10.1016/j.egypro.2011.02.295
Wigand, M., Carey, J. W., Schütt, H., Spangenberg, E., and Erzinger, J. (2008). Geochemical effects of CO2 sequestration in sandstones under simulated in situ conditions of deep saline aquifers. Appl. Geochem. 23, 2735–2745. doi: 10.1016/j.apgeochem.2008.06.006
Yang, F., Bai, B. J., Tang, D. Z., Shari, D. N., and David, W. (2010). Characteristics of CO2 sequestration in saline aquifers. Pet. Sci. 7, 83–92.
Yu, Z. C., Liu, L., Yang, S. Y., Li, S., and Yang, Y. Z. (2012). An experimental study of CO2–brine–rock interaction at in situ pressure–temperature reservoir conditions. Chem. Geol. 326–327, 88–101. doi: 10.1016/j.chemgeo.2012.07.030
Zai-Hua, L., and Dreybrodt, W. (2005). Equilibrium chemistry of the CaCO3- CO2-H2O system and discussions. Carsol. Sin. 24, 1–14.
Zeidouni, M. (2009). Analytical solution to evaluate salt precipitation during CO2 injection in saline aquifers. Energy Procedia 1, 1775–1782. doi: 10.1016/j.egypro.2009.01.232
Keywords: CO2–formation brine, inorganic salt precipitation, mathematical characterization formula, numerical simulation, CO2-EOR
Citation: Yuan Z, Liao X, Zhang K, Zhao X, Chu H and Zou J (2020) Mathematical Characterization of Inorganic Salt Precipitation From the Reaction of CO2 With Formation Brine and Its Application. Front. Energy Res. 8:141. doi: 10.3389/fenrg.2020.00141
Received: 13 April 2020; Accepted: 10 June 2020;
Published: 14 July 2020.
Edited by:
Wei Yu, The University of Texas at Austin, United StatesReviewed by:
Hongbing Xie, Beijing Karst Technology Co., Ltd., ChinaMauricio Xavier Fiallos Torres, The University of Texas at Austin, United States
Copyright © 2020 Yuan, Liao, Zhang, Zhao, Chu and Zou. This is an open-access article distributed under the terms of the Creative Commons Attribution License (CC BY). The use, distribution or reproduction in other forums is permitted, provided the original author(s) and the copyright owner(s) are credited and that the original publication in this journal is cited, in accordance with accepted academic practice. No use, distribution or reproduction is permitted which does not comply with these terms.
*Correspondence: Zhou Yuan, eXVhbnoxOTg3QDE2My5jb20=