 Feng Xiang
 Zhou Tao2,3,4*
- 1School of Nuclear Science and Engineering, North China Electric Power University, Beijing, China
- 2Institute of Nuclear Thermal-Hydraulic Safety and Standardization, North China Electric Power University, Beijing, China
- 3Beijing Key Laboratory of Passive Safety Technology for Nuclear Energy, North China Electric Power University, Beijing, China
- 4Southeast University, Nanjing, China
The study of the commonness and differences of natural circulation of different liquid metals plays an important role in improving the safety of reactors. The numerical simulation of liquid metal natural circulation heat transfer was carried out by CFX, and its heat transfer coefficient, flow, and outlet temperature were studied. The factor analysis method was used to analyze the influence of the interaction between factors and the contribution rate of each factor. It can be found that the commonality of heat exchange between different liquid metals is that the heat transfer coefficient is mainly affected by the power, the contribution rate of power to the heat transfer coefficients of liquid sodium, sodium-potassium alloy, lead, and lead-bismuth alloy reached 40.16, 78.16, 97.95, and 92.19%, respectively; the flow rate and outlet temperature of the liquid metal increase with the increase of power; the flow rate and outlet temperature are hardly affected by pressure. The difference is that the heat transfer coefficients of liquid metals have different trends with the change of power; in addition, the interaction between the factors of heat transfer coefficient is different; the heat transfer coefficient of liquid sodium and sodium-potassium alloy is affected by pressure, the pressure affects the heat transfer coefficient by coupling with power or inlet temperature. In general, the heat transfer performance of sodium is the best, with a much higher heat transfer coefficient than the other three liquid metals; the natural circulation ability of sodium-potassium alloy is the strongest, and its flow velocity is greater than other liquid metals.
Introduction
Natural circulation has a very broad application prospect in reactor safety, and it is also widely used in other industries. The passive natural circulation (Ma et al., 2017; Wang et al., 2018; Yagov et al., 2019) can simplify the system in the reactor and reduce the system's dependence on the reliability of the external power supply, which greatly improves the inherent safety of the reactor. The safety performance of the third generation AP1000 (Hashim et al., 2014) is 100 times higher than that of the second generation nuclear power plant. One of its features is that the safety system adopts the passive natural circulation principle in many places. GM's SBWR reactor (Duncan, 1988) and the Swedish PIUS reactor all use natural circulation to ensure reactor safety. The US S5G, S6G, and S8G nuclear submarine reactors (Liu, 2015) are natural circulation pressurized water reactors. The initial interest in the study of liquid metals was in the design of fast neutron reactors. This is mainly because the liquid metal (Xie et al., 2016) has a high power density active zone, excellent thermal, and nuclear physical properties, which enables efficient energy extraction from the reactor. At present, the coolant of the fast breeder reactor developed by various countries is mainly sodium or sodium-potassium alloy. The chemical properties of sodium and sodium-potassium alloy are particularly active. They are easily reacted with water, oxygen, etc., causing combustion or even explosion. Therefore, the study of coolant heat transfer characteristics is a very important technical and safety issue during the operation, maintenance, and decommissioning of sodium-cooled fast reactor. Liquid lead and lead-bismuth alloy (Gaiying et al., 2012) are the main candidate materials for ADS coolant, which has excellent thermal properties, such as high density, chemical inertia, and natural circulation ability similar to water. In view of the heat transfer characteristics of the natural circulation of liquid metal, scholars from various countries have done some research in recent years. Chang and Hahn (2002) used SSC-K software to calculate the sodium boiling under KALIMER severe accident, and obtained the curves of interface heat transfer, liquid film thickness and heat transfer coefficient. Ma et al. (2007) studied the natural circulation steady state of heavy metal loops, and concluded that the temperature difference between the system geometry and the hot and cold sections have an effect on the natural circulation flow of heavy metal fluids. Based on the NACIE experimental bench, Tarantino et al. (2008) conducted a related study on the flow of lead-bismuth alloy natural circulation, and analyzed the experimental results. Gao et al. (2015) measured the diffusion coefficient of Ni and Cr in liquid lead-bismuth alloy by using a capillary tube, and obtained the diffusion coefficient of LBE from the experimental data of nickel concentration. Watanabe et al. (2015) studied the evaluation method of the residual heat removal system of the natural circulation of sodium cooled fast reactor. The reliability of the safety analysis of sodium cooled fast reactor was verified by comparison with the three-dimensional analysis of the turbulence model. Borgohain et al. (2016) conducted a natural circulation experiment in a non-uniform diameter lead-bismuth circuit. The natural circulation of steady state and transient is performed under different power conditions. Factorial analysis is a multi-factor and multi-level experimental design. It can test not only the differences between levels of each factor, but also the interactions between factors. When the level of one factor changes, the effect of another factor or multiple factors changes, which indicates that there is an interaction; otherwise, it implies that there is no interaction and it is independent. Among the above research results, only the natural circulation of a single liquid metal has been studied, and the interaction between factors affecting natural circulation heat transfer has not been analyzed. By comparing the natural circulation flow and heat transfer characteristics of different liquid metals, the commonalities and differences of heat transfer rules are obtained, which has guiding significance for improving the safety of the reactor.
Research Object
Geometric Model
The natural circulation model is established by ANSYS ICEM, which mainly includes preheating section, heating inlet section, heating section, heating outlet section, cooling section, and descending section. The specific structure of the model is shown in Figure 1.
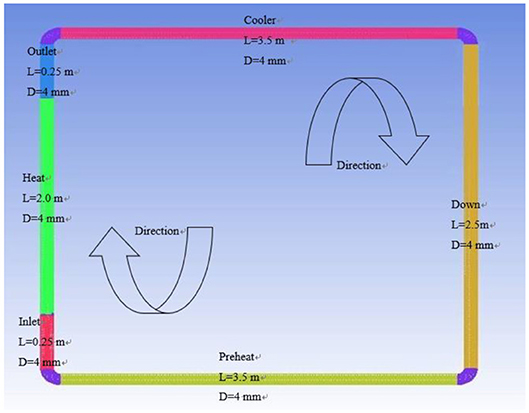
Figure 1. Natural circulation loop.
As can be seen from Figure 1, the natural circulation model of different liquid metals is 2.5 m high, 3.5 m wide, and the pipe diameter is 4 mm. The length of the preheating section is 3.5 m, the length of the heating inlet section is 0.25 m, the length of the heating section is 2 m, the length of the heating outlet section is 0.25 m, the cooling section is 3.5 m, and the descending section is 2.5 m. The preheating section is used to preheat the working fluid in the pipeline to a predetermined temperature. The heating section is used to continue heating the working fluid and reach the operating temperature. The cooling section is used to cool the working medium in the pipeline, and finally the working fluid forms a natural circulation in the pipeline. In order to ensure that the difference in flow and heat transfer is not affected by conditions such as loop size and height, the geometric models of different liquid metals are consistent.
Meshing
The natural circulation loop is meshed, and part of the grid structure is shown in Figure 2.
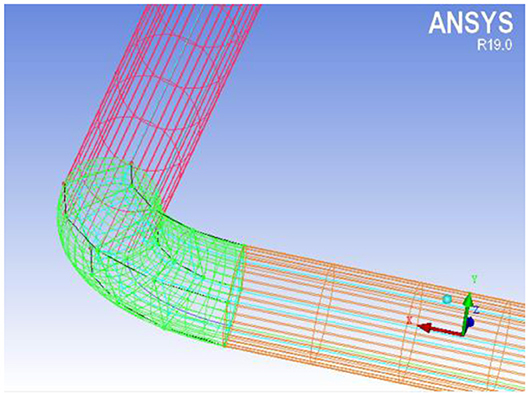
Figure 2. Grid partitioning.
As can be seen from Figure 2, the natural circulation loop model is meshed with o-type grid. In order to improve the accuracy of the calculation, the boundary layer is encrypted in the grid setting, and the number of grids is 823674. The related information of the specific node division at each position is shown in Table 1.
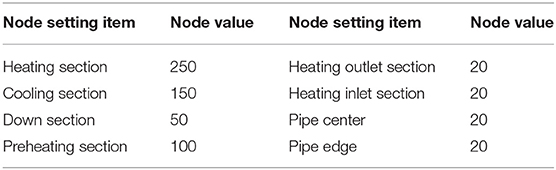
Table 1. Grid node division information.
Boundary Conditions
The boundary conditions are consistent when studying the natural circulation heat transfer characteristics of different liquid metals. Since the melting point of lead is high, the initial temperature of the fluid domain is set to 610 K. When the power is too large, the fluid outlet temperature is very high. Compared with lead and lead-bismuth alloy, the sodium, and sodium-potassium alloy have a lower boiling point. In order to keep the metal in a single-phase liquid state, the maximum power control is 30 kW/m2. In the liquid range, the natural circulation heat transfer characteristics of the four metals were studied. The initial parameters are shown in Table 2.

Table 2. Parameter range.
For the convenience of analysis, the power, pressure, and temperature are represented by the letters A, B, and C, respectively. Then, the effect of interaction between power and pressure is AB, the effect of interaction between power and temperature is AC, the effect of interaction between pressure and temperature is BC, and the effect of total interaction of power, pressure, and temperature is ABC.
Convergence Standard Information
In the control settings of the solver, the specific solver settings, and convergence criteria information are shown in Table 3.
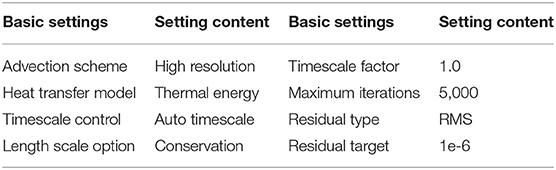
Table 3. Convergence standard information.
Grid Sensitivity Analysis
The effect of the number of grids on the calculation results was studied to test the grid sensitivity. The number of grids is 21640, 548262, 823674, and 1041780, respectively. Taking lead-bismuth alloy as an example, the change of the mainstream temperature with the axial position of the heating section is shown in Figure 3.
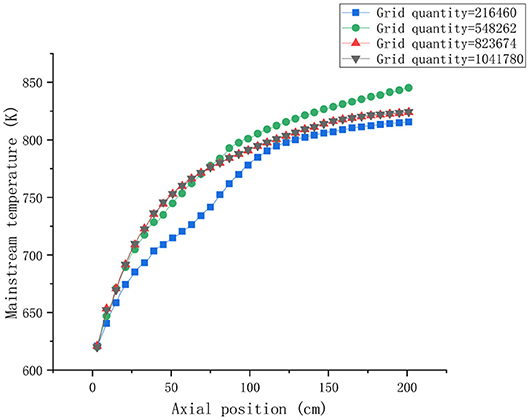
Figure 3. Grid sensitivity analysis.
It can be seen from Figure 3 that the mainstream temperatures at different axial positions are basically the same when the number of grids is 823674 and 1041780. Therefore, it is more suitable to divide the mesh number into 823674 based on the economical and accurate calculation process.
Factorial Analysis Calculation Model
Factorial analysis (Jingjing et al., 2014) is a method of experimental design, which can be used to study the influence of individual factors and the interaction between factors. When the level and number of factors are small, and the relationship between factors and effects is more complicated, then factorial analysis is a good analytical tool. The two-level factorial test of k factors is recorded as a 2k factorial analysis (representing k factors, each factor has 2 levels). This is the most commonly used analysis method, which can use a relatively small sample to obtain more information, especially factor interactive analysis. The comparison of effect AB⋯K is as shown in Equation (1).
(1) In the formula (1), (Contrast)AB...K represents a comparison of effects; a, b, and k represent respective factors. In Expansion (1), use the method of elementary algebra to expand it, and replace “1” with [1], which means that all factors take a low level. The negative sign in the parentheses indicates that the factor is taken, and the positive sign indicates that the factor is not taken. Once the effects are calculated, their estimated effects and their sum of squares can be calculated separately.
Among them, AB…K represents the effect estimate, SSAB…K represents the sum of squares of effects, n is the number of repeated experiments.
y is the response value, xi (i = 1, 2, 3) represents each factor, and the fitting formula is as shown in (4).
Among them, α0,αi,αij,α123 are, respectively, the mean, the effect of factor i, the effect of the interaction of factors i and j, the effect of the interaction of three factors.
Calculation Results
Influence of Heating Power on Flow Heat Transfer
Effect of Power on Heat Transfer Coefficient
The working fluids are liquid sodium, sodium-potassium alloy, lead and lead-bismuth alloy. The preset system pressure is 1 Mpa, the preheating section temperature is 620 K, the cooling section temperature is 610 K, and the power density ranges from 2 to 30 kW/m2. The change trend of heat transfer coefficient of four liquid metals with power is shown in Figure 4.
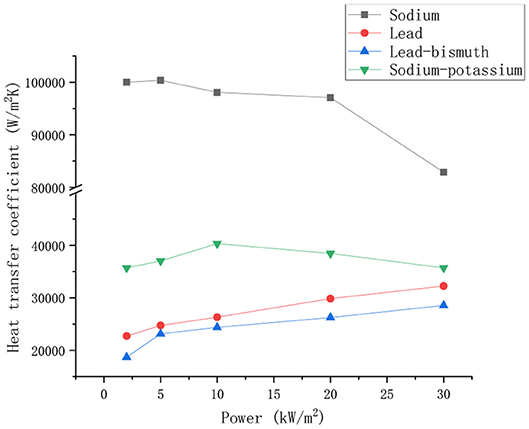
Figure 4. Effect of heating power on heat transfer coefficients of different liquid metals.
It can be seen from the Figure 4 that the heat transfer coefficient of liquid sodium decreases with the increase of heating power, and the heat transfer coefficient of sodium-potassium alloy increases first and then decreases with the increase of power. The heat transfer coefficient of lead and lead-bismuth increases as power increases. Although the liquid sodium heat transfer coefficient is negatively correlated with power, the heat transfer coefficient of sodium is much larger than that of sodium-potassium alloy, lead, and lead-bismuth alloy. Because liquid metal has a common physical property, its molecular thermal conductivity is large, and the molecular Prandtl number is much smaller than that of ordinary fluid. Therefore, the molecular thermal diffusion capacity is far better than the momentum diffusion ability, the molecular thermal conduction is stronger than the turbulent heat transport, and the thermal conductivity plays a role in promoting heat transfer. The thermal conductivity of liquid sodium is greater than that of the other three liquid metals, and its specific heat at constant pressure is higher than that of other metals. So the heat transfer performance is better under the same power conditions. The change trend of the heat transfer coefficient of the four metals with the power is mainly affected by the thermal conductivity and the temperature difference between the hot and cold sections. As the power increases, the temperature of the fluid increases. The thermal conductivity of liquid sodium decreases with increasing temperature. At the same time, with the increase of power, the temperature difference between the cold and hot sections of the fluid increases, and the thermal driving force of the fluid also increases, so the heat transfer of the fluid is enhanced. Compared with the other three liquid metals, the thermal conductivity of liquid sodium is greatly affected by the power. The thermal conductivity occupies a dominant position, and the heat transfer enhancement caused by temperature difference can be ignored. Therefore, the change trend of heat transfer coefficient is consistent with that of thermal conductivity. For lead and lead-bismuth, the thermal conductivity is less affected by temperature, and the increase in temperature difference caused by power increases the heat transfer capacity. As a result, the heat transfer coefficient of lead and lead-bismuth increases with the increase of power. The heat transfer coefficient of sodium-potassium alloy increases first and then decreases with the increase of power. Therefore, it is promoted by the thermal conductivity coefficient and the temperature difference when the power is small. The heat transfer coefficient increases first with the increase of power, and the increase rate is fast. When the power is large, the thermal conductivity decreases with the increase of power, and the inhibiting effect of thermal conductivity on heat transfer is greater than the promoting effect of temperature difference on heat transfer. So the heat transfer coefficient of sodium-potassium alloy decreases with the increase of power, and the decreasing speed is slow.
Influence of Power on Mass Flow
Keeping the boundary conditions unchanged, the mass flow of the four liquid metals changes with power as shown in Figure 5.
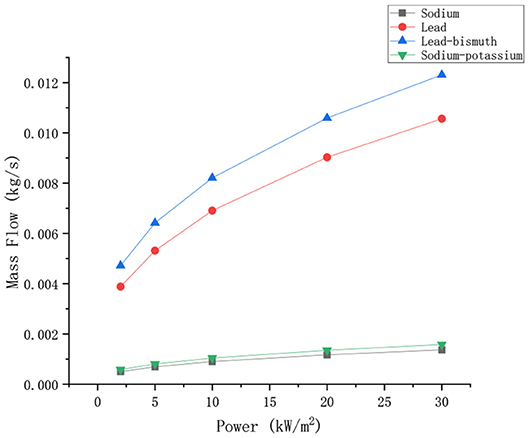
Figure 5. Effect of heating power on mass flow of different liquid metals.
As can be seen from the Figure 5, the mass flow rates of liquid sodium, sodium-potassium alloy, lead, and lead-bismuth alloy increase with increasing power. The mass flow of lead and lead-bismuth alloy is greater than that of sodium and sodium-potassium alloy. This is mainly because the density of lead and lead-bismuth is much higher than the density of sodium and sodium-potassium. Even if the flow velocity of lead and lead-bismuth is slow, the mass flow will be higher than that of sodium and sodium-potassium. Therefore, it is usually more accurate by comparing the flow velocity when comparing the circulation capacities of different liquid metals.
Effect of Power on Velocity
Keeping the boundary conditions constant, and the velocity changes with power as shown in Figure 6.
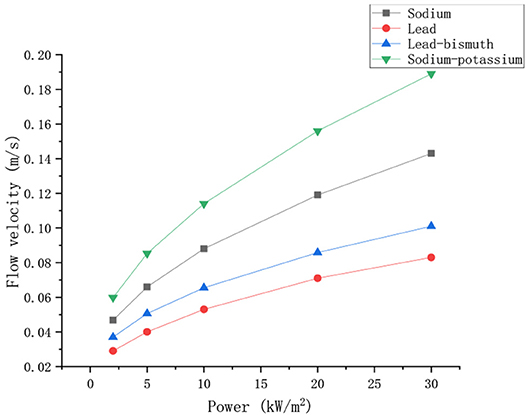
Figure 6. Effect of heating power on velocity of different liquid metals.
It can be seen from the Figure 6 that the velocity of different liquid metals increases with the increase of power. The velocity of sodium potassium was the highest, followed by that of sodium, and the velocity of lead bismuth was the lowest. At the beginning, the velocity difference between the four liquid metals is small. As the power increases, the gap between the velocity increases. This is mainly because the temperature of the fluid increases as the power increases, the thermal expansion of the fluid causes an increase in the density difference between the hot and cold sections, which leads to the increase of the driving head and the increase of the velocity. Compared to the other three liquid metals, the density of sodium-potassium alloy changes more violently with temperature, so its velocity increases most dramatically with power. Among the four liquid metals, the ability of sodium-potassium alloy to naturally circulate is the strongest.
Effect of Power on Outlet Temperature
The boundary conditions are kept constant, and the changes in the outlet temperature of the four liquid metals with power are shown in Figure 7.
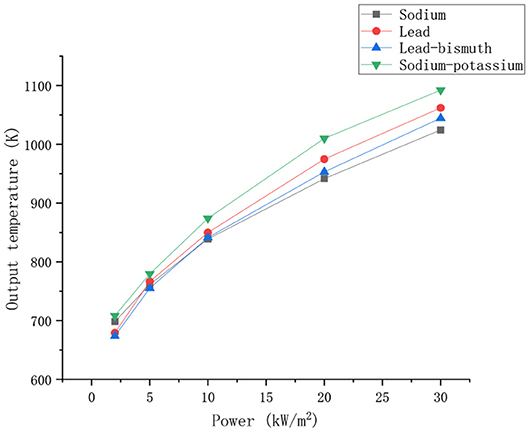
Figure 7. Effect of heating power on outlet temperatures of different liquid metals.
As can be seen from the Figure 7, the outlet temperatures of different liquid metals increase with increasing power. At the same power, the sodium-potassium alloy has the highest outlet temperature. At lower heating powers, the lead and lead-bismuth outlet temperatures are below the sodium outlet temperature. When the power reaches about 5 Kw/m2, the outlet temperature of lead and lead-bismuth exceeds that of sodium, and kept the trend of exceeding. This is because the specific heat capacity of sodium is larger than that of lead and lead-bismuth alloy. Therefore, the temperature rise caused by lead and lead-bismuth is greater when the same heat is absorbed. At lower power, the thermal conductivity is absolutely superior to the specific heat capacity of liquid sodium. As a result, liquid sodium can absorb more heat at the same power, and heat transfer performance is better. Therefore, its outlet temperature is greater than that of lead and lead-bismuth as a whole. When the power is further increased, the thermal conductivity of sodium decreases with increasing power, the thermal conductivity of lead and lead-bismuth increases with increasing power. So the advantage of the thermal conductivity of sodium is weakened, and the difference of heat transfer performance between sodium and lead, lead-bismuth alloy decreases. At this time, the difference in specific heat capacity occupies a dominant position, which leads to a higher output temperature of lead and lead-bismuth.
Influence of Pressure on Flow Heat Transfer
The working fluids are liquid sodium, sodium-potassium alloy, lead and lead-bismuth alloy. The preheating section temperature is 620 K, the cooling section temperature is 610 K, the power density is 20 kW/m2, and the values of pressure are 1, 2, 3, 4, and 5 Mpa, respectively. The heat transfer coefficient, mass flow, velocity, and outlet temperature of four liquid metals change with pressure as shown in Figure 8.
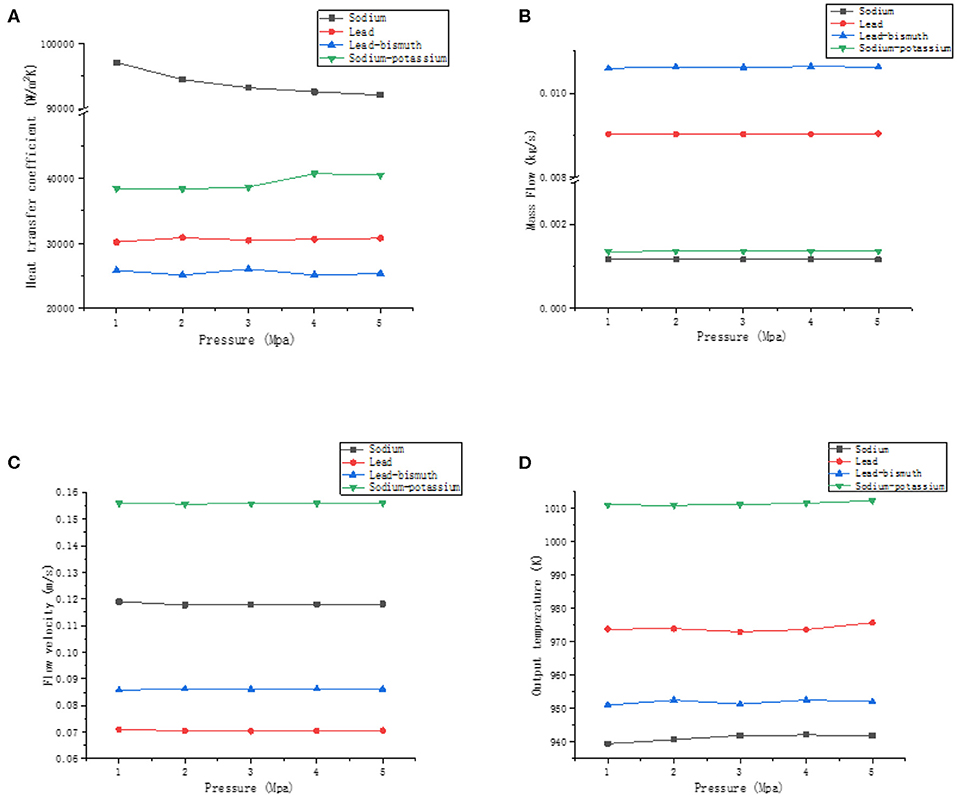
Figure 8. The effect of pressure. (A) Effect of pressure on the heat transfer coefficient, (B) effect of pressure on mass flow, (C) effect of pressure on velocity, and (D) effect of pressure on outlet temperature.
As can be seen from the Figure 8, the heat transfer coefficient of liquid sodium tends to decrease slightly with increasing pressure, while the sodium-potassium alloy, on the other hand, tends to increase. It can be seen from section Influence of Factors on Heat Transfer Coefficient that the heat transfer coefficient of sodium is mainly affected by the power-pressure interaction and the contribution rate is about 32.73%. Therefore, the pressure affects the heat transfer coefficient by coupling with the power. For sodium-potassium alloys, the heat transfer coefficient is affected by the interaction of inlet temperature-pressure. The pressure affects the heat transfer coefficient by coupling with the inlet temperature. For lead and lead-bismuth, there is no interaction between pressure and power or temperature, so its heat transfer coefficients have little change with pressure. In general, the effect of pressure on the heat transfer coefficient of liquid metals is not obvious. The mass flow, velocity, and outlet temperature of the liquid metal are hardly affected by the pressure. At the same pressure, the velocity of sodium-potassium alloy, sodium, lead-bismuth alloy, and lead are successively decreased. The velocity does not change with pressure because the density of the liquid metal is less affected by the pressure. The increase in pressure does not cause a change in the density difference between the hot and cold section. The driving head of the system tends to be stable, so there is no change in the flow velocity of the liquid metal. The influence of pressure on the physical properties of liquid metal is small, so the outlet temperature of different liquid metals tends to be stable.
Influence of Inlet Temperature on Flow Heat Transfer
The working fluids are liquid sodium, sodium-potassium alloy, lead, and lead-bismuth alloy. The cooling section temperature is 610 K, the power density is 20 kW/m2, and the preheating section temperature is the inlet temperature of the heating section, and the values are 620, 650, 680, 710, and 740 K, respectively. The heat transfer coefficient, mass flow, velocity, and outlet temperature of the four liquid metals vary with the inlet temperature as shown in Figure 9.
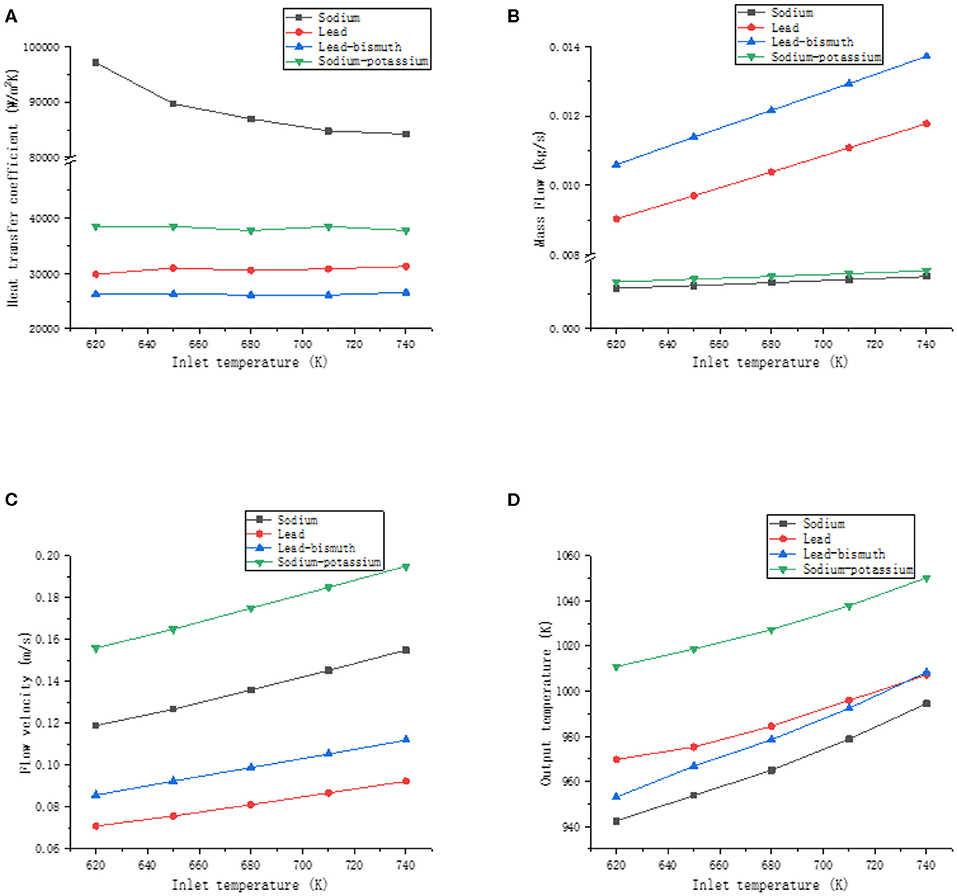
Figure 9. The effect of inlet temperature. (A) Effect of inlet temperature on heat transfer coefficient, (B) effect of inlet temperature on mass flow, (C) effect of inlet temperature on flow velocity, and (D) effect of inlet temperature on outlet temperature.
As can be seen from the Figure 9, the heat transfer coefficient of liquid sodium decreases as the inlet temperature increases. The inlet temperature has no effect on the heat transfer coefficient of sodium-potassium alloy, lead, and lead-bismuth. This is mainly because the thermal conductivity of liquid sodium changes significantly with temperature, while the thermal conductivity of sodium-potassium alloys, lead, and lead-bismuth has a smaller trend with temperature. The mass flow, velocity, and outlet temperature of liquid metal increase with the increase of inlet temperature. The density of lead and lead-bismuth alloy is much larger than that of sodium and sodium-potassium alloy, so the increase of mass flow is more obvious than that of the latter. However, the increase in the velocity of sodium-potassium alloy and sodium was slightly greater than that of lead and lead-bismuth alloy. At a certain power, an increase in the inlet temperature of the liquid metal causes an increase in the outlet temperature, which causes the temperature difference between the hot and cold sections to increase. At the same time, it increases the driving force of the system. So the velocity of the liquid metal increases as the inlet temperature increases. The rate of increase of the outlet temperature of lead-bismuth alloy is greater than that of lead. Therefore, when the inlet temperature increases to a certain value, the lead-bismuth outlet temperature is higher than the lead outlet temperature. This is mainly because the specific heat capacity of lead increases as the temperature increases, and the specific heat capacity of lead-bismuth decreases as the temperature increases, so when the same amount of heat is absorbed, the tendency of the temperature increase of the lead-bismuth is more obvious.
Validation of Simulation Results
Ma et al. (2007) conducted an experimental study on the mass flow and velocity of lead-bismuth natural circulation. The comparison between simulation results and experimental data is shown in Figure 10.
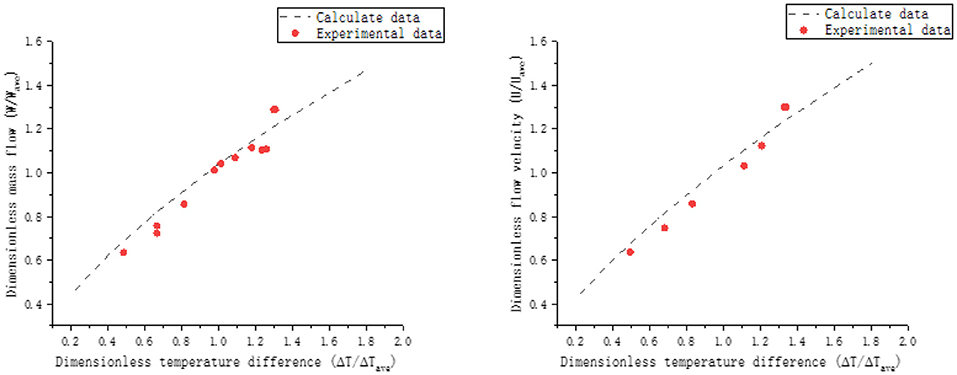
Figure 10. Comparison of experimental and simulation results.
In Figure 10, due to the difference in model size between the experiment and the simulation, the mean dimensionless method is used to deal with temperature difference, mass flow and flow velocity. ΔT is the temperature difference between the hot and cold section, ΔTave is the average temperature difference, W is the mass flow, Wave is the average mass flow, U is the flow velocity, and Uave is the average flow velocity. The calculated data are compared with the experimental data by dimensionless method. The variation trend of experimental and simulation results is basically the same, so the adaptability of the established simulation model can be determined.
Factorial Analysis
Effect of Interaction on Heat Transfer Coefficient
By using the method of factor analysis, the interaction between the factors is analyzed. The effect of the interaction on the heat transfer coefficients of different liquid metals is shown in Figure 11.
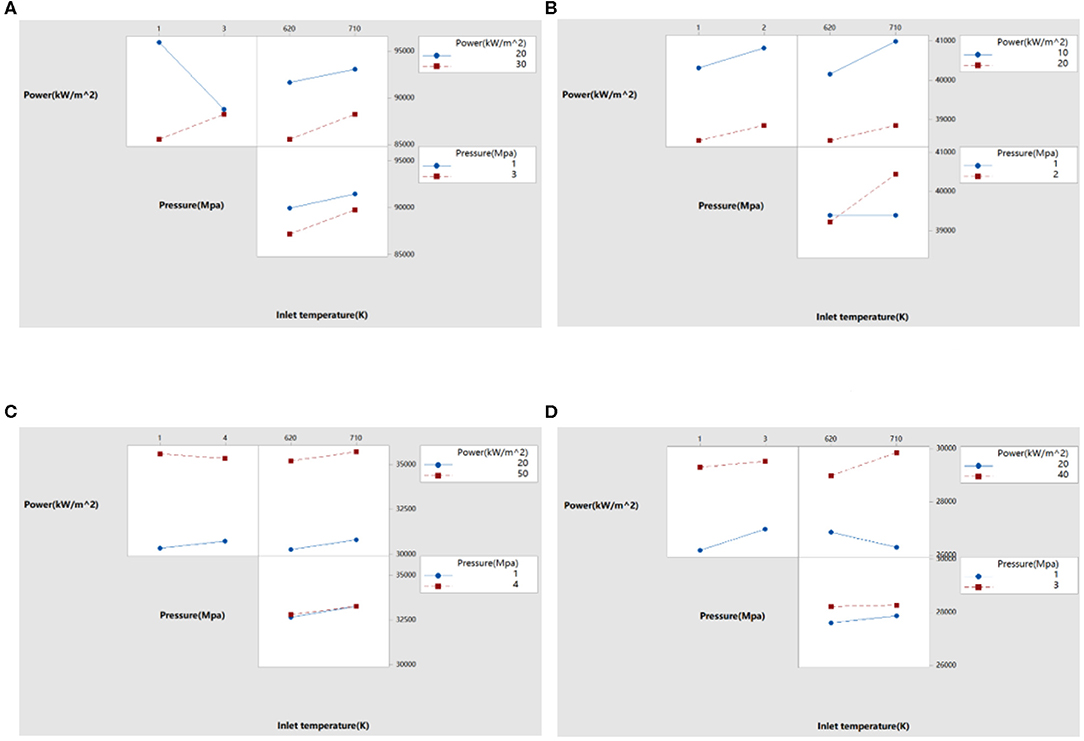
Figure 11. Effect of interaction on heat transfer coefficients of different liquid metals. (A) Effect on heat transfer coefficient of sodium, (B) effect on heat transfer coefficient of sodium-potassium alloy, (C) effect on heat transfer coefficient of lead, and (D) effect on heat transfer coefficient of lead-bismuth.
It can be seen from Figure 11 that the interaction of factors on the natural cycle heat transfer coefficient of liquid metal. When the effect of one factor changes with other factors, and the difference between them exceeds the range of random fluctuations, the interaction between them is indicated. In Figure 11, if the two lines intersect, it indicates that there is an interaction between the two factors; if the two lines are nearly parallel, it implies that the interaction between the two factors can be ignored. Among the factors affecting the heat transfer coefficient of liquid sodium, there is an interaction between power and pressure. Among the factors affecting the heat transfer coefficient of sodium-potassium alloys, there is an interaction between pressure and inlet temperature. There is no interaction between the factors influencing the heat transfer coefficient of liquid lead. For the factors affecting the heat transfer coefficient of lead-bismuth, there is an interaction between power and inlet temperature; while for power and pressure, although the two straight lines have a certain inclination, they are nearly parallel, and it can be seen that the interaction is small and can be ignored.
Influence of Factors on Heat Transfer Coefficient
By substituting the calculation data in section Calculation Results into formulas (1)–(3), the estimated effect and interaction among factors can be obtained. The semi-normal probability of the effect of heat transfer coefficient is shown in Figure 12.
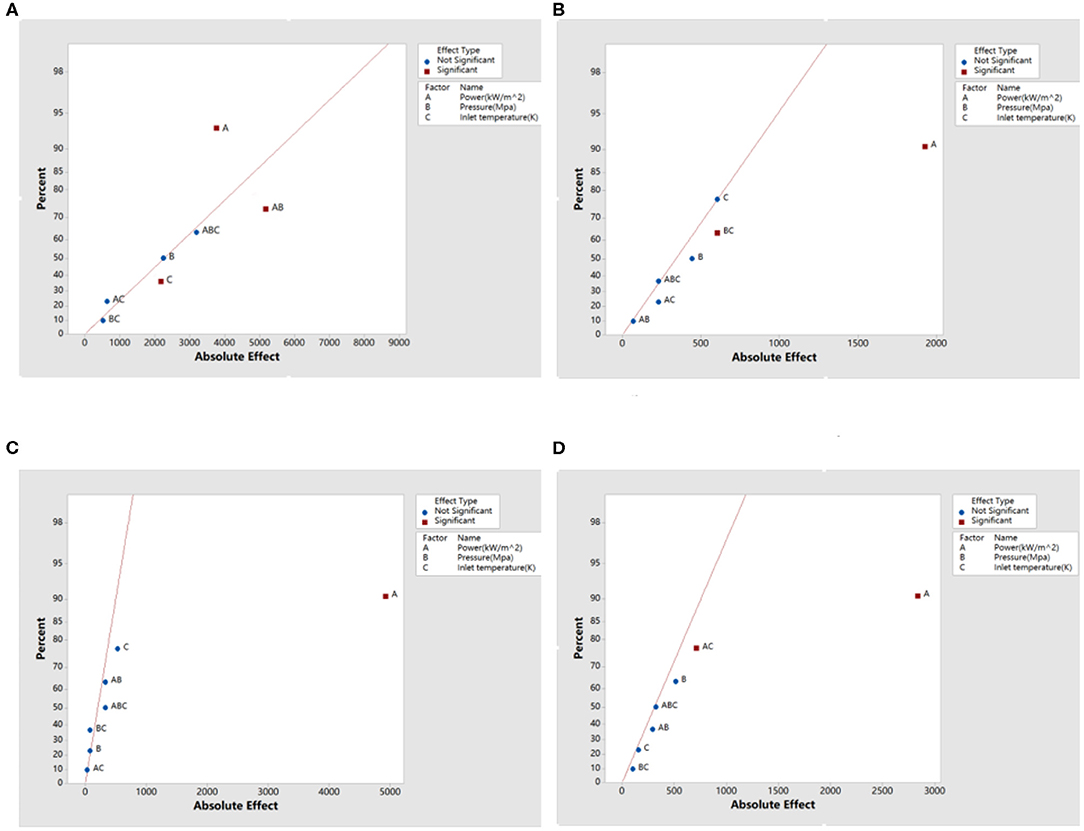
Figure 12. Semi-normal probability of the effect of heat transfer coefficient. (A) Effect of heat transfer coefficient of sodium, (B) effect of heat transfer coefficient of sodium-potassium alloy, (C) effect of heat transfer coefficient of lead, and (D) effect of heat transfer coefficient of lead-bismuth.
In Figure 12, the negligible effect is normally distributed and will generally fall near a line on the graph. The effect farther from the straight line indicates that the factor is statistically significant and has the greatest influence on the heat transfer coefficient. The effect percentage contribution rate is obtained by the ratio of the sum of the squares of the effects to the total sum of squares, indicating the degree of dependence between the influencing factors and the heat transfer coefficient. For liquid sodium, except for the effect A, effect AB, and effect C, other effects are negligible. Effect A deviates furthest from the line, indicating that it has the greatest influence on the heat transfer coefficient, and its contribution rate is about 40.16%; the contribution rate of effect AB is about 32.73%, indicating that there is interaction between power and pressure; the contribution rate of effect C is about 6.79%. For sodium-potassium alloy, effect A has the greatest influence on heat transfer coefficient, and the contribution rate is about 78.16%; the contribution rate of effect BC to heat transfer coefficient is about 7.70%, which indicates that there is interaction between pressure and inlet temperature; other effects are negligible for sodium—potassium alloys. For liquid lead, except for effect A, other effects are negligible, and the contribution rate of effect A to the heat transfer coefficient is about 97.95%. For lead-bismuth alloys, the contribution rate of effect A is about 92.19%; the contribution rate of effect AC is about 5.62%, so there is an interaction between power and inlet temperature; other effects are negligible for lead-bismuth alloys.
Conclusion
The flow and heat transfer of liquid metal natural circulation was numerically simulated by CFX. The influencing factors were compared by using factor analysis. The effects of power, pressure, and inlet temperature on the heat transfer coefficient of liquid metal were obtained.
(1) The heat transfer coefficient of liquid sodium decreases with the increase of power, while the heat transfer coefficient of liquid lead and lead-bismuth increases with the increase of power, and the heat transfer coefficient of sodium-potassium alloy increases first and then decreases with the increase of power. Under the same conditions, sodium has the best heat transfer performance, and its heat transfer coefficient is much larger than that of the other three liquid metals. The sodium-potassium alloy has the strongest natural circulation ability, and its flow velocity is higher than other liquid metals.
(2) The flow rate and outlet temperature of liquid metal are hardly affected by pressure. The heat transfer coefficient of liquid sodium and sodium-potassium alloy is affected by pressure. The heat transfer coefficient of sodium is affected by the power-pressure interaction and the contribution rate is about 32.73%. Therefore, the pressure affects the heat transfer coefficient by coupling with the power. For sodium-potassium alloys, the pressure affects the heat transfer coefficient by coupling with the inlet temperature. For lead and lead-bismuth alloy, there is no interaction between pressure and power or temperature, so their heat transfer coefficients have little change with pressure.
(3) For the heat transfer coefficient of four liquid metals, the power is the factor that contributes the most. The contribution rate of power to the heat transfer coefficients of liquid sodium, sodium-potassium alloy, lead and lead-bismuth alloy reached 40.16, 78.16, 97.95, and 92.19%, respectively. In addition to lead, the heat transfer coefficients of sodium, sodium-potassium alloy, and lead-bismuth alloy are affected by the interaction between the factors. Therefore, in improving the heat transfer coefficient of sodium, sodium-potassium alloy, and lead-bismuth alloy, it is not possible to simply analyze the influence of one of the factors, and it is necessary to comprehensively consider the coupling between the factors.
Data Availability Statement
All datasets generated for this study are included in the article/supplementary material.
Author Contributions
All authors listed have made a substantial, direct and intellectual contribution to the work, and approved it for publication.
Funding
This project was supported by Natural Science Foundation of Beijing Municipality (3172032).
Conflict of Interest
The authors declare that the research was conducted in the absence of any commercial or financial relationships that could be construed as a potential conflict of interest.
References
Borgohain, A., Maheshwari, N. K., and Vijayan, P. K. (2016). Natural circulation experiments in a non-uniform diameter lead bismuth loop and validation of LeBENC code. Progress Nuclear Energy 91, 68–82. doi: 10.1016/j.pnucene.2016.03.005
Chang, W. P., and Hahn, D. (2002). “Development of sodium two phase flow model for Kalimer core analysis,” in International Conference on Nuclear Engineering (Washington, DC: American Society of Mechanical Engineers), 333–341.
Duncan, J. D. (1988). SBWR, a simplified boiling water reactor. Nuclear Eng. Design. 109, 73–77. doi: 10.1016/0029-5493(88)90143-4
Gaiying, W., Qing, B., Sheng, G., Min, Z., and Qunying, H. (2012). Preliminary study on liquid lead bismuth oxygen concentration measurement technology. Nuclear Sci. Eng. 32, 165–169. doi: 10.3969/j.issn.0258-0918.2012.02.012
Gao, Y., Takahashi, M., and Nomura, M. (2015). Experimental study on diffusion of Ni in lead-bismuth eutectic (LBE). Energy Proc. 71, 313–319. doi: 10.1016/j.egypro.2014.11.884
Hashim, M., Yoshikawa, H., Matsuoka, T., and Yang, M. (2014). Quantitative dynamic reliability evaluation of AP1000 passive safety systems by using FMEA and GO-FLOW methodology. J. Nuclear Sci. Technol. 51, 526–542. doi: 10.1080/00223131.2014.881727
Jingjing, L., Tao, Z., Qijun, H., and Zejun, X. (2014). Study on the stability of supercritical water natural circulation flow based on factorial analysis. Nuclear Power Eng. 35, 66–69. doi: 10.13832/j.jnpe.2014.05.0066
Liu, X. (2015). Analysis of the construction of overseas land model reactors and their contribution to the development of nuclear power equipment for ships. Chin. Ship Res. 10, 84–91. doi: 10.3969/j.issn.1673-3185.2015.03.014
Ma, D., Zhou, T., Chen, J., Qi, S., Shahzad, M. A., and Xiao, Z. (2017). Supercritical water heat transfer coefficient prediction analysis based on BP neural network. Nuclear Eng. Des. 320, 400–408. doi: 10.1016/j.nucengdes.2017.06.013
Ma, W., Karbojian, A., and Sehgal, B. R. (2007). Experimental study on natural circulation and its stability in a heavy liquid metal loop. Nuclear Eng. Design 237, 1838–1847. doi: 10.1016/j.nucengdes.2007.02.023
Tarantino, M., Grandis, S. D., Benamati, G., and Oriolo, F. (2008). Natural circulation in a liquid metal one-dimensional loop. J. Nuclear Mater. 376, 409–414. doi: 10.1016/j.jnucmat.2008.02.080
Wang, L., Chen, P., Zhou, Y., Li, W., Tang, C., Miao, Y., et al. (2018). Experimental study on the condensation of steam with air out of the vertical tube bundles. Front. Energy Res. 6:32. doi: 10.3389/fenrg.2018.00032
Watanabe, O., Oyama, K., Endo, J., Doda, N., Ono, A., Kamide, H., et al. (2015). Development of an evaluation methodology for the natural circulation decay heat removal system in a sodium cooled fast reactor. J. Nuclear Sci. Technol. 52, 1102–1121. doi: 10.1080/00223131.2014.994049
Qiu, Z., Lan, Z., Ma, Z., Qiu, S., Zan, Y, Xing, D., et al. (2016). Theoretical study on heat transfer characteristics of liquid metal sodium boiling two-phase flow. Nuclear Power Eng. 37, 124–127. doi: 10.13832/j.jnpe.2016.S2.0121
Keywords: liquid metal, natural circulation, heat transfer coefficient, factor analysis, interaction
Citation: Xiang F, Tao Z, Jialei Z, Boya Z and Juan C (2020) Study on Natural Circulation Heat Transfer Characteristics of Different Liquid Metals Based on Factor Analysis. Front. Energy Res. 8:123. doi: 10.3389/fenrg.2020.00123
Received: 29 January 2020; Accepted: 25 May 2020;
Published: 14 July 2020.
Edited by:
Yanping Huang, Nuclear Power Institute of China (NPIC), ChinaReviewed by:
Zhitong Bai, University of Michigan, United StatesHan Bao, Idaho National Laboratory (DOE), United States
Copyright © 2020 Xiang, Tao, Jialei, Boya and Juan. This is an open-access article distributed under the terms of the Creative Commons Attribution License (CC BY). The use, distribution or reproduction in other forums is permitted, provided the original author(s) and the copyright owner(s) are credited and that the original publication in this journal is cited, in accordance with accepted academic practice. No use, distribution or reproduction is permitted which does not comply with these terms.
*Correspondence: Feng Xiang, bnVtYmVyNTY1NEAxNjMuY29t; Zhou Tao, MTAxMDEyNjM2QHNldS5lZHUuY24=