- 1School of Economics and Statistics, Guangzhou University, Guangzhou, China
- 2College of Finance and Statistics, Hunan University, Changsha, China
This study examines the heterogeneous impact of financial development on green total factor productivity for 40 countries over the period 1991 to 2014. Specifically, this paper describes financial development from the three aspects of banking, securities, and insurance. In developing countries, an inverted U-shaped relationship exists between financial development and green total factor productivity, whether it is in bank development, securities development, or insurance development. In developed countries, the development of bank and insurance tends to adversely affect green total factor productivity, while the development of securities has always had a positive impact on green total factor productivity. Securities development is more conducive to improving green total factor productivity than bank development.
Introduction
The needs to achieve sustainable development and reduce environmental pollution have prompted researchers to focus on the relationship between financial development and green total factor productivity (GTFP). Most relative research has extensively analyzed the impact of financial development on economic growth, concluding that financial development accelerates economic development (Wachtel, 2001; Caporale et al., 2015; Tripathy, 2019). However, with the increasing importance of environmental protection to economic development, we must not only focus on the total amount of economic growth but also consider the impact of economic development on the environment, that is, sustainable development (Longhofer and Jorgenson, 2017; Maes and Jacobs, 2017; Li Z. et al., 2020). The concept of sustainable development refers to transforming the extensive growth mode, which has high input dependence, to an intensive growth mode, which reduces input, increases output, and reduces pollution, so as to achieve an increase in total factor productivity (TFP), which is essentially improving green total factor productivity. Therefore, in the context of considering environmental factors, this paper explores the heterogeneous impact of financial development on GTFP.
As the main driving force for economic development, finance is gradually becoming the core of economic development. Greenwood and Jovanovic (1990) constructed a theoretical model and analyzed the mechanism of interaction between financial development and economic growth in the context of information asymmetry. They asserted that financial systems can effectively overcome the adverse selection and moral hazard caused by information asymmetry and allocate funds to investment projects with high profit prospects, which will, in turn, increase productivity. King Robert and Levine (1993) introduced the financial sector into the model of endogenous economic growth and pointed out that better financial systems improve productivity and thereby accelerate economic growth. Although most studies conclude that financial development promotes economic development, some studies have found that financial development is not good for economic development (De Gregorio and Guidotti, 1995; Aghion et al., 2004). Ruiz (2018) pointed out that the development of finance has a non-linear effect on economic growth. Asteriou and Spanos (2019) found that before and after the financial crisis, there were differences in the impact of financial development on economic growth.
TFP growth is an important source of long-term economic growth. Considering the undesirable output of energy input and pollution, GTFP is an important guarantee for the realization of sustainable economic growth. TFP is a comprehensive reflection of the role of technological progress in economic development and is often considered a source of analysis of economic growth (Solow, 1957; Baier et al., 2006). With the current rapid economic development and prominent environmental issues, we cannot ignore environmental factors when considering TFP (Li et al., 2019; Song et al., 2019; Xia et al., 2019). Although traditional TFP takes into account capital, labor inputs, and economic output, it does not take into account the input and undesirable output of energy. If the input of energy and undesired output are not considered in the measurement of TFP, the measurement results obtained will inevitably be biased. The aim when optimizing GTFP is to achieve the maximum output and the minimum environmental pollution under a given input (Song et al., 2020).
Financial development affects TFP mainly through technological progress and capital allocation (Li et al., 2018; Huang et al., 2019). Technological progress is essential to achieve sustainable economic growth (Li Y. et al., 2020). The research on financial development to promote TFP growth through technological progress started from the theory of endogenous growth proposed by Romer (1986). Because financially supported technological innovation has significant positive externalities, investment in research and development has promoted endogenous technological progress, thereby driving TFP growth. Buera et al. (2011) suggest that financial development can effectively reduce friction in the economic system and promote the growth of TFP through both efficiency improvement and technological progress. However, the impact of financial development on capital allocation is not always positive. Resource optimization can promote TFP growth, and resource mismatches can inhibit TFP growth. Buera and Shin (2013) found that in some emerging economies or developing countries with rapid economic growth, innovative high-tech SMEs have a short capital accumulation time and lack sufficient guarantee conditions, making it difficult to obtain financing, and resource mismatches caused by lagging financial development are not conducive to the growth of total factor productivity. Cole et al. (2016) state that inefficient capital allocation caused by capital mismatch in the financial system hinders the improvement of TFP in some countries.
At different stages of economic development, financial development has a heterogeneous effect on TFP, especially in different countries. Rioja and Valev (2004) pointed out that financial development and TFP may not be explained by a purely linear relationship. In different countries, the role of financial development in promoting TFP growth is significantly different, and an inverted U-shaped relationship exists between them. Seven and Coskun (2016) found that although financial development has a positive impact on economic growth, this promotion does not exist in some low-income countries. Financial markets with low levels of financial development are not able to form high-productivity trade sectors due to insufficient risk diversification functions, while low-productivity non-trade sectors are more likely to survive. A developed financial system can provide better risk diversification and risk hedging services, effectively reduce investors' risk concerns about technological innovation in enterprises, and then promote enterprises to carry out technological upgrades and innovation activities.
At present, related research mainly examines the relationship between financial development, TFP, and economic growth, but few studies have studied their relationship from the perspective of environmental pollution. Considering the problems of excessive consumption of natural resources and increasing environmental degradation, a purely gross domestic product (GDP)-oriented growth model has seriously undermined the sustainable development of the economy. Therefore, the first contribution of this paper is to consider the environmental factors and measure the GTFP of each country so as to identify the GTFP gap between different countries. Second, in the study of the impact of financial development on TFP, finance is often considered as a whole without distinguishing between different financial sectors. In fact, the role of different financial sectors varies significantly in the process of economic operations. Therefore, this paper examines the heterogeneous impact of financial development on GTFP for three different financial sectors: banking, securities, and insurance. This will help us explore the heterogeneous impact of different financial sector developments on GTFP. Finally, due to the differences between developing and developed countries, this paper conducts an empirical analysis of developing and developed countries, respectively. This will help us find the heterogeneous impact of financial development on GTFP in different countries.
The rest of the paper is organized as follows. Section Literature Review lays out a brief literature review of the impact of financial development on GTFP. Section Data and Methodology introduces the data and methodology for empirical research and the measured GTFP of each country. In section Results, we analyze the impact of financial development on GTFP and discuss it separately for developed and developing countries. Section Conclusion provides the main conclusions.
Literature Review
The impact of financial development on the environment is ambiguous. From the perspective of consumption, developed financial markets can make it easier for consumers to meet their own consumption needs, which have different impacts on the environment. The consumption of goods will increase energy consumption and pollution emissions (Nassani et al., 2017; Kwakwa et al., 2018). However, with financial support, consumers can purchase high-tech products that use clean energy or have low energy consumption, resulting in reduced energy consumption and reduced pollution emissions (Costantini et al., 2017; Gerarden et al., 2017). From a production perspective, financial development also has different impacts on the environment. The financing function of the financial system can meet the capital needs of the production sector, provide financial support for enterprises to expand reproduction, and effectively solve the adverse impact of financing constraints on the production expansion of enterprises. Enterprises have expanded production through financial support, and increased output has also led to increased emissions of pollutants (Shahzad et al., 2017; Pata, 2018). In addition, financial resources will flow to polluting enterprises with high returns, which will cause financial development to have a negative impact on the environment. On the other hand, financial development has reduced the risk of technological innovation, which is conducive to increasing investment in advanced production technologies, and has promoted technological progress (Kenney, 2011; Brown et al., 2013; Hsu et al., 2014). This has led to high energy consumption and highly pollution-producing technology being replaced by clean technology. In addition, financial development also reduces energy consumption and pollution emissions by allowing funds to flow to companies with high energy efficiency and efficient resource allocation.
Financial development will not always promote economic growth. When financial development reaches a certain level, financial development will not be conducive to economic growth (Arcand et al., 2015; Ntarmah et al., 2019). This implies that an inverted U-shape relationship between finance development and economic growth. Law et al. (2013) found that finance development promotes economic growth only within a certain range; the effect of finance development on economic growth is non-existent beyond this range. Law and Singh (2014) indicate that financial development promotes economic growth only when it is below a threshold, while financial development levels above that threshold will have a negative impact on economic growth. Fagiolo et al. (2019) find a robust inverted U-shaped relationship between finance depth and economic growth. Moderate financial development is conducive to economic growth, but excessive financialization can hamper economic growth.
Data and Methodology
Global Malmquist-Luenberger Productivity Index
The traditional TFP does not consider the impact of energy input and pollution emissions, cannot fully reflect sustainable development requirements, and may be biased (Zhang et al., 2011). Considering the undesirable output of energy input and pollution, the GTFP is an important guarantee for the transformation of the economic growth mode and the realization of sustainable economic growth. Solow's residual analysis is difficult to adapt to this requirement, so data envelopment analysis (DEA) is increasingly applied for the measurement of GTFP. Compared with Solow's residual analysis, DEA can avoid the bias caused by the form of the preset production function and the distribution characteristics of the error terms, and it has been widely used in the calculation of GTFP (Liao and Drakeford, 2019). In order to remedy the disadvantages of traditional TFP, which did not consider the undesired output, Chung et al. (1997) introduced pollution emissions into the DEA model as an undesired output. Färe et al. (2001) further used the Malmquist-Luenberger index method to measure the GTFP and decomposed it into a technology efficiency index and technology progress index. In order to overcome the slack variable problem of the directional distance function DEA model due to radial models, Tone (2001) introduced slacks-based measure DEA. In order to avoid the potential linear programming infeasibility problem in the Malmquist-Luenberger index, Oh (2010) proposed the Global Malmquist-Luenberger (GML) index to overcome the above shortcomings. Emrouznejad and Yang (2016) used the GML index to measure the productivity of manufacturing industries. Wang et al. (2019) used the GML index to investigate air pollution emission efficiency.
This paper uses the GML index to measure GTFP so as to avoid the overestimation of the productivity of the evaluation object by the DEA in the radial direction and the potential linear programming infeasibility problem in Malmquist-Luenberger index.
Each country is regarded as a decision-making unit. Suppose each country uses N inputs, to produce M desirable outputs, , and J undesirable outputs, . The production possibility set is defined in Equation (1).
where denotes the weight of each observation. The aim with the production possibility set is to achieve the maximum output and the minimum environmental pollution under a given input.
This paper uses the directional distance function to overcome the undesired output problem. This function is defined in Equation (2).
where g = (y, −b) is the direction vector of horizontal expansion of output, and β is the directional distance function value. Oh (2010) further improved this and proposed the concept of a global distance function, pG(x) = p1(x1)∪p2(x2)∪⋯∪pT(xT). This set is a combination of all current production possibility sets to avoid arbitrary selection problems. The GML can be calculated as in Equation (3).
GML indicates the growth rate of GTFP relative to the previous period. If GML = 1, this indicates that GTFP has not changed. If GML > 1, this indicates that GTFP increased compared to the previous period. If GML < 1, this indicates that GTFP decreased compared to the previous period. Therefore, the GTFP of each country can be calculated by Equation (4).
We should point out that the GTFP based on GML does not reflect the absolute value of productivity but, rather, the relative value.
To study the impact of financial development on GTFP, we first estimate panel regressions including financial development variables, the model for which is expressed by Equation (5). Then, we added the square of financial development to investigate whether there is an inverted U-shaped relationship between financial development and GTFP; that is, an initially increasing and subsequently decreasing influence of financial development. The model is expressed by Equation (6).
where GTFP represents the dependent variable, F represents the financial development, F2represents the square of financial development, X is the control variable, α0is the intercept, while α1, α2, and α3 are the coefficients of regression, and ε is white noise error disturbance.
Sample and Data
Due to the lack of relevant data in many countries and the fact that the existing relevant data only spans up to 2014, the data used in this study is limited to 40 countries and the period 1991–2014. There are big differences in the levels of financial development of developing countries and of developed countries. Developing countries concentrate on producing pollution-intensive products and primary products. In production, the developed countries specialize in producing clean products and service-intensive products, and the developing countries often face serious environmental pollution problems while they are developing their economies. Therefore, it is necessary to analyze developing and developed countries separately. There are 24 developed countries in the sample, namely Australia, Austria, Canada, Cyprus, Denmark, Finland, France, Germany, Greece, Ireland, Italy, Israel, Japan, the Netherlands, New Zealand, Norway, Portugal, South Korea, Spain, Sweden, Switzerland, the Czech Republic, the United Kingdom, and the United States. There are 16 developed countries in the sample, namely Argentina, Brazil, China, Chile, Egypt, India, Indonesia, Iran, Mexico, Malaysia, the Philippines, Poland, Russia, South Africa, Thailand, and Turkey. All data used in this paper was obtained from the Penn World Table, WIPO statistics, and World Bank database.
The key to GTFP measurement using GML is to find input and output variables. With consideration given to the existing literature, the input variables in this paper comprise labor, capital, and energy consumption. The output variables in this paper comprise desirable and undesirable outputs (Zhang et al., 2011; Shi and Sun, 2017). The input and output variables employed in this paper are described as follows.
Capital: Capital input is measured by capital stock. We employ the perpetual inventory method to estimate the capital stock, which is measured in millions of constant 2010 dollars.
Labor: Labor input is the number of people engaged in labor, and the unit is millions.
Energy consumption: Energy input is total energy consumption, measured as GDP divided by GDP per unit of energy consumption. The unit is 1,000 tons.
Desirable output: Desirable output is the real GDP, which is measured in millions of constant 2010 dollars.
Undesirable output: Undesirable output is carbon dioxide emission, which can be obtained from the World Bank database. The unit is millions of tons.
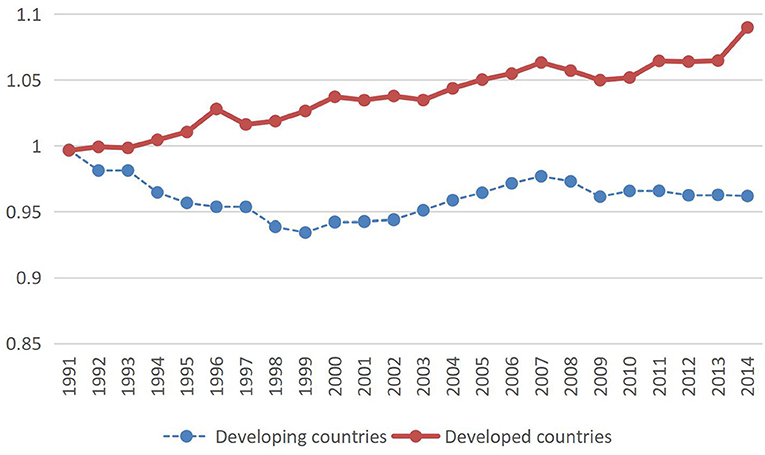
Based on these input and output variables, MaxDEA software was used to measure the GTFP. The resulting GTFP values for developed and developing countries are presented in Figure 1. We can find that the GTFP has maintained a continuous growth trend in developed countries, while the GTFP in developing countries showed a state of decline before rising and then remaining stable.
Financial development should be considered from the perspectives of different financial sectors. However, most of the research on the relationship between financial development and economic growth has been conducted from the perspective of banks, ignoring the role of securities and insurance in economic operations. The development of securities and insurance is rooted in the development of the financial system and has become an indispensable factor in the current economic growth. Therefore, this paper describes financial development from the three aspects of banking, securities, and insurance. Bank development (BANK) is measured by the ratio of private credit from deposit money banks and other financial institutions to GDP. Securities development (STOCK) is measured by the ratio of stock market capitalization to GDP; that is, the market value of listed shares divided by GDP. Insurance development (INSU) is measured by ratio of insurance income to GDP, which is the depth of insurance.
In order to obtain robust results, we have added some control variables that may affect GTFP. Invention patents (IP) are a reflection of a country's innovation ability and can reflect the level of technological progress, which is measured by the logarithmic transformation of patent applications per million people. Foreign direct investment (FDI) has come to be seen as an engine of productivity growth and development; it also provides research and development funding for technology improvement, which is measured by the ratio of net inflows of FDI to GDP. The trade openness (OPEN) is measured by the proportions of total imports and exports in GDP. Human capital (HC) is measured by the human capital index. Industrial structure (IS) is calculated by the industrial added value as a percentage of GDP. Renewable energy is an important component of energy consumption and is conducive to sustainable economic development (Xu et al., 2019). Energy structure (ES) is measured by the share of renewable energy consumption in total final energy consumption. GDP per capita (PGDP) is the logarithmic transformation of GDP per capita, which is measured in millions of constant 2010 dollars.
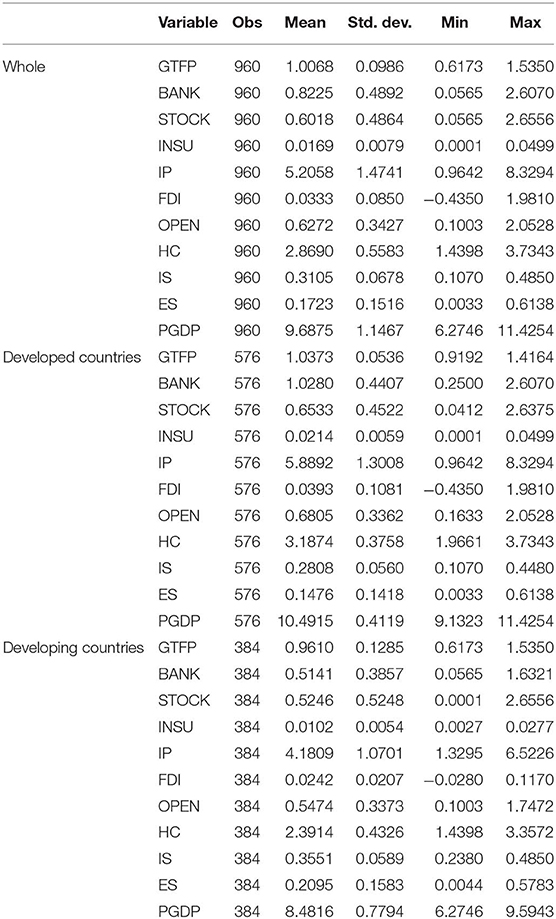
Table 1 provides descriptive statistics for all variables in this empirical study. The whole sample shows that our primary variable GTFP has a mean value of 1.0068. This means that, overall, green productivity has not improved. However, there is a significant difference between developed and developing countries. The GTFP in developed countries has a mean value of 1.0373, but GTFP in developing countries has a mean value of 0.9610. It can be seen that developed countries have better GTFP performance than developing countries. From the perspective of the development of the financial sector, BANK in the developed countries is 0.5139 higher than in the developing countries. STOCK in the developed countries is 0.1287 higher than in the developing countries. INSU in the developed countries is 0.0112 higher than in the developing countries. This shows that, from the overall level, whether in the development of banks, securities, or insurance, developed countries are significantly better than developing countries.
Results
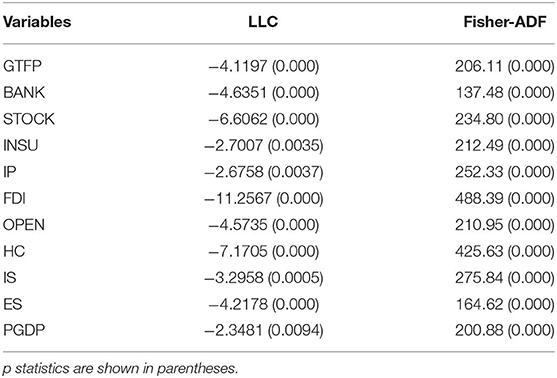
Before examining the impact of financial development on GTFP, we need to conduct a test for the stationarity of all variables. Levin-Lin-Chu (LLC) and the Fisher-Augmented Dickey-Fuller (Fisher-ADF) are commonly used methods to test data stationarity. Table 2 shows the stationarity result of all variables. We can find that all the variables passed the stationary test, which indicates that the data we used in the empirical study are stationary.
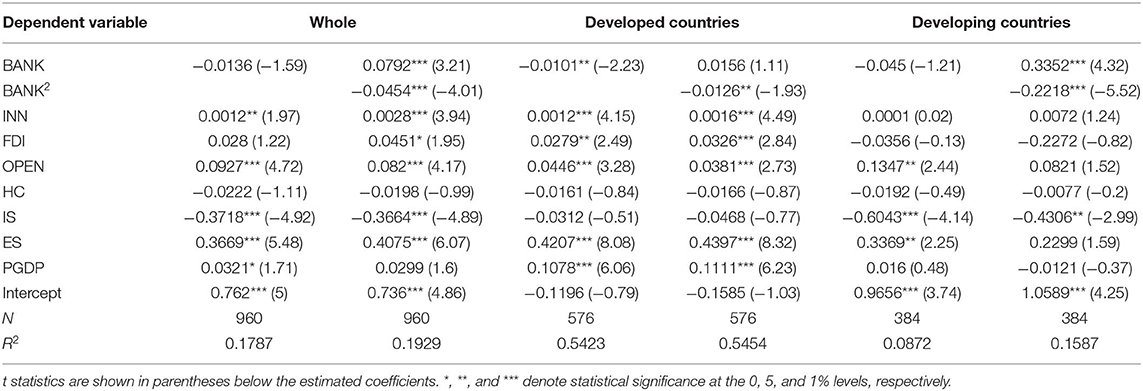
We estimate a regression model of GTFP as a function of financial development. Table 3 shows the regression result for the impact of bank development on GTFP. For the whole sample, BANK shows insignificant impact on GTFP. When we add the square of BANK to the regression model, we find that the estimated coefficient of BANK for GTFP is 0.0792, and the BANK2 of the estimated coefficient for GTFP is −0.0454, both of which are statistically significant at 1%. This shows that an inverted U-shaped relationship exists between bank development and GTFP. Bank development will promote the improvement of GTFP, but this positive impact will decline with the development of banks. For the developing countries, we get similar conclusions. For developed countries, the BANK of the estimated coefficient for GTFP is −0.0101, statistically significant at 5%, which indicates that bank development has a significant negative impact on GTFP in developed countries. When we add the square of BANK in the regression model, we can get similar results to the whole sample and developing countries. This shows that, in the early stages of bank development, the increase in the level of bank development will improve GTFP. When bank development reaches a certain level, further bank development will become harmful to GTFP. This conclusion is consistent with the conclusion of Arcand et al. (2015). When the total credit to the private sector exceeds GDP, financial development begins to have a negative impact on economic growth.
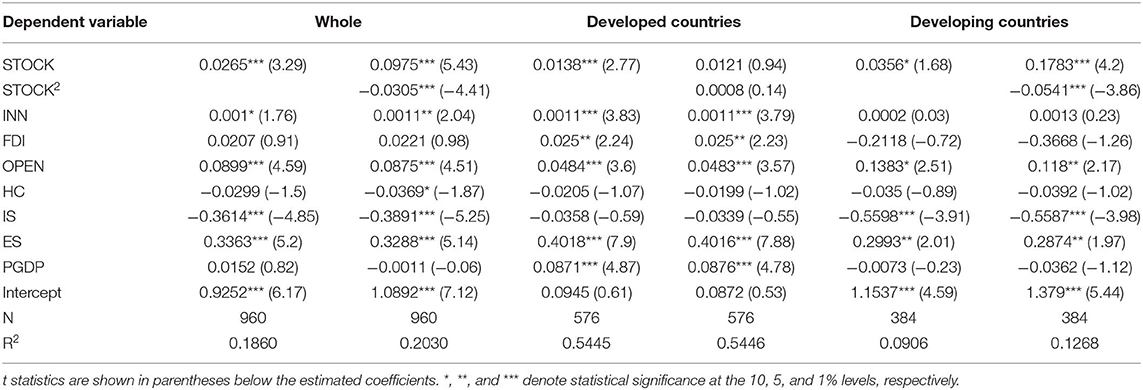
Table 4 shows the regression result for the impact of securities development on GTFP. For the whole sample, the coefficient of STOCK is 0.0265, statistically significant at 1%, which indicates that securities development has a significant positive impact on GTFP. When we add the square of STOCK in the regression model, we can find that the coefficient of STOCK is 0.0975, and the coefficient of STOCK2 is −0.0305, both of which are statistically significant at 1%. This shows that an inverted U-shaped relationship exists between securities development and GTFP. For the developing countries, we can get similar conclusions, unlike in the impact of bank development on GTFP. For developed countries, the coefficient of STOCK is 0.0138, statistically significant at 1%. When we add the square of STOCK in the regression model, neither STOCK nor STOCK2 had a significant impact on GTFP. This shows that when securities development reaches a certain level, further securities development will always have a positive impact on GTFP. Securities development, to some extent, solves the problem of information asymmetry in indirect bank financing. Therefore, compared with indirect bank financing, securities development is more conducive to solving the problem of adverse selection and moral hazard and to reducing the transaction costs of social enterprises. Therefore, securities are more efficient than financial intermediaries such as banks.
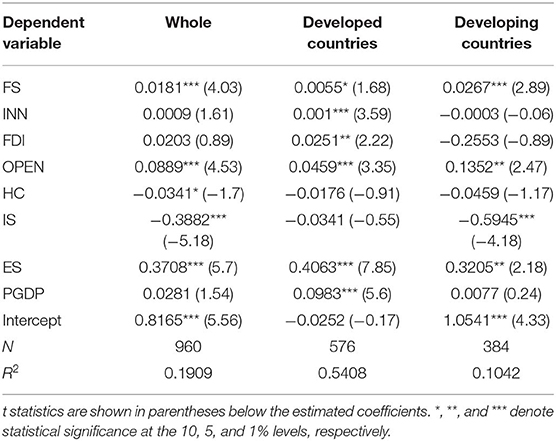
In order to better explain the differences between the development of banks and the development of securities, we introduce a financing structure (FS) for empirical analysis. FS is measured by the market value of listed shares divided by money deposited in banks and other financial institutions. Table 5 shows the regression result of the impact of the FS on GTFP. We can find that, whether in the full sample, developed or developing countries, FS always had a significant positive impact on GTFP. This shows that securities development is more conducive to improving GTFP than bank development.
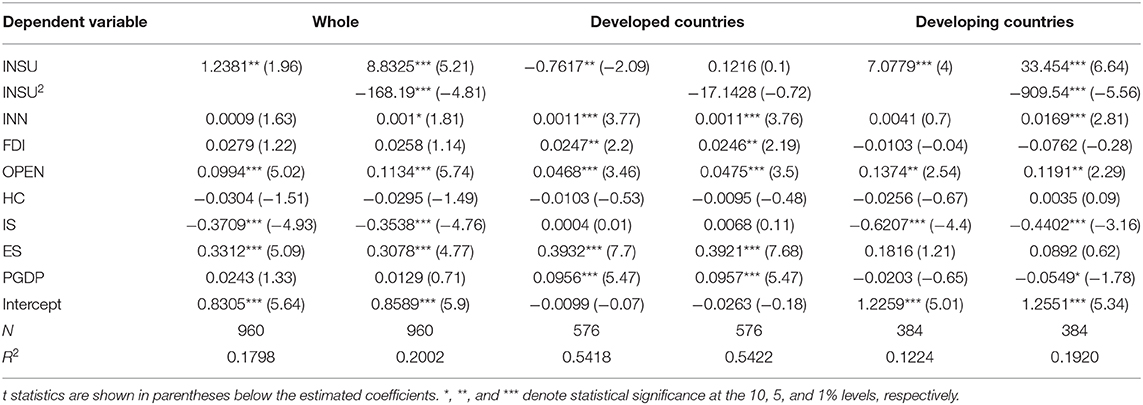
In financial development, banks and securities are more often represented as economic functions that create value for society, while insurance is more often represented as a social security function. Table 6 shows the regression result of the impact of insurance development on GTFP. For the whole sample, the coefficient of INSU is 1.2381, statistically significant at 5%, which indicates that securities development has a significant positive impact on GTFP. When we add the square of INSU in the regression model, we can find the coefficient of INSU is 8.8325, and the coefficient of INSU2 is −168.19; both of them are statistically significant at 1%. This shows that there an inverted U-shaped relationship exists between insurance development and GTFP. For the developing countries, we get similar conclusions. For developed countries, the coefficient of INSU is −0.7617, statistically significant at 1%. When we add the square of INSU in the regression model, neither INSU nor INSU2 had a significant impact on GTFP. This shows that when insurance development reaches a certain level, it will always have a negative impact on GTFP. Insurance provides individuals, enterprises, and other microeconomic entities with a way to transfer uncertainty, reduces the risks and costs of microeconomic entities' losses, and is conducive to the continuous development of various economic activities. Therefore, insurance development has a positive impact on GTFP. However, as the scale of insurance development continues to increase, assets such as stocks, and funds in insurance investments are more susceptible to financial turmoil and market sentiment, and perfect social security may lead to a decline in workers' enthusiasm for work. Therefore, when insurance development reaches a certain level, it will have a negative impact on GTFP.
Conclusion
This paper shows that financial development has a heterogeneous impact on GTFP, whether in different financial sectors or in different countries. The GML index is used to measure the GTFP for 40 countries over the period from 1991 to 2014. In order to study the impact of the development of different financial sectors on GTFP, we conduct empirical testing from three perspectives of financial development: bank, securities, and insurance. We also compare the differences between developed and developing countries. The main conclusions are as follows.
An inverted U-shaped relationship exists between financial development and GTFP. Bank development, securities development, and insurance development can all promote the growth of GTFP, and this growth-promotion effect will decrease as their level of development increases.
The impact of financial development on GTFP is heterogeneous in developing and developed countries. In developing countries, an inverted U-shaped relationship exists between financial development and GTFP, whether it is bank development, securities development, or insurance development. In developed countries, the development of banks and insurance has a significant negative impact on GTFP, while the development of securities has a significant positive impact on GTFP.
The impact of bank, securities, and insurance development on GTFP is heterogeneous. In the early stages of bank development, the increase in the level of bank development will enhance its positive impact on GTFP. When bank development reaches a certain level, an increase in the level of bank development will reduce its positive impact on GTFP, and it will even have a negative impact on GTFP. The impact of insurance development on GTFP is similar to that of bank development. In contrast to the impact of bank and insurance development on GTFP, when securities development reaches a certain level, it will always have a positive impact on GTFP. Securities development is thus more conducive to improving GTFP than bank development.
Data Availability Statement
The datasets generated for this study are available on request to the corresponding author.
Author Contributions
TL conceived and designed the study. GL contributed by writing the manuscript.
Funding
This article was supported by the National Social Science Foundation of China (No. 19BTJ049).
Conflict of Interest
The authors declare that the research was conducted in the absence of any commercial or financial relationships that could be construed as a potential conflict of interest.
References
Aghion, P., Bacchetta, P., and Banerjee, A. (2004). A corporate balance-sheet approach to currency crises. J. Econ. Theory. 119, 6–30. doi: 10.1016/j.jet.2003.06.004
Arcand, J. L., Berkes, E., and Panizza, U. (2015). Too much finance? J. Econ. Growth 20, 105–148. doi: 10.1007/s10887-015-9115-2
Asteriou, D., and Spanos, K. (2019). The relationship between financial development and economic growth during the recent crisis: evidence from the EU. Finance Res. Lett. 28, 238–245. doi: 10.1016/j.frl.2018.05.011
Baier, S. L., Dwyer, G. P Jr., and Tamura, R. (2006). How important are capital and total factor productivity for economic growth? Econ. Inq. 44, 23–49. doi: 10.1093/ei/cbj003
Brown, J. R., Martinsson, G., and Petersen, B. C. (2013). Law, stock markets, and innovation. J. Finance 68, 1517–1549. doi: 10.1111/jofi.12040
Buera, F. J., Kaboski, J. P., and Shin, Y. (2011). Finance and development: a tale of two sectors. Am. Econ. Rev. 101, 1964–2002. doi: 10.1257/aer.101.5.1964
Buera, F. J., and Shin, Y. (2013). Financial frictions and the persistence of history: a quantitative exploration. J. Political Econ. 121, 221–272. doi: 10.1086/670271
Caporale, G. M., Rault, C., Sova, A. D., and Sova, R. (2015). Financial development and economic growth: evidence from 10 new European Union members. Int. J. Finance Econ. 20, 48–60. doi: 10.1002/ijfe.1498
Chung, Y. H., Färe, R., and Grosskopf, S. (1997). Productivity and undesirable outputs: a directional distance function approach. J. Environ. Manage. 51, 229–240. doi: 10.1006/jema.1997.0146
Cole, H. L., Greenwood, J., and Sanchez, J. M. (2016). Why doesn't technology flow from rich to poor countries? Econometricas 84, 1477–1521. doi: 10.3982/ECTA11150
Costantini, V., Crespi, F., Marin, G., and Paglialunga, E. (2017). Eco-innovation, sustainable supply chains and environmental performance in European industries. J. Clean. Prod. 155, 141–154. doi: 10.1016/j.jclepro.2016.09.038
De Gregorio, J., and Guidotti, P. E. (1995). Financial development and economic growth. World Dev. 23, 433–448. doi: 10.1016/0305-750X(94)00132-I
Emrouznejad, A., and Yang, G. L. (2016). CO2 emissions reduction of Chinese light manufacturing industries: a novel RAM-based global Malmquist-Luenberger productivity index. Energ. Policy 96, 397–410. doi: 10.1016/j.enpol.2016.06.023
Fagiolo, G., Giachini, D., and Roventini, A. (2019). Innovation, finance, and economic growth: an agent-based approach. J. Econ. Int. Coord. 1–34. doi: 10.1007/s11403-019-00258-1
Färe, R., Grosskopf, S., and Pasurka, C. A. Jr. (2001). Accounting for air pollution emissions in measures of state manufacturing productivity growth. J. Reg. Sci. 41, 381–409. doi: 10.1111/0022-4146.00223
Gerarden, T. D., Newell, R. G., and Stavins, R. N. (2017). Assessing the energy-efficiency gap. J. Econ. Lit. 55, 1486–1525. doi: 10.1257/jel.20161360
Greenwood, J., and Jovanovic, B. (1990). Financial development, growth, and the distribution of income. J. Political Econ. 98, 1076–1107. doi: 10.1086/261720
Hsu, P. H., Tian, X., and Xu, Y. (2014). Financial development and innovation: cross-country evidence. J. Financ. Econ. 112, 116–135. doi: 10.1016/j.jfineco.2013.12.002
Huang, Z., Liao, G., and Li, Z. (2019). Loaning scale and government subsidy for promoting green innovation. Technol. Forecast. Soc. Change. 144, 148–156. doi: 10.1016/j.techfore.2019.04.023
Kenney, M. (2011). How venture capital became a component of the US national system of innovation. Ind. Corp. Change 20, 1677–1723. doi: 10.1093/icc/dtr061
King Robert, G., and Levine, R. (1993). Finance, entrepreneurship and growth. J. Monet. Econ. 32, 513–542. doi: 10.1016/0304-3932(93)90028-E
Kwakwa, P. A., Alhassan, H., and Aboagye, S. (2018). Environmental Kuznets curve hypothesis in a financial development and natural resource extraction context: evidence from Tunisia. Quant. Finance Econ. 2, 981–1000. doi: 10.3934/QFE.2018.4.981
Law, S. H., Azman-Saini, W. N. W., and Ibrahim, M. H. (2013). Institutional quality thresholds and the finance–growth nexus. J. Bank. Finance 37, 5373–5381. doi: 10.1016/j.jbankfin.2013.03.011
Law, S. H., and Singh, N. (2014). Does too much finance harm economic growth? J. Bank. Finance 41, 36–44. doi: 10.1016/j.jbankfin.2013.12.020
Li, J., Zhang, J., Zhang, D., and Ji, Q. (2019). Does gender inequality affect household green consumption behaviour in China? Energy Policy. 135:111071. doi: 10.1016/j.enpol.2019.111071
Li, Y., Ji, Q., and Zhang, D. (2020). Technological catching up and innovation policies in China: what is behind this largely successful story? Technol. Forecast. Soc. Change 153:119918. doi: 10.1016/j.techfore.2020.119918
Li, Z., Liao, G., and Albitar, K. (2020). Does corporate environmental responsibility engagement affect firm value? The mediating role of corporate innovation. Bus. Strategy Environ. 29, 1045–1055. doi: 10.1002/bse.2416
Li, Z., Liao, G., Wang, Z., and Huang, Z. (2018). Green loan and subsidy for promoting clean production innovation. J. Clean. Prod. 187, 421–431. doi: 10.1016/j.jclepro.2018.03.066
Liao, G., and Drakeford, B. (2019). An analysis of financial support, technological progress and energy efficiency: evidence from China. Green Finance 1, 174–187. doi: 10.3934/GF.2019.2.174
Longhofer, W., and Jorgenson, A. (2017). Decoupling reconsidered: does world society integration influence the relationship between the environment and economic development? Soc. Sci. Res. 65, 17–29. doi: 10.1016/j.ssresearch.2017.02.002
Maes, J., and Jacobs, S. (2017). Nature-based solutions for Europe's sustainable development. Conserv. Lett. 10, 121–124. doi: 10.1111/conl.12216
Nassani, A. A., Aldakhil, A. M., Abro, M. M. Q., and Zaman, K. (2017). Environmental Kuznets curve among BRICS countries: spot lightening finance, transport, energy and growth factors. J. Clean. Prod. 154, 474–487. doi: 10.1016/j.jclepro.2017.04.025
Ntarmah, A. H., Kong, Y., and Gyan, M. K. (2019). Banking system stability and economic sustainability: a panel data analysis of the effect of banking system stability on sustainability of some selected developing countries. Quant. Finance Econ. 3, 709–738. doi: 10.3934/QFE.2019.4.709
Oh, D. H. (2010). A global Malmquist-Luenberger productivity index. J. Prod. Anal. 34, 183–197. doi: 10.1007/s11123-010-0178-y
Pata, U. K. (2018). Renewable energy consumption, urbanization, financial development, income and CO2 emissions in Turkey: testing EKC hypothesis with structural breaks. J. Clean. Prod. 187, 770–779. doi: 10.1016/j.jclepro.2018.03.236
Rioja, F., and Valev, N. (2004). Does one size fit all: a reexamination of the finance and growth relationship. J. Dev. Econ. 74, 429–447. doi: 10.1016/j.jdeveco.2003.06.006
Romer, P. M. (1986). Increasing returns and long-run growth. J. Political Econ. 94, 1002–1037. doi: 10.1086/261420
Ruiz, J. L. (2018). Financial development, institutional investors, and economic growth. Int. Rev. Econ. Finance 54, 218–224. doi: 10.1016/j.iref.2017.08.009
Seven, U., and Coskun, Y. (2016). Does financial development reduce income inequality and poverty? Evidence from emerging countries. Emerg. Mark. Rev. 26, 34–63. doi: 10.1016/j.ememar.2016.02.002
Shahzad, S. J. H., Kumar, R. R., Zakaria, M., and Hurr, M. (2017). Carbon emission, energy consumption, trade openness and financial development in Pakistan: a revisit. Renew. Sust. Energ. Rev. 70, 185–192. doi: 10.1016/j.rser.2016.11.042
Shi, X., and Sun, S. (2017). Energy price, regulatory price distortion and economic growth: a case study of China. Energ. Econ. 63, 261–271. doi: 10.1016/j.eneco.2017.02.006
Solow, R. M. (1957). Technical change and the aggregate production function. Rev. Econ. Stat. 39, 312–320. doi: 10.2307/1926047
Song, Y., Chen, S., and Zhang, M. (2020). Local government heterogeneity and regional environmental cooperation—evolutionary game analysis based on Chinese decentralization. Chinese J. Manage. Sci. 28, 201–211. doi: 10.16381/j.cnki.issn1003-207x.2020.01.017
Song, Y., Ji, Q., Du, Y. J., and Geng, J. B. (2019). The dynamic dependence of fossil energy, investor sentiment and renewable energy stock markets. Energ. Econ. 84:104564. doi: 10.1016/j.eneco.2019.104564
Tone, K. (2001). A slacks-based measure of efficiency in data envelopment analysis. Eur. J. Oper. Res. 130, 498–509. doi: 10.1016/S0377-2217(99)00407-5
Tripathy, N. (2019). Does measure of financial development matter for economic growth in India? Quant. Finance Econ. 3, 508–525. doi: 10.3934/QFE.2019.3.508
Wachtel, P. (2001). Growth and finance: what do we know and how do we know it? Int. Finance 4, 335–362. doi: 10.1111/1468-2362.00077
Wang, K. L., Miao, Z., Zhao, M. S., Miao, C. L., and Wang, Q. W. (2019). China's provincial total-factor air pollution emission efficiency evaluation, dynamic evolution and influencing factors. Ecol. Indic. 107:105578. doi: 10.1016/j.ecolind.2019.105578
Xia, Y., Kong, Y., Ji, Q., and Zhang, D. (2019). Impacts of China-US trade conflicts on the energy sector. China Econ. Rev. 58:101360. doi: 10.1016/j.chieco.2019.101360
Xu, X., Wei, Z., Ji, Q., Wang, C., and Gao, G. (2019). Global renewable energy development: influencing factors, trend predictions and countermeasures. Res. Policy 63:101470. doi: 10.1016/j.resourpol.2019.101470
Zhang, C., Liu, H., Bressers, H. T. A., and Buchanan, K. S. (2011). Productivity growth and environmental regulations-accounting for undesirable outputs: analysis of China's thirty provincial regions using the Malmquist-Luenberger index. Ecol. Econ. 70, 2369–2379. doi: 10.1016/j.ecolecon.2011.07.019
Keywords: financial structure, financial development, green total factor productivity, heterogeneity, developed and developing countries
Citation: Li T and Liao G (2020) The Heterogeneous Impact of Financial Development on Green Total Factor Productivity. Front. Energy Res. 8:29. doi: 10.3389/fenrg.2020.00029
Received: 19 January 2020; Accepted: 14 February 2020;
Published: 20 March 2020.
Edited by:
Qiang Ji, Chinese Academy of Sciences, ChinaReviewed by:
Ming Zhang, China University of Mining and Technology, ChinaXuejiao Ma, Dalian University of Technology, China
Copyright © 2020 Li and Liao. This is an open-access article distributed under the terms of the Creative Commons Attribution License (CC BY). The use, distribution or reproduction in other forums is permitted, provided the original author(s) and the copyright owner(s) are credited and that the original publication in this journal is cited, in accordance with accepted academic practice. No use, distribution or reproduction is permitted which does not comply with these terms.
*Correspondence: Gaoke Liao, liaogaoke@hnu.edu.cn
 Tinghui Li1
 Gaoke Liao