 Kelvin A. Pacheco
 Alessandra C. Reis
 Antônio E. Bresciani
 Claudio A. O. Nascimento
 Rita M. B. Alves
- Department of Chemical Engineering, Polytechnic School, University of São Paulo, São Paulo, Brazil
Several international agreements, focused on regulating greenhouse gases emissions in the atmosphere, were created due to the growing concern about the climate change due to human action. The carbon dioxide (CO2) emissions account for more than 70% of the total greenhouse gases emissions; among the CO2 emitting sectors, electricity generation accounts for 25% of the global emissions. CO2 emissions from Brazilian power plants motivated their mapping, a method was proposed to performance a local market analysis for potential products from CO2 chemical conversion. The forecast behavior of this market for 2030 was also calculated. Among the studied products, methanol, polycarbonates, formic acid and acetaldehyde are the most promising for local manufacture. The States of São Paulo, Paraná, Amazonas, Bahia, Rio Grande do Sul and Santa Catarina are the most promising regions in terms of potential of CO2 utilization.
1. Introduction
The increasing concern about the environmental impact generated by global warming has stimulated a series of international agreements aimed at regulating greenhouse gases (GHG) emissions in the atmosphere. The UNCHE (United Nations Conference on the Human Environment) in Stockholm (1972) is considered the first discussion about the global human influence on the environment. More recently, in 2005, the Kyoto Protocol entered into force, committing its Parties by setting internationally binding GHG emission reduction targets at least 18% below 1990 levels until 2020 (United Nations, 1998; UNFCCC, 2015). The Paris Agreement (the last one signed) goal is to enhance the global response to the threat of climate change by ensuring the average global temperature increase, in this century, below 2°C above pre-industrial levels and to continue efforts to limit temperature rise to up to 1.5°C above pre-industrial levels (UNFCCC, 2015).
In 2016, total global GHG emissions continued to increase steadly by about 0.5% (±1%), to about 53.4 Gt CO2-eq (including land use, land-use change and forestry emissions, estimated at about 4.1 Gt), the slowest since the early 1990s, except for global recession years, according to Olivier et al. (2017). This result is justified by the partial replacement of coal consumption from fuel to natural gas and the increasing renewable power generation (wind and solar power, mostly).
GHG are basically composed of carbon dioxide (CO2), methane (CH4), nitrous oxide (N2O) and fluorinated gases (F-gases). Although CO2 is not the worse gas, its emissions account for more than 70% of the total GHG emissions, according with Figure 1A. Emphasizing CO2, Figure 1B shows the CO2 emitting sectors. Among them, electricity generation stands out, accounting for 25% of the global emissions (IPCC, 2014).
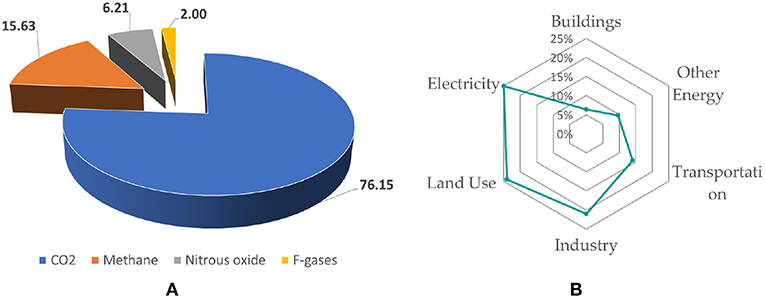
Figure 1. GHG and CO2 emissions: (A) GHG emission composition (Olivier et al., 2017) and (B) CO2 emissions (%) per sector (IPCC, 2014).
Since thermoelectric plants represent large, capital-intensive facilities with a 40-year technical (and economic) lifetime, there must be a link between profit maximization and concern for the environment and GHG emissions (Bogmans et al., 2017).
According to Azevedo and Angelo (2018), in 2016, Brazil emitted about 1.7 billion tons of carbon dioxide equivalent (GtCO2). This represents nearly 3% of global emissions (around 56 GtCO2), placing Brazil as the sixth largest emitter of the globe. Natural gas has increased its share in electricity generation since 2000, with the third source in the matrix accounting for 8% of total capacity. In 2014, 81 TWh of electricity from natural gas were produced, representing a growth of twenty times compared to the year 2000 (Empresa de Pesquisa Energética, 2017). According to the Energy Research Company (Empresa de Pesquisa Energética, 2017), installed capacity in the 2016-2026 expansion program forecasts an increase of more than 38%, from 12,532 MW in 2016 to 17,339 MW in 2026 for natural gas. Due in part to the increase in the supply of natural gas being estimated with pre-salt production and unconventional gas sources expanding from 55 million m3 in 2014 to 180 million m3 in 2050 (Campos et al., 2017). These data show the importance and necessity of the country adopting low carbon policies.
In 2015, at COP-21, the Paris Agreement was drafted, involving commitments to reduce GHG emissions. Brazil proposed to reduce its emissions by 37% in 2025, based on the 2005 emissions (Empresa de Pesquisa Energética, 2017).
To this end, several treatment systems to reduce CO2 have been proposed by researchers and industries. Among them are: (i) more efficient energy production, (ii) changing the fuel matrix, (iii) Carbon Capture, Use and Storage (CCUS) (do Espirito Santo and Gallo, 2017).
The term Carbon Dioxide Utilization (CDU), a subcategory of CCUS, describes a number of technologies that consume CO2 to provide services or to manufacture products aiming at an economic benefit. In some cases, the capture of CO2 is included in the definition, and the term is also referred to as Carbon Capture and Utilization (CCU) in an analogy to the term often used, CCS. The difference between the two concepts is that in CCS, carbon dioxide is stored (underground/marine reservoirs), while in the CDU/CCU, it is used in the economy (Zimmermann and Kant, 2015). According to Aresta et al. (2013), CDU technologies, due to their inherent potential, can be complementary to the CCS techniques.
Research and development is, therefore, crucial to move toward a competitive CCUS technology, from the most fundamental level of research (e.g., Haunschild, 2015, focusing on catalyst research) to integrated studies at the conceptual design level as a complete plant in the work by Milani et al. (2015). Thus, there is a need for a detailed analysis regarding the impact that different CDU options/processes have on the energy of the system and under which conditions the products obtained can have a sustainable market (Pérez-Fortes et al., 2016a).
The CDU represents a new economy for CO2, since captured CO2 could be used as a feedstock for other processes, including the synthesis of chemicals and materials (such as methanol, formic acid, polyols for polyurethanes, carbonates), fuels (such as methane or kerosene) and direct use in applications based on the physicochemical properties of CO2 (as the supercritical state) (Peters et al., 2011).
Since CO2 is emitted from a source and, therefore, supplied at a rate faster than its current consumption, CO2 for utilization can be considered a renewable alternative source of carbon, ideally leading to carbon neutral cycles in processes with sources of large amounts of CO2 (such as power plants) (Gale et al., 2005).
The use of CO2 can reduce emissions through two main effects: first, -directly, – through CO2 consumption, thus preventing its release into the atmosphere and second, – indirectly, – by replacing inputs in intensive emission of GHG. According to von der Assen et al. (2013), the indirect effect may have a greater impact than the direct effect, but its quantification requires substantial simulation efforts and is the object of future research studies.
Worldwide, about 37 billion tons of CO2 were issued in 2010 (Mikkelsen et al., 2010; Parsons Brinckerhoff, 2011). According to Inagendo (2015) and Pérez-Fortes et al. (2016b), 0.4–0.5% of the emitted carbon is used, it represents 144–185 Mton of CO2 used in the industry. According to Aresta et al. (2013) the estimate is that 172 million tons of CO2 are directly consumed in industrial processes per year (2013 base year): urea accounts for 114 Mton/year, methanol 8 Mton/year, inorganic carbonates ca 50 Mton/year and the group of organic carbonates and salicylic acid together represent less than 1 Mton/year. The growth potential, however, can reach 10% of the carbon emitted today, totalling 3.7 billion tons per year (Mikkelsen et al., 2010; Parsons Brinckerhoff, 2011).
CDU technologies can be divided into two main categories: technological use (physical processes) and chemical/catalytic conversion (chemical processes or biological/biochemical processes). Figure 2A displays CO2 utilization alternatives.
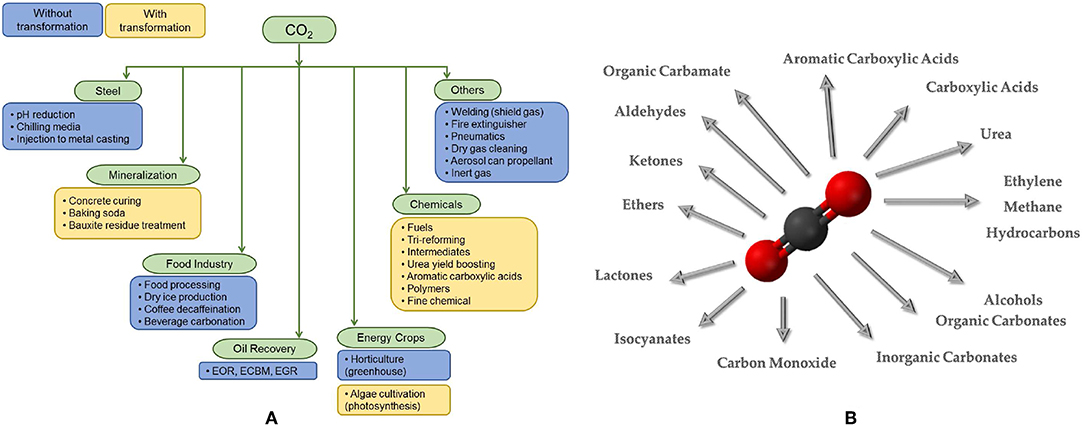
Figure 2. (A) CO2 utilization alternatives. (B) Synthetic processes for some products obtained from CO2, divided into categories.
The technological use is related to the physical nature, including compression, recycle, phase transition, etc. Among practical uses are the preservation of cereals (bactericidal), beverage additives, food packaging, dry cleaning, extraction, mechanical industries, fire extinguishers, air conditioning, as well as water treatment (Aresta et al., 2014).
Concerning CO2 conversion, three main groups may be considered: chemical, mineralization, and bio-based routes (Chauvy et al., 2019). The first category is focused on organic synthesis [including photocatalysis and chemical photocatalysis (Li et al., 2016), thermochemical processes (Pakhare and Spivey, 2014), and electrochemistry (Albo et al., 2015)]. The second category is inorganic mineralization (building materials Pekdemir, 2014) and the last category uses microorganism to consume CO2 and produce high added-value products (Aresta et al., 2014).
So, based on important factors, such as distribution cost of energy, resources and implementation time, conversion of CO2 into fuels or chemicals is an attractive solution, which, in addition to reducing greenhouse gases, provides alternative sources of profit from the sale of manufactured products. In the manuscript, the focus was on organic synthesis of chemicals from CO2, a more embracing study is important, however is out of the scope of this study.
Many products and processes can use CO2 as raw material to synthesize different chemicals (Figure 2B). Each product or production process brings some advantages and some penalties, making important to define some criteria to evaluate and to choose the most attractive products and processes.
Markewitz et al. (2012) show two environmental criteria and one commercial criterion. The amount of CO2 is computed by energy and carbon balances and represents how much carbon is fixed and the weight of the contribution to minimize global warming. The duration of fixation is evaluated by life-cycle assessment and represents how long this carbon will be out of the atmosphere. Value generation represents the commercial attractiveness and how the product or process is self-sustainable.
Dairanieh (2016) shows two environmental and three commercial criteria. CO2 potential and permanence of capture are similar to the first two criteria of Markewitz et al. (2012). Willingness to pay is a criterion based on the product market price and represents how much the CO2 is valued. Ease of implementation is a commercial criterion and represents the difficulties in entring in a market. Side effects and co-benefits evaluates other effects as either positives (or negatives), such as reduced air pollution or increase in fossil fuels consumption. This study recommends investments in eight products of four clusters: (i) Building materials (concrete and carbonate aggregates), (ii) Chemical intermediates (methanol, syngas, and formic acid), (iii) Fuels (liquid fuels, methane) and (iv) Polymers (polyols and polycarbonates).
Otto et al. (2015) studied 123 CO2 utilization reactions, 23 to produce bulk chemicals (more than 10 kt/y) and 100 to produce fine chemicals (less than 10 kt/y). For bulk chemicals, the criteria were: specific mass of CO2 as a feedstock (mass of CO2 necessary to produce one kg of a product), CO2 avoidance potential (mass of CO2 necessary to produce one kg of a product multiplied by the global production), relative added value (difference between the value of the product and the prices of the reagents), independence from fossil reactants (if no carbon from fossil is used). Using these criteria, 6 bulk chemicals were chosen (formic acid, oxalic acid, formaldehyde, methanol, urea and DME). For fine chemicals, with similar criteria, the products selected were methylurethane, 3-oxo-pentanedioic acid, 2-imidazolidinone, ethylurethane, 2-oxazolidone and isopropyl isocyanate.
This work propose a method that aims to analyze the Brazilian market for potential products from CO2 chemical conversion, as well as to predict the behavior of this market in 2030. The selected products are used in a methodological framework for a region prioritization at a national level. This method may be easily applied for other countries through market analysis.
2. Methods
The proposed method comprises four steps. (1) Defining criteria to evaluate the products, grouped into technological, environmental and economical criteria; (2) Collecting data for each product; (3) Generating the decision matrix and carrying out a sensitivity analysis; (4) Carring out a top-down approach methodology including opportunity identification, resulting in cluster identification and region prioritization for Brazil.
2.1. Multiple Criteria Decision Analysis Assessment
Multiple criteria decision analysis (MCDA) refers to making preference decisions (e.g., evaluation and selection) over the available alternatives characterized by multiple, usually conflicting, attributes.
MCDA is a branch of operations research and deals with planning scientific and computational apparatuses to address a limited number of choices under a limited number of criteria by a unique or a group of decision makers.
There is a wide variety of approaches, for example analytic hierarchy process (AHP) (Saaty, 1977), Preference Ranking Organization Method for Enrichment Evaluations (PROMETHEE) (Brans and Vincke, 1985), Technique for Order Preference by Similarity to an Ideal Solution (TOPSIS) (Behzadian et al., 2012; Hwang and Yoon, 2012) and the simple additive weighted (SAW) method (Kirkwood and Corner, 1993) which have been successfully utilized in dealing with MCDA problems.
The latter two approaches were used in different case studies to select the most promising products for further/deeper study. The TOPSIS method designates alternatives that simultaneously have the shortest distance from the positive ideal solution (maximization of benefit criteria) and the farthest distance from the negative-ideal solution (maximization of cost criteria). More details about the method can be found in the work by Hwang and Yoon (2012). The SAW method is simpler as compared to TOPSIS, performing only the summation of the products of weight and the normalized value of each alternative.
The calculations of the TOPSIS method was performed using the python module Scikit-Criteria (Scikit-Criteria, RRID:SCR_017084) v0.2.10 (Cabral et al., 2016) running on python v2.7.15; for the SAW method, simple spreadsheets and MATLAB R2015a were used.
2.2. Criteria Description
The option of using CO2 for chemical conversion has thermodynamic and intrinsic kinetic restrictions. Estimating their real potential will require a thorough comparative analysis of proposed and existing processes to determine whether or not the proposed conceptual plant reduces CO2 emissions (directly or indirectly), and whether there is a sale of the obtained chemicals (Peters et al., 2011).
The evaluation of rejection or acceptance of the proposal will produce reliable results only if significant number of parameters is used; for this situation, ten criteria were employed. The criteria were grouped into technical, environmental and economic.
2.2.1. Technical Group
For the technical group, the standard enthalpy of reaction () and the Technical Readiness Level (TRL) were evaluated.
Equation (1) was used to calculate the enthalpy of reaction. This was done by executing basic algebraic operations based on chemical equations of reactions taking into account the values of enthalpies of formation of the gas phase
The enthalpy of reaction can be determined by scaling each species enthalpy of formation [obtained from the literature - NIST (2018) or NIST-TDE inside Aspen Plus commercial simulator] by its stoichiometric coefficient νi. In this study, only direct conversion routes to the products were considered, i.e., the CO2 reacts with one or more reactants to directly form the products under assessment.
TRL is a systematic metric/measurement system that determines the maturity of a specific technology. The methodology was proposed by NASA and, due to its simplicity and versatility, it expanded to other domains as well (European Commission, 2013).
In this case, the TRL scale measures the development of technology from its basic concept (TRL 1) to being available at commercial/industrial scale (TRL 9), reaching the physical scale of deployment or its maximum technical maturity. Each step in between represents the increase in the level of maturity of the technology.
The TRL assessment refers to the innovative route for each product, not the conventional one. The TRL applied to this study ranges from basic and applied research, proof of concept and laboratory testing (stages 1–5), to prototyping, piloting and final development (stages 6–8), to full- scale deployment/market introduction (9).
Several products manufactured using CO2 as a feedstock have been studied and produced. An overview of the set of compounds and their technological path can be found in international reports (Parsons Brinckerhoff, 2011; Bocin-dumitriu et al., 2013; CO2 Sciences and The Global CO2 Initiative, 2016; Zimmermann and Schomäcker, 2017; Zimmermann et al., 2017), which are used to assign TRL to the chemicals described in section 2.3.
2.2.2. Environmental Group
For the environmental group, the willingness to pay (WP), scientific relevance, side effects and benefits and utilization ratio were evaluated.
The side effects and benefits and WP were proposed by Dairanieh (2016) to evaluate CO2 products. The first criterion of this group (side effects and benefits) is related to the increased production of fossil fuels and the avoidance of a hazard route. The second criterion, despite being based on the economics of the target market, it is set in the environmental group because it represents the unit cost/price point of CO2 supply at which the product is competitive for that use ($/tonne of CO2).
The scientific relevance is a criterion proposed by Otto et al. (2015), defined as the number of related references of a certain chemical (SCI-Finder database). According to the author, this criterion discerns rare application chemicals from diverse application chemicals. The former belong either to basic research or speciality chemicals; the latter can be use of a wide variety of applications as a feedstock, which are more attractive from an ecological and economic point of view. The number of citations was gathered in October and November 2018.
The utilization ratio is the amount fixed, which takes into consideration the mass of carbon dioxide, the mass of product and their respective stoichiometric coefficient (CO2 and reference product) as shown in Equation (2).
Where mCO2 is the mass of CO2, mP is the mass of product, νCO2 is the stoichiometric coefficient for CO2, while νp is for product, MCO2 is the molecular weight of CO2 and Mp is the molecular weight of the product.
2.2.3. Economic Group
The economic group represents the market-related criteria (demand and price). The imports and exports (amount and price) of the compounds were taken into account. The data for the value (in millions of US$) were stated in Free On Board (FOB) value, which means that the exporter is responsible for the merchandise until it is inside the ship, for transportation, at the port indicated by the buyer.
The values of imports and exports for 2030 were forecast and the harmonized mean of values from 2015–2018 and 2030 for each chemical were used in the decision matrix.
The annual data were collected from the official website of foreign trade statistics of the Brazilian government (AliceWeb, 2018).
2.2.4. Forecast Method
Time series analysis is a tool for forecasting future values, based on past and present events (Wei, 2006). There are several forecasting alternative methodologies classified in automatic and non-automatic approach. While the latter required prior exploratory data analysis for each case, the former does it automatically.
Papacharalampous et al. (2018) explore the capability of seven different forecast methods used to predict monthly temperature and precipitation. The methods are a naïve, random walk (with drift), ARFIMA (AutoRegressive Fractionally Integrated Moving Average), BATS (Box–Cox transform, ARMA errors, Trend, and Seasonal components), simple exponential smoothing, Theta and Prophet. Their results indicate that the last five models performed better than the first two and the Prophet method is competitive.
In this work, the facebook prophet model (Taylor and Letham, 2017b) was used. It was introduced in 2017, inspired by a nature of time series forecast by the company. The package is available at an R library named ‘prophet' (Taylor and Letham, 2017a). The procedure used by prophet is additive regression model with the main components: a linear growth curve trend, yearly seasonal components modeled using the Fourier series.
The 2030 values were forecast for each product using the data available from 2000 to 2018. The time series analysis was based on its past values using prophet package (Prophet, RRID:SCR_017083) version 0.5 on R [version 3.6.0 (2019-04-26)].
2.3. Data Collection
A database of 13 chemicals was selected from the open literature as products from CO2 conversion (Aresta et al., 1996, 2013, 2015; Song, 2006; Aresta and Dibenedetto, 2007; Aresta, 2010; Styring et al., 2011; Otto et al., 2015), for which was possible to retrieve their data related to Brazilian Statistics.
The chemical compounds used in this assessment are listed: (1) Acetaldehyde; (2) Acetic Acid; (3) Acetone; (4) Benzoic Acid; (5) Formaldehyde; (6) Formic Acid; (7) Methacrylic Acid; (8) Methanol; (9) Oxalic Acid; (10) Polycarbonates; (11) Propanol; (12) Salicylic Acid; and (13) Urea.
2.4. Weighting Method
The weight for each criterion can be assigned to two group categories: subjective and objective weights. Subjective weights are determined based on the preference of the decision maker [e.g., AHP method (Saaty, 1977), weighted least squares method (Chu et al., 1979), Delphi method (Hwang and Lin, 2012) and equal weights]. Objective methods determine weights by solving mathematical models and do not account for the decision maker preference [e.g., Shannon entropy method (Shannon, 1948; Zeleny, 2012) and multiple objective programming (Choo and Wedley, 1985)].
For solving problems, the expertise of a decision maker ought to be calculated; in this case, subjective weighting is preferable. However, when reliable subjective weights are difficult, objective weighting must be selected.
The Shannon information entropy measures the predicted value of the information contained in a message, usually in units of bits, nats or bans. The value is the average unpredictability in a random variable, equivalent to its information essence. In the MCDA context, the entropy method is an objective method to assign weights depending on the decision matrix (Shannon, 1948; Zeleny, 2012). The relative weight of criterion j is calculated in relation to the amount of information supplied by the intrinsic set of alternatives.
The concept of entropy in an information channel was proposed by Shannon (1948) and the procedure defines a series of steps:
(a) Normalization of data.
(b) In order to remove anomalies with different measurements units and scales, the normalization procedure is carried out. Considering , j = 1, ⋯ , m, i = 1, ⋯ , n, where pij is the normalized data and xij is the raw data (i alternative on j criterion).
(c) Calculation of the entropy
Entropy Ej for criterion j is calculated according to Equation 3
The entropy constant E0 was calculated as ln(m)−1.
(c) Calculation of Diversity Criterion
The diversity criterion is then calculated using Equation 4, which represents the degree of diversification.
(d) Computation of normalized weight
Finally, the degree of importance is calculated according to Equation (5)
The closer the entropy of a criterion is to 1, the less important the criterion is. Shannon entropy measures the amount of uncertainty with a probability distribution in terms of entropy taking into account the complete set of information available.
Along with Shannon entropy, subjective weighting was also employed in the case studies described in section 2.5.
2.5. Sensitivity Analysis
In order to evaluate the use of a MCDA method (either TOPSIS or SAW) and the weighting system (either objective or subjective), a sensitivity analysis was carried out.
Table 1 shows the case studies involved in the sensitivity analysis.
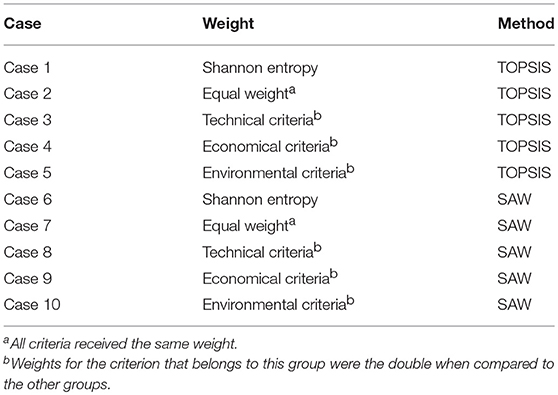
Table 1. Different case studies involved in the sensitivity analysis.
As a result, the most promising products will appear more often in the first places.
2.6. Opportunity Identification Approach
A top-down methodology approach developed by Patricio et al. (2017a,b) consisting of three consecutive steps was adapted and used to identify opportunities for CCU at national level. In the first step, technologies that use CO2 in Brazil were identified. The second step is the geographical location of thermoelectric power plant (Natural Gas-based). The third step is matching the sources with the potential receiver, based only on geographic parameters.
2.6.1. Emission Calculations
In order to evaluate the CO2 emissions of a Power Plant, the net capacity factor and the power capacity are used to calculate the energy generated in a year, according to Equation 6 (Ruggero, 2017; U.S.NRC, 2018).
Where Ea is the annually produced energy, Fc is the capacity factor and C is the power plant installed capacity.
The capacity factor is the ratio of the actual output over a period. The data used in these calculations was based on a statistics of the Brazilian Government (MME - Ministério de Minas e Energia, 2017) for the year 2016, for the public generation of energy based on natural gas. The average FC of 2016 was 0.43, a much lower indicator than in 2015 (0.72), but still higher than in 2011 (0.26). According to Araújo et al. (2017), the installed capacity of a power plant is directly proportional to its CO2 emission (517 g CO2/kWe-h), these values are then used.
3. Results and Discussions
3.1. Forecast Results
A time series forecasting model is designed to handle the common features of the business time series of imports and exports. The investigation of the predictability of imports and exports of 13 chemical products was performed from 2000 to 2018 to forecast 2030 values.
Figures 3A,B present statistical data on the Brazilian trade balance of the last 4 years, in terms of imports absolute volume and value in US dollars, respectively, as well as the projection of these values for 2030. It is worth mentioning that no more CO2 conversion products were analyzed, due to the difficulty in finding theirs NCM in the Brazilian trade system.
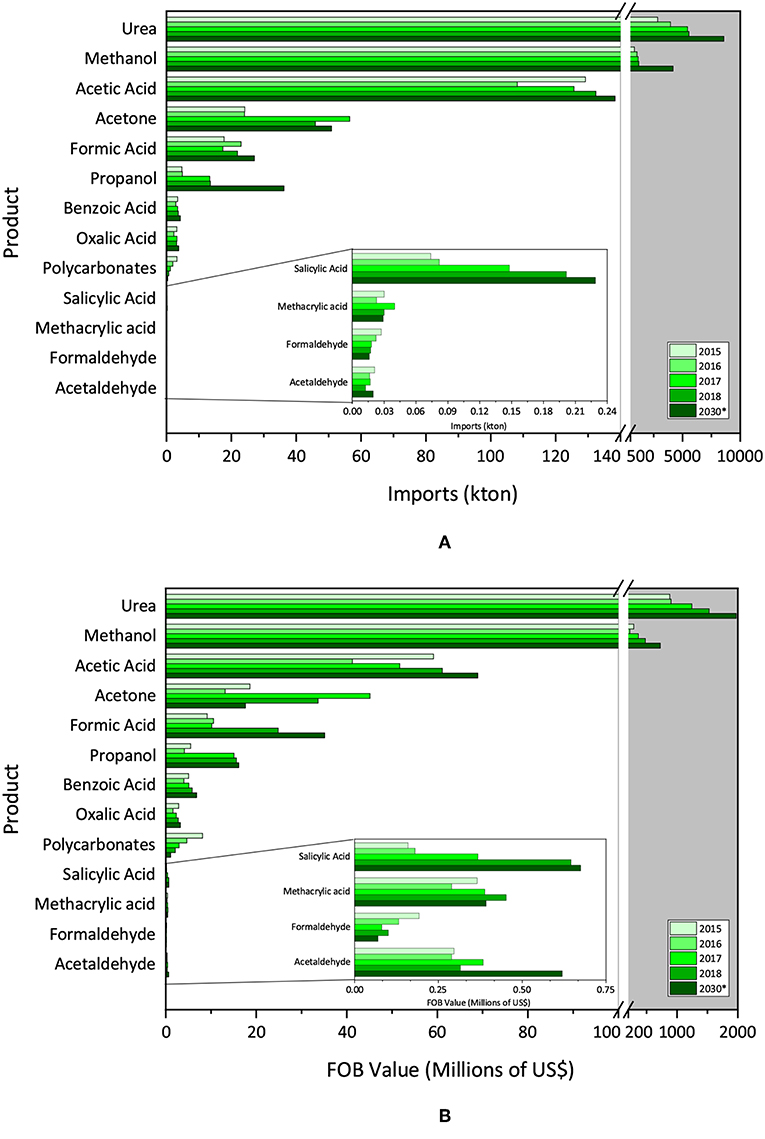
Figure 3. (A) Brazilian importation data (absolute volume) and (B) Brazilian importation data (FOB value).
The annual absolute quantity imported (kton) is highlighted by the large average amount of urea, methanol and acetic acid imported (8574, 4168.7, 1383.4 kton, respectively for 2030) in this period, with tendency to increase in the evaluated period.
Next, come acetone and formic acid, showing forecast tendency to increase. Acetone was forecast to increase the imported absolute amount (from 45.9 kton in 2018 to 50.9 kton in 2030) and formic acid was forecast to increase 23.93% from 2018 to 2030. The other products exhibited imports smaller than 5 kton/year each (except for propanol in 2018 with 13.5 kton).
Regarding the value generated in the transactions, Figure 3B depicts the imports in millions of US$. Urea, methanol and acetic acid were the products with the highest value. However, the values for acetic acid are followed more closely by acetone, formic acid and acrylic acid, which have higher added value. Comparing 2030 to 2018, there is an increasing trend of import costs for methanol, acetic acid and urea, while a decrease for acetone.
It is possible to calculate the prices for imports and exports, taking into account the FOB value divided by the absolute amount for each chemical product (see Table 2 for details).
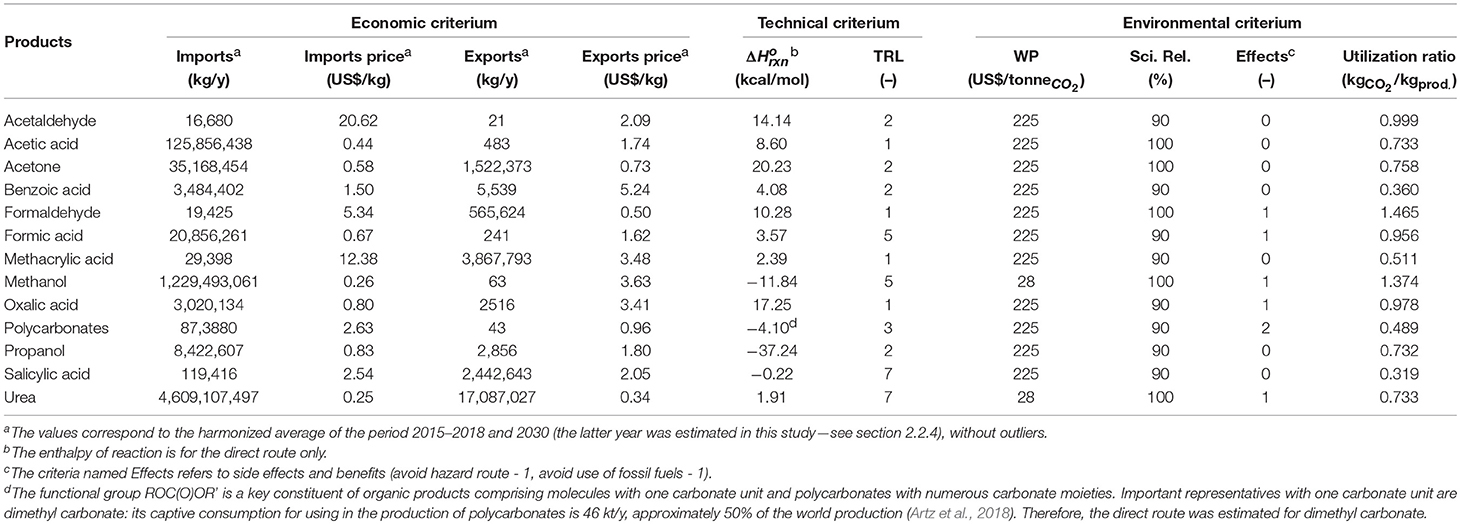
Table 2. Multi-criteria performance matrix for assessing CO2 products.
The situation changes when the prices are taken into account; the most expensive imported product is acetaldehyde, followed by methacrylic acid. Formaldehyde presented an oscillation during the evaluated period from 7.03 US$/kg in 2015 to 5.83 US$/kg in 2018. Polycarbonates were imported for an average price of 2.60 US$/kg, similar to salicylic acid (2.51 US$/kg).
Figure 4A reveals the annual absolute exported quantity (kton), while Figure 4B shows the involved costs.
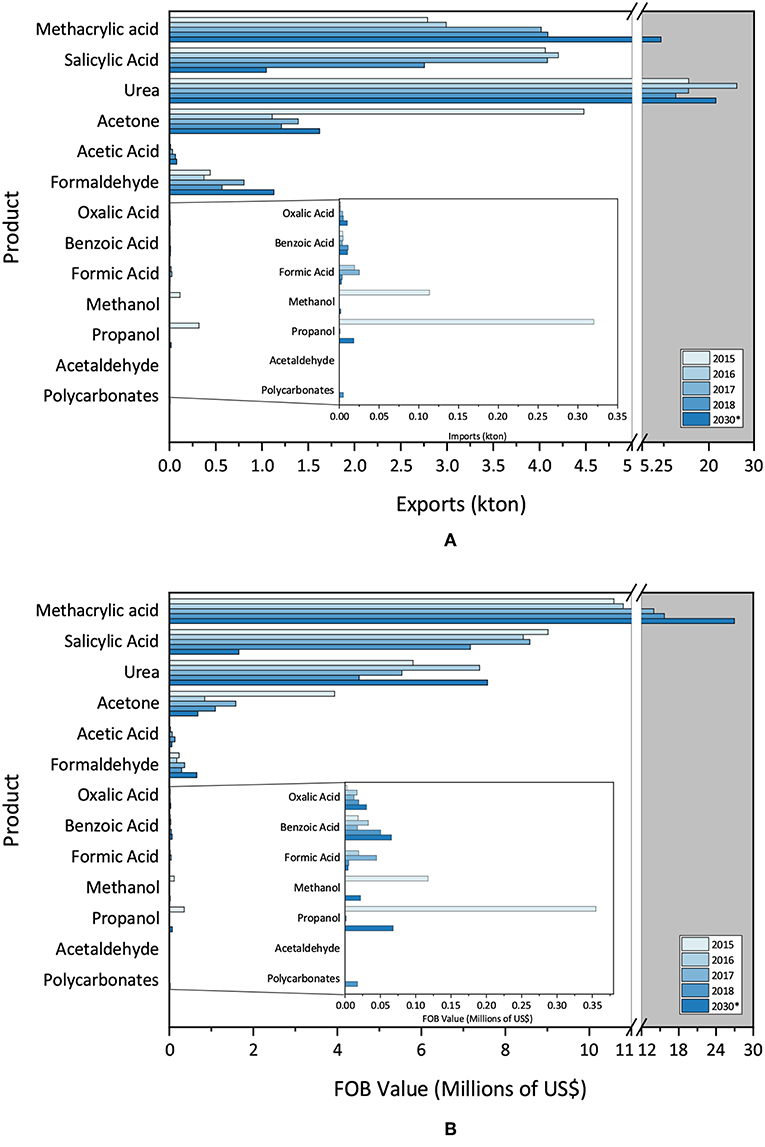
Figure 4. (A) Brazilian exportation data (absolute volume) and (B) Brazilian exportation data (FOB value).
Figure 4A points out the high average amount of methacrylic acid, salycilic acid and urea exported, followed by acetone, acetic acid and formaldehyde, all tending to increase exports in 2030, as compared with 2018, except for methacrylic acid.
Figure 4B displays the expected behavior of the exportation costs involved for products. Due to the higher market value, the export profit of methacrylic acid exceed that of urea. In 2030, as compared with 2018, profits appear to be higher for methacrylic acid and urea, and smaller for salicylic acid and acetone.
Anomalous data did not have a great impact on the forecast, due to the robustness of the time series analysis method. According to Papacharalampous et al. (2018), comparing different forecast methods, prophet exhibited the smallest median RMSE for the temperature forecasts, while offering 13–32% (depending on the examined set of time series) more accurate results than naïve. In their case, the model is competitive to the ARFIMA, BATS, simple exponential smoothing and Theta models.
3.2. Multi-Criteria Performance Matrix
Estimating the use of CO2 for chemical conversion by their real potential will require a full comparative analysis of the proposed processes to determine whether or not the process is feasible, and whether there is a market for the given products. In order to select the most promising products for further study, a multi-criteria performance table (Table 2) was constructed encompassing the criteria and alternatives.
Table 2 presents the performance of the alternatives (chemical compounds) in each criterion. Regarding the technical criteria, enthalpy of the direct reaction, acetone and formaldehyde are the most endothermic, while propanol and methanol the most exothermic. The maturity of urea and salicylic acid reflect the commercial production of this chemicals, on the other hand oxalic acid, methacrylic acid and acetic acid are in the early stages of research and development.
In the environmental group, the utilization ratio criteria that represents the amount of CO2 fixed in the molecule, showed higher values for formaldehyde and methanol and lower values for salicylic acid and benzoic acid. There is no wide amplitude in scientific relevance and in effects, and two broad group of chemicals were identified through the criterion willingness to pay (represented by the numbers 225 or 28).
The economic group (imports and exports) showed a similar behavior compared with described in the forecast predictions.
3.3. Sensitivity Results
The 10 cases described in section 2.5 used either the TOPSIS or SAW method for evaluation. Regarding the weighting method, either a subjective method or an objective method was employed.
The Shannon Entropy equation was used for the objective weighting method in order to express the relative intensities of criterion importance and to determine the objective weights. Table 3 presents the results of the proposed approach for weight elicitation.
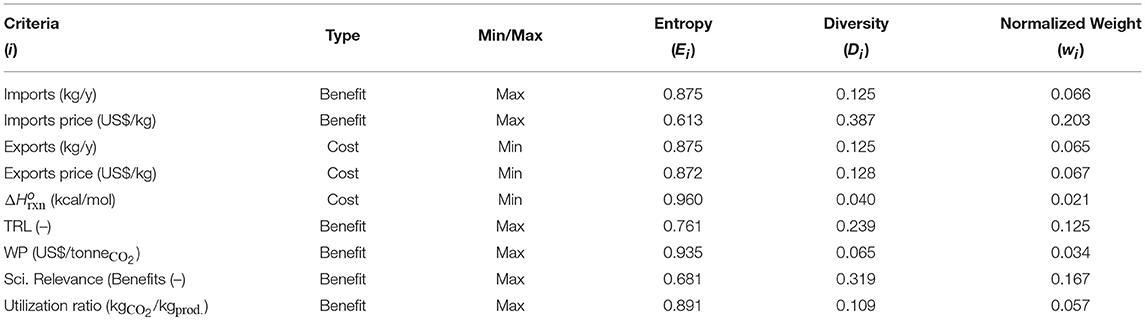
Table 3. Shannon entropy weights (used in cases 1 and 6).
Table 3 describes the criteria used and their relative importance. The exports amount, exports price and enthalpy of the reaction are cost-type criteria, indicating that the performance of every alternative must be as minimum as possible.
The enthalpy of a reaction and the willingness to pay showed the highest values for entropy indicating a minor importance when compared with other criterion. Scientific relevance and imports price showed higher relative importance.
Figure 5 presents the results of the sensitivity analysis. The classification in every case is assigned in the horizontal axis. The weighting method affects the final classification, and a sensitivity analysis could thus potentially incorporate this influence.
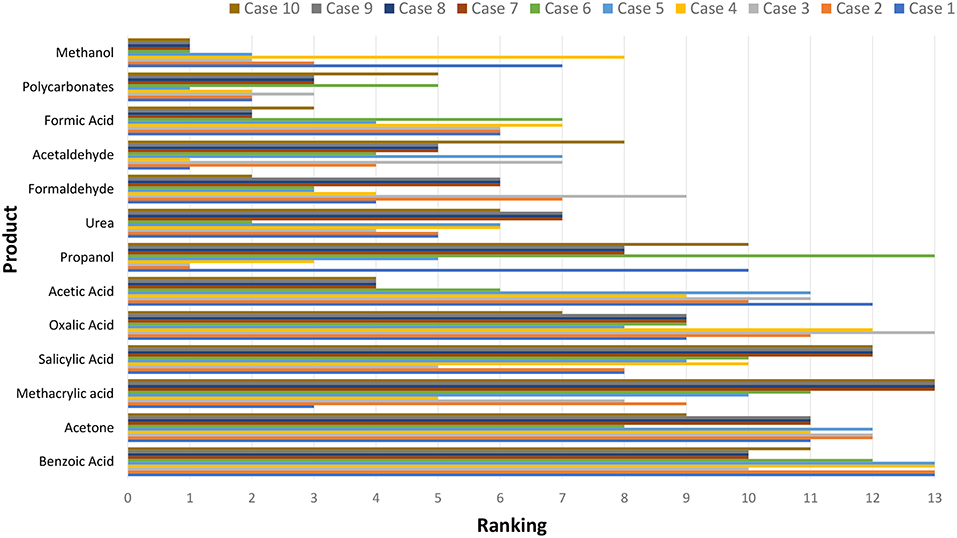
Figure 5. Sensitivity study results.
Methanol, polycarbonates, formic acid and acetaldehyde appear more often in the top positions. Therefore, their further study and implementation in Brazil is recommended, considering the evaluated criteria and the range of chemical products assessed.
The method proposed was robust for selecting the most promising products; the weights assigned or calculated were taken into consideration, however it was specific designed for the Brazilian context. The implementation of the method in other countries can assessed easly, it only required a detailed study of the local market and appropriate weight elicitation.
3.4. Opportunity Identification Results
Based on Equation (6), the CO2 amount emitted annually by the 20 Brazilian Power Plants with the highest installed capacity was calculated. Figure 6 shows the more emitters power plants in Brazil, as well as their respective locations.
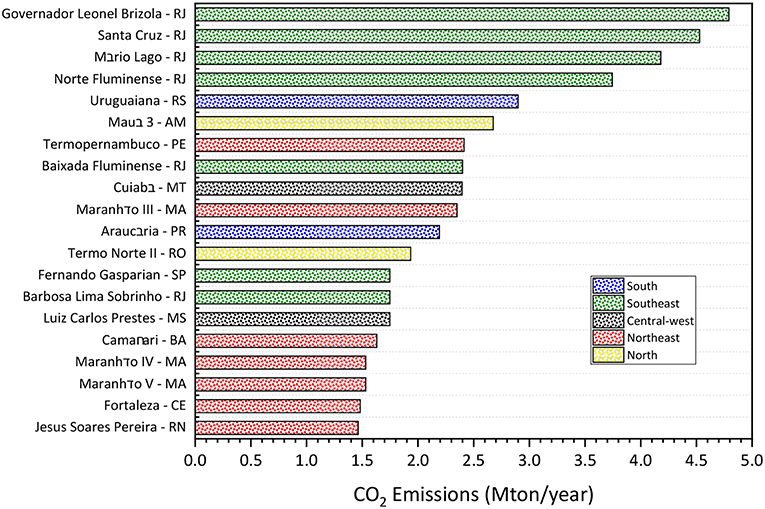
Figure 6. Annual emissions of 20 Brazilian Power Plant (natural gas) with higher installed capacity (RJ, Rio de Janeiro; RS, Rio Grande do Sul; AM, Amazonas; PE, Pernambuco; MT, Mato Grosso; MA, Maranhão; PR, Paraná; RO, Rondônia; SP, São Paulo; MS, Mato Grosso do Sul; BA, Bahia; CE, Ceará; RN, Rio Grande do Norte).
The power plants with the highest CO2 emissions are present in the southeast region. Therefore, there is a greater supply of CO2 in this region, which could support the installation of new plants of CO2 conversion processes
Figure 7 presents the location and capacity of the Brazilian Natural gas based Power Plants.
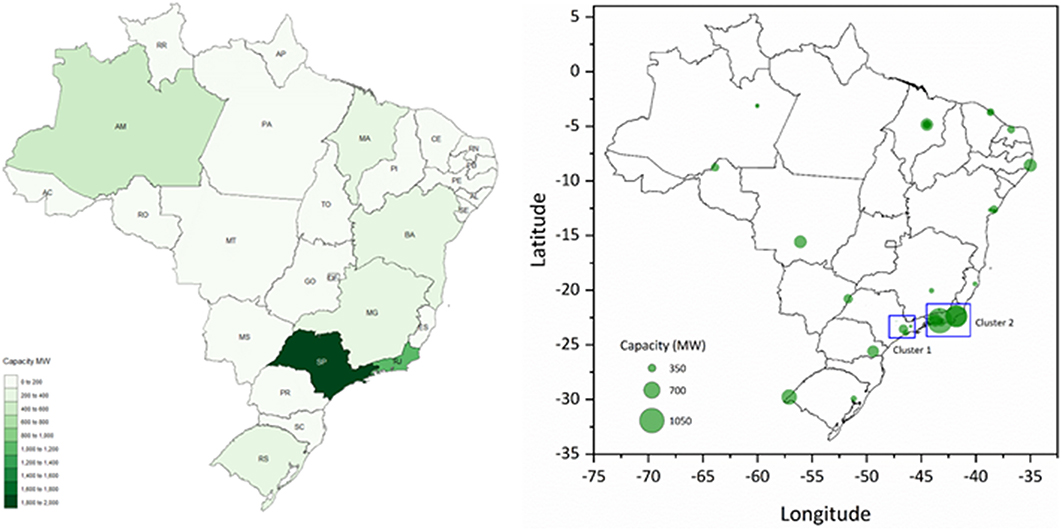
Figure 7. Location and capacity of Power Plant (Natural Gas-based).
São Paulo and Rio de Janeiro are the most promising regions in terms of CO2 availability and infrastructure identified as clusters in Figure 7 were the most interesting spots. However, the third step of the methodology is the match with the local needs.
The final step is to identify the need in a specific State for a specific product. According to the sensitivity analysis, the most promising products were considered.
The stratification based on States rather than cities is due to the fiscal confidentiality, therefore it is not possible to access individual company data. It is important to emphasize that the exportation by State definition consider the producer of the chemical, independently the headquarters cities of the producer. The data can be also related to the entry port.
The data contained in Figures 8B–11B concern about the imports, separated by country of production and Brazilian state of consumption. The country refers to the location of the last registry of the product before enter in Brazil, not necessarily the producer location. The State refers to the Brazil entry location, not necessarily the final destination of the chemical's consumption.
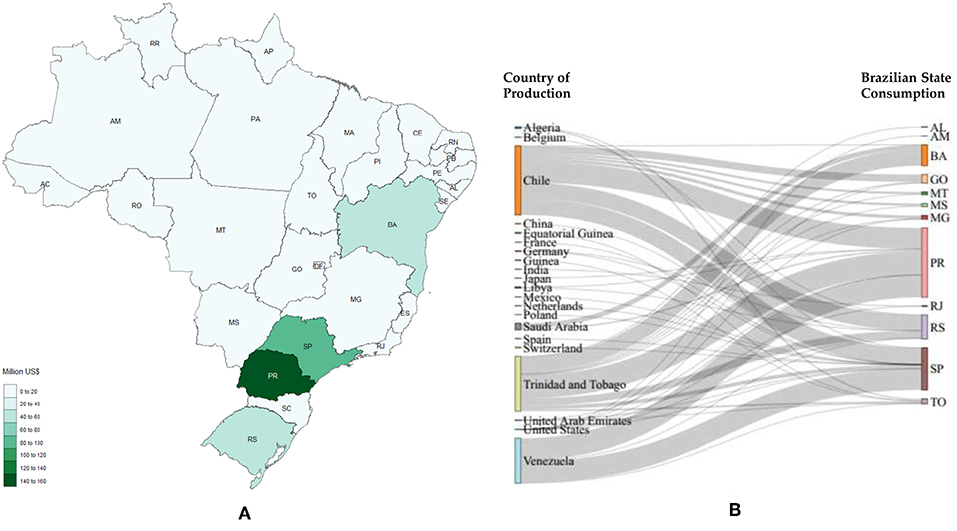
Figure 8. Methanol imports. (A) Local needs considering 2017; (B) Stratification for 2017, countries on the left represent the origin of the product studied and the states on the right represent the destination (AL, Alagoas; AM, Amazonas; BA, Bahia; GO, Goiás; MT, Mato Grosso; MS, Mato Grosso do Sul; MG, Minas Gerais; PR, Paraná; RJ, Rio de Janeiro; RS, Rio Grande do Sul; SP, São Paulo; TO, Tocantins).
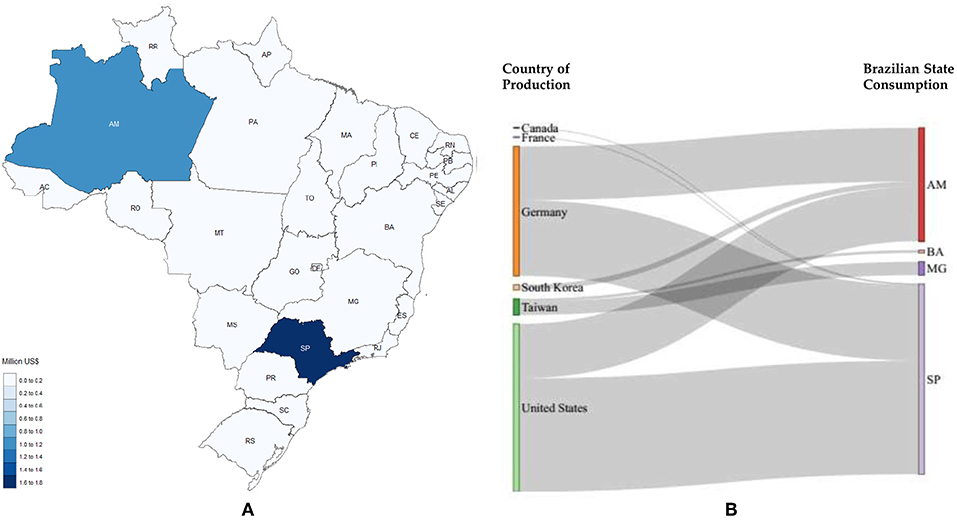
Figure 9. Polycarbonate imports. (A) Local needs considering 2017; (B) Stratification for 2017, countries on the left represent the origin of the product studied and the states on the right represent the destination (AM, Amazonas; BA, Bahia; MG, Minas Gerais; SP, São Paulo).
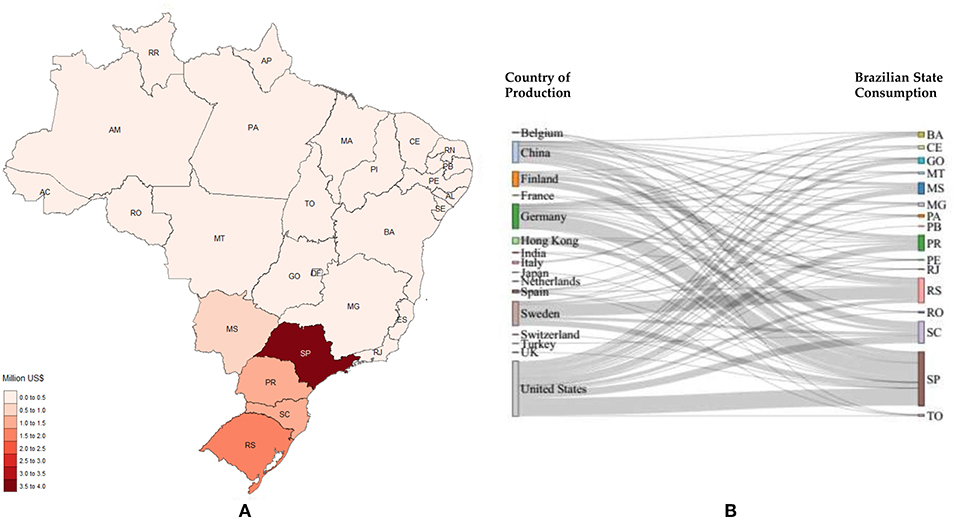
Figure 10. Formic Acid imports. (A) Local needs considering 2017; (B) Stratification for 2017, countries on the left represent the origin of the product studied and the states on the right represent the destination (BA, Bahia; CE, Ceará; GO, Goiás; MT, Mato Grosso; MS, Mato Grosso do Sul; MG, Minas Gerais; PA, Pará; PB, Paraíba; PR, Paraná; PE, Pernambuco; RJ, Rio de Janeiro; RS, Rio Grande do Sul; RO, Rondônia; SC, Santa Catarina; SP, São Paulo; TO, Tocantins).
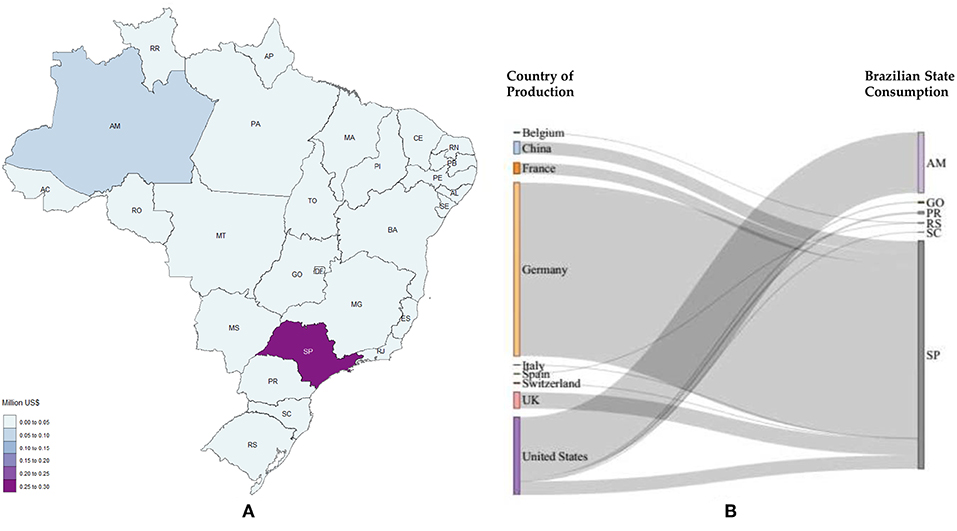
Figure 11. Acetaldehyde imports. (A) Local needs considering 2017; (B) Stratification for 2017, countries on the left represent the origin of the product studied and the states on the right represent the destination (AM, Amazonas; GO, Goiás; PR, Paraná; RS, Rio Grande do Sul; SC, Santa Catarina; SP, São Paulo).
The valuation of the potential utilization per State is helpful for guiding decision makers and policy makers to invest in CDU.
Figures 8–11 depict the imports in 2017 for methanol, polycarbonates, formic acid and acetaldehyde, respectively.
From Figure 8 Paraná is the State that most imported methanol in 2017, followed by São Paulo, Rio Grande do Sul and Bahia. Paraná imported almost 40% more than São Paulo; moreover, Rio Grande do Sul and Bahia imported similar values of methanol (48.7 and 42.3 million US$, respectively).
According to Figure 9 São Paulo and Amazonas are the States with the highest imports, 1.73 and 1.03 million US$, respectively. Polycarbonates were imported mainly from the United States and Germany.
Regarding formic acid, São Paulo leads the importation with 3.57 million US$, followed by Rio Grande do Sul (1.64 million US$), Santa Catarina (1.44 million US$) and Paraná (1.03 million US$) (Figure 10).
For acetaldehyde, São Paulo heads the imports followed by Amazonas. Paraná, Goiás, Rio Grande do Sul and Santa Catarina also import the product, yet less than 0.003 million US$ (2800 US$) in 2017 (Figure 11).
Lastly, potential technologies can be assessed in São Paulo, Paraná, Rio Grande do Sul, Bahia and Santa Catarina States, where the demand is high and they are identified as favorable regions for developing CCU schemes. It also portrays and evaluates the commercial movement of Brazil with the other nations of the world, encompassing sales and purchases made externally
São Paulo showed high availability and demand, therefore it is indicated as location for implementation of CDU schemes.
4. Conclusion
The proposed method was robust for selecting the most promising products for CO2 conversion. The concern regarding CO2 emissions from Brazilian power plants motivated their mapping, as well the performance of a local market analysis for potential products from CO2 chemical conversion.
Methanol, polycarbonates, formic acid and acetaldehyde were the most promising products for implementation in Brazil. The research pointed out that the power plants of higher capacity and, consequently, the greatest CO2 emitters, are present in São Paulo and Rio de Janeiro. São Paulo showed higher demand of the assessed products and also CO2 availability, indicating the location where a new CDU plant could potentially be installed.
Most of the current CO2 technologies are in the research and development phase and there are already several collaborative works among researchers, startups and corporations in Europe and North America indicating a great potential for similar activities in Brazil. This work will contribute to this development.
Data Availability
All datasets generated for this study are included in the manuscript and/or the Supplementary Files.
Author Contributions
RA confirms that all listed authors (KP, AR, AB, and CN) were involved in data acquisition, writing, proofreading, and processing of this research article.
Conflict of Interest Statement
The authors declare that the research was conducted in the absence of any commercial or financial relationships that could be construed as a potential conflict of interest.
Acknowledgments
The authors gratefully acknowledge the support from FAPESP and SHELL Brasil through the Research Centre for Gas Innovation – RCGI (FAPESP Proc. 2014/50279-4), hosted by the University of São Paulo, and the support given by ANP (Brazil's National Oil, Natural Gas and Biofuels Agency) through the R&D levy regulation. The authors acknowledge FAPESP for a PhD scholarship grant (FAPESP Proc. 2017/26683-8).
Supplementary Material
The Supplementary Material for this article can be found online at: https://www.frontiersin.org/articles/10.3389/fenrg.2019.00075/full#supplementary-material
References
Albo, J., Alvarez-Guerra, M., Castaño, P., and Irabien, A. (2015). Towards the electrochemical conversion of carbon dioxide into methanol. Green Chem. 17, 2304–2324. doi: 10.1039/C4GC02453B
AliceWeb (2018). Sistema de Análise das Informaçoes de Comércio Exterior - Analysis System of Foreign Trade Information [WWW Document]. Available online at: https://www.aliceweb.mdic.gov.br/ (accessed May 5, 2018).
Araújo, O. D. Q. F., Reis, A. d. C., de Medeiros, J. L., do Nascimento, J. F., Grava, W. M., and Musse, A. P. S. (2017). Comparative analysis of separation technologies for processing carbon dioxide rich natural gas in ultra-deepwater oil fields. J. Clean. Product. 155, 12–22. doi: 10.1016/j.jclepro.2016.06.073
Aresta, M. (2010). Carbon Dioxide as a Chemical Feedstock. Weinheim: Wiley-VCH Verlag GmbH & Co. KGaA.
Aresta, M., and Dibenedetto, A. (2007). Utilisation of CO2 as a chemical feedstock: opportunities and challenges. Dalton Transact. 2975–2992. doi: 10.1039/b700658f
Aresta, M., Dibenedetto, A., and Angelini, A. (2013). The changing paradigm in CO2 utilization. J. CO2 Utilizat. 3–4, 65–73. doi: 10.1016/j.jcou.2013.08.001
Aresta, M., Dibenedetto, A., and Angelini, A. (2014). Catalysis for the valorization of exhaust carbon: from CO2 to chemicals, materials, and fuels. technological use of CO2. Chem. Rev. 114, 1709–1742. doi: 10.1021/cr4002758
Aresta, M., Dibenedetto, A., and Quaranta, E. (2015). Reaction Mechanisms in Carbon Dioxide Conversion. Berlin; Heidelberg: Springer-Verlag.
Aresta, M., Quaranta, E., and Tommasi, I. (1996). Carbon dioxide utilisation in the chemical industry. ACS Div. Fuel Chem. Preprints 41, 1341–1344.
Artz, J., Müller, T. E., Thenert, K., Kleinekorte, J., Meys, R., Sternberg, A., et al. (2018). Sustainable conversion of carbon dioxide: an integrated review of catalysis and life cycle assessment. Chem. Rev. 118, 434–504. doi: 10.1021/acs.chemrev.7b00435
Azevedo, T. R., and Angelo, C. (2018). Emissões de GEE no Brasil e suas implicações para políticas públicas e a contribuição brasileira para o Acordo de Paris. Sistema de Estimativas de Emissões e Remoções de Gases de Efeito Estufa (SEEG). Brasilia: Observatorio do Clima.
Behzadian, M., Khanmohammadi Otaghsara, S., Yazdani, M., and Ignatius, J. (2012). A state-of the-art survey of TOPSIS applications. Exp. Syst. Appl. 39, 13051–13069. doi: 10.1016/j.eswa.2012.05.056
Bocin-dumitriu, A., Perez Fortes, M. d. M., Tzimas, E., and Sveen, T. (2013). Carbon Capture and Utilisation Workshop Background and proceedings. Luxembourg: Joint Research Centre of the European Commission.
Bogmans, C. W., Dijkema, G. P., and van Vliet, M. T. (2017). Adaptation of thermal power plants: the (ir)relevance of climate (change) information. Energy Econ. 62, 1–18. doi: 10.1016/j.eneco.2016.11.012
Brans, J. P., and Vincke, P. (1985). A preference ranking organisation method. Manage. Sci. 31, 647–656. doi: 10.1287/mnsc.31.6.647
Cabral, J. B., Luczywo, N. A., and Zanazzi, J. L. (2016). “Scikit-Criteria: colección de métodos de análisis multi-criterio integrado al stack científico de Python,” in XLV Jornadas Argentinas de Informática e Investigación Operativa (45JAIIO)-XIV Simposio Argentino de Investigación Operativa (Buenos Aires), 59–66.
Campos, A. F., da Silva, N. F., Pereira, M. G., and Vasconcelos Freitas, M. A. (2017). A review of Brazilian natural gas industry: challenges and strategies. Renew. Sustain. Energy Rev. 75, 1207–1216. doi: 10.1016/j.rser.2016.11.104
Chauvy, R., Meunier, N., Thomas, D., and De Weireld, G. (2019). Selecting emerging CO2 utilization products for short- to mid-term deployment. Appl. Energy 236, 662–680. doi: 10.1016/j.apenergy.2018.11.096
Choo, E. U., and Wedley, W. C. (1985). Optimal criterion weights in repetitive multicriteria decision-making. J. Operat. Res. Soc. 36, 983–992. doi: 10.1057/jors.1985.177
Chu, A. T. W., Kalaba, R. E., and Spingarn, K. (1979). A comparison of two methods for determining the weights of belonging to fuzzy sets. J. Optimizat. Theory Appl. 27, 531–538. doi: 10.1007/BF00933438
CO2 Sciences The Global CO2 Initiative (2016). Global Roadmap for Implementing CO2 Utilization [WWW Document]. Available online at: https://assets.ctfassets.net/xg0gv1arhdr3/27vQZEvrxaQiQEAsGyoSQu/44ee0b72ceb9231ec53ed180cb759614/CO2U_ICEF_Roadmap_FINAL_2016_12_07.pdf (accessed May 5, 2018).
Dairanieh, I. (2016). “Converting a liability into an asset,” in Carbon Sequestration Leadership Forum 2016 Annual Meeting (Tokyo: CSLF).
do Espirito Santo, D. B., and Gallo, W. L. R. (2017). Utilizing primary energy savings and exergy destruction to compare centralized thermal plants and cogeneration/trigeneration systems. Energy 120, 785–795. doi: 10.1016/j.energy.2016.11.130
Empresa de Pesquisa Energética (2017). Plano Decenal de Expansão de Energia 2026. Technical report, Empresa de Pesquisa Energética.
European Commission, E. (2013). From Research to Innovation. Lessons learnt from the FP7 NMP Materials Call 2013: “Substantial Steps Forward in the Industrial Use of European Intellectual Assets, Stimulating the Use of Newly Developed Materials”. Brussels: RTD-PUBLICATIONS.
Gale, J., Bradshaw, J., Chen, Z., Garg, A., Gomez, D., Rogner, H., et al. (2005). “Sources of CO2,” in IPCC Special Report on Carbon Dioxide Capture and Storage, Chapter 2, eds B. Metz, H. O. Davidson, C. Coninck, M. Loos, and L. A. Meyer (New York, NY: Cambridge University Press), 75–104.
Haunschild, R. (2015). Theoretical study on the reaction mechanism of carbon dioxide reduction to methanol using a homogeneous ruthenium(II) phosphine catalyst. Polyhedron 85, 543–548. doi: 10.1016/j.poly.2014.09.023
Hwang, C.-L., and Lin, M.-J. (2012). Group Decision Making Under Multiple Criteria: Methods and Applications, Vol. 281. Munich: Springer Science & Business Media.
Hwang, C.-L., and Yoon, K. (2012). Multiple Attribute Decision Making: Methods and Applications a State-of-the-Art Survey, Vol. 186. Berlin: Springer Science & Business Media.
IPCC (2014). Climate Change 2014: Mitigation of Climate Change. Contribution of Working Group III to the Fifth Assessment Report of the Intergovernmental Panel on Climate Change. Cambridge; New York, NY: Cambridge University Press.
Kirkwood, C. W., and Corner, J. L. (1993). The effectiveness of partial information about attribute weights for ranking alternatives in multiattribute decision making. Organ. Behav. Hum. Decis. Process. 54, 456–476. doi: 10.1006/obhd.1993.1019
Li, X., Anderson, P., Jhong, H.-R. M., Paster, M., Stubbins, J. F., and Kenis, P. J. A. (2016). Greenhouse gas emissions, energy efficiency, and cost of synthetic fuel production using electrochemical CO 2 conversion and the fischer–tropsch process. Energy Fuels 30, 5980–5989. doi: 10.1021/acs.energyfuels.6b00665
Markewitz, P., Kuckshinrichs, W., Leitner, W., Linssen, J., Zapp, P., Bongartz, R., et al. (2012). Worldwide innovations in the development of carbon capture technologies and the utilization of CO2. Energy Environ. Sci. 5:7281. doi: 10.1039/c2ee03403d
Mikkelsen, M., Jørgensen, M., and Krebs, F. C. (2010). The teraton challenge. A review of fixation and transformation of carbon dioxide. Energy Environ. Sci. 3, 43–81. doi: 10.1039/B912904A
Milani, D., Khalilpour, R., Zahedi, G., and Abbas, A. (2015). A model-based analysis of CO2 utilization in methanol synthesis plant. J. CO2 Utilizat. 10, 12–22. doi: 10.1016/j.jcou.2015.02.003
MME - Ministério de Minas e Energia (2017). Capacidade Instalada de Geração Elétrica [WWW Document]. Avaialble online at: http://www.mme.gov.br/web/guest/publicacoes-e-indicadores/boletins-de-energia?p_p_id=20&p_p_lifecycle=0&p_p_state=normal&p_p_mode=view&p_p_col_id=column-1&p_p_col_count=1&_20_struts_action=%2Fdocument_library%2Fview_file_entry&_20_redirect=http%3A%2F%2Fww (accessed May 5, 2018).
NIST (2018). NIST Chemistry WeBook [WWW Document]. Available online at: https://webbook.nist.gov/chemistry/ (accessed May 5, 2018).
Olivier, J. G. J., Schure, K. M., and Peters, J. A. H. W. (2017). Trends in Global CO2 and Total Greenhouse Gas Emissions. The Hague: PBL Netherlands Environmental Assessment Agency.
Otto, A., Grube, T., Schiebahn, S., and Stolten, D. (2015). Closing the loop: captured CO2 as a feedstock in the chemical industry. Energy Environ. Sci. 8, 3283–3297. doi: 10.1039/C5EE02591E
Pakhare, D., and Spivey, J. (2014). A review of dry (CO2) reforming of methane over noble metal catalysts. Chem. Soc. Rev. 43, 7813–7837. doi: 10.1039/C3CS60395D
Papacharalampous, G., Tyralis, H., and Koutsoyiannis, D. (2018). Predictability of monthly temperature and precipitation using automatic time series forecasting methods. Acta Geophys. 7, 1–25. doi: 10.1007/s11600-018-0120-7
Parsons Brinckerhoff (2011). Accelerating the Uptake of CCS: Industrial use of Captured Carbon Dioxide. Global CCS Institute. Available online at: http://www.globalccsinstitute.com/publications/accelerating-uptake-ccs-industrial-use-captured-carbon-dioxide (accessed August 15, 2018).
Patricio, J., Angelis-Dimakis, A., Castillo-Castillo, A., Kalmykova, Y., and Rosado, L. (2017a). Method to identify opportunities for CCU at regional level – Matching sources and receivers. J. CO2 Utilizat. 22, 330–345. doi: 10.1016/j.jcou.2017.10.009
Patricio, J., Angelis-Dimakis, A., Castillo-Castillo, A., Kalmykova, Y., and Rosado, L. (2017b). Region prioritization for the development of carbon capture and utilization technologies. J. CO2 Utilizat. 17, 50–59. doi: 10.1016/j.jcou.2016.10.002
Pekdemir, T. (2014). “Integrated capture and conversion,” in Carbon Dioxide Utilisation: Closing the Carbon Cycle: First Edition, eds P. Styring, E. A. Quadrelli, and Q. Katy Armstrong (Amsterdam: Elseiver), 253–272. doi: 10.1016/B978-0-444-62746-9.00014-1
Pérez-Fortes, M., Schöneberger, J. C., Boulamanti, A., Harrison, G., and Tzimas, E. (2016a). Formic acid synthesis using CO2 as raw material: techno-economic and environmental evaluation and market potential. Int. J. Hydr. Energy 41, 16444–16462. doi: 10.1016/j.ijhydene.2016.05.199
Pérez-Fortes, M., Schöneberger, J. C., Boulamanti, A., and Tzimas, E. (2016b). Methanol synthesis using captured CO2 as raw material: techno-economic and environmental assessment. Appl. Energy 161, 718–732. doi: 10.1016/j.apenergy.2015.07.067
Peters, M., Köhler, B., Kuckshinrichs, W., Leitner, W., Markewitz, P., and Müller, T. E. (2011). Chemical technologies for exploiting and recycling carbon dioxide into the value chain. ChemSusChem 4, 1216–1240. doi: 10.1002/cssc.201000447
Ruggero, B. (2017). Perspectives For Geothermal Energy In Europe. London, UK: World Scientific Publishing Company.
Saaty, T. L. (1977). A scaling method for priorities in hierarchical structures. J. Math. Psychol. 15, 234–281. doi: 10.1016/0022-2496(77)90033-5
Shannon, C. E. (1948). A mathematical theory of communication. Bell Syst. Tech. J. 27, 379–423. doi: 10.1002/j.1538-7305.1948.tb01338.x
Song, C. (2006). Global challenges and strategies for control, conversion and utilization of CO2 for sustainable development involving energy, catalysis, adsorption and chemical processing. Catal. Today 115, 2–32. doi: 10.1016/j.cattod.2006.02.029
Styring, P., Jansen, D., de Coninck, H., Reith, H., and Armstrong, K. (2011). Carbon Capture and Utilisation in the Green Economy. York, UK: The Centre for Low Carbon Futures 2011 and CO2 Chem.
Taylor, S. J., and Letham, B. (2017a). Forecasting at scale. Amer. Stat. doi: 10.7287/peerj.preprints.3190v1
Taylor, S. J., and Letham, B. (2017b). prophet: Automatic Forecasting Procedure. R package version 0.2.1 (2017.11.08). Available online at: https://CRAN.R-project.org/pack_age=prophet
U.S.NRC (2018). NRC: Glossary – Capacity Factor (net) [WWW Document]. United States Nuclear Regulatory Commission. Avaialble online at: https://www.nrc.gov/reading-rm/basic-ref/glossary/capacity-factor-net.html (accessed April 25, 2018).
United Nations, U. (1998). Kyoto protocol to the United Nations framework convention on climate change. Rev. Eur. Commun. Int. Environ. Law 7, 214–217. doi: 10.1111/1467-9388.00150
von der Assen, N., Jung, J., and Bardow, A. (2013). Life-cycle assessment of carbon dioxide capture and utilization: avoiding the pitfalls. Energy Environ. Sci. 6, 2721–2734. doi: 10.1039/c3ee41151f
Wei, W. W. S. (2006). Time Series Analysis: Univariate and Multivariate Methods, 2nd Edn., Vol. 10. Boston, MA: Pearson Addison Wesley.
Zeleny, M. (2012). Multiple Criteria Decision Making Kyoto 1975, Vol. 123. Berlin: Springer Science & Business Media.
Zimmermann, A., and Kant, M. (2015). The Business Side of Innovative CO2 Utilisation. Technical report, Technische Universitat Berlin, Berlin.
Zimmermann, A., Kant, M., Strunge, T., Tzimas, E., Leitner, W., Arlt, W., et al. (2017). CO2 Utilisation Today - Report 2017. 45.
Keywords: power plant mapping, CO2 chemical conversion, Brazilian market, forecasting, CO2 utilization
Citation: Pacheco KA, Reis AC, Bresciani AE, Nascimento CAO and Alves RMB (2019) Assessment of the Brazilian Market for Products by Carbon Dioxide Conversion. Front. Energy Res. 7:75. doi: 10.3389/fenrg.2019.00075
Received: 15 April 2019; Accepted: 22 July 2019;
Published: 07 August 2019.
Edited by:
José Carlos Netto-Ferreira, Universidade Federal Rural do Rio de Janeiro, BrazilReviewed by:
Debora Regina Roberti, Universidade Federal de Santa Maria, BrazilJessy Rivest, Palo Alto Research Center Incorporated, United States
Copyright © 2019 Pacheco, Reis, Bresciani, Nascimento and Alves. This is an open-access article distributed under the terms of the Creative Commons Attribution License (CC BY). The use, distribution or reproduction in other forums is permitted, provided the original author(s) and the copyright owner(s) are credited and that the original publication in this journal is cited, in accordance with accepted academic practice. No use, distribution or reproduction is permitted which does not comply with these terms.
*Correspondence: Rita M. B. Alves, cm1iYWx2ZXNAdXNwLmJy