 Hamed H. Saber
 Wahid Maref
 Ali E. Hajiah3†
- 1Department of Mechanical Engineering, Jubail University College, Royal Commission of Jubail and Yanbu, Jubail, Saudi Arabia
- 2Department of Construction Engineering, École de Technologie Supérieure, University of Quebec, Montreal, QC, Canada
- 3Energy and Building Research Center, Kuwait Institute for Scientific Research, Shuwaikh, Kuwait
In regions with hot climatic conditions such as that in Saudi Arabia, a substantial share of energy is used for cooling the buildings. Many studies have shown that cool (white) roofs can help reduce the cooling energy load and thus the demand for energy over time. Also, cool roofs help reduce the urban heat island during the summer time. This research study focused on determining: (a) whether cool roofs lead to risk of condensation and mold growth in Saudi climates, (b) the amount of energy savings as result of using cool roofs instead of black roofs of same insulation amount, and (c) the reduction in the amount of insulation in cool roof having the same energy performance level as the black roof. As such, numerical simulations were conducted for a roofing system that is commonly used in low-rise buildings in Saudi Arabia in order to asses and compare the energy and hygrothermal performance of cool and black roofs. The roof was subjected to weather conditions of the Eastern Province of Saudi Arabia. The indoor conditions were taken based simple method of ASHRAE Standard 160. The results showed no moisture accumulation occurred from year-to-year after 6 years and 7 years for the black roof and cool roof, respectively, and the highest relative humidities in the black and cool roofs were well below 80% resulting in no risk of condensation and mold growth occurred in these roofs. The main outcome of this study has shown the capabilities of using reflective materials with different short-wave solar absorption coefficients for enhancing the energy performance of roofs and/or reducing the amount of insulation that resulted in same energy performance as black roofs. This study can be used in future for upgrading the Saudi Building Code so as to allow less roof insulation if cool roof is installed.
Introduction
Buildings are responsible for a large portion of the global and local impacts of climate change. In regions with hot climatic conditions such as that in Saudi Arabia, a considerable part of energy is used for cooling the buildings. Buildings are responsible for about 30–40% of the total energy demand (Al-Homoud, 2005; Vrachopoulos et al., 2012). In Europe, however, buildings are responsible for 40–50% of energy use (European Commission, 2010). In the Gulf Cooperation Council (GCC) countries, a substantial share of energy is used for cooling. Regarding the distribution of electricity consumption by end-user, Krarti and Hajiah (Krarti and Hajiah, 2011) reported that the building sector represents 90% of the electricity consumption in Kuwait. The authors also reported that the residential sector (including privately owned residences and rental apartment units) were responsible for over 70% of Kuwait's electrical peak power demand in 2004. To reduce building conductive heat gain/loss, it is important to design the roofing systems and other building components such as walls and fenestration systems with the intent of achieving energy savings. This research study mainly focuses on the energy performance of the roofing system.
Roofing systems are so much more than just protections from the rain and sun. Many investigators (Desjarlais, 1995; Desjarlais et al., 1998; Solecki et al., 2005; Jo et al., 2010; Levinson et al., 2010; Oleson et al., 2010; Ray and Glicksman, 2010; Urban and Roth, 2010; Zirkelbach et al., 2010; Bentz, 2011; Durhman et al., 2011; Ismail et al., 2011; McHugh and Petrick, 2011; Xu et al., 2012; Hutchinson, 2017) have shown that white (cool) and green roofing systems can reduce the operating energy loads of buildings and as well help reduce greenhouse gas emissions. Bentz (2011) explored decision-making process for green options in reroofing systems. Using reflective materials or coatings with high solar reflectivity in cool roofs can result in reducing the amount of insulation compared to black roofs. Akbari et al. (1999, 2000) investigated the effect of rooftop solar reflectivity on the cooling and heating energy loads for residential and commercial buildings in the United States. Their results for one-story single family building showed that about half the amount of insulation can be saved as a result of increasing the rooftop solar reflectivity from 20 to 60% (Akbari et al., 2000). In another study by Ray and Glicksman (Ray and Glicksman, 2010) for one-story building having a modified-bitumen roof with insulation thermal resistance of 2.7 m2K/W (15.3 ft2 F h/BTU) when this building was subjected to the weather conditions of Boston, 13% in energy use can be saved by doubling the amount of insulation, whereas 12% in the energy use can be saved by replacing the modified-bitumen roof by a green roof.
Levinson and Akbari (Levinson and Akbari, 2010) conducted simulations to investigate the potential benefits (in terms of conserving energy, saving money, and reducing emission of greenhouse gases and air pollutants) as results of using cool roofs in four commercial building prototypes in 236 US cities. In that study, the numerical simulations were conducted using a short-wave solar reflectivity of 0.55 (i.e., short-wave solar absorptivity of 0.45) for cool roofs and a short-wave solar reflectivity of 0.20 (i.e., short-wave solar absorptivity of 0.8) for conventional gray roofs. The results of that study showed that buildings with cool roofs resulted in annual saving in energy cost per unit roofing area ranging from $0.126/m2 in West Virginia to $1.14/m2 in Arizona ($0.356/m2 nationwide).
Because cool roofs experience low temperature as a result of reflecting a part of short-wave solar radiation, which depends on the value of the rooftop solar reflectivity (Bludau et al., 2009, 2010; Brehob et al., 2011; Ennis and Kehrer, 2011; Saber et al., 2011a, 2012a), moisture accumulation may occur in cool roofs in which the daytime and summer may not be enough to dry-out these roofs. This may cause condensation and mold growth in cool roofs. As such, for a given climatic condition, it is important to select the proper reflective roofing materials or coating in designing cool roofs that can simultaneously lead to energy savings and low risk of moisture-related problems. Currently, there a number of reflective materials and coatings available in the market that can be used in cool roofs. Using a portable reflectometer in accordance with the Standard Test Method of ASTM C-1549, Brehob et al. (2011) investigated the effectiveness of cool roof coatings with ceramic particle. The outcome of that study showed that the solar reflectivity of roof coatings is the significant characteristic for selecting cool roof coatings. The results of the field tests conducted at Oak Ridge National Laboratory (ORNL) with roof coating of high solar reflectivity showed that about 80% reduction in the cooling energy load can be obtained as a result of using cool roof instead of black roof (Brehob et al., 2011).
For the weather conditions of Boston, Albany, Chicago, Cleveland and Detroit, Ennis and Kehrer (Ennis and Kehrer, 2011) conducted numerical simulations to investigate the effect of roof membrane color on moisture accumulation in black roof having short-wave solar absorption coefficient of 0.9 and white roof having short-wave solar absorption coefficient of 0.3. The results of that study showed that the amount of accumulated moisture in white roof during the winter was more than twice the amount in the black roof. On the other hand, the accumulated moisture in the white and black roofs during the winter dried out completely in the summer.
With short-wave solar absorption coefficients of 0.88 for black roofs and 0.2 for white roofs when these roofs were subjected to the weather conditions of Phoenix, Chicago, Anchorage and Holzkirchen, the results of hygrothermal simulations by Bludau et al. (2009) showed that white roofs show greater moisture accumulation than that in black roofs. In case of initial construction moisture in white roofs having short-wave solar absorption coefficient of 0.2 and black roofs having short-wave solar absorption coefficient of 0.9, the simulation results by Bludau et al. (2010) showed that the surface temperature and drying potential were lower in white roofs than that in black roofs. Saber et al. (2011a, 2012a) investigated the energy and moisture performance of white and black roofs when these roofs were subjected to a number of climate conditions in Canada and USA (Toronto, Montreal, St John's, Saskatoon, Seattle, Wilmington, and Phoenix). For the climate conditions of St John's and Saskatoon, the results showed white roofs could lead to longer-term moisture-related problems. To the best of the authors' knowledge, no such study available in the literature regarding whether cool roofs could lead to moisture-related problems and the amount of energy savings as results of using cool roofs instead of black roofs when these roofs are subjected to the climatic conditions of Saudi Arabia.
Dust/dirt accumulation on the roofing surfaces can decrease the solar reflectivity of these surfaces, resulting in increasing the solar heat gains. Several studies have been conducted to investigate the effect of weathering factors and dirt accumulation on the changes in roof thermal properties over time (Akbari et al., 2005; Levinson et al., 2005; Berdahl et al., 2008; Suehrcke et al., 2008; Algarni and Nutter, 2015). For dirt accumulation, there are a number of cleaning processes that are currently being used in order to bring the solar reflectively of the roofing surface to its initial value. For example, Levinson et al. (2005) applied a several cleaning processes on light-colored roofing membranes to investigate the effect of these cleaning processes on the solar reflectivity. In that study, different membrane samples taken from roofs across the United States were analyzed. Their results showed that black carbon and inorganic carbon were found on the surfaces of these samples resulting in reduction in the solar reflectivity of the surfaces. The cleaning processes that were applied on the surfaces of the samples include: (a) wiping to simulate wind action (b) rinsing to simulate rain action, and (c) washing using dishwashing detergent to simulate a homemade cleaning. As a final step to simulate professional cleaning, the surfaces were treated with a mixture of sodium hypochlorite and sodium hydroxide. The results of that study (Levinson et al., 2005) showed that after applying the rinsing process and washing process, all the dirt on the surfaces was removed except for thin layers of contaminants (organic carbon and some isolated dark spots of biomass). These contaminants were removed after applying the bleaching process resulting in recovering the original solar reflectivity of these surfaces.
In another study by Akbari et al. (2005), the same cleaning processes by Levinson et al. (2005) were applied on un-weathered and weathered cool roofing membranes that were collected from different locations across Canada and United States. In total, 41 samples were analyzed. The results showed that the cleaning processes developed by Levinson et al. (2005) were effective in recovering about 90% of the original solar reflectivity of these samples (Akbari et al., 2005).
Objectives
The main objectives of this research study are to:
(1) Assess and compare the energy and moisture performance of conventional/black roof shown in Figure 1 that is commonly used in low-rise buildings in Saudi Arabia when this roof is subjected to hot and humid climate of the Saudi Eastern Province. The performance is obtained for a wide range of insulation thickness of 0–203 mm (8 inch).
(2) Repeat (1) above for cool roof of different short-wave solar absorption coefficients that cover most roofing reflective materials and coatings available in the market.
(3) Use the results obtained in (1) and (2) above to compare the energy and moisture performance of the black roof with that of cool roof of different short-wave solar absorption coefficients and different insulation thicknesses.
(4) For the same energy performance level, determine the reduction in the amount of insulation in a cool roof of different short-wave absorption coefficient in respect with the black roof.
(5) For the same insulation thickness, determine the amount of energy savings at no risk of moisture-related problems as result of using cool roof having different short-wave absorption coefficients instead of black roof.
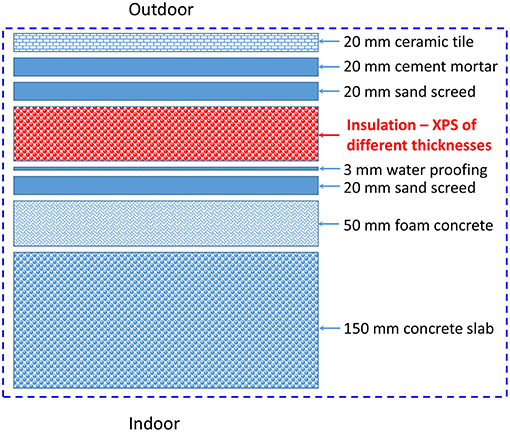
Figure 1. Schematics of roof with different insulation thicknesses.
Hygrothermal Model
A numerical model was developed using COMSOL Multiphysics. The model simultaneously solves the highly coupled Heat, Air, and Moisture (HAM) transport equations in building envelope (Saber et al., 2010a,b, 2011b,c, 2012b,c; Tariku et al., 2010). These equations were discretized using the Finite Element Method (FEM). The boundary conditions, model benchmarking and simulation parameters are discussed next.
Boundary Conditions
The boundary conditions needed to solve heat transport equation at the indoor and outdoor surfaces are given in terms of heat fluxes. At the indoor surface, the heat flux (qh, ind) is given as:
Where Tind is the indoor air temperature (K), and Ts, i is the indoor surface temperature (K). In Equation (1), an indoor heat transfer coefficient (hind) that is recommended in the IEA/Annex 24 (Sanders, 1996) and Tariku et al. (2010) for interior flat surface of 8 W/m2K was used in the numerical simulations.
The total heat flux on the outdoor surface (qh, outd) depends on the properties of this surface and the environmental conditions. It is given as Saber et al. (2011a, 2012a):
Where Fs−eis the view factor of the outdoor surface to the environment; houtd is the convective heat transfer coefficient on the outdoor surface [W/(m2.K)], which is calculated by Equation (3) below; Fs−sky is the view factor of the outdoor surface to the sky; εLe is the long-wave emittance of the environment, which is calculated by Equation (5) below; εLs is the long-wave emittance of the outdoor surface [0.9 for most construction materials (Bludau et al., 2009, 2010; Saber et al., 2011a, 2012a)]; αs is the short-wave absorption coefficient of the outdoor surface; cb is a constant equal to 5.67 W/(m2K4); EST is the total solar flux which includes the effect both incident irradiance and diffuse horizontal irradiance (W/m2); Ts, o is the outdoor surface temperature (K); Toutd is the outdoor air temperature (K); and Tsky is the sky temperature (K), is calculated by Equation (9) below.
The term I in Equation (2) accounts for the heat transfer by convection between the outdoor air and the outdoor surface where the outdoor heat transfer coefficient, houtd, depends on the wind speed, Vw, which is calculated as Pedersen (1992):
In Equation (3), the wind speed at a given height z is calculated using a power law as Dalgliesh and Boyd (1962):
where zref is a reference height above the ground at which the reference wind speed, Vw, ref, is measured in weather stations. Many weather stations measure the wind speed at zref ≈ 10 m. In Equation (3), the wind speed and the heat transfer coefficient should be in m/s and W/(m2.K), respectively.
The term II in Equation (2) provides the amount of solar flux that is absorbed by the outdoor surface, which depends of the short-wave solar absorption coefficient of the surface, αs. With the new technology of reflective materials and radiative cooling materials, their short-wave solar absorption coefficient values can be very small. For example, Kubota and his team from Stanford University (Kubota, 2017) have recently used a multilayer optical film that reflected about 97% (i.e., αs = 0.03) of the sunlight while simultaneously being able to emit the surface's thermal energy through the atmosphere. As well, Knoss and his team from University of Colorado Boulder (Knoss, 2018) developed a new material that can reflect most incoming solar rays back into the atmosphere (i.e., αs ≈ 0.0) while it still providing a means of escape for infrared radiation.
The term III in Equation (2) accounts for the amount of heat transfer by radiation between the outdoor surface and the environment. In this term, the long-wave emittance of the environment, εLe can be given based on ISO (ISO, 2003) as:
where, c (0 ≤ c ≤ 1) is the hourly cloud index obtained from the weather data (c = 1 for overcast condition and c = 0 for clear condition). Also, εo in Equation (5) is the emissivity for clear sky condition, which can be given in terms of the dew point temperature as:
where the dew point, θdp, is calculated as Barenbrug (1974) and Paroscientific (2014):
Where, a = 17.271, b = 237.7°C, RH is the outdoor relative humidity (%), and θ∞ is the outdoor dry bulb temperature in °C. The expression for the dew point temperature in Equation (7) is based on the August-Roche-Magnus approximation for the saturation vapor pressure of water in air as a function of temperature (Barenbrug, 1974). It is important to point out that in the case of flat roofing surfaces, the view factor between the outdoor surface and the environment, Fs−e = 0, resulting in no heat transfer by radiation between the outdoor surfaces and the environment.
Finally, the term IV in Equation (2) accounts for the heat transfer by radiation between the outdoor surfaces and the sky. For clear sky condition, Swinbank (1963) averaged out the effects that humidity and elevation have on the sky temperature and arrived at the following expression:
In the case of cloudy days, however, the sky temperature deviates from that given by Swinbank's equation. Fuentes (1987) and Wang and Boulard (2000) proposed the following expression to account for the effect of cloud on the sky temperature:
In Equations (8, 9), Tsky, and Toutd are in K. In hot climates, to maximize the amount of heat transfer by radiation from the outdoor surface to the sky, and hence decreasing the cooling load of buildings, the long-wave emissivity of the outdoor surfaces, εLs, should be high. With the new technology of reflective materials and radiative cooling materials, their long-wave emissivity are maximized to be close to 1.0 so as to be able to emit the surface's thermal energy through the sky (Catalanotti et al., 1975; Fernandez et al., 2015; Kubota, 2017; Knoss, 2018).
To solve the moisture transport equation, the indoor and outdoor surfaces are subjected to mass fluxes. The mass flux at the indoor surface (qm, ind) is given as:
Where βp, ind is the convective mass transfer coefficient of the vapor water on the indoor surface, which is given by Equation (13) below; Pv, ind is the indoor vapor pressure; Pv, s, i is the vapor pressure on the indoor surface; ϕind and ϕs, i are the relative humidity of the indoor air and indoor surface, respectively; and Pv, sat(Tind) is the vapor saturation pressure, which is given by Equation (12) below at T = Tind.
The mass flux at the outdoor surface (qm, outd) is given as:
Where βp, outd is the convective mass transfer coefficient of the vapor water on the outdoor surface, which is given by Equation (13) below; Pv, outd is the outdoor vapor pressure; Pv, s, o is the vapor pressure on the outdoor surface; ϕoutd and ϕs, oare the relative humidity of the outdoor air and outdoor surface, respectively; and Pv, sat(Toutd) is the vapor saturation pressure, which is given by Equation (12) below at T = Toutd.
The saturation pressure of the water vapor in moist air, Pv, sat, varies with the temperature of the mixture of air and vapor. A temperature range of −50–50°C covers the practical building applications. In this temperature range, Pv, sat in Pa is expressed as a function of temperature, T, in K as Kumaran (2009):
The convective mass transfer coefficient of the vapor water on the indoor and outdoor surfaces are calculated using the well-known Lewis equation as Bondi and Stefanizzi (2001):
Where Cpd, a is the dry-air specific heat capacity; Rv is the vapor water gas constant; and ρd, a is the dry-air density.
Model Benchmarking
The experimental tests by Maref et al. (2002a, 2004), Maref and Lacasse (2009) were used in this study to validate the hygrothermal present model. In these tests, full-scale laboratory experiments were conducted in indoor and outdoor climatic chambers in order to assess the hygrothermal performance of specimens. The uncertainties in the temperature and relative humidity (RH) measurements in these climatic chambers for both indoor and outdoor conditions were within ±0.5°C and ±1% RH, respectively. These measurements are provided in Figure 2. The series of the tests for the specimens were mainly focused on the drying process of wood-based sheathing material, a key component of light wood-frame construction. The full-scale specimens consisted of assemblies having dimensions of 2.43 × 2.43 m. The tests were conducted over a period sufficiently long so as to permit quantifying gravimetrically the change of the total moisture content (MC by weight) of critical specimen components under drying process. The gravimetric quantification of the total moisture content of specimen components over time was achieved using a precision weighing system, which is capable of weighing 2.43 × 2.43 m specimens having nominal weights of up to 250 kg to the nearest gram continuously over the test period (Maref et al., 2001, 2002b). In these tests, the continuous retrieval of weight data over the course of the experiment permitted determining weight loss over time of selected components and hence was used to establish not only the change, but also the rate of change in the total moisture content of the component.
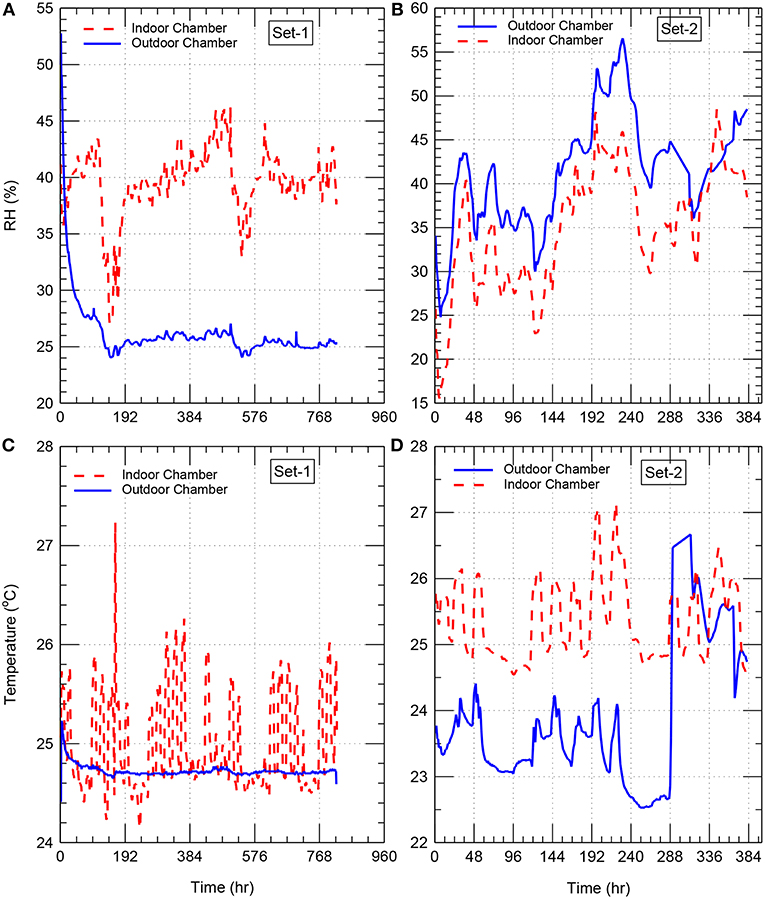
Figure 2. Outdoor and indoor conditions for set-1 specimen (A,C) and set-2 specimen (B,D).
In this study, the predictions of the present model were compared against the experimental data of two sets of specimens (see the two inserts in Figure 3). For set-1, the specimen consisted of OSB layer that was de-coupled from the specimen by coating the wood frame with a lacquer. The specimen used a standard 38 × 89 mm (2″ by 4″) wood stud frame construction, made of spruce, and spaced at 406 mm (16″) center-to-center (o/c) in 2.43 × 2.43 m (8 × 8 ft) full-scale specimens. The stud cavities were filled with glass fiber. A 0.152 mm (6 mil) polyethylene was installed on the indoor side of the specimen. Set-2 of the specimen was similar to set-1 except a sheathing membrane (Polymer-based spun bounded polyolefin) was installed in set-2 on the outdoor side of the specimen.
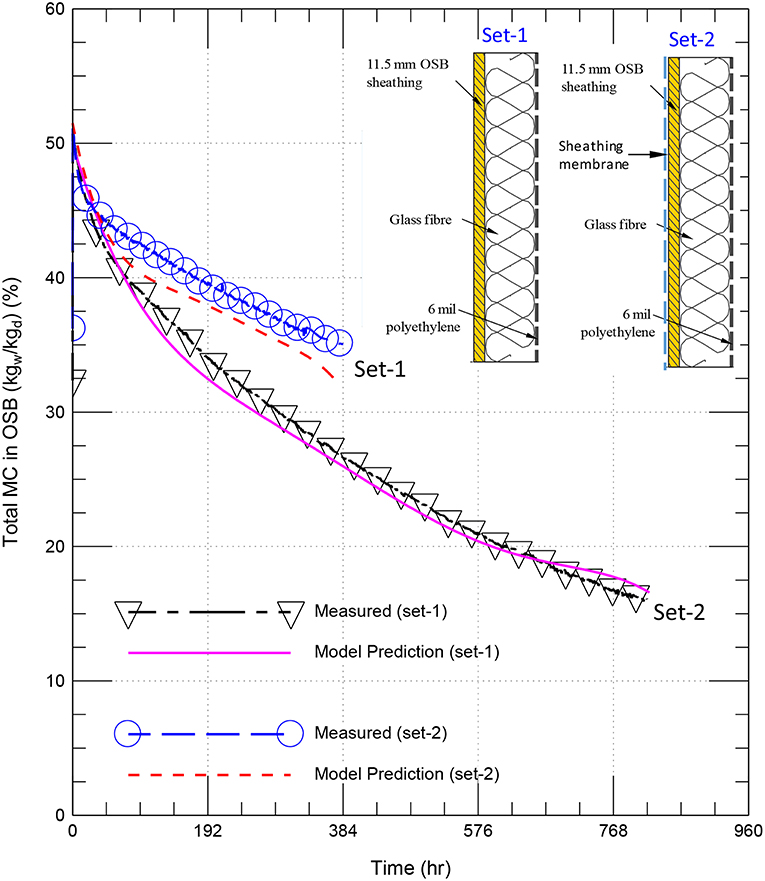
Figure 3. Drying curves of the OSB in set-1 and set-2 specimens.
The specimens were pre-conditioned to ensure that the OSB component in each specimen was brought to an elevated initial moisture content of 50.7 kgw/kgd % for set-1 specimen and 51.5 kgw/kgd % for set-2 specimen. With these initial conditions for set-1 and set-2 specimens, and the boundary conditions described earlier at the indoor surface [Equations (1, 10)] and the outdoor surface [Equations (2, 11)], the measurements of the air temperatures and relative humidities in the indoor and outdoor climatic chambers (provided in Figure 2) were used to predict the drying curves for these specimens with the present hygrothermal model. The experimental tests were carried out in a series of steps, each step comprised of evaluating the hygrothermal response of the specimens at different laboratory conditions. The full descriptions of these steps along with the weighting system are available in Maref et al. (2001, 2002a,b, 2004); Maref and Lacasse (2009).
Over a period of 820 h (34 day), the specimen of set-1 was subjected to the outdoor and indoor relative humidities shown in Figure 2A and the outdoor and indoor temperatures shown in Figure 2B. Also, over a period of 384 h (16 day), the specimen of set-2 was subjected to the outdoor and indoor relative humidities shown in Figure 2C and the outdoor and indoor temperatures shown in Figure 2D. For the specimens of set-1 and set-2, Figure 3 shows comparisons between the measured drying curves and those predicted using the present model. As shown in this figure, the predicted results of the drying curves are in good agreement with the experimental results. After gaining confidence in the present model, it was used to conduct numerical simulations in order to assess the hygrothermal performance of the roofing system shown in Figure 1. The different parameters that were used in the numerical simulations are provided next.
Simulation Parameters
As indicated earlier, cool (white) roofs use reflective materials or coatings to reflect a portion of the incident short-wave solar radiation, which lowers the rooftop surface temperature compared to black roofs. The questions are: (a) do cool roofs lead to risk of condensation and mold growth in Saudi climates?, (b) what are the amount of energy savings as result of using cool roofs instead of black roofs?, and (c) what is the reduction in the amount of insulation in a cool roof having the same energy performance level as the black roofs? To answer these questions, numerical simulations were conducted for a roofing system that is commonly used in low-rise Saudi buildings of different insulation thicknesses in order to compare the energy and moisture performance of cool roofs of different short-wave absorption coefficients with that of black roofs. The roofing system considered in this study is shown in Figure 1. As shown in this figure, the roofing system consists of concrete slab (150 mm thick), foam concrete layer (50 mm thick), sand screed layer (20 mm thick), water proofing layer (3 mm thick), thermal insulation made of XPS having different thicknesses up to 203 mm (8 inch), another sand screed layer (20 mm thick), cement mortar layer (20 mm thick). A ceramic tile (20 mm thick) was installed on the top of the roofing system. In this study, it was assumed that all material layers are in perfect contact. As such, no thermal contact resistances and moisture contact resistances were considered at all interfaces of the material layers.
Indoor Conditions
The design criteria for moisture control in buildings of ASHRAE Standard 160 model (ASHRAE, 2009) comprises three types of indoor humidity estimation models (simple method, intermediate method and the full parameter method). The simple method of ASHRAE 160 was used in this study. This method classifies the indoor humidity level into three based on the outdoor temperature. The indoor relative humidity values are estimated to be 40% and 70% when the outdoor temperature is below and equal to −10°C and above or equal to 20°C, respectively. The indoor relative humidity values are computed between 40 and 70% for outdoor temperature between −10 and 20°C. For the outdoor condition of the Eastern Province of Saudi Arabia, the corresponding indoor temperature and relative humidity are provided in Figures 4A,B, respectively.
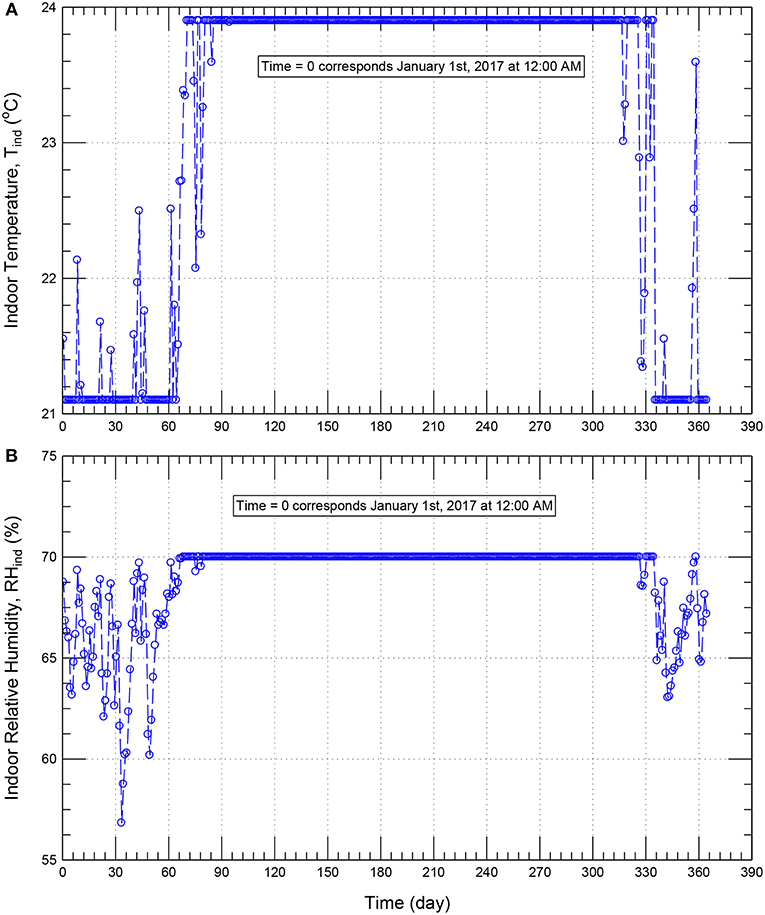
Figure 4. Indoor conditions for temperature (A) and relative humidity (B) based on ASHREAE 160—simple method (ASHRAE, 2009) for the climatic conditions of the Eastern Province of Saudi Arabia.
Outdoor Conditions
The roof with different insulation thicknesses and short-wave absorption coefficients provided in Figure 1 was subjected to the weather conditions of Eastern Province of Saudi Arabia, which is hot and humid climate. One of the main objectives of the study is to compare the risk of condensation and the potential energy savings in cool roofs having different insulation thicknesses with that in conventional/black roofs having the same insulation thicknesses when these roofs are subjected to the same outdoor and indoor conditions. At the time of carrying out this study, the most recent year (year 2017) was selected to show such performance comparisons between cool roofs and black roofs. The hourly weather data of year 2017 was obtained from the Eastern Province of Saudi Arabia's King Fahd International Airport having the latitude angle of 26.45° (+ to N), longitude angle 49.82° (+ to E) and time zone of 3 h (+UTC). Figures 5A,B show, respectively, the outdoor temperature and relative humidity. With the whole year, Figure 5A shows that the maximum, minimum and average outdoor temperatures are 49.0, 2.0, and 27.3°C, respectively. Also, Figure 5B shows that maximum, minimum and average outdoor relative humidities are 100, 4, and 42%, respectively.
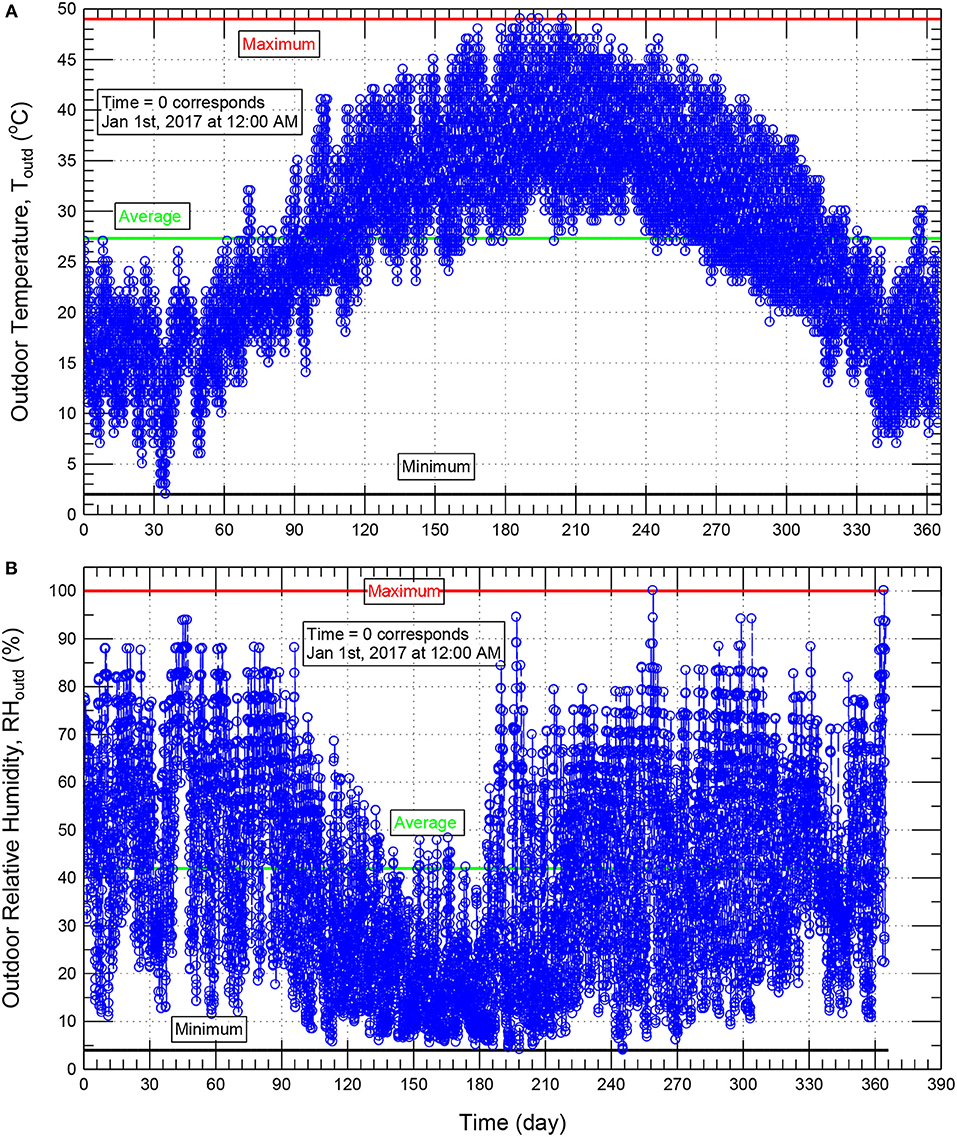
Figure 5. Outdoor temperature (A) and relative humidity (B) of the Eastern Province of Saudi Arabia (year 2017).
Using the weather data of different years in the simulation period may result in moisture accumulation over time within the roof. For a given climatic location, the main reason(s) of the moisture accumulation over time could be due to the effect of the differences in the weather data of this location from 1 year to another (Effect-A) and/or due to the effect of the hygrothermal properties of different layers of the roof (Effect-B). With these two effects, it is hard to conclude that whether the moisture accumulation over time in such roof is due Effect-A or Effect-B. To exclude Effect-A for a given climatic location, the weather data of 1 year in this location was repeated for subsequent years. As such, any moisture accumulation over time would be mainly due to the effect of the hygrothermal properties of different layers of the roof (i.e., due to Effect-B).
In this study, the weather conditions of different years were not analyzed to identify the dry year, average year and wet year. However, as will be shown later, the highest relative humidity in the roofing system was well below the critical value at which risk of condensation and mold growth can occur even with different initial moisture conditions in the roofing system. As such, we would claim that no risk of condensation and mold growth occur when the roofing system is subjected to the weather conditions of the Eastern Province of Saudi Arabia with other years rather than year 2017.
Initial Conditions and Simulation Period
Conducting hygrothermal simulation for a roof, subjected to a climatic condition, requires a prior knowledge of the initial conditions (i.e., at time = 0) for both the temperature and moisture content distributions inside the roof. Normally, these initial conditions are not known and should be assumed (Bludau et al., 2009, 2010; Zirkelbach et al., 2010; Saber et al., 2011a, 2012a). In this study, for each roof, time = 0.0 corresponded to January 1st at 12.00 a.m. at which the initial temperature in all material layers was assumed equal 10°C. Also, the initial moisture content in all material layers was assumed to correspond to 50% RH (Saber et al., 2011a, 2012a). However, the roofing system may have a built-in-moisture. To investigate the effect of the initial moisture content on the long-term performance of the cool and black roofs, numerical simulations were also conducted for another initial moisture content that corresponds to 90% RH. To predict the long-term hygrothermal performance of the black and cool roofs, the numerical simulations were conducted for a long time period which was five (5) years. In case of the moisture accumulation continues to increase over time after 5 years, the period of the numerical simulations was extended so as to predict the long-term performance of the roof.
Hygrothermal Material Properties
The hygrothermal properties of all material layers of the roof shown in Figure 1 were obtained from the references (Kumaran and Wang, 2002; Kumaran et al., 2002a,b).
Short-Wave Solar Absorption Coefficient
For most conventional/black roofs, the short-wave solar absorption coefficient is 0.88 (Bludau et al., 2009, 2010; Saber et al., 2011a, 2012a). As the cool roofs would have different values of short-wave solar absorption coefficients (αs), this study was conducted for different values of αs ranging from 0.05 to 0.8. This range of αs would cover most of reflective roofing materials and coatings available in the market.
Results and Discussions
This section provides the results of the hygrothermal performance of black roofs and cool (white) roofs when these roofs were subjected to the outdoor climates of the Eastern Province of Saudi Arabia. The temperature, heat flux and moisture distributions in the roofs were obtained by solving the energy equation and moisture equation in different layers (Saber et al., 2010a,b, 2011b,c, 2012b,c; Tariku et al., 2010). In this study, numerical simulations were conducted for the roofing system shown in Figure 1 with different insulation thicknesses and for a wide range of short-wave solar absorption coefficient (0.05–0.88). Because one of the objectives of this study is to assess the moisture accumulation over time within the roof, the simulations were conducted for a period of 5 years. As it was observed that the moisture accumulation continued to increase over time, the period of simulations was extended so as to determine the number of years behind which no moisture accumulation increases over time.
Effect of Rooftop Short-Wave Absorption Coefficient on the Hygrothermal Performance
Taking the case of insulation thickness of 152 mm (6.0 inch) as example, Figures 6A,B show the average hourly relative humidity in the insulation layer and all material layers of the cool roof with αs = 0.05 and black roof with αs = 0.88 when the initial moisture content in all roof layers corresponds to 50% RH. When the roofing system having a built-in-moisture, the corresponding results for the case of the initial moisture content corresponds to 90% RH are also shown in Figures 6C,D. For different values of the initial moisture content, Figure 6A through Figure 6D show that the conventional/black roof with αs = 0.88 shows lower moisture accumulation compared to the cool roof with αs = 0.05. This observation is in agreement with many previous studies (e.g., see Solecki et al., 2005; Bludau et al., 2009, 2010; Zirkelbach et al., 2010; Saber et al., 2011a, 2012a). As shown in Figures 6A,B for the case of initial relative (RHint) of 50%, the moisture increases in all roofs from year-to-year during the first 5 years. Additionally, the moisture decreases in all roofs from year-to-year during the first 5 years for the case of RHint = 90% (Figures 6C,D). As such, the periods of simulations were extended up to 10 years for both black and cool roofs.
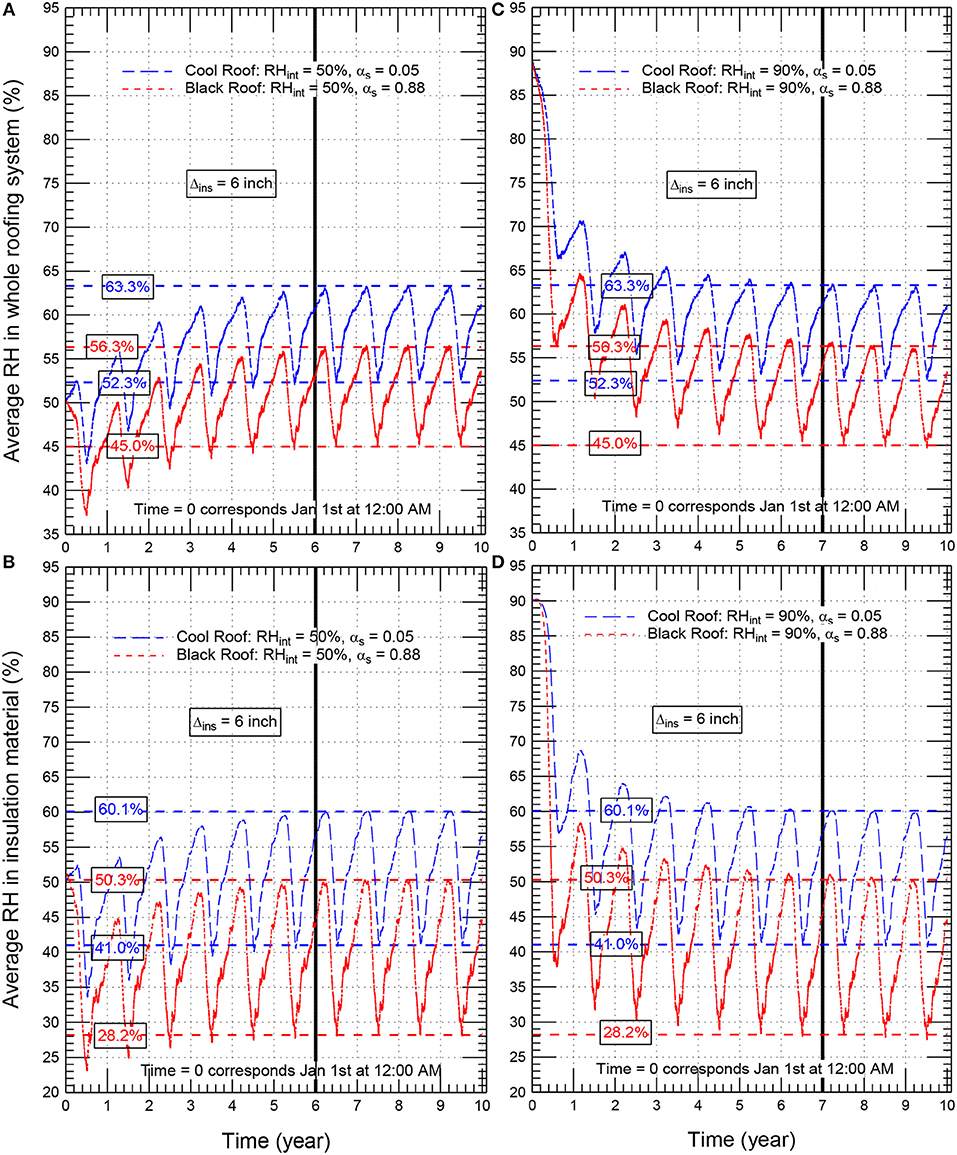
Figure 6. Average hourly relative humidity in the whole roof (A,C) and the insulation material (B,D) of conventional/black roof (αs = 0.88) and cool roof (αs = 0.05) for Δins = 152 mm (6.0 inch).
With initial moisture conditions (RHint) of 50%, and 90%, Figure 6 shows that no changes in the moisture occurs from year-to-year after 6 years (the case of RHint = 50%) and 7 years (the case of RHint = 90%) for both black roof (αs = 0.88) and cool roof (αs = 0.05). In other words, the relative humidity at a given date after 6 years (the case of RHint = 50%) and after 7 years (the case of RHint = 90%) is the same as that at the corresponding dates in the subsequent years. For example, after 6 years (the case of RHint = 50%) and 7 years (the case of RHint = 90%) for the white roof with αs = 0.05, the highest and lowest relative humidities in the whole roof were, respectively, 63.3 and 52.3%, and as well-occurred at the same dates in the subsequent years (i.e., after year 6, the case of RHint = 50% shown in Figure 6A, and after year 7, the case of RHint = 90% shown Figure 6C. The corresponding results for the black roof with αs = 0.88 were, respectively, 56.3 and 45.0%. Note that the approach of repeating the weather data of 1 year in the subsequent years has helped investigate the long-term moisture performance due to the effect of the hygrothermal properties of different layers in the roofing systems.
Similar trends for the changes of the moisture with time as that shown in Figure 6 for roofing systems with insulation thickness of 152 mm (6 inch) were also obtained for other roofing systems with different insulation thicknesses [0–203 mm (8 inch)] and different short-wave solar absorption coefficients (0.05–0.88), for example, see Figure 7 for black roof (αs = 0.88) and cool roof (αs = 0.05) with insulation thickness of 102 mm (4 inch) and having different initial moisture conditions (50% RH and 90% RH). It is important to point out that the obtained results for the highest relative humidity in all roofing system considered in this research study were well below 80%. As provided in many previous studies (Hukka and Viitanen, 1999; Viitanen and Ojanen, 2007; Ojanen et al., 2010; Saber et al., 2014, 2016, 2017; Saber and Maref, 2015; Lacasse et al., 2016), no risk of condensation and mold growth occurred at different temperatures when the relative humidity is below 80%. Since the highest relative humidities in all black and cool roofs considered in this study (see Figures 6, 7 as examples) were well below 80%, no risk of condensation and mold growth occurred in these roofs.
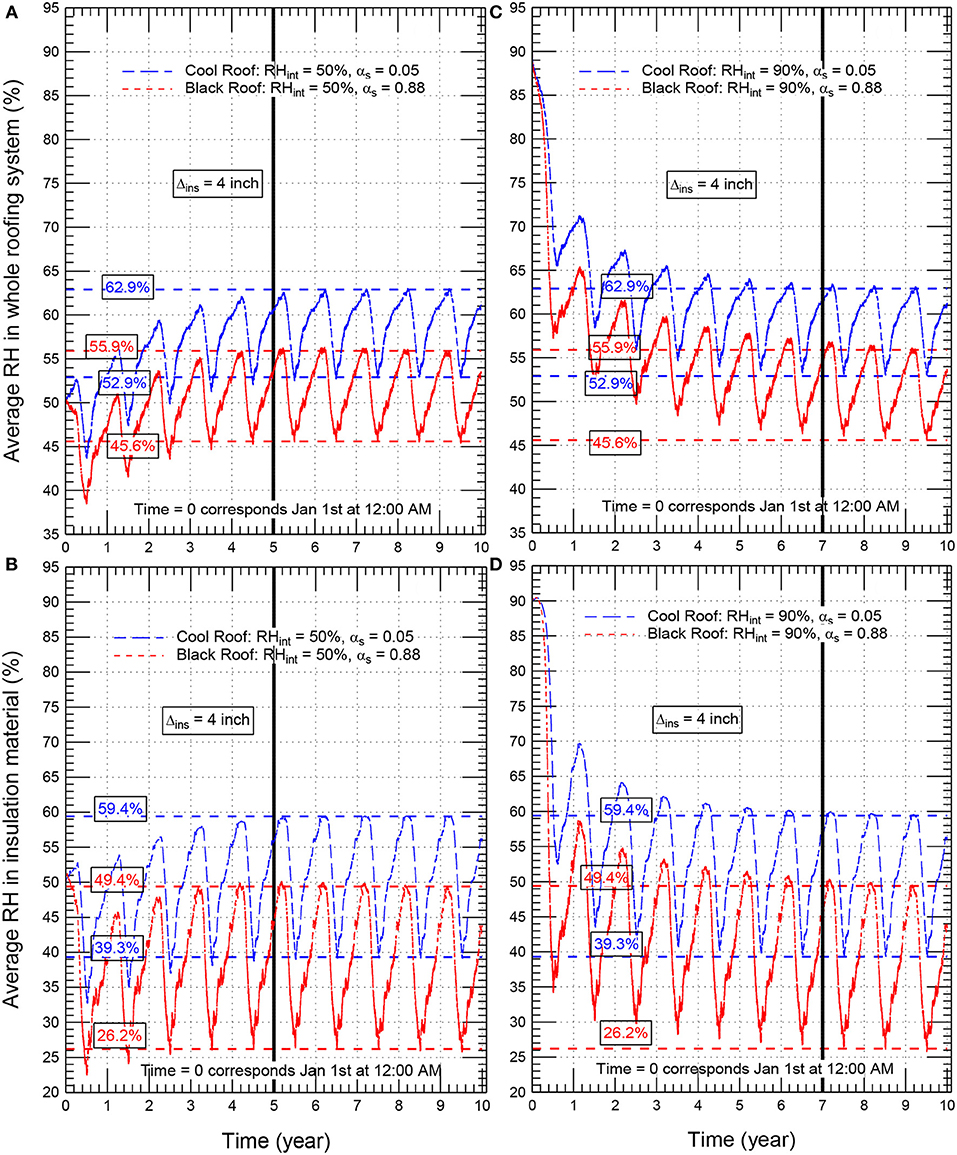
Figure 7. Average hourly relative humidity in the whole roof (A,C) and the insulation material (B,D) of conventional/black roof (αs = 0.88) and cool roof (αs = 0.05) for Δins = 102 mm (4.0 inch).
Figures 8A,B, respectively, show the hourly rooftop surface temperature of the conventional/black roof with αs = 0.88 and cool roof with αs = 0.05. For a wide range of short-wave solar absorption coefficients (αs = 0.88, 0.8, 0.7, 0.6, 0.5, 0.4, 0.3, 0.2, 0.1, and 0.05), Figure 9 shows the monthly average external surface temperatures as well as the monthly average outdoor air temperature is shown. Note that for a given short-wave solar absorption coefficient of reflective material, dirt/dust accumulation on the surface of this material would increase its short-wave solar absorption coefficient. As such, the considered range of αs (0.88–0.05) in this study covers different types of reflective materials with and without dirt/dust accumulation. Additionally, for dusty weather such as that in Saudi Arabia, another research study is currently being conducted on a number of commercial reflective roofing materials to: (a) investigate the effect of the dirt and dust accumulation on the solar reflectivity of these materials, and (b) develop a cleaning process that is applicable to Saudi climates. The obtained results will be published at a later date.
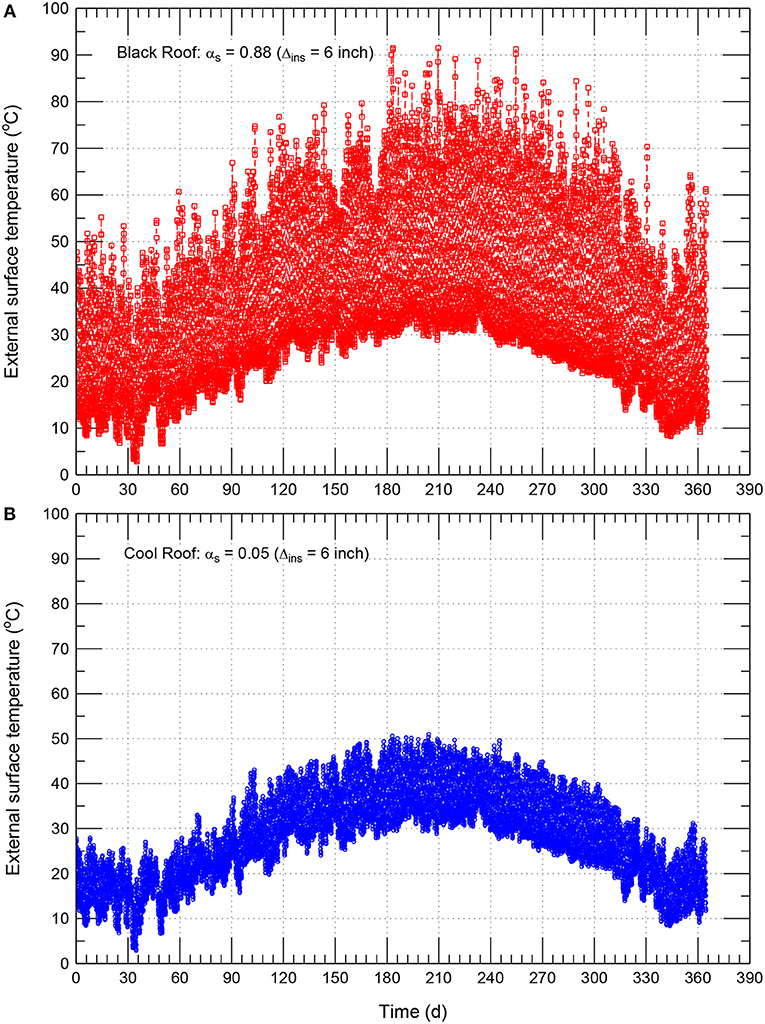
Figure 8. Comparison of hourly external surface temperature of conventional/black roof (αs = 0.88) (A) and cool roof (αs = 0.05) (B) for Δins = 152 mm (6.0 inch).
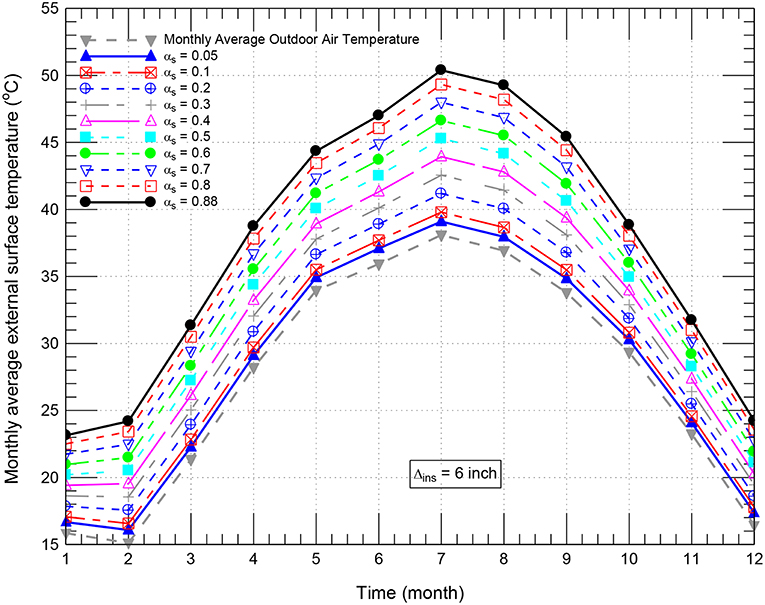
Figure 9. Comparison of monthly average external surface temperature of conventional/black roof (αs = 0.88) and cool roof of different short-wave solar absorption coefficients (αs) for Δins = 152 mm (6.0 inch).
Due to the high short-wave solar absorption coefficient of the black roof of αs = 0.88 (Figure 8A), the surface temperature of the rooftop was considerably higher than that of the cool roof of αs = 0.05 (Figure 8B). The highest surface temperature of the black roof was 91.5°C compared to 50.8°C for the cool roof of αs = 0.05. Consequently, the corresponding highest surface temperature of the cool roof was 40.7°C lower than that for the black roof. During nighttime, however, the surface temperatures of both black and cool roofs were approximately the same. Figure 9 shows that the highest monthly average surface temperatures of the roof with different short-wave solar absorption coefficients occurred in the month of July in which the average surface temperatures of the cool roofs with αs = 0.05 were 11.3°C lower than that of black roofs with αs = 0.88. During the entire year, Figure 9 shows that the highest difference between the monthly average surface temperature of the cool roof with αs = 0.05 and the monthly average outdoor air temperature was only 1.16°C, which occurred in June. However, the highest difference between the monthly average surface temperature of the black roof with αs = 0.88 and the monthly average outdoor air temperature was 12.33°C, which occurred in August (see Figure 9). Consequently, cool roofs help reduce the temperature of the roof surfaces, and hence contribute in mitigating the urban heat island effects.
As an example for insulation thickness of 152 mm (6.0 inch), Figure 10 shows comparisons of the hourly heat flux on the indoor surface of black roof of αs = 0.88 and cool roof of αs = 0.05. As shown in this figure, when the heat flux is positive, it is called “heat gain.” This represent the case of conductive heat into the building where the system contributes to the cooling load. When the heat flux is negative (Figure 10B), however, it is called “heat loss” (i.e., conductive heat out of the building where the system contributes to the heating load). As shown in Figure 10A, due to the higher surface temperature of black roof, its heat gain is significantly higher than that for cool roof. During the whole year, the hourly highest heat gain for the black roofs with αs = 0.88 was 5.897 W/m2, which was about 1.862 times that for cool roofs with αs = 0.05 (3.167 W/m2). The high heat gains for the black roof takes place during the peak electrical demand periods that generally occur on hot summer months. As such, cool roof can help building owners reduce peak electricity demand. Note that lower peak electricity demand can not only reduce the total electrical use but also reduce the demand fees that some utilities charge building owners. As shown in Figure 10B, the corresponding highest hourly heat loss of the black roofs were 2.105 W/m2, which was about 0.735 times that for the cool roof (2.841 W/m2). As such, black roof require higher cooling load than that for cool roof. On the other hand, black roof require lower heating load than that for cool roof.
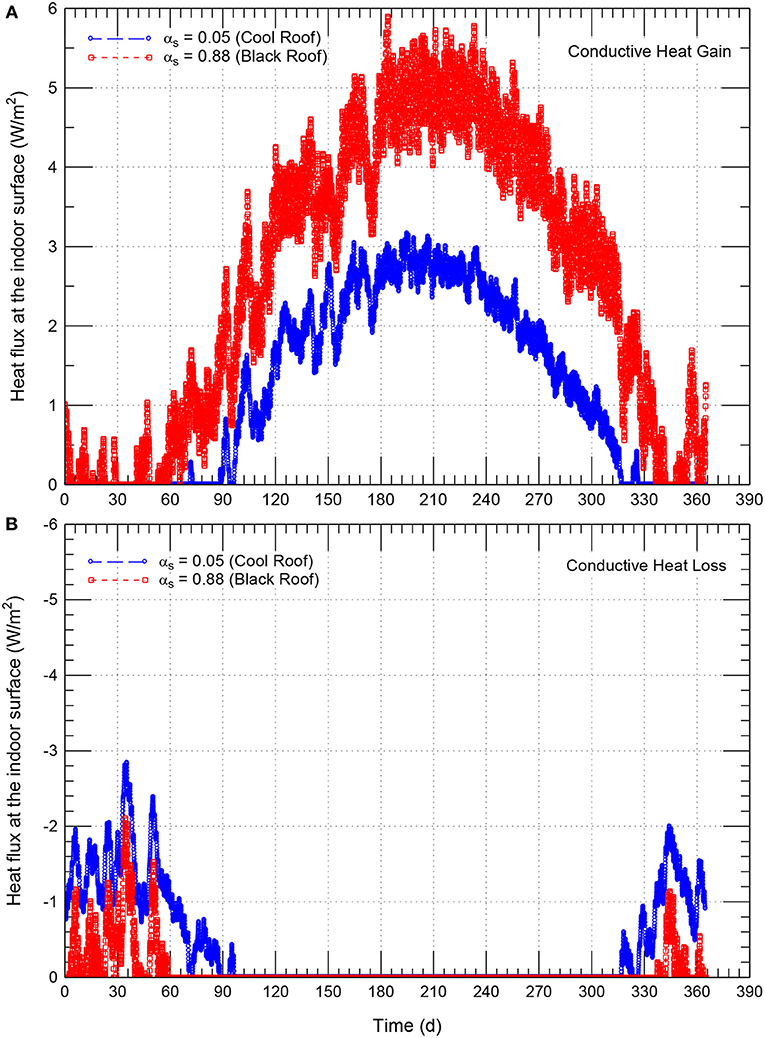
Figure 10. Comparison of hourly heat flux at the indoor surface due to conductive heat gain (A) and conductive heat loss (B) of conventional/black roof (αs = 0.88) and cool roof (αs = 0.05) for Δins = 152 mm (6.0 inch).
In summary, buildings with cool roofs would require more heating load during the winter time than buildings with black roofs. Conversely, buildings with cool roofs would require less cooling load in the summer time than buildings with black roofs.
For the roofing system (see Figure 1) with a wide range of insulation thicknesses [0–203 mm (8.0 inch)] and wide range of short-wave solar absorption coefficients (αs = 0.88, 0.8, 0.7, 0.6, 0.5, 0.4, 0.3, 0.2, 0.1 and 0.05), the predicted heat fluxes were used to evaluate the monthly and yearly energy loss, EH, L (contributed to the heating energy load), and the monthly and yearly energy gain, EC, L (contributed to the cooling energy load). The yarely EH, L represents the area under the curve of the negative heat flux only during a period of 1 year (Figure 10B). Whereas, the yearly EC, L represents the area under the curve of the positive heat flux only during a period of 1 year (Figure 10A). The values EH, L and EC, L were determined as:
Equation (14) above was also used to determine the monthly conductive energy gain and loss where the integration periods were conducted over each month during the whole year.
Monthly Conductive Energy Gain and Loss
The numerical simulations were conducted for the roof shown in Figure 1 of different insulation thicknesses and different short-wave solar absorption coefficients, αs = 0.88, 0.8, 0.7, 0.6, 0.5, 0.4, 0.3, 0.2, 0.1, and 0.05. Note that αs = 0.88 corresponds to a roof without reflective material (i.e., conventional/black). As examples for different values of αs, Figures 11A,B [insulation thickness, Δins, of 102 mm (4.0 inch)] and Figures 12A,B [Δins of 152 mm (6.0 inch)] show the monthly conductive energy gains (+ve values) and the monthly conductive energy losses (-ve values). As shown in these figures for a given short-wave solar absorption coefficient, the highest conductive energy gain occurred in the month of July, followed by the month of August.
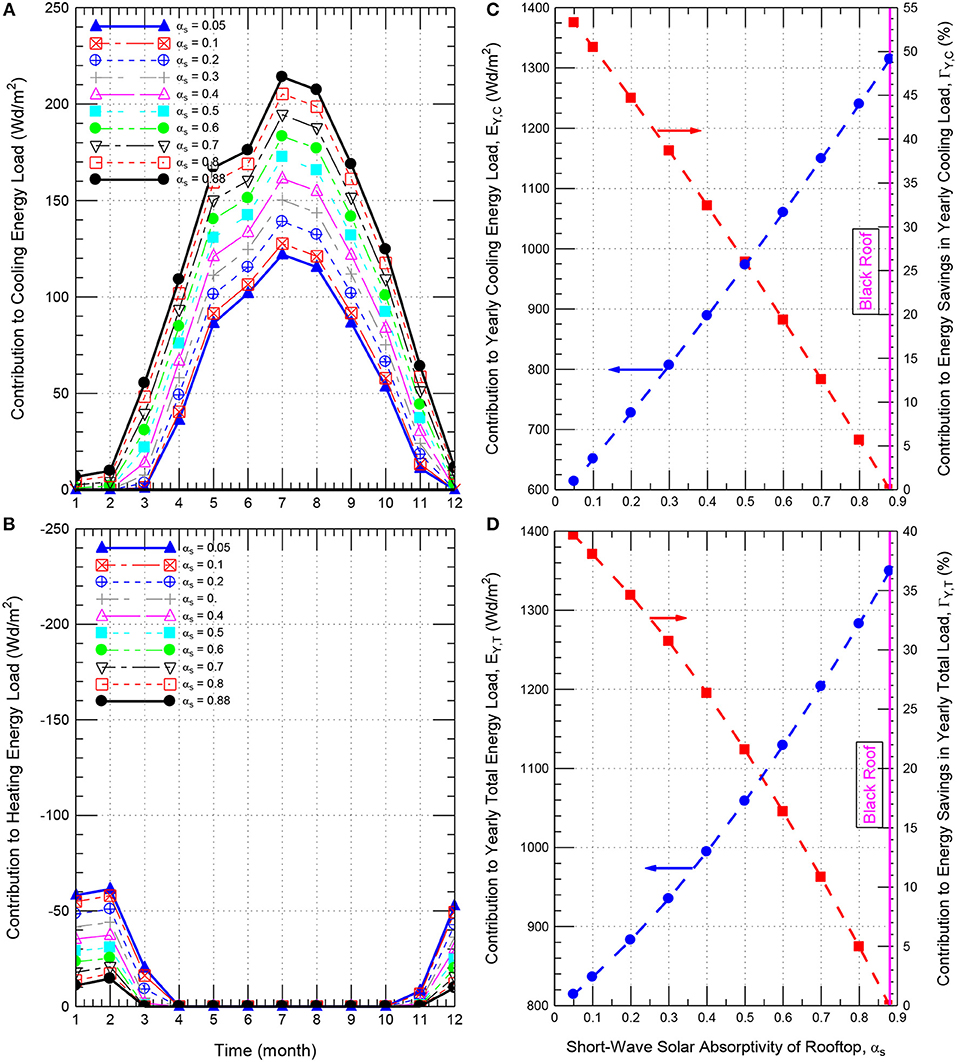
Figure 11. Effect of the rooftop short-wave solar absorption coefficient on the contributions to the monthly cooling and heating energy loads (A,B) and yearly cooling and total energy loads (C,D) for roof having Δins = 102 mm (4.0 inch).
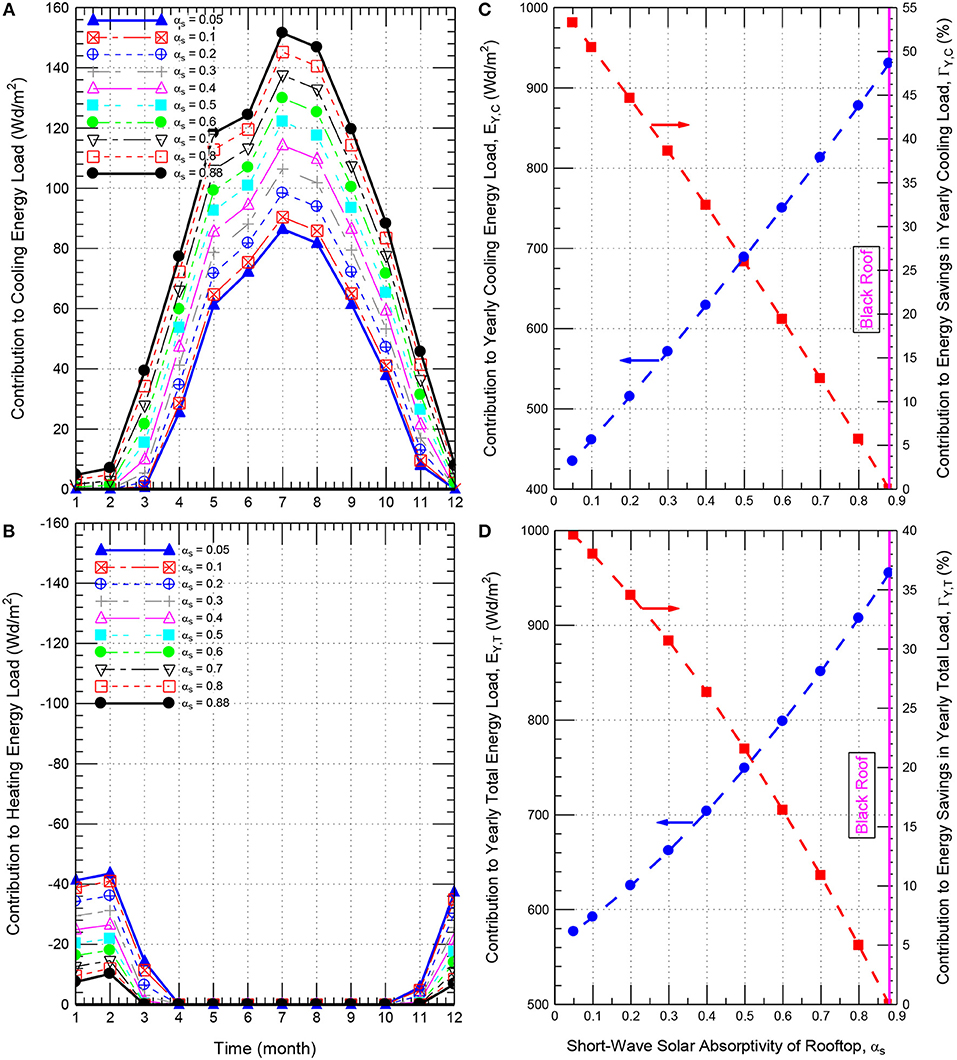
Figure 12. Effect of the rooftop short-wave solar absorption coefficient on the contributions to the monthly cooling and heating energy loads (A,B) and yearly cooling and total energy loads (C,D) for roof having Δins = 152 mm (6.0 inch).
Figures 11A, 12A show that the monthly conductive energy gain decreases as the short-wave solar absorption coefficient decreases. For example, the conductive energy gain in the month of July for the roof having insulation thickness of 102 mm (4.0 inch) decreases from 214 to 139 Wd/m2 and 122 Wd/m2 as the short-wave solar absorption coefficient decreases from 0.88 (i.e., black roof) to 0.2 and 0.05, respectively (Figure 11A). This represents reductions in the conductive energy gains by 54 and 75% as a result of decreasing the short-wave solar absorption coefficient from 0.88 to 0.2 and 0.05, respectively. Figures 11B, 12B show that the highest conductive energy loss for different roofing systems occurred in February. For the case of Δins of 102 mm (4.0 inch), the highest conductive energy loss for the cool roof with αs = 0.05 was 61.3 Wd/m2 compared to 14.6 Wd/m2 for black roof with αs = 0.88. The corresponding result for the case of Δins of 152 mm (6.0 inch) was 43.5 Wd/m2 for the cool roof compared to 10.2 Wd/m2 for the black roof.
In cold climates, the sources of heating loads in residential buildings are usually obtained using heaters or furnaces that use fossil fuel; whereas the sources of the cooling loads are obtained using coolers or A/C systems that use electrical energy. Because the differences in prices per thermal unit between the fossil fuel and electrical energy, the cooling energy load and heating energy load should be provided separately (Bludau et al., 2009; Saber et al., 2011a, 2012a). However, in hot climates such as that in Saudi Arabia, the source of the heating loads and cooling loads in residential buildings are obtained using heaters, coolers or A/C systems that use electrical energy. As such, the total energy loads in hot climates can simply be obtained as the sum of the cooling loads and the heating loads.
Yearly Conductive Energy Gain and Loss
For all values of the insulation thickness considered in this study [0–203 mm (8.0 inch)], the obtained results for the conductive energy gains and losses were used to determine the contribution to the yearly cooling energy load (EY, C) and the contribution to the yearly total energy load (EY, T). Additionally, as results of using reflective roofing materials and coatings with different values of the short-wave solar absorption coefficients (αs) in the roofs, the values of EY, C and EY, T were used to determine the contribution to the energy savings in yearly cooling energy load (ΓY, C) and the contribution to the energy savings in the yearly total energy load (ΓY, T). For a given insulation thickness, the values of ΓY, C and ΓY, T for cool roofs with different values of αs relative to the black roof with αs = 0.88 are calculated as:
Contribution to the Reductions in Energy Loads of Cool Roofs Relative to Black Roofs of Same Insulation Thickness
Reflective roofing material and roof insulation are not comparable options for saving building energy. They work differently. Building owners must make separate decisions to either upgrade roof insulation levels or install reflective roofing materials. The results provided below show the potential contribution to the reductions in the cooling energy loads due to using cool roofs with different insulation thicknesses relative to conventional/black roofs with the same insulation thickness.
As examples for the insulation thickness of 102 mm (4.0 inch) and 152 mm (6.0 inch), the obtained results for EY, C and EY, T, and ΓY, C and ΓY, T are provided, respectively, in Figures 11C,D, 12C,D. In these6 figures, the values of EY, C and EY, T are plotted on the left y-axis, whereas the values of ΓY, C and ΓY, T are plotted on the right y-axis. As shown in these figures, decreasing the short-wave solar absorption coefficient has resulted in decreasing the yearly cooling load and the yearly total load for different insulation thicknesses. For example, as shown on the left y-axis of Figures 11C,D for insulation thickness of 102 mm (4.0 inch), decreasing αs from 0.88 to 0.2 and 0.05 has resulted in: (a) decreasing EY, C from 1314.3 Wd/m2 to 727.5 Wd/m2 and 613.8 Wd/m2, respectively, and (b) decreasing EY, T from 1349.6 Wd/m2 to 882.8 Wd/m2 and 814.2 Wd/m2, respectively. Additionally, as shown on the right y-axis of Figures 11C,D, the corresponding contribution to the energy savings in the yearly cooling load relative to black roof (ΓY, C) were 44.7 and 53.3%, respectively, and the corresponding contribution to energy savings in the yearly total load relative to black roof (ΓY, T) were 34.6 and 53.3%, respectively. Similar results for the contributions to the reductions in the yearly cooling loads and yearly total loads were obtained for all values of insulation thickness considered in this study [e.g., see Figures 12C,D for insulation thickness of 152 mm (6.0 inch)].
Effect of Insulation Thickness
A black roof with specified insulation thickness (Δins) is referred in this study as “reference roof.” To determine the reduction in the thermal insulation and the corresponding short-wave solar absorption coefficient (αs) of a reflective roof that provides the same energy performance level as the reference roof, numerical simulations were conducted for black roof (αs = 0.88) shown in Figure 1 and having a wide range of Δins of 0–203 mm (8.0 inch). As well, for each value of Δins, numerical simulations were conducted to predict the energy performance for a wide range αs of 0.05–0.8. Examples of the simulation results for the contributions to the monthly and yearly energy loads are provided in Figure 11 [Δins = 102 mm (4.0 inch)] and Figure 12 [Δins = 152 mm (6.0 inch)]. For black roof (αs = 0.88) of different Δins, the results of the contributions to the yearly cooling loads and the contributions to the yearly total loads are summarized in Figures 13A,B, respectively. Whereas for roof of different Δins and αs, the results of the contributions to the yearly energy loads are summarized in Figure 14.
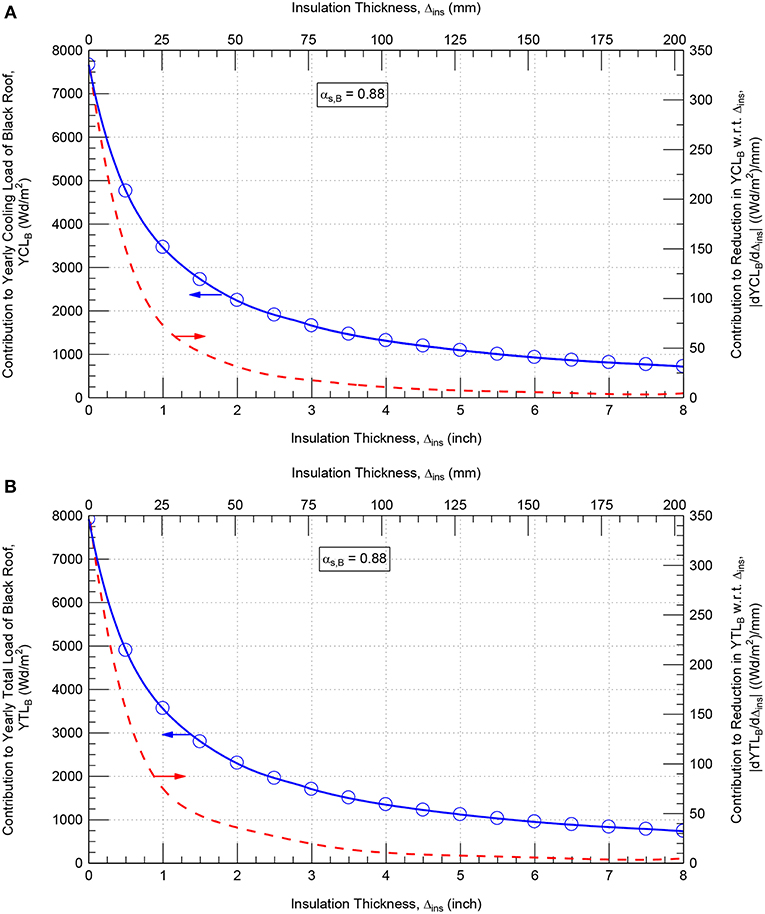
Figure 13. Effect of the insulation thickness on the contribution to the yearly cooling energy load (A), yearly total energy load (B) and the reductions in these loads with respect to insulation thickness for black roof.
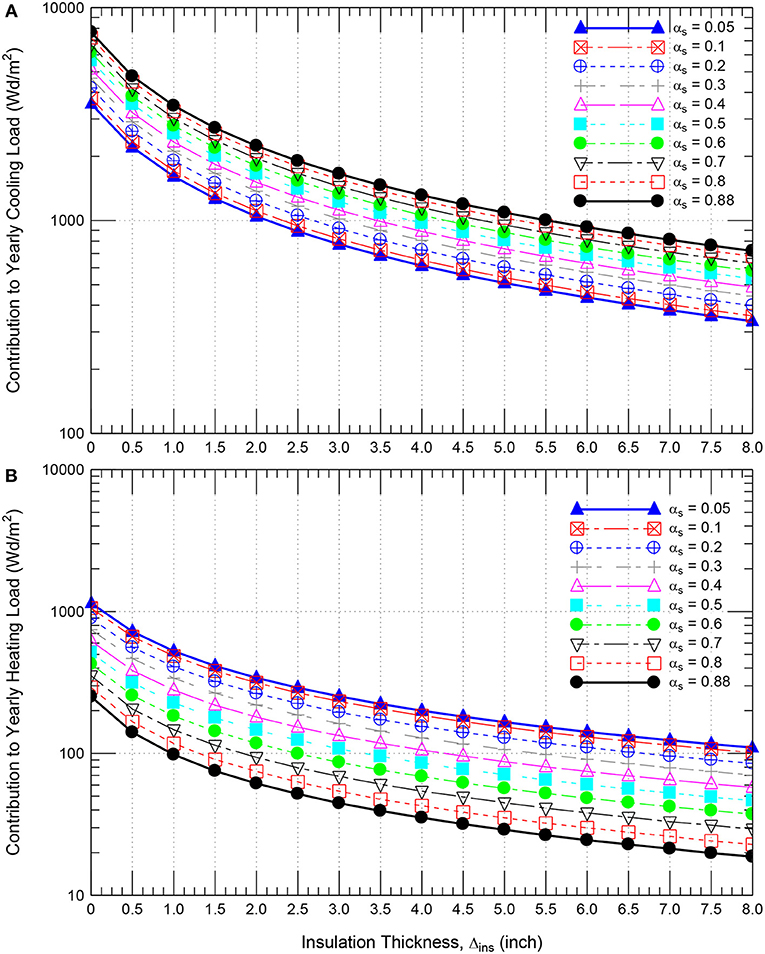
Figure 14. Effect of the insulation thickness on the contribution to yearly cooling energy load (A) and yearly heating energy load (B) (in log scale) for different short-wave solar absorption coefficients.
Due to the conductive heat gain and loss for a given insulation thickness in black roof subjected to the weather conditions of the Eastern Province of Saudi Arabia, the value of the contribution to the yearly heating load is significantly lower than the value of the contribution to the yearly cooling load. As such, Figures 13A,B) show that the contribution to the yearly total load is slightly higher than the contribution to the yearly cooling load. For small values of insulation thickness [Δins ≤ 51 mm (2 inch)], Figure 13 shows that both the contributions to the yearly energy loads of black roof and the corresponding reduction rates in these loads with respect to the insulation thickness decrease significantly with increasing the insulation thickness. For example, the reduction rates in the yearly cooling loads with respect to insulation thickness |dYCLB/Δins| (plotted on the right y-axis of Figure 13A, were 151, 72 and 30 (Wd/m2)/mm for insulation thickness of 13 mm (0.50 inch), 25 mm (1.0 inch), and 51 mm (2.0 inch), respectively. For large values of insulation thickness [Δins ≥ 102 mm (4 inch)], however, the contributions to the yearly cooling loads of black roof and the corresponding reduction rates in these loads with respect to the insulation thickness decrease slightly with increasing the insulation thickness. For insulation thickness of 102 mm (4.0 inch), 152 mm (6.0 inch) and 203 mm (8.0 inch), the values of |dYCLB/Δins| were only 11, 6 and 4 (Wd/m2)/mm, respectively.
Pairs of Insulation Thickness and Short-Wave Solar Absorption Coefficient
All results of the contributions to the yearly energy loads of the roof (see Figure 1) with wide ranges of insulation thickness and short-wave absorption coefficient are provided in Figure 14. These results were used to identify the pairs of the thermal insulation thickness (Δins) and the short-wave solar absorption coefficient (αs) at which the energy performance level of such roof with these pairs are the same as that for the reference roof (i.e., with specified Δins and αs = 0.88). As examples for few values of the contributions to the yearly cooling loads (YCL = 720, 812, 931, 1090, 1314, 1658, and 2242 Wd/m2) and few values of the contributions to the yearly total loads (YTL = 738, 833, 955, 1119, 1350, 1702, and 2303 Wd/m2), Figures 15A,B show the corresponding pairs of Δins and αs that were extracted from Figures 14A,B for the same contribution to the yearly cooling loads, and the same contributions to the yearly total loads of the roofs, respectively.
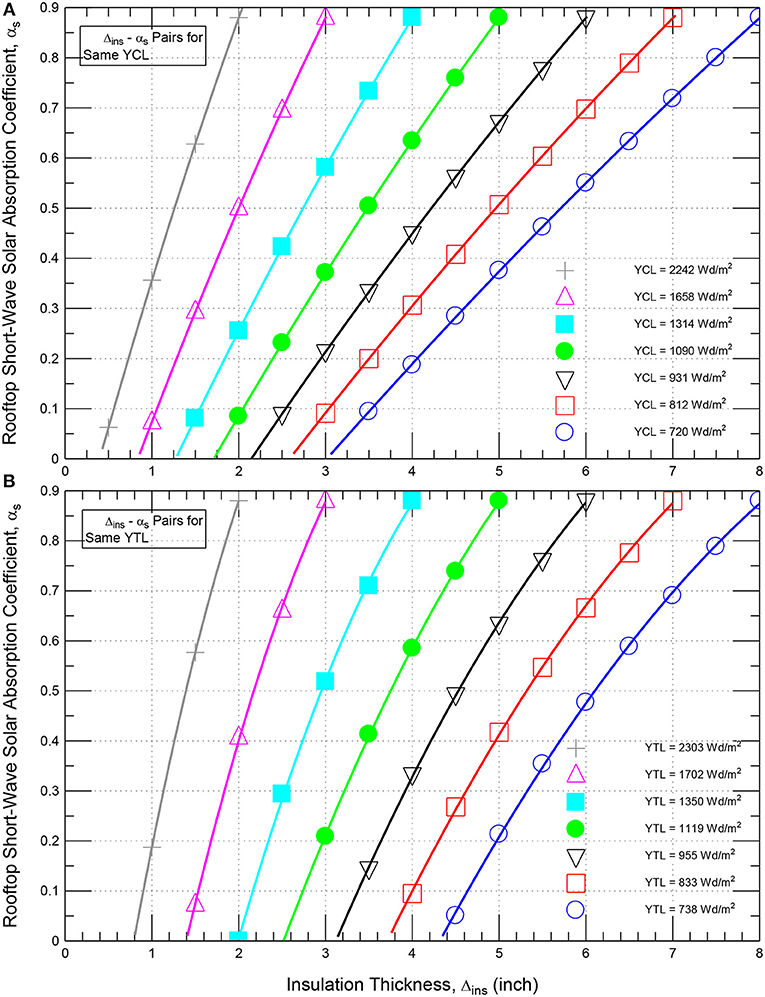
Figure 15. Thermal insulation—short wave absorption coefficient pairs for the same contribution to: (A) yearly cooling energy loads and (B) yearly total energy loads.
Example of Δins and αs Pairs for Same Yearly Cooling Load
Figure 16A shows an example for the yearly cooling load (YCL) of 931 Wd/m2 that corresponds to a reference/black roof having Δins = 152 mm (6.0 inch) and αs = 0.88. As shown in this figure, YCL = 931 Wd/m2 can be achieved via using the pairs of Δins and αs that can be given as:
From Equation (16) or Figure 16A for YCL = 931 Wd/m2, a 0, 33.3, 50.3, and 61.0% savings in insulation thickness [i.e., Δins = 152 mm (6.0 inch), 102 mm (4.0 inch), 76 mm (3.0 inch), and 60 mm (2.35 inch)] requires the values of rooftop short-wave solar absorption coefficient to be αs = 0.88 (i.e., black), 0.45, 0.21, and 0.05, respectively.
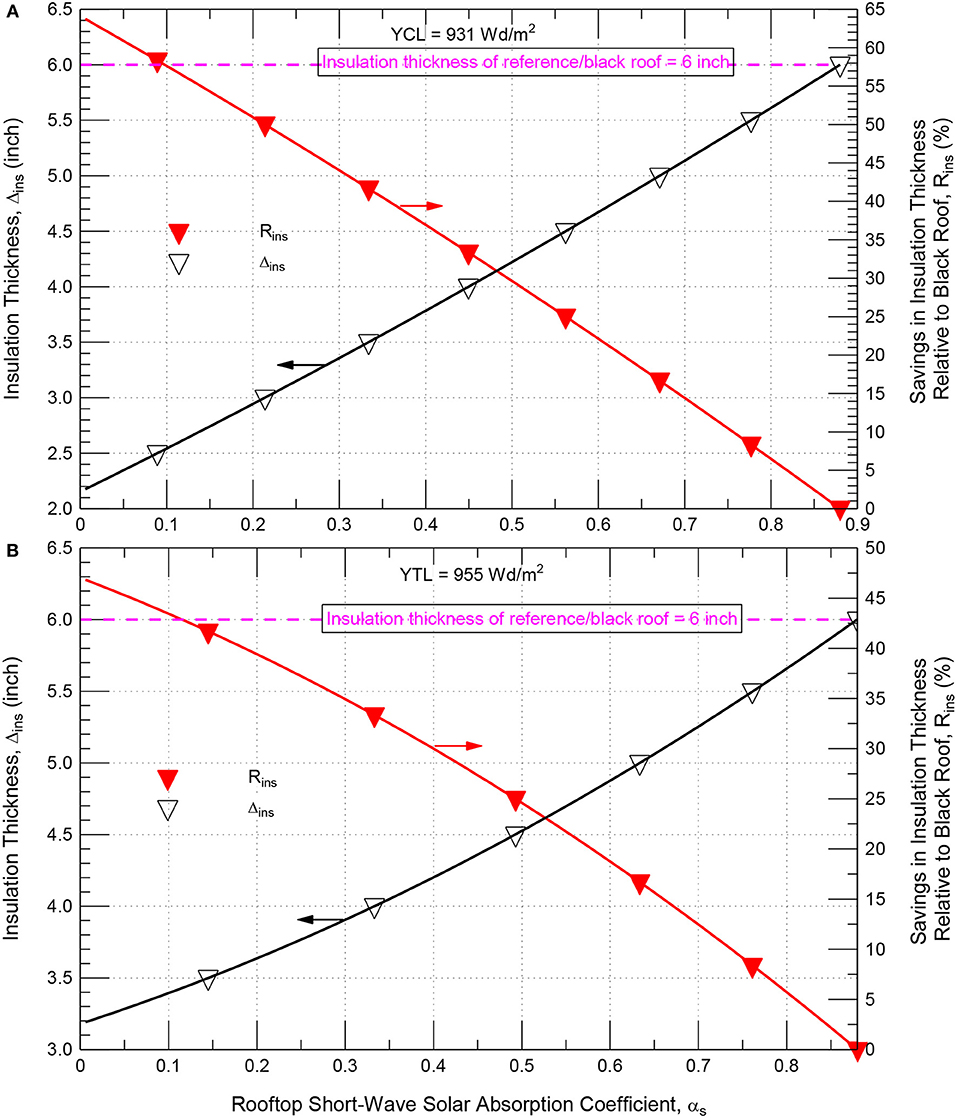
Figure 16. Design chart for all pairs of Δins and αs and the corresponding reductions in insulation that provide the same contribution to (A) yearly cooling load (B) yearly total load as the reference/black roof of Δins = 152 mm (6.0 inch).
Example of Δins and αs Pairs for Same Yearly Total Load
As example, a contribution to the yearly total load (YTL) of 955 Wd/m2 that corresponds to a reference/black roof having Δins = 152 mm (6.0 inch) and αs = 0.88 (see Figure 16B) can be achieved via using the pairs of Δins and αs that can be given as:
From Equation (17) or Figure 16B, a 0, 33.5, and 45.3% savings in insulation thickness [i.e., Δins = 152 mm (6.0 inch), 102 mm (4.0 inch), and 83 mm (3.25 inch)] requires the values of rooftop short-wave solar absorption coefficient to be αs = 0.88 (i.e., black), 0.33 and 0.05, respectively. A simple design tool for the roof considered in this study that can be used for determining the different pairs of the insulation thickness and the short-wave solar absorption coefficient will be published at a later date.
Summary and Conclusions
For wide ranges of insulation thicknesses and rooftop short-wave solar absorption coefficients, numerical simulations were conducted in this study to investigate the energy and moisture performance of black roofs and cool roofs with different reflective roofing materials and coatings. The type of roof considered in this study is commonly used in low-rise buildings in Saudi Arabia. This roof was subjected to hot and humid weather of the Eastern Province of Saudi Arabia and the indoor conditions as per the simple method of ASHRAE Standard 160. Results showed that black roofs always perform with lower moisture than cool roofs. For all black and cool roofs having different initial moisture conditions, no moisture changes occurred from year-to-year after 7 years. In other words, regardless the values of the initial moisture conditions, the relative humidities in the roofing systems after 7 years at a given date were the same as those at the corresponding date of the subsequent years. Since the highest relative humidities in the black and cool roofs were well below 80%, no risk of condensation and mold growth occurred in these roofs.
For given insulation thickness, the results showed that using cool roofs resulted in an increase in the contributions to the heating energy loads compared to that with black roofs. The decrease in the contributions to the cooling energy loads for cool roofs, however, were typically much greater than the increase in the contributions to the heating energy loads. Thus, cool roofs have resulted in net energy savings compared to black roofs. In order to determine the amount of thermal insulation and the corresponding short-wave solar absorption coefficient of a reflective roof that provided approximately the same energy performance level as the black roof, numerical simulations were conducted for wide ranges of insulation thicknesses [0–203 mm (8.0 inch)] and rooftop short-wave solar absorption coefficients (0.05–0.88). The obtained results were used to identify all possible pairs of the thermal insulation thickness and the corresponding short-wave solar absorption coefficient at which the energy performance of such roof with these pairs were the same as those for the reference/black roofs. As per the findings of this study, it is recommended to install reflective roofs in new buildings and also for upgrading the current buildings in Saudi Arabia. The results provided in this paper along with the results of another experimental study (currently being conducted on a number of commercial reflective roofing materials to investigate the effect of the dirt and dust accumulation on the solar reflectivity of these materials, and also to develop a cleaning process that is applicable to Saudi climates) can help for future upgrading the Saudi Building Code so as to allow less roof insulation if reflective roof is installed.
Author Contributions
HHS is the Principal Investigator and conducted the numerical simulations. WM has analyzed the data from simulation. AEH conducted literature review and contribute to prepare the manuscript.
Conflict of Interest Statement
The authors declare that the research was conducted in the absence of any commercial or financial relationships that could be construed as a potential conflict of interest.
References
Akbari, H., Berhe, A., Levinson, R., Graveline, S., Foley, K., Delgado, A. H., et al. (2005). “Aging and weathering of cool roofing membranes,” Proceedings of the First International Conference on Passive and Low Energy Cooling for the Built Environment, (Athens).
Akbari, H., Konopacki, S., and Parker, D. (2000). “Updates on revision to ASHRAE standard 90.2: including roof reflectivity for residential buildings,” in Proceedings ACEEE Summer Study on Energy Efficiency in Buildings (Pacific Grove, CA), 11–111.
Akbari, H., Konopacki, S., and Pomerantz, M. (1999). Cooling energy savings potential of reflective roofs for residential and commercial buildings in the United States. Energy 24, 391–407. doi: 10.1016/S0360-5442(98)00105-4
Algarni, S., and Nutter, D. (2015). Influence of dust accumulation on building roof thermal performance and radiant heat gain in hot-dry climates. Energy Build. 104, 181–190. doi: 10.1016/j.enbuild.2015.07.018
Al-Homoud, M. S. (2005). Performance characteristics and practical applications of common building thermal insulation materials. J. Build. Environ. 40, 353–366. doi: 10.1016/j.buildenv.2004.05.013
ASHRAE (2009). ANSI/ASHRAE Standard 160-2009, Criteria for Moisture-Control Design Analysis in Buildings. Atlanta: American Society of Heating, Refrigeration and Air Conditioning Engineers, Inc.
Barenbrug, A.W.T. (1974).Psychrometry and Psychrometric Charts, 3rd Edition, Cape Town, SA: Cape and Transvaal Printers Ltd.
Bentz, S. P. (2011). “Decision-making process for green options in reroofing,” in Proceedings of the 2011 International Roofing Symposium, (Washington, DC).
Berdahl, P., Akbari, H., Levinson, R., and Miller, W. A. (2008). Weathering of roofing materials – an overview. Constr. Build. Mater. 22 423–433. doi: 10.1016/j.conbuildmat.2006.10.015
Bludau, C., Künzel, H. M., and Zirkelbach, D. (2010). “Hygrothermal performance of flat roofs with construction moisture,” in Eleventh International Conference on Thermal Performance of the Exterior Envelopes of Whole Buildings (Buildings XI Conference), (Clearwater, FL).
Bludau, C., Zirkelbach, D., and Kuenzel, H. M. (2009). Condensation problems in cool roofs. Interface J. RCI. XXVII, 11–16. Available online at: http://rci-online.org/wp-content/uploads/2016/04/2009-08-bludau-zirkelbach-kunzel.pdf
Bondi, P., and Stefanizzi, P. (2001). Hygro-thermal performance of hollow bricks and current standards. J. Energy Build. 33, 731–736. doi: 10.1016/S0378-7788(01)00060-3
Brehob, E., Desjarlais, A., and Atchley, J. (2011). “Effectiveness of cool roof coatings with ceramic particles,” in Proceedings of the 2011 International Roofing Symposium, (Washington DC).
Catalanotti, S., Cuomo, V., Piro, G., Ruggi, D., Silvestrini, V., and Troise, G. (1975). The radiative cooling of selective surfaces. Solar Energy 17, 83–89. doi: 10.1016/0038-092X(75)90062-6
Dalgliesh, W. A., and Boyd, D. W. (1962). Wind on buildings, Canadian Building Digest 28, 4. doi: 10.4224/20324915
Desjarlais, A. O. (1995). “Self-drying roofs: What?! No dripping!,” in Proceedings of Thermal Performance of Exterior Envelopes of Buildings VI, (Clearwater, FL), 763–773.
Desjarlais, A. O., Petrie, T. W., Childs, P. W., and Atchley, J. A. (1998). “Moisture studies of a self-drying roof: tests in the large-scale climate simulator and results from thermal and hygric models,” in Proceedings of the Thermal Performance of the Exterior Envelopes of Buildings VII, (Clearwater, FL), 41–54.
Durhman, A., Collins, M., and McGillis, W. R. (2011). “Utilizing green technology and research to assess green roofing benefits,” in Proceedings of the 2011 International Roofing Symposium, (Washington, DC).
Ennis, M., and Kehrer, M. (2011). “The effects of roof membrane color on moisture accumulation in low-slope commercial roof systems,” in Proceedings of the 2011 International Roofing Symposium, (Washington DC).
European Commission (2010). Green Public Procurement Thermal Insulation Technical Background Report. Report for the European Commission– DG Environment by AEA, Harwell, Owner, Editor: European Commission, DG Environment-G2, B-1049, Brussels.
Fernandez, N., Wang, W., Alvine, K., and Katipamula, S. (2015). Energy Savings Potential of Radiative Cooling Technologies, Prepared for U.S. Department of Energy under Contract DE-AC05-76RL01830 by Pacific Northwest National Laboratory, Richland, DC. Available online at: https://www.pnnl.gov/main/publications/external/technical_reports/PNNL-24904.pdf (accessed August, 2018).
Fuentes, M. K. (1987). A Simplified Thermal Model for Flat-Plate Photovoltaic Arrays, Sandia National Laboratories, Albuquerque, New Mexico 87185 and Livermore, California 94550 for the United States Department of Energy under Contract DE-AC04-76DP00789, Sandia report: SAND85-0330 UC-63.
Hukka, A., and Viitanen, H. A. (1999). A mathematical model of mould growth on wooden material. Wood Sci. Technol. 33, 475–485. doi: 10.1007/s002260050131
Hutchinson, T. (2017). Cool Roofing Challenging What's Cool. Eco-Structure. Available online at: http://www.eco-structure.com/cool-roofing/challenging-whats-cool.aspx (accessed June, 2018).
Ismail, A., Samad, M. H. A., and Rahman, A. M. A. (2011). The investigation of green roof and white roof cooling potential on single storey residential building in the Malaysian climate. World Acad. Sci. Eng. Technol. Int. J. Archit. Environ. Eng. 5, 168–176. Available online at: https://waset.org/publications/3595/the-investigation-of-green-roof-and-white-roof-cooling-potential-on-single-storey-residential-building-in-the-malaysian-climate
ISO (2003). International Standard ISO15927-1:2003(E), Hygrothermal Performance of Buildings – Calculation and Presentation of Climate Data, Part 1: Monthly Means of Single Meteorological Elements, First Edition (Geneva).
Jo, J. H., Carlson, J., Golden, J. S., and Bryan, H. (2010). Sustainable urban energy: development of a mesoscale assessment model for solar reflective roof technologies. Energ Policy 38, 7951–7959. doi: 10.1016/j.enpol.2010.09.016
Knoss, T. (2018). Newly Engineered Material can Cool Roofs, Structures with Zero Energy Consumption. Available online at: https://www.colorado.edu/today/2017/02/09/newly-engineered-material-can-cool-roofs-structures-zero-energy-consumption. (accessed August, 2018).
Krarti, M., and Hajiah, A. (2011). Analysis of impact of daylight time savings on energy use of buildings in Kuwait. Energy Policy 39, 2319–2329. doi: 10.1016/j.enpol.2011.01.046
Kubota, T. (2017). A Cooling System That Works Without Electricity, Stanford University. Available online at: https://techxplore.com/news/2017-09-cooling-electricity.html. (accessed August, 2018).
Kumaran, K., Lackey, J., Normandin, N., Tariku, F., and van Reenen, D. (2002b). A Thermal and Moisture Transport Property Database for Common Building and Insulating Materials, Final Report—ASHRAE Research Project 1018-RP, 1–229.
Kumaran, K., Lackey, J., Normandin, N., van Reenen, D., and Tariku, F. (2002a). Summary Report from Task 3 of MEWS Project at the Institute for Research in Construction - Hygrothermal Properties of Several Building Materials, Research Report-IRC-RR-110, Institute for Research in Construction, National Research Council Canada, 1–73.
Kumaran, M. K. (2009). “Fundamentals of transport and storage of moisture in building materials and components (Chapter 1),” in ASTM Manual 18: Moisture Control in Buildings: The Key Factor in Mold Prevention, 2nd Edn., eds H. R. Trechsel and M. Bomberg (West Conshohocken, PA: ASTM International).
Kumaran, M. K., and Wang, J. (2002). How Well Should One Know the Hygrothermal Properties of Building Materials? A Thermal and Moisture Transport Property Database for Common Building and Insulating Materials, Appendix I, ASHRAE Research Project 1018-RP Final Report.
Lacasse, M. A., Saber, H. H., Maref, W., Ganapathy, G., Plescia, S., and Parekh, A. (2016). “Field evaluation of thermal and moisture response of highly insulated wood-frame walls,” in The 13th International Conference on Thermal Performance of the Exterior Envelopes of Whole, Buildings XIII, (Clearwater, FL).
Levinson, R., and Akbari, H. (2010). Potential benefits of cool roofs on commercial buildings: conserving energy, saving money, and reducing emission of greenhouse gases and air pollutants. Energy Efficiency 3, 53–109. doi: 10.1007/s12053-008-9038-2
Levinson, R., Akbari, H., Berdahl, P., Wood, K., Skilton, W., and Petersheim, J. (2010). A novel technique for the production of cool colored concrete tile and asphalt shingle roofing products. Sol. Energy Mater. Sol. C 94, 946–954. doi: 10.1016/j.solmat.2009.12.012
Levinson, R., Berdahl, P., Berhe, A., and Akbari, H. (2005). Effects of soiling and cleaning on the reflectance and solar heat gain of a light-colored roofing membrane. Atmos. Environ. 39, 7807–7824. doi: 10.1016/j.atmosenv.2005.08.037
Maref, W., Booth, D. G., Lacasse, M. A., and Nicholls, M. (2002a). Drying Experiment of Wood-Frame Wall Assemblies Performed in the Climatic Chamber EEEF: Specification of Equipment Used in EEEF-Environmental Exposure Envelope Facility, IRC Research Report, 1–42, (RR-105), Available online at: https://nrc-publications.canada.ca/eng/view/fulltext/?id=d0b86027-1114-4028-abe4-f1de489d2aa6 (accessed April, 2019).
Maref, W., and Lacasse, M. A. (2009). “Drying response of wood-frame construction: laboratory and modelling,” in Journal of ASTM International (JAI), 7, (1), Second Symposium on Heat-Air-Moisture Transport: Measurements and Implications in Buildings, (Vancouver, BC), 1–12.
Maref, W., Lacasse, M. A., and Booth, D. G. (2004). “Large-scale Laboratory Measurement and Benchmarking of an advanced hygrothermal Model,” in Proceeding of CIB 2004 Conference, (Toronto, ON), 1–10.
Maref, W., Lacasse, M. A., Booth, D. G., and Nicholls, M. (2002b). “Automated weighing and moisture sensor system to assess the hygrothermal response of wood sheathing and combined membrane-sheathing wall components,” in Proceedings of the 11th Symposium for Building Physics, (Dresden), 595–604.
Maref, W., Lacasse, M. A., and Krouglicof, N. (2001). “A precision weighing system for helping assess the hygrothermal response of full-scale wall assemblies,” in Proceedings of Performance of Exterior Envelopes of whole Building VIII- Integration of Building Envelopes, (Clearwater Beach, FL).
McHugh, B., and Petrick, R. (2011). “Chicago's green and garden roofing codes and technology,” in Proceedings of the 2011 International Roofing Symposium, (Washington, DC).
Ojanen, T., Viitanen, H. A., Peuhkuri, R, Lähdesmäki, K., Vinha, J., and Salminen, K. (2010). “Mold growth modeling of building structures using sensitivity classes of materials,” in 11th International Conference on Thermal Performance of the Exterior Envelopes of Whole Buildings XI (Clearwater, FL), 10.
Oleson, K. W., Bonan, G. B., and Feddema, J. (2010). Effects of white roofs on urban temperature in a global climate model. Geophys. Res. Lett. 37:L03701. doi: 10.1029/2009GL042194
Paroscientific (2014). “MET4 and MET4A Meteorological Measurement Systems,” in User Manual, DOCUMENT NO. 8008-001, REVISION E (Redmond, WA: Paroscientific, Inc). Available online at: http://paroscientific.com/pdf/8008-001_Manual_for_MET4_and_MET4A_Meteorological_Measurement_Systems.pdf
Pedersen, C. R. (1992). Prediction of moisture transfer in building constructions. J. Build. Environ. 27, 387–397. doi: 10.1016/0360-1323(92)90038-Q
Ray, S., and Glicksman, L. (2010). “Potential energy savings of various roof technologies,” in Eleventh International Conference on Thermal Performance of the Exterior Envelopes of Whole Buildings XI, (Clearwater, FL).
Saber, H. H., Lacasse, M. A., Ganapathy, G., Plescia, S., and Parekh, A. (2016). “Risk of condensation and mould growth in highly insulated wood-frame walls,” in The 13th International Conference on Thermal Performance of the Exterior Envelopes of Whole, Buildings XIII, (Clearwater, FL).
Saber, H. H., Lacasse, M. A., and Moore, T. V. (2017). “Hygrothermal performance assessment of stucco-clad wood frame walls having vented and ventilated drainage cavities,” in Advances in Hygrothermal Performance of Building Envelopes: Materials, Systems and Simulations, ASTM STP1599, ASTM International (West Conshohocken, PA), 198–231. doi: 10.1520/STP159920160100.
Saber, H. H., and Maref, W. (2015). “Risk of condensation and mould growth in wood-frame wall systems with different exterior insulations,” in Building Enclosure Science & Technology Conference (BEST4 Conference), (Kansas City, MO).
Saber, H. H., Maref, W., and Abdulghani, K. (2014). Properties and Position of Materials in the Building Envelope for Housing and Small Buildings, Report No. A1-004615.1, NRC-Construction, National Research Council of Canada. Available online at: https://www.bchousing.org/research-centre/library/building-science-reports/building-envelope-for-housing&sortType=sortByDate (accessed August, 2018).
Saber, H. H., Maref, W., Elmahdy, A. H., Swinton, M. C., and Glazer, R. (2010b). “3D thermal model for predicting the thermal resistances of spray polyurethane foam wall assemblies,” Eleventh International Conference on Thermal Performance of the Exterior Envelopes of Whole Buildings (Buildings XI Conference), (Clearwater, FL).
Saber, H. H., Maref, W., Elmahdy, A. H., Swinton, M. C., and Glazer, R. (2012b). 3D heat and air transport model for predicting the thermal resistances of insulated wall assemblies. Int. J. Build Perform Simulat. 5, 75–91. doi: 10.1080/19401493.2010.532568
Saber, H. H., Maref, W., Lacasse, M. A., Swinton, M. C., and Kumaran, M. K. (2010a). “Benchmarking of hygrothermal model against measurements of drying of full-scale wall assemblies,” in International Conference on Building Envelope Systems and Technologies, ICBEST 2010 (Vancouver, BC), 369–77.
Saber, H. H., Maref, W., and Swinton, M. C. (2011c). “Numerical investigation of thermal response of basement wall systems with low emissivity material and furred airspace,” in 13th Canadian Conference on Building Science and Technology (13th CCBST) Conference. (Winnipeg, MB), 10–13.
Saber, H. H., Maref, W., and Swinton, M. C. (2012c). Thermal response of basement wall systems with low emissivity material and furred airspace. J. Build Phys. 35, 353–371. doi: 10.1177/1744259111411652
Saber, H. H., Maref, W., Swinton, M. C., and St-Onge, C. (2011b). Thermal analysis of above-grade wall assembly with low emissivity materials and furred airspace. J. Build Environ, 46, 403–414. doi: 10.1016/j.buildenv.2011.01.009
Saber, H. H., Swinton, M. C., Kalinger, P., and Paroli, R. M. (2011a). “Hygrothermal simulations of cool reflective and conventional roofs,” in 2011 NRCA International Roofing Symposium, Emerging Technologies and Roof System Performance, (Washington, DC).
Saber, H. H., Swinton, M. C., Kalinger, P., and Paroli, R. M. (2012a). Long-term hygrothermal performance of white and black roofs in North American climates. J. Build. Environ. 50, 141–154. doi: 10.1016/j.buildenv.2011.10.022
Sanders, C. (1996). Heat, Air and Moisture Transfer Through New and Retrofitted Insulated Envelope Parts, IEA Annex 24 HAMTIE, Final Report, vol. 2, Task 2: Environmental Conditions, K.U. Leuven.
Solecki, W.D, Rosenzweig, C., Parshall, L., Pope, G., Clark, M., Cox, J., et al. (2005). Mitigation of the heat island effect in urban New Jersey. Environ. Hazard 6, 39–49. doi: 10.1016/j.hazards.2004.12.002
Suehrcke, H., Peterson, E. L., and Selby, N. (2008). Effect of roof solar reflectance on the building heat gain in a hot climate. Energy Build. 40, 2224–2235. doi: 10.1016/j.enbuild.2008.06.015
Swinbank, W. C. (1963). Long wave radiation from clear skies. Q. J. R. Meteorol. Soc. 89, 339–348. doi: 10.1002/qj.49708938105
Tariku, F., Kumaran, K., and Fazio, P. (2010). Transient model for coupled heat, air and moisture transfer through multilayered porous media. Int. J. of Heat Mass Transfer 53, 3035–3044. doi: 10.1016/j.ijheatmasstransfer.2010.03.024
Urban, B., and Roth, K. (2010). Guidelines for Selecting Cool Roofs, U.S. Department of Energy, Energy Efficiency and Renewable Energy, Building Technologies Program. Washington, DC: U.S. Department of Energy, Building Technologies Office (BTO).
Viitanen, H. A., and Ojanen, T. (2007). “Improved model to predict mould growth in building materials,” in Proceedings of Thermal Performance of the Exterior Envelopes of Whole Buildings X (Clearwater, FL), 8.
Vrachopoulos, M. G., Koukou, M. K., Stavlas, D. G., Stamatopoulos, V. N., Gonidis, A. F., and Kravvaritis, E. D. (2012). Testing reflective insulation for improvement of buildings energy efficiency. Central Eur. J. Eng. 2, 83–90. doi: 10.2478/s13531-011-0036-3
Wang, S., and Boulard, T. (2000). Predicting the microclimate in a naturally ventilated plastic house in a mediterranean climate. J. agric. Engng Res. 75, 27–38. doi: 10.1006/jaer.1999.0482
Xu, T., Sathaye, J., Akbari, H., Garg, V., and Tetali, S. (2012). Quantifying the direct benefits of cool roofs in an urban setting: reduced cooling energy use and lowered greenhouse gas emissions. Build Environ. 48, 1–6. doi: 10.1016/j.buildenv.2011.08.011
Keywords: cool roofs, green roofs, black roofs, energy savings, moisture accumulation, hygrothermal performance
Citation: Saber HH, Maref W and Hajiah AE (2019) Hygrothermal Performance of Cool Roofs Subjected to Saudi Climates. Front. Energy Res. 7:39. doi: 10.3389/fenrg.2019.00039
Received: 29 October 2018; Accepted: 25 March 2019;
Published: 12 April 2019.
Edited by:
Kaushik Biswas, Oak Ridge National Laboratory (DOE), United StatesReviewed by:
Dimitrios Kraniotis, OsloMet–Oslo Metropolitan University, NorwayFlorian Antretter, Oak Ridge National Laboratory (DOE), United States
Copyright © 2019 Saber, Maref and Hajiah. This is an open-access article distributed under the terms of the Creative Commons Attribution License (CC BY). The use, distribution or reproduction in other forums is permitted, provided the original author(s) and the copyright owner(s) are credited and that the original publication in this journal is cited, in accordance with accepted academic practice. No use, distribution or reproduction is permitted which does not comply with these terms.
*Correspondence: Wahid Maref, d2FoaWQubWFyZWZAZXRzbXRsLmNh
†Hamed H. Saber orcid.org/0000-0003-0197-1645
Wahid Maref orcid.org/0000-0002-9218-1165
Ali E. Hajiah orcid.org/0000-0001-8815-2372