- 1Department of Mechanical Engineering, Michigan Technological University, Houghton, MI, United States
- 2Convergen Energy LLC, Green Bay, WI, United States
- 3Department of Forest, Rangeland and Fire Sciences, University of Idaho, Moscow, ID, United States
Power generation facilities in the U.S. are looking for a potential renewable fuel that is sustainable, low-cost, complies with environmental regulation standards and is a drop-in fuel in the existing infrastructure. Although torrefied woody biomass, meets most of these requirements, its high cost, due to the use of woody biomass, prevented its commercialization. Industrial waste blends, which are also mostly renewable, are suitable feedstock for torrefaction, and can be an economically viable solution, thus may prolong the life of some of the existing coal power plants in the U.S. This paper focuses on the torrefaction dynamics of paper fiber-plastic waste blend of 60% fiber and 40% plastic and the characterization of its torrefied product as a function of extent of reaction (denoted by mass loss). Two forms of the blend are used, one is un-densified and the other is in the form of pellets with three times the density of the un-densified material. Torrefaction of these blends was conducted at 300°C in the mass loss range of 0-51%. The torrefied product was characterized by moisture content, grindability, particle size distribution, energy content, molecular functional structure, and chlorine content. It was shown that although torrefaction dynamics is of the two forms differs significantly from each other, their properties and composition depend on the mass loss. Fiber content was shown to decrease relative to plastic upon the extent of torrefaction. Further, the torrefied product demonstrates a similar grinding behavior to Powder River Basin (PRB) coal. Upon grinding the fiber was concentrated in the smaller size fractions, while the plastic was concentrated in the larger size fractions.
Introduction
The U.S. Environmental Protection Agency (EPA) has accelerated regulatory pressure on utilities burning pulverized coal by issuing carbon emission guidelines on June 18, 2014 (EPA, 2014). The EPA has proposed state by state goals to achieve CO2 emission reductions; 30% from the power sector as compared to CO2 emission levels in 2005 (EPA, 2015). The ultimate fate and form of the EPA proposed rule may not be known for some time until the rule-making process is complete but the past history of utility emissions regulation and Supreme Court decisions on EPA rule-making authority indicate a high probability that some form of CO2 regulation will be implemented (White, 2014). Internationally, the U.S. has announced the reduction of greenhouse gas emissions by 26–28% below 2005 levels by 2025 (Nakamura and Mufson, 2014).
Torrefied-biomass is a high-energy fuel that can be used in combustion, gasification, and pyrolysis, and is considered either fully or partially renewable and complies with the above EPA regulations (EPA, 2015). Kiel (Kiel, 2011) suggested the use of biomass for coal power plants. Potential users of torrefied biomass are suggested for refineries to produce bio-oil (Wang et al., 2016; De Rezende Pinho et al., 2017) and syngas producers (TRI, 2018). A considerable amount of studies, pilot-scale plants, patents and commercial efforts have been devoted to torrefaction and torrefied materials. The entries “torrefaction” and “torrefied” in the title, shows 790 papers, 19 reviews, and 50 patents, between 1990 and 2017. The 50 patents comprise many technologies for torrefaction, most of which are based on mechanical mixing. Although torrefaction technology is well developed, it has not yet moved to the commercial market. The consensus is that the main hindrance to the commercialization of this technology is the use of high-cost woody biomass as a feedstock (Kumar et al., 2017; Radics et al., 2017).
The use of wastes (for example, municipal solid wastes—MSW—or industrial manufacturing residuals—fiber and plastic blends) can be the answer to the deployment of this technology as tipping fees are paid for the waste destined for landfill. U.S. wastes possess substantial energy content that can be utilized for energy and power (US-EIA, 2010). Wastes, as a feedstock in torrefaction, has been suggested by Bar-Ziv and Saveliev (2013) and Bar-Ziv et al. (2016) and others, using regular torrefaction (Yuan et al., 2015), wet torrefaction (Mumin et al., 2017), and microwave torrefaction (Iroba et al., 2017a,b). Some difficulties have been recognized while using waste for torrefaction because of difficulties in conveying, pretreatment and potential emissions. Other hurdles were also identified while using waste feedstocks in torrefaction: (i) inconsistency in feedstock, (ii) possibility of high Cl, S, and N content, (iii) binders required for compaction of torrefied biomass (Bar-Ziv and Saveliev, 2013; Bar-Ziv et al., 2016), (iv) high moisture content in MSW and the like, and (v) high contaminant content that leads to emissions issues.
The EPA regulatory actions (EPA, 2014, 2015) regarding the use of alternative fuels raise the likelihood that torrefied waste will find a market to replace pulverized coal in energy production. One other recent development affecting the market for torrefied biomass from MSW was a memorandum from the EPA's Office of Air and Radiation addressing the framework for determining the carbon neutrality of biomass (McCabe, 2014).
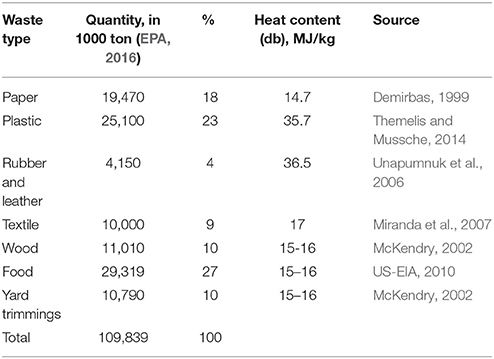
There is a significant amount of waste in the U.S., which is being disposed of in landfills, that can be used as an energy source. Table 1 summarizes the various wastes, totaling ~110,000 ton per year, as well as their calorific values. This significant amount, if torrefied, can replace coal and be considered renewable and clean fuel. From an energy perspective, except plastic wastes with very high heat content ~ 36 MJ/kg, the rest have heat values in the range 15–17 MJ/kg. The weighted average heat content in U.S. waste is ~21 MJ/kg, which is comparable to that of Powder River Basin (PRB) coal that has a heat content of ~17–19 MJ/kg (Luppens, 2011). This indicates that 1 dry ton of U.S. waste can replace 1 ton of PRB coal. With current coal consumption of ~650,000 tons/d of coal in the US (with over 50% PRB coal) (US-EIA, 2018), U.S. waste could replace well over 15% of the U.S. coal.
The present paper deals with torrefaction of certain U.S. wastes, including plastics, which can be converted into drop-in fuels as a replacement of coal in coal power plants. Specifically, the paper deals with wastes blends from paper/carton (wood fibers) and plastics. As such, the torrefied fuel should be shown to match the characteristics and properties of coals.
Materials and Methods
Materials
Convergen Energy (CE) developed a fuel engineering process: sorting and blending feedstocks of fiber and plastic, removing metal and shredding down to 25 mm by 1 mm flakes by which waste blends of fibers (from paper, label matrix residuals, and laminated non-recyclable papers/plastics and the like) and plastics, become uniform, flowable and consistent, with a bulk density in the range 200–300 kg/m3. CE also developed a pelletization process that produces pellets (12 mm OD and 50 mm long) that are rather uniform with a density of 750–800 kg/m3 and bulk density of 400–450 kg/m3. The binder for the CE palletization process was the plastic component in the blend. CE characterized their product for over 7 years with properties that showed rather consistent products. Table 2 shows average properties of waste blends of 60% fiber with 40% plastics, with standard deviations of its product over a 7-year period. As seen, the properties in Table 2 are indicative of reproducible and consistent material. This material was the feedstock in the torrefaction process, both in un-densified and densified forms.
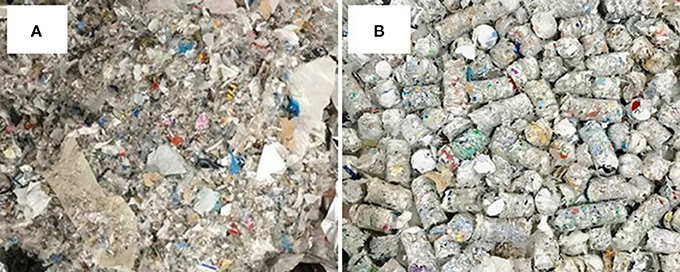
In this study, both the un-densified as well as the densified material (pellets indicated above) were used. Figure 1 shows both forms before torrefaction, used in this study: (a) un-densified CE material; and (b) CE pellets.
Waste and Product Characterization
The properties depicted in Table 2 are part of the routine characterization of CE products, both before and after pelletization. Other characterization methods are as follows. All data presented in this paper were averaged over 3–5 data points.
Grinding
Grindability is an important characteristic that has an essential impact on the applicability of torrefied material as a drop-in fuel in coal power plants. Typically, coal power plant use pulverizers of type MPS 89 (Storm, 2009), however, for the grinding tests, blade grinders (that operate at 24,000 rpm) were used. The grinding results presented in this paper are for comparison purposes. Two blade grinders were used in this study: Model CIT-FW-800 and Model CIT-FW-200. An on-line power meter—Wattsup pro was used for power vs. time measurements. Also, note that CE material was torrefied in both non-densified and densified (pellets) forms and grinding tests were carried out for both materials. Two types of grinding tests were performed as follows:
(1) A 100–200 g torrefied sample (either un-densified or pellet form) was placed in the grinder, which was continuously operated for up to 120 s time interval (to avoid damage to the motor); the power was measured continuously during the experiment. If necessary, grinding was repeated in a similar manner for a total of 1,800 s.
(2) A 100–200 g torrefied sample was placed in the grinder and operated for short time intervals – 15–30 s. After each grinding run (time interval) the pulverized material was sifted to seven sizes, in the range of 150–2,000 μm, after which all size fractions were mixed and were further pulverized for another time interval. This process was repeated until the size fractions reached asymptotic values.
In both methods, the power was measured with and without the sample in the grinder. The power without the sample was subtracted from that with the sample, which provided the net power required to grind the sample. Figure 2 shows a typical plot of power vs. time with and without a sample (in this case, 200 g of a torrefied non-densified material at 21.4% mass loss during torrefaction). Note that the startup is accompanied by an overshoot, in both cases.
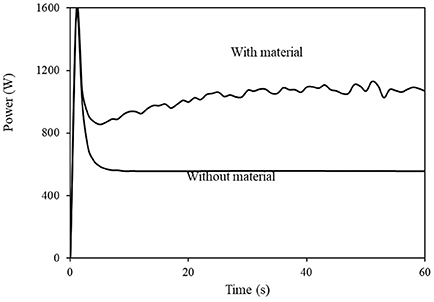
Figure 2. Examples of power vs. time traces of the grinder without material and with 200 g torrefied un-densified material.
Sifting
Sifting of the pulverized material was carried out in a W.S Tyler, RX-86 model sieve shaker. Seven size fractions were obtained with screen sizes of 75, 150, 180, 250, 425, and 850 μm. At each time interval after grinding, all the material inside the grinder was taken out and put into the shaker to sift for an hour. The weights of all the screens before and after the sifting were measured. The difference in these weights provided the sample weight of each size fractions.
Chloride and Chlorine
The chloride dissolved liquid samples from high shear mixing (described below) were diluted by a factor of hundred. Chloride was measured in this aqueous solution using Milwaukee Instruments, MI414 model Chloride Professional Photometer. Two cuvettes were used for the experiments. One is the blank sample filled with 10 ml of distilled water and another cuvette filled with 10 ml of diluted liquid sample. Then 0.5 ml of reagent-1 (Thiocyanate and Mercury) was added to both cuvettes, and after 30 s of swirling, 0.5 ml of reagent-2 (Nitric Acid) was added to both cuvettes. After another 30 s of swirling, the blank sample was first measured and zeroed, then the liquid sample was inserted in Chloride photometer which directly showed the chloride content of the liquid sample.
Total Chlorine in the solid phase was measured using the ASTM D4208-1 standard. The testing process included following key steps: The weighed solid sample was burned in a bomb filled with 2–3 MPa oxygen. After the combustion, a diluted base solution (2% Na2CO3 solution) was added to the bomb to react with the chloride product. Water was then used to wash the inside cylinder wall of the bomb. All the washings were collected in a beaker and the ionic strength was adjusted using (NaNO3 solution) (Zhu, 2014). The total chloride content of the solid material is determined by measuring the potential of the solution with a chlorine ion-selective electrode using a potentiometric titration (916 Ti-Touch) with silver nitrate solution.
Heat Content
Heat content was measured by Parr 6100 Compensated Jacket Calorimeter, where 1 g samples was placed inside sampling bowl/tray, and the sample was connected to the electric circuit using fuse string. This setup was put into a bomb and then filled with oxygen. The bomb was then put into a bucket with 2,000 ±0.5 g of distilled water. The process involved ignition of sample using an ignition circuit and subsequent measurement of temperature difference after the burning of the measured sample. The heating value was displayed by the calorimeter based on the calibration and temperature difference.
Moisture Content
Moisture content was measured using HFT-1000 moisture analyser. Around 1 g of sample was put into the analyser. After starting the analysis, the heating coil would heat up and the moisture inside the material would volatilize. The analyser would show the moisture content by measuring the difference of the weight before and after the experiment. Moisture content was measured before and after torrefaction. The values were rather consistent, before torrefaction moisture was in range 2–3% and after torrefaction, 0%.
Density Measurements
Density measurement of pellets was done using a scale (model A&D HR-60) with readability of 0.0001 g. The Archimedes' principle/buoyancy method was used for density measurement. A simple stand with suspended metal wire setup was used to dip the pellet in water. The procedure followed was as below:
1. The pellet was placed on scale and dry weight, w, was noted.
2. A beaker filled with set level of distilled water was placed on the scale and tared zero.
3. The stand and wire setup were placed next to scale such that some part of wire dipped in the water. The scaled was tared zeroed again.
4. The sample was attached to wire and the sample was dipped in water. Care was take that entire sample dipped in well and did not touch bottom of the beaker. The reading with suspended sample, ws, was noted.
5. The density was obtained by taking the ratio of suspended sample weight, ws and dry weight w.
FTIR
FTIR spectra were obtained on (i) 20 randomly selected pieces of mixed waste and (ii) screened fractions of the torrefied material (in triplicate) using a Nicolet-iS5 FTIR spectrometer, 64 scans, with an attenuated total reflectance accessory (ZnSe crystal, iD5) and data analyzed and averaged with the OMNIC v9.8 software and Aldrich, Hummel, and Nicolet spectral libraries. Carbonyl index (CI), cellulose index (CeI), and hydroxyl index (HI) were calculated as the ratio of the band intensity (absorbance) at 1,720, 1,024, and 3,342 cm−1, respectively, to the band 2,916 cm−1 for the -CH2- groups (Wei et al., 2013).
Experiments
Torrefaction
Torrefaction experiments were carried out by placing a sample, motionless, at the center of a convection furnace, Lindenberg/Blue type BF51828C-1, with flow of inert gas, either N2 or CO2 to avoid oxidation of the material. For un-densified CE material, typically samples of 150 g were placed in a thin aluminum foil at the furnace center, with residence time in the range 1–40 min. For CE pellets, sample size was ~300 g and torrefaction residence time was between 3 and 120 min.
Removal of Soluble Minerals
Soluble minerals in the torrefied material were removed by a method developed by Donepudi (Donepudi, 2017). In the present study, a 7.5 g torrefied sample was placed in a high shear mixer of Charles Ross & Son Company (Model HSM-100LSK-1) where water was added to the sample in 20:1 ratio by weight and the mixer was rotated at ~7,000 rpm for 5 min. A suspension generated was filtered by 11 μm porosity paper filter (Whatman 1001-0155 quantitative filter paper circles), followed by another filtration by 1.6 μm porosity paper filter (Whatman 1820-047 glass microfiber binder free filter). The two filtration processes produced a transparent solution with no apparent suspend particles or colloids. The aqueous solution was measured for chloride as described above.
Results
Torrefaction
As mentioned, all current torrefaction experiments were carried out by introducing un-densified material and pellets in a convective furnace at 300°C, with the initial temperature of the particle, To, at ambient temperature. The material was placed in the furnace center and was kept stationary. In this case, the particle was heated by heat transported from the hot walls at temperature (Tw) to the particle surface by convection; the heat was then transported into the particle by conduction. Numerous torrefaction experiments were carried out for pellets as well un-densified material. In both cases, the results show clear trends, with a delay in the onset of mass loss followed by an increase in the mass loss with time. The dynamic behavior in the two cases differed significantly from each other; for the un-densified material, the mass loss starts at around 3 min, whereas for the pellets, it starts at around 9 min. Further, for the un-densified material, mass loss increase with time was faster compared to pellets. This behavior was indicative to the heat-transfer-chemical-reaction system. To determine the regime that best fits the description of the system behavior, one should start with the analysis with Biot number (Bi) and thermal Thiele modulus (M); the former is related to the heating regime of the particle, and the latter relates to the propagation of the torrefaction reaction within the particle. The Bi and M, which are defined as:
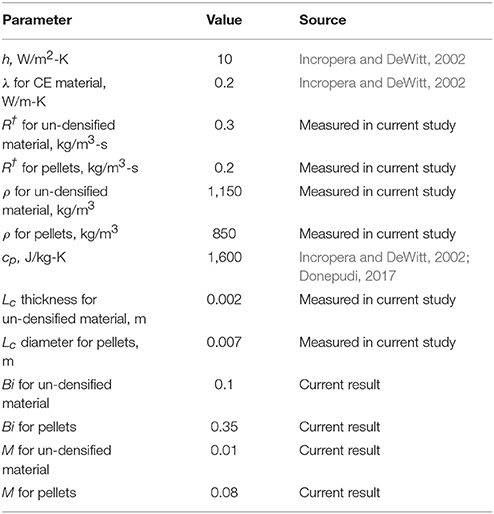
where h is the convective heat transfer coefficient, λ is the particle thermal conductivity, Lc is the particle characteristic length, R† is the torrefaction reaction rate within the particle, cp is the particle heat capacity, and ρ is particle density. The parameters required to determine Bi and M from Equations (1) and (2) are not easy to determine as the material is not well defined and therefore, can only provide an estimate. The value of heat transfer coefficient, h, was selected to be 10 (W/m2-K) and was the closest to the flow conditions prevailing in the furnace (Incropera and DeWitt, 2002). The value for thermal conductivity, λ, varies between 0.15 (W/m-K) for PVC, and 0.38 (W/m-K) for polyethylene (Incropera and DeWitt, 2002; Patterson and Miers, 2010); for biomass and fibers the values range in 0.03–0.29 (W/m-K) (Mason et al., 2016). A value of 0.2 (W/m-K) was selected which was an average of the above. Literature data on reaction rates of the material used were even more scattered than thermal conductivity, therefore they were measured by thermogravimetry in the furnace. The rate of mass loss of the CE material from both measurements at 300°C was about 0.03%/s, where the material temperature has been equal to the wall temperature (Tw); using the density of each form to obtain a value of 0.2–0.3 (kg/m3-s) for the un-densified material and 0.1–0.2 (kg/m3-s) for the pellets. In this study, the density was 1,150 (kg/m3) for the un-densified material and 850 (kg/m3) for the pellets. Heat capacity was both taken from the literature (Incropera and DeWitt, 2002) and measured to yield an acceptable value of 1,600 (J/kg-K) (Donepudi, 2017). The characteristic lengths of the two forms were measured (very accurately for the pellets and rather scattered for the un-densified material). Table 3 summarizes all properties required for the determination of Bi and M, yielding values for (i) Bi of ~0.1 for the un-densified material and ~0.35 for the pellets and (ii) M of ~0.01 for the un-densified material and ~0.08 for the pellets. The values for Bi in the range 0.1–0.35 indicate that the rate of heat transfer by convection from the furnace walls to the particle was lower than the rate of heat transfer into the particle. The values of M are in the range 0.01–0.08 which indicate that the reaction rate was significantly slower than the heat transfer into the particle, and the particles equilibrate its temperature faster than the reaction rate. This analysis indicates that the reaction propagation was controlled by the rate of heat transfer from the furnace walls to the particle surface, after which the particle temperature equilibrates instantly.
Establishing that the torrefaction reaction rate was controlled by the heat transfer from the walls to the particle surface and that the particle temperature was uniform at all times, means that the reaction propagates with the rate of ramp-up of the particle temperature. To calculate the particle temperature, the equation of the heat rate, dQ(t)/dt, from the walls to the particle surface was needed to be solved, which was equal to
where Tw and Ts(t) = T(t) are wall and particle surface (or particle) temperatures, respectively. Q(t) is the heat required to increase the particle temperature, or
where m and cp are particle mass and specific heat capacity, respectively, To is the particle core temperature, which is also equal to the initial temperature of the particle, and hr is enthalpy of reaction. It was a challenge to find values for hr as the torrefied material was not well defined, it comprises fibers (mostly cellulose) and a large variety of plastic materials. Cellulose torrefaction in the 25–300°C temperature range starts as an endothermic reaction and continues as an exothermic reaction (Bates and Ghoniem, 2013). Enthalpies of reaction for plastic in the same temperature range were always positive and vary in the range (12.55–147.86 J/kg) (Zhao et al., 2017), which is smaller than the value of cp(T-To) (~400 kJ/kg) in Equation (4). Thus, for simplification, this term was ignored. Introducing Equation (4), without hr, into Equation (3) and integration from Tw to T(t) yields
where τ is a characteristic time, defined as
For the pellets (cylinders), τcyl = dρcp/4h (d is cylinder diameter, ρ is particle density) and for the un-densified material (slab) it is τslab = dρcp/2h (d is slab thickness). Rearrangement of Equation (5) yields
T* is defined as
To model the mass loss, the torrefaction reaction rate was assumed to be represented by a first order rate, which a rather common assumption in many torrefaction studies (Lédé, 2010; Funke et al., 2017), or
where a = m/mo is ratio of mass-to-initial-mass, k is rate coefficient assumed to follow an Arrhenius behavior,
where A† is a pre-exponential factor and Ta is a characteristic temperature equals Ta = Ea/R, Ea is activation energy and R is gas constant. Introducing Equation (10) into Equation (9) and integrating yields an expression for the mass loss, 1-α, equals
The required values for determining τ, Equation (6), for each case are given in Table 3. Introducing these values in Equation (6) yields τslab = 184 (s) and τcyl = 475 (s), the subscript slab is for the un-densified material and cyl is for the pellets. Using these values, the particle temperatures were calculated and presented in Figure 3. As noted, the particle temperature in the un-densified case increases much faster than that of the pellets. Note from Figure 3 the temperature of the un-densified material reaches the wall temperature after 10 min, whereas for the pellets, it reaches the wall temperature after 30 min.
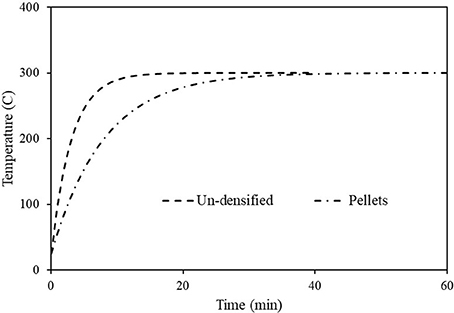
Figure 3. Temperature transient for the un-densified material and the pellets, using Equation (7) and characteristic times of 160 (s) for the former and 475 (s) for the later.
The values for (A†/ρ) and Ta were determined by fitting the model results for mass loss of Equation (11), using the temperature transients of Equation (7) (Figure 3), to the experimental results. Figure 4 shows the measured mass loss vs. time data (scattered results) and the model results using Equation (11). Clearly, the model results yielded an excellent fit to the experimental data. The fitting process yielded for the un-densified material (slab) values of (A†/ρ) slab = 1.23x10⁸ and (Ta)slab = 15,200 (K), and for the pellets (slab) values of (A†/ρ) slab = 1.08x10⁸ and (Ta)cyl = 15,800 (K). The values of A†/ρ and Ta for both forms of materials are very close to each other which is a strong indication that the model proposed here is representing the actual system behavior rather well.
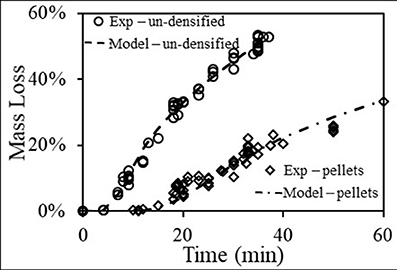
Figure 4. Experimental and modeled mass loss transients for the un-densified material and the pellets, using Equation (11), the temperature transients of Figure 3 and fitting for Ta and A†.
Grinding Energy
The method of determining the grinding behavior has been explained above, with power that was continuously measured as a function of time during grinding for a given sample weight. Numerous grinding tests were conducted, in the mass loss range 10–51%, for the two forms of torrefied materials: un-densified and pellets. All net power transient results portrayed distinct behavior that showed two characteristic time: short and much longer. Further, the net grinding power transients for all samples fitted a double exponential rise of the form:
where τ1 and τ2 are the short (1) and long (2) characteristic times, respectively, and a1 and a2 are the asymptotic values of the power for the short and long characteristic times, respectively.
Figure 5 shows typical examples of the measured (symbols) net power vs. time of two 200 g samples during grinding of torrefied CE, un-densified material and pellets and fits (dashed lines) of the net power to Equation (12). In both cases, the short characteristic time was found τ1 = 9.2 s and characteristic time τ2 = 203 s.
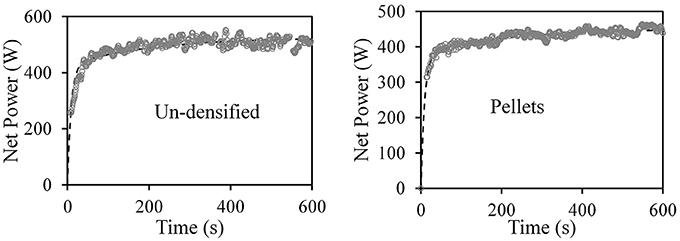
Figure 5. Symbols—measured net power vs. time of 200 g samples during grinding of torrefied CE, un-densified material and pellets. Dashed lines, fits of net power to Equation (12) for the short characteristic time, τ1 = 9.2 s; and characteristic time τ2 = 203.0 s.
All results for the torrefied samples and pellets in the range 10–51% mass loss were fitted to Equation (12) to yield: for the short characteristic time of τ1 = 9.1 ± 0.5 s, and for the long time it was τ2 = 203 ± 10 s with the respective asymptotic values of a1 = 378.1 W and a2 = 73.0 W that varied within ±5%. To demonstrate the general behavior of torrefied samples, Figure 6 shows normalized net grinding power (by the asymptotic values) vs. time for the short time range, showing clearly identical behavior for all samples tested. The dashed line in the figure is a unity line that shows the normalized asymptotic value. The fact that the grinding dynamics is characterized by two characteristic times, that significantly differ from each other, indicates clearly that there are two materials. A detailed discussion of these two materials is given in the energy content section below.
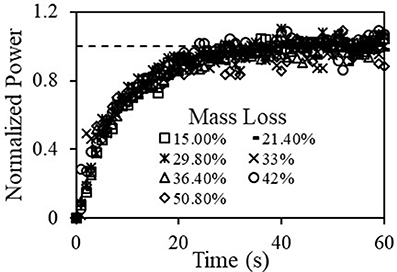
Figure 6. Normalized net grinding power vs time for torrefied material at various mass losses; with τg = 9.1 (s).
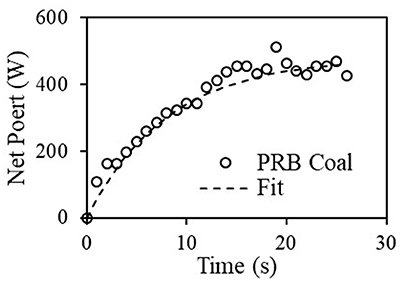
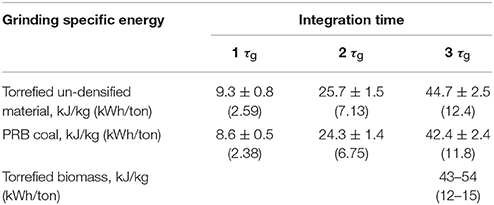
As will be shown below, most of the material was ground in the short time range, thus a characteristic grinding energy can be determined by integrating the power over a certain time, which we selected as 1 τg, 2 τg, and 3 τg (or, 8.1 s, 16.2 s, 24.3 s). Table 4 shows the values of the specific grinding energy for three characteristic grinding time, 1 τg, 2 τg, 3 τg, where τg = 8.1 (s) in kJ/kg and in commonly used kWh/ton units. As expected, the specific grinding energies increases strongly with the integration time. The values determined here are similar to values obtained in other studies at 8.23 kWh/ton (Khalsa et al., 2016). For comparison, grinding characteristics of PRB were also studied with power vs. time results for a 200 g PRB coal sample shown in Figure 7. A fit of these results with a characteristic grinding time, τg, of 8.1 was done and specific grinding energies were calculated as shown in Table 4. The values for the specific grinding energies for the torrefied (un-densified) material are within the experimental uncertainty to those of the PRB coal and smaller than the energy required to grind the torrefied biomass (Wang et al., 2017).
Sizing Distribution
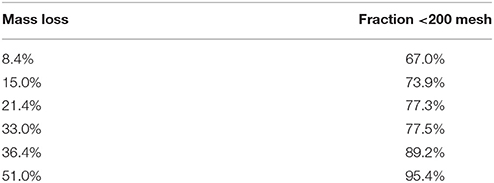
Many sifting experiments were done as a function of grinding time (or grinding energy), where the samples were sifted in size range 150 μm−3 mm in 5 size fractions: x < 150 μm, 150 < x < 250 μm, 250 < x < 425 μm, 425 < x < 850 μm, x>850 μm (x denote size). It was observed that after reaching steady state (i.e., the net grinding power reached an asymptotic value), the size distribution did not change anymore. Therefore, most of the sifting experiments were done after reaching grinding steady state. The initial sample was around 100 grams, and after grinding and sifting, there was ~1 g of sample loss during the transferring procedure, which occurred only once during the process. Therefore, loss was not more than 1%. Although there is scatter in the results, there are clear trends: the size fraction >850 μm decreased with mass loss and the size fraction < 150 μm increased with mass loss and the size fractions in between did not change much with mass loss. Therefore, the behavior in two size fractions: under and above 850 μm was further investigated. Figure 8 shows size fraction as a function of mass loss for the torrefied un-densified material and pellets for these two size fractions. It is interesting to note that for each size fraction, the dependence on mass loss is rather similar (the line is a fit to a straight line). For the size under 850 μm, its fraction starts at 82% for 4.5% mass loss and reaches almost 100% at 51% mass loss, the size fraction above 850 μm balances the smaller size fraction. Table 5 shows fraction >200 mesh of pulverized torrefied material at various mass losses. The table indicates that above 8.4% mass loss, after grinding the fraction of < 200 mesh is >70%, which is consistent with of the typical coal power plant requirements (Helble et al., 1990).
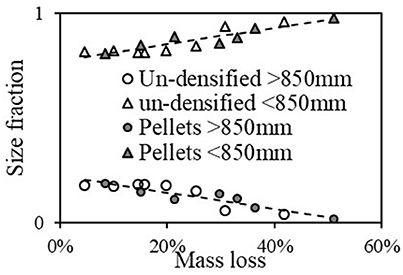
Figure 8. Size fraction for the torrefied un-densified material and pellets vs. mass loss for size fractions under and above 850 μm.
FTIR Spectroscopic Characterization
The CE waste mix plus fiber (20 random pieces selected) was analyzed by FTIR spectroscopy to determine their chemical identity with spectra library matching. The mix was shown to be comprised of three cellulose/paper, three polypropylene (PP), three polyethylene (PE), four polyethylene terephthalate (PET), silicone, three cellulose/silicone mix, two paper/acrylate mix and one nylon samples. A composite FTIR spectrum is shown in Figure 9A and shows the major bands associated with PE, PP, PET and paper. No characteristic bands at 610 cm−1 (C-Cl stretch) and 1,425 cm−1 (C-H2 bending) were observed for polyvinylchloride (Krimm, 1963).

Figure 9. FTIR spectra of (A) CE-fiber mix and ground/screened (425–850 μm) torrefied (10, 20, and 42% mass loss) densified material and (B) ground/screened (< 150 μm, 150–250 μm, 250–425 μm, 425–850 μm, and >850 μm) un-densified torrefied (30% mass loss) material.
The major chemical changes that occurred upon torrefaction on densified and un-densified material and subsequent particle screening (< 150 μm, 150 < x < 250 μm, 250 < x < 425 μm, 425 < x < 850 μm, and >850 μm) after grinding were also monitored by FTIR spectroscopy. The spectra for the ground screened 425 < x < 850 μm fraction for the densified torrefied (10, 20, and 42% mass loss) material as well as the CE-fiber mix are shown in Figure 9A. The spectra for the ground screened fractions for the un-densified torrefied (30% mass loss) material are shown in Figure 9B. Specific spectral bands can provide information on specific chemical changes that occur during thermal treatment (Balogun et al., 2017). All the samples had C-H stretching bands at assigned to methyl (2,960 and 2,870 cm−1) and methylene (2,916 and 2,850 cm−1) groups mainly associated with PP and PE plastic (Mayo, 2004a). In the ground screened torrefied material, plastic was generally concentrated in the larger sized fractions (425 < x < 850 μm and >850 μm) (Figure 9B). The O-H stretching band 3,100–3,600 cm−1 was present in all samples and progressively decreased in intensity upon the extent of torrefaction due to dehydration reactions (Wang et al., 2014; Figure 9B). A broad carbonyl (C = O) band at 1,690–1,750 cm−1 was observed and assigned to mainly an ester in linkage in PET and acrylate and an amide linkage in nylon (Mayo, 2004b). A small band at 1,505 cm−1 was assigned to lignin from paper (Faix, 1992). The spectral region between 1,000 and 1,070 cm−1 has been assigned to C–O stretching in wood cellulose and hemicellulose and decreased in intensity with torrefaction mass loss (Pandey, 1999). All samples were shown to have cis- and trans-vinylene bands at 727 and 974 cm−1, respectively (Miller, 2004).
The relative changes in carbonyl, cellulose and hydroxyl content to methylene groups (plastic) that occurred during torrefaction were examined by calculating CI, CeI and HI, respectively (Figure 10). Low values of CI, CeI and HI means that there was a higher level of polyolefin plastic in the material. The CI generally decreased for all torrefied samples with an increase in particle size (from < 150 μm to 425 < x < 850 μm), except for the >850 μm fraction (Figure 10A). For example, in the 30% mass loss torrefied material the CI decreased from 1.78 to 0.49 going from < 150 μm to >850 μm particle size. For the low to moderate level of torrefaction (8–20% mass loss) the >850 μm fraction the higher CI values could be associated with higher levels of PET plastic. Furthermore, the CI levels were also shown to decrease, associated with cleavage of the ester linkages in PET/acrylates and removal of the volatile degradation products (Çepeliogullar and Pütün, 2014), with the extent of torrefaction. Generally, for both CeI (Figure 10B) and HI (Figure 10C) decreased for all torrefied materials as screened particle size increased (< 150 to >850 μm), suggesting that the cellulose fiber was mainly in the finer screened fractions. For example, in the 30% mass loss torrefied material the CeI and HI respectively decreased from 1.21 to 0.33 and 0.29 to 0.07 going from < 150 to >850 μm particle size. Again, at low-moderate torrefaction levels (8–20% mass loss), the CeI and HI levels were high, suggesting that undegraded paper fragments were collected in the >850 μm fraction. Moreover, Both CeI and HI were shown to decrease as torrefaction severity increased. These findings support that the cellulose content decreased relative to plastic with the extent of torrefaction as a result of dehydration and degradation reactions (Wang et al., 2014).
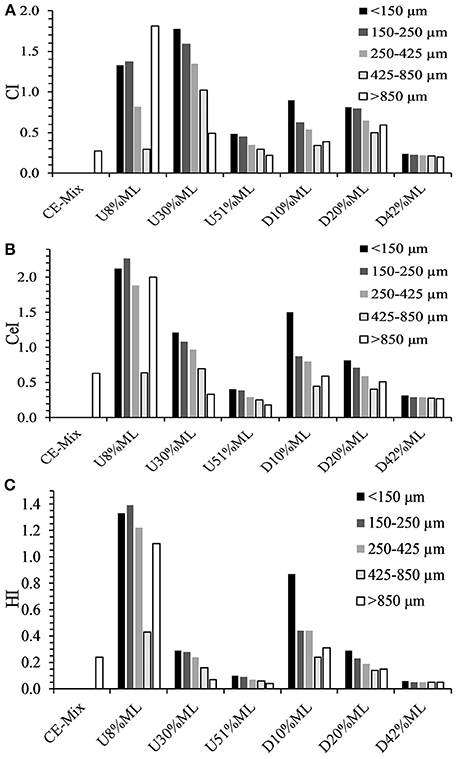
Figure 10. Plots showing changes in (A) carbonyl index (CI), (B) cellulose index (CeI), and (C) hydroxyl index (HI) for ground screened fractions (< 150 μm, 150 < x < 250 μm, 250 < x < 425 μm, 425 < x < 850 μm, and >850 μm) of torrefied densified (D) and un-densified (U) mate.
Energy Content
The energy content was originally measured for un-sifted pulverized samples; however, it was discovered that scooping a sample of 1 g for the heat content test from a 200 g of the pulverized material gave very large scatter in the measured value. This was because the pulverized material has a large size distribution (as observed above) and the scooping did not necessarily give uniform size distribution. Therefore, it was decided to measure the heat content for five size fractions: x < 150 μm, 150 < x < 250 μm, 250 < x < 425 μm, 425 < x < 850 μm, and x>850 μm separately. Although the heat content for all sifted samples in these size fractions, for the sake of brevity heat content was shown for the following consolidated fractions: x < 150 μm, 150 < x < 850 μm, x>850 μm, and the calculated total heat content (from the fraction and heat content for each fraction). Heat content results presented here are dry- ash-free basis. Figure 11 top-left is a plot of the heat content of the x < 150 μm fraction as a function of mass loss. The point at zero mass loss is the heat content of the blend prior to torrefaction and the dashed line is a linear trend line to lead the eye. Clearly, the main source of this fraction was pulp fibers that increase heat content with an increase in mass loss as predicted by Klinger et al. (Klinger et al., 2013, 2015a,b). Figure 11 top-right is a plot of the heat content of the 150 μm < x < 850 μm fraction as a function of mass loss. The heat content does not seem to change with mass loss and has an average heat content of 35 ± 3 MJ/kg; this value was lower than that of plastic and it was assumed as a combination of fiber and plastic materials. Figure 11 bottom-left is a plot of the heat content of the x>850 μm fraction as a function of mass loss. The heat content does not seem to change with mass loss and has an average heat content of 41.5 ± 3.0 MJ/kg; this value was similar to most of the plastic material (Sonawane et al., 2017) and thus was attributed as plastic. Figure 11 bottom-right is a plot of the total heat content, as calculated from all fractions, as a function of mass loss. The slope of heat content increase was identical to that of the fiber.
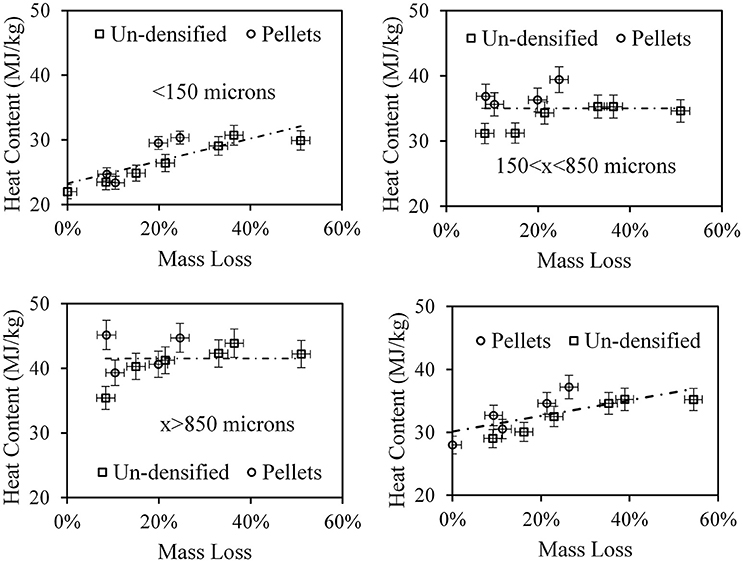
Figure 11. Top left. Heat content of the size fraction x < 150 μm. Top right, same for 150 < x < 850 μm. Bottom left. Same for x>850 μm. Bottom right. Total heat content.
Although the entire sample was pulverized, two materials (fibers and plastics) clearly retain their original structure which is indicated by the size distribution as shown above and the heat content as shown here. However, this material distinction diminishes as the torrefaction reaction proceeds (seen from the decrease of fraction x>850 μm). To further quantify this process, a plot of the contribution of the < 850 μm fraction, which is a combination of torrefied material (from fibers) and fibers and the fraction >850 μm, which was entirely from plastic. Figure 12 shows results of the contribution to the total energy from each fraction, showing that the contribution from plastics was about 20% at about 5–8% mass loss and became zero at 50% mass loss, where the plastic lost its original integrity.
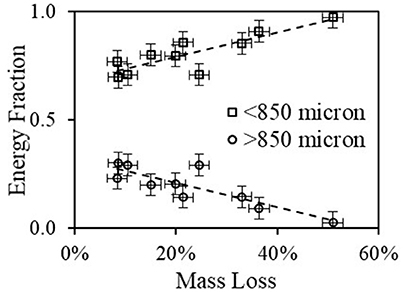
Figure 12. Energy contribution of the above and under 850 μm size fractions to the total heat content of both un-densified material and pellets as a function of mass loss.
Chlorine Removal
There was evidence that at the working temperatures of the torrefaction experiments (300°C) in this study, chlorine from the plastic materials should have been released as HCl (Saleh et al., 2014). Further, Bar-Ziv and Saveliev (2013) measured HCl in the torrefaction gas stream that was equivalent to the chlorine reduction in the solid phase. In the current study, numerous torrefaction experiments were performed as described above, and measured chlorine levels in the solid phase (see details above) with no evidence of any reduction of chlorine. This puzzling result can be explained by the way the current experiments were conducted, i.e., the sample was placed motionless. In this case, it was possible that in the time frame of the experiment, diffusion of HCl from the solid phase was so slow that it was not released during the experiment. However, in previous experiments by Bar-Ziv and Saveliev (2013), the material was torrefied in a stirred reactor (Zinchik et al., 2018) using much smaller size particles (~1 mm) than in the present study and clearly showed that HCl was released.
As mentioned, high shear experiments with the torrefied material were conducted to obtain aqueous extracts which were filtered and measured for chloride in the solution and chlorine in the solid powder. Figure 13 shows results of chlorine/chloride vs. mass loss; chlorine in solid after the high shear mixing and chloride in the filtrate (aqueous solution, adjusted for dilution). The scatter in the results was large and originate primarily from the fact that in these experiments, the samples were small (2–3 g) and the composition may differ significantly in its content and may not well represent the actual case. Nevertheless, there was a clear trend: (i) in the aqueous solution there was little-to-no chloride at zero mass loss (no torrefaction); (ii) the chloride in the aqueous solution increases gradually until ~25% mass loss, after which it stays constant at an asymptotic value of 2,043 ± 207 ppm; (iii) chlorine in the solid phase has a value of 2,031 ± 129 at zero mass loss, then decreases gradually to ~10% of the initial value.
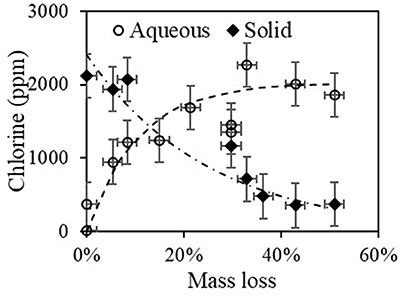
Figure 13. Chlorine in solid filtrate after high shear mixing and chloride in the aqueous solution (adjusted for dilution).
Summary and Conclusion
In the present study blends of fiber and plastic wastes at a ratio of 60:40 (fiber-to-plastic) were used as feedstock for torrefaction. Both the un-densified material and pellets were torrefied at 300°C with different time periods. It was observed that the two forms have significantly different torrefaction dynamics. Un-densified material takes less time to start torrefaction compared to the pellets, which is due to the faster heat transfer to the un-densified material. The torrefied samples were characterized by moisture content, grindability, particle size distribution, energy content, molecular functional structure, and chlorine content. It was shown that although torrefaction dynamics is of the two forms differs significantly from each other, their properties depend on the mass loss. The fiber content was shown to decrease relative to plastic with the extent of torrefaction (mass loss) as determined by FTIR spectroscopy. Further, chemical (cellulose, hydroxyl, and carbonyl) changes were also shown to progressively decrease by torrefaction mass loss. Grinding characteristics, size distribution after grinding gave similar results as a function of mass loss during torrefaction, for the forms of material. Further, the torrefied product demonstrates a similar grinding behavior to PRB coal. The heat content of the material with size x>850 μm is much higher than that of size x < 150 μm; the former attributed to the plastic material, whereas the latter was attributed to the fibers. The total heat content was shown to increase with mass loss. Chlorine in the torrefied samples was removed by a high shear mixing in aqueous solution showing that 5 min was sufficient to remove all chlorine after 30% mass loss. Overall, the waste blends studied in this paper showed that they can be used as drop-in fuel in coal power generation facilities, since this fuel is sustainable and low-cost, it also meets the environ mental regulation standard.
Author Contributions
ZX carried out torrefaction experiments and characterization for heat and moisture content, grinding and size fractions. SZ helped in all above plus carried out some of the modeling work and took part in data analysis. SK carried our chloride extraction and characterization. AM analyzed the samples by FTIR spectroscopy and contributed to the manuscript in the appropriate sections and editing. TH and DC prepared the materials, characterized them and determined chlorine content in the solid phase. EB-Z supervised the entire work, analyzed the data, carried out the modeling work and wrote most of the paper.
Conflict of Interest Statement
The authors declare that the research was conducted in the absence of any commercial or financial relationships that could be construed as a potential conflict of interest.
References
Balogun, A., Sotoudehniakarani, F., and McDonald, A. G. (2017). Thermo-kinetic, spectroscopic study of brewer's spent grains and characterization of their pyrolysis products. J. Anal. Appl. Pyrol. 127, 8–16. doi: 10.1016/j.jaap.2017.09.009.
Bar-Ziv, E., Klinger, J., Zinchik, S., and Donepudi, Y. (2016). Torrefied-Biomass from Municipal Solid Waste For Power Production. ASME-PowerEnergy 2016–59179.
Bar-Ziv, E., and Saveliev, R. (2013). Torrefied-Biomass from Municipal Solid Waste for Power Production. ASME-Power 2013–98044.
Bates, R. B., and Ghoniem, A. F. (2013). Biomass torrefaction: modeling of reaction thermochemistry. Biores. Technol. 134, 331–340. doi: 10.1016/j.biortech.2013.01.158
Çepeliogullar, O., and Pütün, A. E. (2014). A pyrolysis study for the thermal and kinetic characteristics of an agricultural waste with two different plastic wastes. Waste Manage. Res. 32, 971–979. doi: 10.1177/0734242X14542684
Demirbas, A. (1999). Physical properties of briquettes from waste paper and wheat straw mixtures. Energy Conver. Manage. 40, 437–445. doi: 10.1016/S0196-8904(98)00111-3
De Rezende Pinho, A., De Almeida, M. B., Mendes, F. L., Casavechia, L. C., Talmadge, M. S., Kinchin, C. M., et al. (2017). Fast pyrolysis oil from pinewood chips co-processing with vacuum gas oil in an FCC unit for second generation fuel production. Fuel 188, 462–473. doi: 10.1016/j.fuel.2016.10.032
Donepudi, Y. (2017). Impact of Pretreatment Methods on Fast Pyrolysis of Biomass. Houghton, MI: Michigan Technological University.
EPA (Environmental Protection Agency) (2015). Carbon Pollution Emission Guidelines for Existing Stationary Sources: Electric Utility Generation Units. EPA-HQ-OAR-2013-0602, 1560.
EPA (Environmental Protection Agency) (2014). Carbon Pollution Emission Guidelines for Existing Stationary Sources: Electric Utility Generating Units. Federal Register. Environmental Protection Agency.
EPA (Environmental Protection Agency) (2016). Assessing Trends in Material Generation, Recycling, Composting, Combustion with Energy Recovery and Landfilling in the United States. Report EPA530-R-17-01, 91 pp., Nov. 2016.
Faix, O. (1992). “Fourier transform infrared spectroscopy,” in Methods in Lignin Chemistry, eds S. Y. Lin and C. W. Dence (Berlin: Springer-Verlag), 83–132.
Funke, A., Henrich, E., Dahmen, N., and Sauer, J. (2017). Dimensional analysis of auger-type fast pyrolysis reactors. Energy Technol. 5, 119–129. doi: 10.1002/ente.201600095
Helble, J. J., Srinivasachar, S., and Boni, A. A. (1990). Factors influencing the transformation of minerals during pulverized coal combustion. Prog. Energy Combustion Sci. 16, 267–279. doi: 10.1016/0360-1285(90)90036-3
Incropera, F. P., and DeWitt, D. P. (2002). Fundamentals of Heat and Mass Transfer. New York, NY: J. Wiley.
Iroba, K. L., Baik, O. D., and Tabil, L. G. (2017a). Torrefaction of biomass from municipal solid waste fractions I: temperature profiles, moisture content, energy consumption, mass yield, and thermochemical properties. Biomass Bioenergy 105, 320–330. doi: 10.1016/j.biombioe.2017.07.009
Iroba, K. L., Baik, O. D., and Tabil, L. G. (2017b). Torrefaction of biomass from municipal solid waste fractions II: grindability characteristics, higher heating value, pelletability and moisture adsorption. Biomass Bioenergy 106, 8–20. doi: 10.1016/j.biombioe.2017.08.008
Khalsa, J., Leistner, D., Weller, N., Darvell, L. I., and Dooley, B. (2016). Torrefied biomass pellets - comparing grindability in different laboratory mills. Energies 9, 1–16. doi: 10.3390/en9100794
Kiel, J. (2011). “Torrefaction for upgrading biomass into commodity fuel,” in Status and ECN Technology Development. EUBIONET III Workshop (Espoo).
Klinger, J., Bar-Ziv, E., and Shonnard, D. (2013). Kinetic study of aspen during torrefaction. J. Anal. Appl. Pyrol. 104, 146–152. doi: 10.1016/j.jaap.2013.08.010
Klinger, J., Bar-Ziv, E., and Shonnard, D. (2015a). Unified kinetic model for torrefaction-pyrolysis. Fuel Process. Technol. 138, 175–183. doi: 10.1016/j.fuproc.2015.05.010
Klinger, J., Bar-Ziv, E., Shonnard, D., Westover, T., and Emerson, R. (2015b). Predicting properties of gas and solid streams by intrinsic kinetics of fast pyrolysis of wood. Energy Fuels 30, 318–325. doi: 10.1021/acs.energyfuels.5b01877
Krimm, S. (1963). Infrared spectra and assignments for polyvinyl chloride and deuterated analogs. J. Polymer Sci. Part A 1, 2621–1650. doi: 10.1002/pol.1963.100010809
Kumar, L., Koukoulas, A. A., Mani, S., and Satyavolu, J. (2017). Integrating torrefaction in the wood pellet industry: a critical review. Energy Fuels 31, 37–54. doi: 10.1021/acs.energyfuels.6b02803
Lédé, J. (2010). Biomass pyrolysis: comments on some sources of confusions in the definitions of temperatures and heating rates. Energies 3, 886–898. doi: 10.3390/en3040886
Luppens, J. A. (2011). A Critical Review of Published Coal Quality Data from the Southwestern Part of the Powder River Basin. Geological Survey Open-File Report, Wyoming, 2011–1148, 23.
Mason, P. E., Darvell, L. I., Jones, J. M., and Williams, A. (2016). Comparative study of the thermal conductivity of solid biomass fuels. Energy Fuels 30, 2158–2163. doi: 10.1021/acs.energyfuels.5b02261
Mayo, D. W. (2004a). “Characteristics of alkanes,” in Course Notes on the Interpretation of Infrared and Raman Spectra, eds D. W. Mayo, F. A. Miller, and R. W. Hannah (New Jersey, NY: John Wiley & Sons), 33–72.
Mayo, D. W. (2004b). “Spectra of carbonyl compounds of all kinds (Factors affecting carbonyl group frequencies,” in Course Notes on the Interpretation of Infrared and Raman Spectra, eds D. W. Mayo, F. A. Miller, and R. W. Hannah (New Jersey, NY: John Wiley & Sons), 79–204.
McCabe, J. G. (2014). Addressing Biogenic Carbon Dioxide Emissions from Stationary Sources. Washington, DC: United States Environmental Protection Agency.
McKendry, P. (2002). Energy production from biomass (part 2): conversion technologies. Biores. Technol. 83, 47–54. doi: 10.1016/S0960-8524(01)00119-5
Miller, F. A. (2004). “Characteristic frequencies of alkenes (olefins),” in Course Notes on the Interpretation of Infrared and Raman Spectra, eds D. W. Mayo, F. A. Miller, and R. W. Hannah (New Jersey, NY: John Wiley & Sons), 73–84.
Miranda, R., Sosa-Blanco, C., Bustos-Martínez, D., and Vasile, C. (2007). Pyrolysis of textile waste I. kinetics and yields. J. Anal. Appl. Pyrol. 80, 489–495. doi: 10.1016/j.jaap.2007.03.008
Mu'min, G. G., Prawisudha, P., Zaini, I. N., Aziz, M., and Pasek, A. D. (2017). Municipal solid waste processing and separation employing wet torrefaction for alternative fuel production and aluminum reclamation. Waste Manage. 67, 106–120. doi: 10.1016/j.wasman.2017.05.022
Nakamura, D., and Mufson, S. (2014). China, U.S. Agree to Limit Greenhouse Gases. The Washington Post, p. 12.
Pandey, K. K. (1999). A study of chemical structure of soft and hardwood and wood polymers by FTIR spectroscopy. J. Appl. Polym. Sci. 71, 1969–1975. doi: 10.1002/(SICI)1097-4628(19990321)71:12<1969::AID-APP6>3.0.CO;2-D
Patterson, J. E., and Miers, R. J. (2010). “The thermal conductivity of common tubing materials applied in a solar water heater collector,” in 46th ASC Annual International Conference, Wentworth Institute of Technology, ed T. Sulbaran (boston, MA).
Radics, R. I., Gonzales, R., Bilek, E. M., and Kelley, S. S. (2017). Systematic review of torrefied wood economics. BioResources 12, 6868–6886. doi: 10.15376/biores.12.3.Radics
Saleh, S. B., Flensborg, J. P., Shoulaifar, T. K., Sárossy, Z., Hansen, B. B., Egsgaard, H., et al. (2014). Release of chlorine and sulfur during biomass torrefaction and pyrolysis. Energy Fuels 28, 3738–3746. doi: 10.1021/ef4021262
Sonawane, Y. B., Shindikar, M. R., and Khaladkar, M. Y. (2017). High calorific value fuel from household plastic waste by catalytic pyrolysis. Nat. Environ. Pollut. Technol. 16, 879–882.
Themelis, N. J., and Mussche, C. (2014). Energy and Economic Value of Municipal Solid Waste (MSW), Including Non-Recycled Plastics (NRP), Currently Landfilled in the Fifty States. New York, NY: Earth Engineering Center, Columbia University.
TRI, ThermoChem Recovery International. (2018). “Reforming gasification,” 2017. Available online at: http://tri-inc.net/steam-reforming-gasification/
Unapumnuk, K., Keener, T. C., Lu, M., and Khang, S. J. (2006). Pyrolysis behavior of tire-derived fuels at different temperatures and heating rates. J. Air Waste Manage. Assoc. 56, 618–627. doi: 10.1080/10473289.2006.10464481
US-EIA (2010). U.S. Energy Information Administration, Based on U.S. Environmental Protection Agency, 2010 MSW Facts and Figures Factsheet. Associates. Available online at: https://www.eia.gov/todayinenergy/detail.php?id=8010 (Accessed Nov 11, 2018).
Wang, C., Li, M., and Fang, Y. (2016). Coprocessing of catalytic-pyrolysis-derived bio-oil with vgo in a pilot-scale FCC Riser. Ind. Eng. Chem. Res. 55, 3525–3534. doi: 10.1021/acs.iecr.5b03008
Wang, L., Barta-Rajnai, E., Skreiberg, Ø., Khalil, R. A., Czégény, Z., Jakab, E., et al. (2017). Impact of torrefaction on woody biomass properties. Energy Procedia 105, 1149–1154. doi: 10.1016/j.egypro.2017.03.486
Wang, Z., Pecha, B., Westerhof, R., Kersten, S., Li, C.-Z., McDonald, A. G., et al. (2014). Effect of cellulose crystallinity on solid/liquid phase reactions responsible for the formation of carbonaceous residues during slow pyrolysis. Ind. Eng. Chem. Res. 53, 2940–2955. doi: 10.1021/ie4014259
Wei, L., McDonald, A. G., Freitag, C., and Morrell, J. J. (2013). Effects of wood fiber esterification on properties, weatherability and biodurability of wood plastic composites. Polymer Degrad. Stability 98, 1348–1361. doi: 10.1016/j.polymdegradstab.2013.03.027
Yuan, H., Wang, Y., Kobayashi, N., Zhao, D., and Xing, S. (2015). Study of fuel properties of torrefied municipal solid waste. Energy Fuels 29, 4976–4980. doi: 10.1021/ef502277u
Zhao, W., Liu, D., and Zhang, Y. (2017). Study on the influence of pressure-assisted thermal processing on PET/PE via the change of melting enthalpy. J. Food Process. Preserv. 41:e13135. doi: 10.1111/jfpp.13135
Keywords: waste, fiber, plastic, torrefaction, grindability, energy content, chlorine content, FTIR spectroscopy
Citation: Xu Z, Zinchik S, Kolapkar SS, Bar-Ziv E, Hansen T, Conn D and McDonald AG (2018) Properties of Torrefied U.S. Waste Blends. Front. Energy Res. 6:65. doi: 10.3389/fenrg.2018.00065
Received: 12 April 2018; Accepted: 19 June 2018;
Published: 13 July 2018.
Edited by:
Allison E. Ray, Idaho National Laboratory (DOE), United StatesReviewed by:
Muhammad Aziz, Tokyo Institute of Technology, JapanMaria Puig-Arnavat, Technical University of Denmark, Denmark
Copyright © 2018 Xu, Zinchik, Kolapkar, Bar-Ziv, Hansen, Conn and McDonald. This is an open-access article distributed under the terms of the Creative Commons Attribution License (CC BY). The use, distribution or reproduction in other forums is permitted, provided the original author(s) and the copyright owner(s) are credited and that the original publication in this journal is cited, in accordance with accepted academic practice. No use, distribution or reproduction is permitted which does not comply with these terms.
*Correspondence: Ezra Bar-Ziv, ZWJhcnppdkBtdHUuZWR1
 Zhuo Xu1
 Ezra Bar-Ziv