 Vikas Agrawal
 Shikha Sharma
94% of researchers rate our articles as excellent or good
Learn more about the work of our research integrity team to safeguard the quality of each article we publish.
Find out more
ORIGINAL RESEARCH article
Front. Energy Res. , 29 May 2018
Sec. Advanced Clean Fuel Technologies
Volume 6 - 2018 | https://doi.org/10.3389/fenrg.2018.00042
It is generally accepted that in mature shales, biomarkers and pyrolysis proxies are not very helpful in understanding the source/type of organic matter (OM), paleo-redox conditions during deposition, and thermal maturity. This study was to test the efficacy of these proxies in mature Marcellus Shale (VRo > 1). Samples were collected from oil-prone (WV-7) and gas-prone (WV-6) wells in Wetzel and Monongalia Counties, West Virginia, respectively. These wells were chosen for this test study because high-resolution geochemical and isotopic studies have previously been conducted on these cores and a depositional model had been proposed. The model suggests that sediments in WV-6 well were more mature, received higher terrestrial OM influx and were deposited in less anoxic environment as compared to those in WV-7 well. We used an improved method to extract a small amount of biomarkers preserved in the samples. Further, the extracts were analyzed by a high-resolution GC × GC-FID method to quantify the distribution of aliphatic biomarkers. The hydrogen and oxygen indices (HI vs. OI plot) determined by Source Rock Analysis could not be used to determine the kerogen type due to their very low values. However, interpretations were derived from S1 vs. S2 and S2/S3 vs. TOC cross plots, thermal maturity parameter (Tmax), fraction conversion of OM to hydrocarbon (HC), and residual carbon/pyrolyzable carbon (RC/PC) ratio. The conclusions drawn from the biomarkers and SRA data are in agreement with the HC production data from these wells as well as interpretations derived from geochemical and isotopic studies conducted on these cores. Therefore, we propose that despite some limitations, biomarker and pyrolysis proxies can be used to determine the thermal and depositional history of mature shales like the Marcellus Shale.
The Middle Devonian Marcellus Shale is rapidly evolving as a major shale gas play in Northern America with an approximate aerial extent of 34,000,000 acres (Engelder and Lash, 2008), and ~15,000 MCF/day of estimated gas production (EIA, 2016). Oil shales have been estimated to contribute 32% of the world's recoverable natural gas and 10% of the world's crude oil (EIA, 2013). As a result, their exploration has increasingly become economical and profitable. However, there is a lot of spatial and temporal heterogeneity in these shale reservoirs due to variations in the source(s) of OM, thermal maturity, and the depositional environment. To precisely evaluate hydrocarbon potential and to delineate or target sweet spots for production, there is a need to better understand these spatiotemporal variations (Boyer et al., 2006). These shales could form in a wide range of sedimentary environments including lacustrine fresh/saline water, terrestrial swamps, marine evaporitic, or deltaic environments (Tourtelot, 1979; Littke, 2006). The organic geochemical analysis can help infer the quantities of expected oil and gas production in a basin and its relation to OM source/type and thermal maturity (Hunt, 1979, 1996; Jarvie et al., 2007; Horsfield and Schulz, 2012; Romero and Philp, 2012). Further, compositional characteristics of the OM can provide valuable information about the changes in depositional environments during sedimentation (Romero and Philp, 2012; Agrawal and Sharma, 2018). The organic geochemical analysis also helps in distinguishing oil and gas derived from different OM sources and depositional environments (Meyers, 1997). However, the role of organic geochemistry in the petroleum industry remains underestimated for mature shales.
Open-system pyrolysis of shales using Source Rock Analyzer (SRA) is one of the primary method that is used to distinguish sources of OM and the depositional environment of petroleum systems (Lafargue et al., 1998). In the pyrolysis technique, total evolved HC can be monitored as a function of temperature by steady heating of rock samples (Lafargue et al., 1998; Behar et al., 2001). However, this method has limited applicability in high maturity rocks, primarily because the traditional HI vs. OI plots used to identify sources of OM and kerogen (such as van Krevelen diagram) cannot be used due to very low HI and OI values.
The preserved remnants of biomolecules also known as “Biomarkers” have characteristic chemical structures that closely resemble the biological precursor molecules at the time of deposition and have been proven to be valuable in petroleum geology (Peter and Moldowan, 1993; Peters et al., 2005). Biomarkers can also provide valuable clues about paleoenvironmental conditions, effects of maturity, and biodegradation of rock sediments (e.g., Philp, 1985; Peter and Moldowan, 1993; Peters et al., 2005; Olcott, 2007). Biomarker analysis has been used to decipher depositional conditions of the sources of oil and gas reserves (e.g., Forster et al., 2004; Peters et al., 2005; Kroon, 2011). However, a majority of the studies on black shales have been conducted on lower maturity shale samples primarily because of low abundance and low extraction efficiency of biomarkers in mature shales.
The primary goal of this study was to test the power and limitations of SRA analysis, and biomarkers to understand the source of OM, environmental conditions of deposition, and thermal history of mature shale samples. The samples were collected from two mature Marcellus Shale well cores, an oil-prone WV-7 well with VRo between 1 and 1.5 in Wetzel County and a gas-prone WV-6 well in Monongalia County with VRo >2.5 (Zagorski et al., 2012). The geochemical and isotopic characteristics of these two cores were extensively studied by Chen et al. (2015), and authors proposed that the sediments in the gas-prone well WV-6 were deposited under alternating redox conditions close to ocean margin and received a greater influx of terrestrial OM. On the other hand, WV-7 sediments were deposited in a more distal anoxic environment dominated by marine OM influx (Chen et al., 2015). For this study, SRA and biomarker analysis was conducted on samples collected from the same two well cores, i.e., WV-6 and WV-7. Our aim was to test if the SRA and biomarker data supports the inferences drawn by Chen et al. (2015) and to verify if these proxies provide meaningful interpretations for mature shales with VRo > 1. To our knowledge, this would be the first attempt to use biomarkers in conjunction SRA analysis to assess maturity, depositional environment, and source of organic matter in the mature shales like Marcellus.
Marcellus Shale contains two shale members: lower Marcellus (Union Spring Shale) and upper Marcellus (Oatka Creek shale). These two members are divided by Purcell/Cherry Valley limestone (Werne et al., 2002; Sageman et al., 2003). However, other workers consider Purcell and Cherry Valley limestone to be the same unit (Lash and Engelder, 2008, 2011). For this study, samples were collected from cores obtained from two wells. The WV-6 core was collected from a gas-prone well in Monongalia County and WV-7 core from an oil-prone well in Wetzel County (location of wells shown in Figure 1). Both the cores were stored under room temperature conditions at the West Virginia Geological and Economic Survey, Morgantown, West Virginia. The majority of samples from lowermost shale interval for both WV-6 and WV-7 wells have high TOC values (>5%), whereas the majority of the samples in the overlying shale interval have relatively lower TOC values (<5%) (Chen et al., 2015). Simplified nomenclature of Chen et al. (2015) was followed in this study where the lowermost Marcellus formation is defined as organic-rich (OR) zone and the overlying zone with lower TOC as organic intermediate (OI) zone (Figure 1). For the SRA analysis, samples were collected at ~1 m intervals from both OI zones and OR zones in WV-6 and WV-7 cores. For biomarker analysis, one sample was selected from OR zone and another sample from OI zone from both the WV-6 and WV-7 wells (4 samples in total) (as shown in Figure 1). To avoid possible effects of contamination related to contact with drilling fluids and oxidation of OM (Martínez and Escobar, 1995; Elie et al., 2000) at least 5 mm of the outer layer of samples was pared. It is highly unlikely for fluids or air to penetrate >5 mm of shale layer and contaminate/oxidize the inner part of the core. After paring, the inner portion was crushed to 200 mesh and homogenized using a sterile SPEX mixer mill and oven dried for 24 h at 50°C.
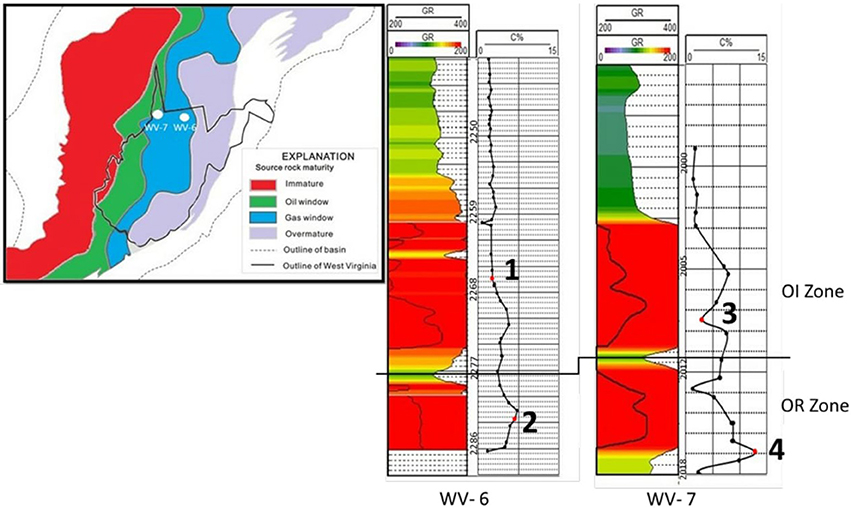
Figure 1. Samples for biomarker analysis are marked in red. Samples marked as 1, 3 are from OI (organic intermediate) zone while 2 and 4 are from OR (organic rich) zone. Samples marked by black dots in both zones were collected at approximately at 1 meter intervals for SRA analysis. This figure is modified from Chen et al. (2015).
Eighty milligrams of pulverized shale sample was weighed into an SRA crucible and placed in the autosampler and held isothermally at 300°C for 3 min. To minimize the effect of grain size, care was taken to keep the grain size of all the samples to be consistent (200 mesh). During this isothermal heating, the free hydrocarbons are volatilized and detected by the FID detector where they are quantitatively detected and reported as milligrams (mg) of S1 per gram of rock. The free CO2 is simultaneously liberated and detected by the IR cell and reported as milligrams (mg) of S3 per gram of rock up to 400°C. After the isothermal period, the temperature is increased at the rate of 25°C/min until the temperature reaches to 600°C. Between 300 and 600°C, HCs are generated from the pyrolytic degradation of the kerogen in the shale. The hydrocarbons that are detected by the FID are labeled as S2 and reported as milligrams (mg) of S2 per gram of rock. The temperature at the maximum generation of S2 is known as Tmax. Tmax is generally used to estimate thermal maturity of shales. However, for lower values of S2, Tmax is not reliable (Peters, 1986). Therefore, Tmax for samples with S2 values < 0.5 mg HC/g rock is not reported. Residual carbon is also measured by SRA and is reported as S4. To measure the reliability of data especially for over-mature shale sample, sample with low S1, S2, S3 values (values < 0.5 HC/g rock) was measured in quadruplicates. The standard deviation of the SRA parameters S1, S2, and S3 was measured to be < 0.05 mg/g rock, indicating that these parameters are reliable for samples having a low amount of HCs. WFT Source Rock Standard 533 (P/N 810-141) was used as a standard and was run after every five sample. SRA analysis was performed at the National Energy Technology Laboratory in Morgantown.
From the SRA analysis, S1, S2, S3, S4, and thermal maturity parameter (Tmax temperature at which maximum amount release of hydrocarbon takes place) were obtained (Table 1). Using these basic measurements, several other parameters were calculated for the samples as follows (Table 1):
TOC= 0.1 × [0.082× (S1 + S2) + S4], in wt %
Hydrogen Index (HI) = [(S2/TOC) × 100]. The ratio of S2 hydrogen (in mg HC/g rock) to total organic carbon (TOC).
Oxygen Index (OI) = [(S3/TOC)] × 100. The ratio of S3 (mg CO2/g rock) to TOC
Production Index (PI) = [S1/(S 1 + S 2)]. The production index is the ratio of already generated hydrocarbon to potential HC from kerogen cracking.
Pyrolyzable Carbon (PC) = [0.083 × (S1 + S2)]. It corresponds to the carbon content of HC volatilized and pyrolyzed during the SRA analysis.
Residual Carbon (RC) = [TOC – PC] × 10. This is the portion of kerogen with no HC generation potential.
Calculated Vitrinite reflectance (VRo) = 0.018 × Tmax – 7.16 (Jarvie and Lundell, 1991)
Fraction conversion to HC (f)
where HI0 and PI0 are hydrogen index and production index of immature samples (Peters et al., 2005). HI0 obtained for immature Marcellus Shale ranges from 250 to 400 mg HC/g rock (Bruner and Smosna, 2011). So, the value of HI0 should be at least 250 mg HC/g rock. Hence, this value is assumed for the calculations, whereas PI0 can be assumed to be 0.02 for the most immature source rocks (Peters et al., 2005). Using the parameters obtained from SRA and the parameters calculated above, several plots were made to determine the source, type, HC generation potential, quality of kerogen for HC generation, redox conditions of formation, and thermal maturity.
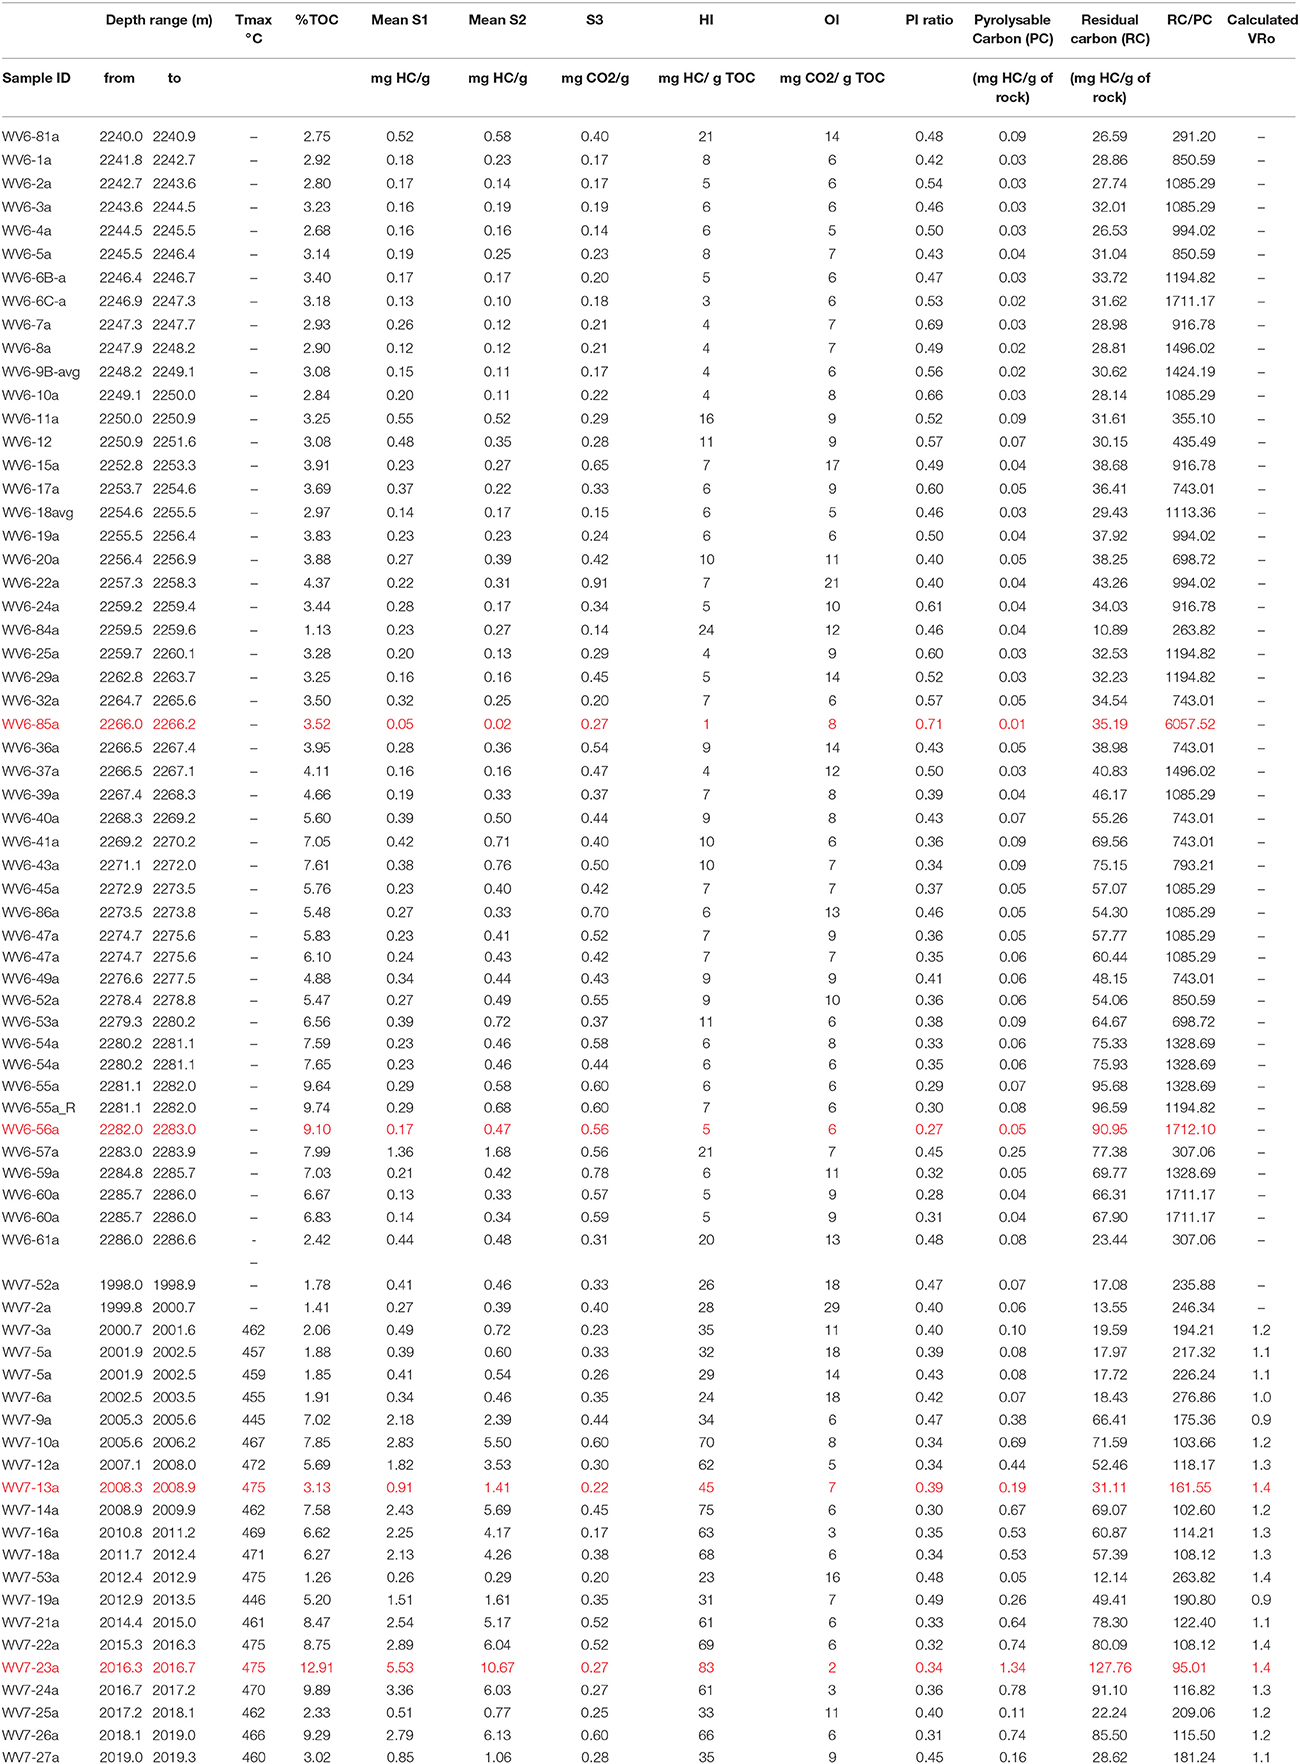
Table 1. Sample depths and parameters calculated from Source rock analyzer (SRA).
The abundance of biomarkers in mature shales (VRo > 1) is very low and significant amount of biomarkers are also bound to the mineral matrix of shales (Sherman et al., 2007). Therefore, for this study, we modified the common extraction methods (e.g., Brocks et al., 2003; Forster et al., 2004) to enhance the recovery of biomarkers bound in a mineral matrix. About 50 g of crushed and homogenized shale samples were extracted by sonication using 100 ml of dichloromethane (DCM) for 30 min. This step was repeated twice to enhance recovery. Shale residue was then treated with HCl and HF, respectively, to dissolve carbonate and silicate minerals. Shale residue was treated again with 50 ml of DCM and sonicated for 30 min to remove carbonate-bound and silicate-bound biomarkers. Both the DCM extracts were mixed and free sulfur present in the extracts was removed by adding 5 g of activated copper pellets. The extracts were filtered and blow dried using N2 blowdown method. Then, 25 ml of pentane was added to precipitate asphaltene present in the extracts. The extracts were then filtered and dried under N2 blowdown. The dried extracts were redissolved in 2 ml of DCM, and the aliphatic fraction was separated using silicic acid column chromatography. The aliphatic fraction was separated by passing the extract through 8 cm silica gel column and eluting with hexane. The extraction procedure was adopted and modified from Sherman et al. (2007).
The aliphatic fraction of the biomarkers was analyzed using a 2-dimensional gas chromatography-gas chromatography-flame ionization detector (GC × GC-FID) at Woods Hole Oceanographic Institute (WHOI). Multi-dimensional GC × GC analysis was used for this study because it provides higher resolution and sensitivity due to the re-concentration of the fraction through the modulation process. This allows the detection of biomarkers present in trace concentrations and separation of related compounds in other dimension (Adahchour et al., 2008). This type of high-resolution analysis is not possible using conventional GC techniques.
Leco GC × GC-FID used for the biomarker analysis was equipped with an Agilent 6890 GC configured with a split/splitless auto-injector (7683 series) and a dual-stage cryogenic modulator (Leco, Saint Joseph, Michigan). Samples were injected in splitless mode (inlet temperature was 310°C) and modulated with a cold and hot jet. The cold jet gas was dry N2 and chilled with liquid N2. The hot jet gas was compressed air and the temperature offset between the main oven and the hot jet was 15°C. Two capillary GC columns were installed in the GC × GC instrument. The first-dimension column was a non-polar Restek Rxi-1 ms (60 m length, 0.25 mm I.D., 0.25-μm film thickness) and the second-dimension separations were performed on a 50% phenyl polysilphenylene-siloxane column (SGE BPX50, 1.5 m length, 0.10 mm I.D., 0.1-μm film thickness).
The temperature program of the main oven remained isothermal at 40°C (10 min) and was then ramped from 40 to 335°C at 1.25°C min−1. The hot jet pulse width was 0.75 s and the modulation period was 6 s with a 2.25 s cooling period between stages. The second-dimension oven was programmed from 45°C (10 min) to 340°C at 1.25°C min−1. FID detector data was sampled at an acquisition rate of 100 Hz. A 750-s data acquisition delay (solvent delay) was programmed into the method of each GC × GC chromatogram. For quantification and comparison of the biomarkers, two external standards from National Institute of Standards & Technology Standard Reference Materials (SRM-2779 Gulf of Mexico Crude Oil and SRM-1582 Petroleum Crude Oil) were injected at a concentration of 10 mg/ml. Each chromatogram was then normalized to the largest component in the mixture. The standard deviation of the analysis of the standards was 8.33%.
Sediment core values for free or thermo-labile hydrocarbons (S1) for WV 6 ranged between 0.05 and 1.36 mg HC/g rock while the bound HC released (S2) ranged from 0.02 to 1.68 mg HC /g rock (Table 1). The range of S1 and S2 did not change significantly for the OR and OI zone. The minimum values of S1 and S2 were in OI zone, and the maximum values were in OR zone. For the WV-7 core, the values of S1 and S2 were comparatively higher, ranging between 0.26 and 5.53 mg HC/g rock and 0.29–10.67 mg HC/g rock (Table 1). The S1 and S2 values were also lower for the OI zone and higher for the OR zone. The average values of S1 and S2 for WV-7 samples was much higher when compared to those of WV-6 samples (Figure 2).
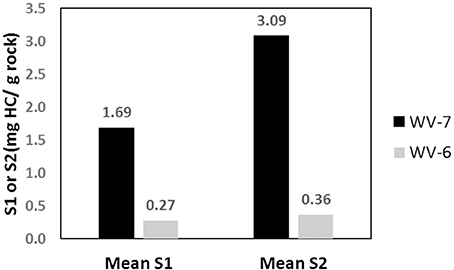
Figure 2. Average S1 and S2 values of WV-6 and WV-7 shale samples.
Based on the TOC data, two samples were selected from the OI and OR zone from both WV-6 and WV-7 cores. Samples were analyzed to identify and quantify the composition of different aliphatic biomarkers present. The biomarkers identified in OI zone of WV-6 include n-alkanes ranging from n-14 to n-33, pristane (Pr), phytane (Py), diasteranes (DiaC27βα-20S,DiaC27βα-20R), steranes (C27αββ-20S, C27ααα-20R, C28αββ-20R, C28αββ-20R, C28αββ-20S, C28ααα-20R, C29ααα-20S, C29αββ-20R, C29αββ-20S, C29ααα-20R), and hopanes [Ts, Tm, NH, C29-Ts 17a(H),21B(H)-hopane, HH(S), HH(R), 2HH(S), 2HH(R)]. The OI zone of the WV-7 core was composed primarily of n-11 to n-30 n-alkanes and biomarkers Pr, Py, diasteranes, steranes, or hopanes, which were detectable but not quantifiable due to extremely low concentrations. The distribution of n-alkanes for OI zone for both cores is shown in Figure 3A. The n-alkane distribution shows that OI zone of WV-7 core sediments had a higher concentration of shorter chain n-alkanes and lower concentration of higher chain n-alkanes as compared to OI zone of the WV-6 core (Figure 3A). On the other hand, n-alkane distribution in OR zone ranged from n-14 to n-33 for both WV-6 and WV-7 core sediment samples. However, OR zone of WV-6 core sediments had higher concentrations of higher chain n-alkanes and lower concentration of shorter chain n-alkanes when compared to those OR zone of WV-7 sediment cores (Figure 3B). Both also showed the presence of biomarkers Pr, Py and hopanes [Ts, Tm, NH, C29-Ts, H, HH(S), HH(R), 2HH(S), 2HH(R)] and an unquantifiable amount of sterane and diasterane isomers.
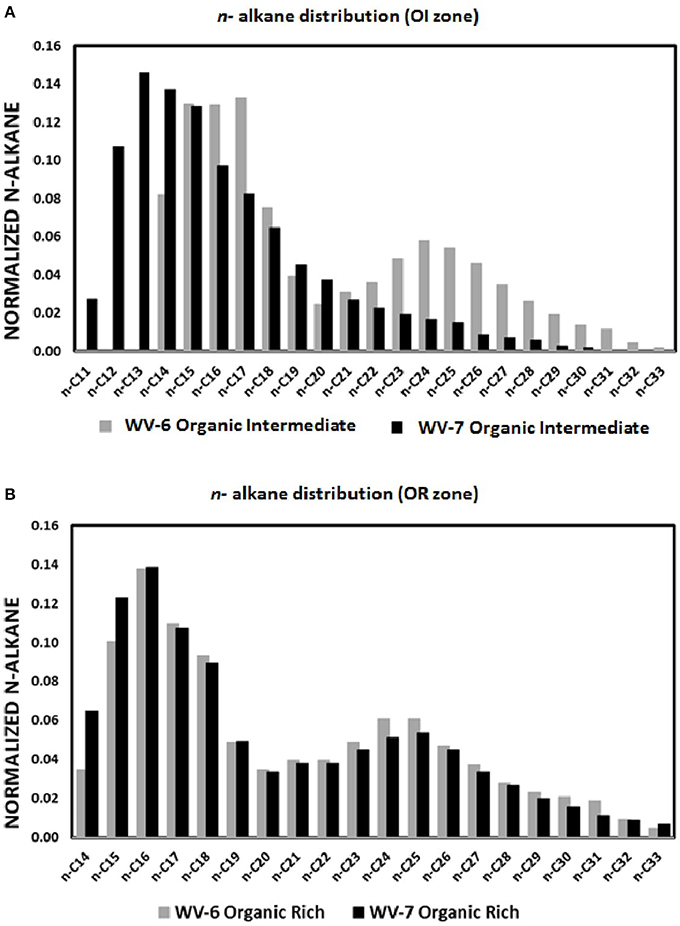
Figure 3. Graphs depicting normalized n-alkane distribution in the shale samples collected from the organic intermediate (OI) (A) and organic rich (OR) (B) zones of wells WV-6 and WV-7. The normalized value of each normalized n alkane biomarker is calculated by dividing concentration of that particular n-alkane with the total concentration of n-alkane biomarkers.
Biomarker distribution of WV-6 core sediments shows a depletion of shorter chain n-alkanes and an enrichment of higher chain n-alkanes from both OR zone and OI zone. The relative concentration of total n-alkane also decreases and is accompanied by an increase in the concentration of pristane, phytane, steranes, and hopane biomarkers. For WV-7 core, a similar trend for n-alkane distribution is observed. Although the relative concentration of total n-alkanes increases in OI of WV-7 core sediments, the pristane, phytane, steranes, diasteranes, or hopane biomarkers were not detected. To determine the relative contribution of marine and terrestrial OM, terrigenous to aquatic ratio [TAR = (nC27+nC29+nC31)/(nC15+nC17+nC19)] were calculated using the n-alkane distribution (Peters et al., 2005).
It is necessary to understand the impact of different OM sources, maturity, and biodegradation on both the elemental, bulk, as well as the principal biomarker properties before biomarkers can be used to assess depositional environmental conditions. When OM from different sources is exposed to increasing pressure and temperature, they expel hydrocarbons that are directly related to the chemistry of the original OM. Therefore, OM analysis can serve as a vital tool for understanding petroleum generation potential as well as the thermal maturity (Langford and Blanc-Valleron, 1990). In this study, molecular properties are considered to be dependent both on maturity and OM source. Pyrolysis method that involves the thermal degradation of OM with sequential heating is considered to be a standard method for characterizing and evaluating source rocks (Hunt et al., 2002). The quantitative peaks generated from pyrolysis by hydrocarbon per gram of rock depends on the chemical components of the rocks like carbohydrates, proteins, and lignins. Marine sources such as phytoplanktons, zooplanktons, bacteria, and algae have a higher amount of proteins and lipid biomolecules, whereas terrestrial sources are rich in carbohydrates and lignin. Proteins and lignin biomolecules contain higher aliphatic carbon chains and lower concentrations of carbon–oxygen bonds in their structure as compared to carbohydrates and lignin. Therefore, H/C ratio of marine OM (Type I kerogen) is higher than terrestrial OM (Type III kerogen), whereas O/C ratio is higher for terrestrial OM and lower for marine OM. The H/C and O/C ratios for different types of kerogen are: H/C ~1.5 and O/C < 0.1 (Type I), H/C ~ 1.2–1.5 and O/C ratio between 0.1 and 0.3 (Type II), and Type III kerogen has H/C < 1.0 and O/C ~0.3 (Van Krevelen, 1961; Peter and Moldowan, 1993). For each type of kerogen, atomic ratios H/C and O/C decrease on increasing maturity due to the removal of aliphatic chains (composed of CH2 bonds) and oxygen-rich compounds such as asphaltene and resins on increasing maturation (Hunt, 1996). The H/C and O/C ratios and their “evolution path” with increasing maturation are used to classify different types of kerogen in the van Krevelen diagram. The HI and OI indices calculated from S2 and S3 peaks of SRA are analogous to H/C and O/C atomic ratios of source rocks (Tissot and Welte, 1978) and can be used to determine the kerogen type. However, in our samples due to high maturity, the HI and OI values for both WV-6 and WV-7 cores are very low and fall in the common range of all types of kerogen (Figure 4) in the van Krevelen diagram (Van Krevelen, 1961), limiting the applicability of this plot to determine kerogen type.
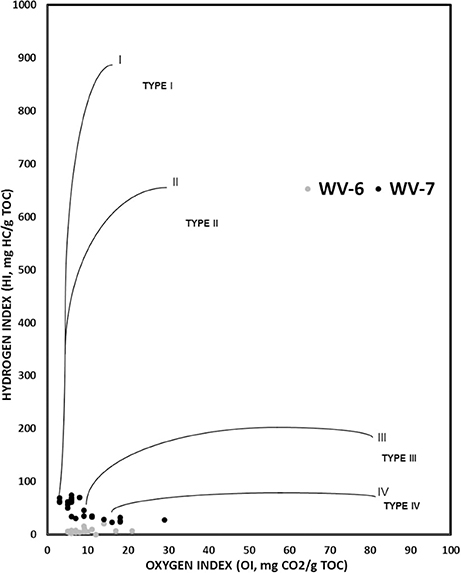
Figure 4. Van-krevelen diagram for WV-6 and WV-7 samples.
However, individual parameters determined from SRA analysis can still provide some useful insight on sources of organic matter. The amount of free HC (S1) and kerogen-bound HC (S2) depends on the type of source of OM and thermal maturity. If the source of OM is constant the relative fraction of free (S1) and bound (S2) HC remains similar, unless the thermal stress regime changes. Therefore, the constant source will give a positive correlation between S1 and S2 values (Dayal et al., 2014).
From the SRA data, a significant linear correlation (R2 = 0.94) is obtained between S1 and S2 values for the WV-7 cores (Figure 5A). Using this observation, it can be inferred that the same source of OM was dominant during the deposition of the WV-7 sediments. A relatively poor correlation between S1 and S2 values for WV-6 core sediments (R2 = 0.44; Figure 5B) indicates that probably more than one dominant source of OM was prevalent during the deposition of WV-6 sediments. The poor correlation can also be indicative of surficial contamination of shale samples or due to sample degradation associated with long-term storage of the core. Since the samples were taken from the inner portion of both cores and cores were stored under similar conditions, it is less likely that the difference observed is related to contamination and/or storage-related issues. It can be inferred that probably WV-6 was deposited more toward basin margin, and therefore, it received a higher influx of mixed OM from both marine and the terrestrial origin, and hence, it is more gas prone. The isotopic and geochemical proxies also support this conclusion (Chen et al., 2015). Additionally, terrestrially derived OM contains more amount of oxygen as compared to the amount in marine-derived OM. So, OM that has more terrestrial input will give a larger S3 peak and a lower S2/S3 ratio. In the S2/S3 vs. TOC plots, it can be noted that for the same amount of TOC WV-6 samples consistently have much lower S2/S3 ratios as compared to WV-7. This further supports the conclusion that WV-7 had less influx of terrestrial OM as compared to WV-6 (Figure 6).
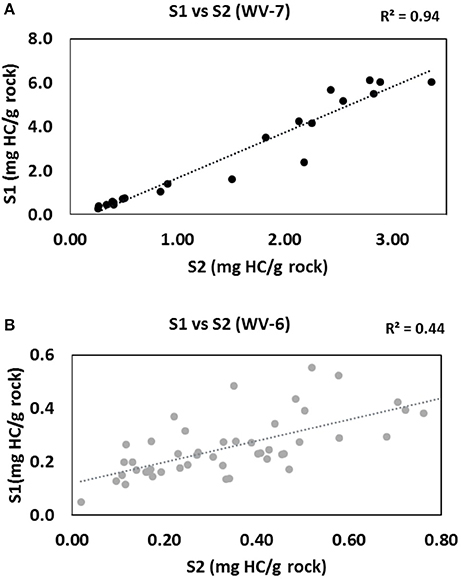
Figure 5. The S1 vs. S2 plots for (A) WV-7 and (B) WV-6 samples.
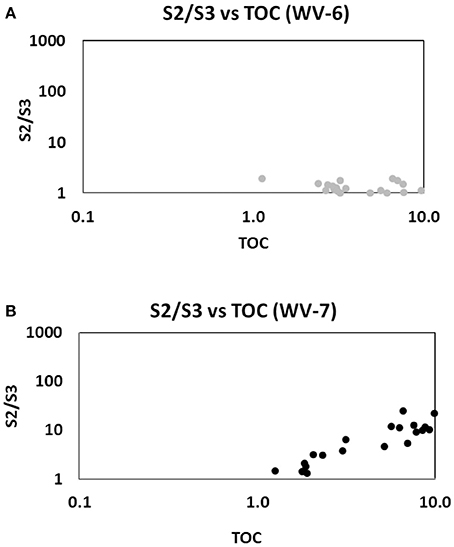
Figure 6. The S2/S3 vs. TOC plots for (A) WV-6 and (B) WV-7 samples.
For any particular OM, at any particular maturity, the ratio between kerogen-bound HC (S2) and TOC should remain constant. Hence, to determine the type of HC produced, S2 vs. TOC plots (Figure 7) can also be used (Dahl et al., 2004). In this plot, WV-7 lies in the wet gas prone region and WV-6 lies in the dry gas prone region (Figure 7). These plots also support the argument that WV-7 had a lower influx of gas prone terrestrial OM as compared to WV-6. Additionally, the lower R2 (0.54) values for WV-6 samples as compared to WV-7 samples (R2 = 0.92) also provide evidence that WV-6 samples received mixed sources of OM during deposition.
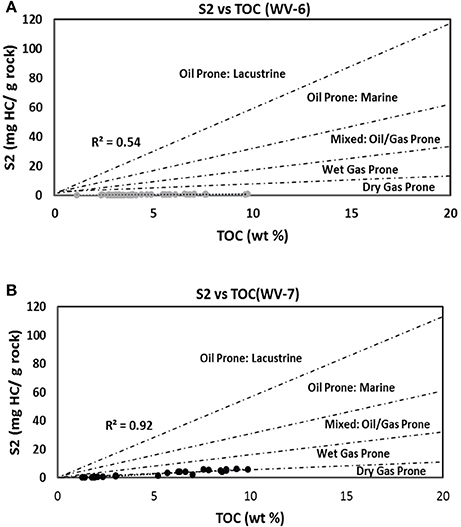
Figure 7. The S2 vs. TOC plots for (A) WV-6 and (B) WV-7 samples.
Different types of OM contain different amount/type of biomolecules and have a different distribution of n-alkanes. Thus, the relative distribution of n-alkanes has also been used to determine the sources of OM in shales (Cranwell, 1982; Meyers, 1997; Peters et al., 2005). The majority of n-alkanes contributed by marine OM sources such as bacterial and algal OM possess shorter chains mainly at C-15, C-17, and C19, while terrestrial OM sources possess odd-numbered long-chain n-alkanes predominantly at C-23, C-25, C-27, C-31, and C-33 (Clark and Blumer, 1967; Cranwell, 1973; Ahad et al., 2011). The longer chains of n-alkanes are primarily associated with the waxy protective coatings of the leaf cuticles that protect them from infection, damage, and desiccation (Eglinton and Hamilton, 1967). Marine organisms such as bacteria and algae do not have this protective coating, and hence, they do not contain long-chain n-alkanes.
The presence of higher short-chain n-alkanes in WV-7 when compared to those of WV-6 in both OI zone and OR zone further indicates that WV-7 shales were deposited in a more marine geological setting and the major influx of OM was from marine organisms such as algae or cyanobacteria (Figures 3A,B). Concentrations and ratios of pristanes (Pr) and phytanes (Py) were also used as additional proxies to determine the source of OM and redox conditions. Phytanic acid, which is the precursor of pristane, is formed by aerobic degradation of chlorophyll. Since aerobic degradation is favorable in regions closer to land, greater production of pristane takes place, and a higher Pr/Py ratio is generally observed in terrestrial settings (Powell and Mckirdy, 1973; Peters et al., 2005), which is determined by the ratios of Pr/Py in marine and terrestrial sources of OM. Pr/Py ratios less than 1 indicate a marine-sourced organic matter deposited in an anoxic environment and Pr/Py ratios >3 indicate terrigenous organic matter input deposited in an alternating anoxic–oxic environments (Didyk et al., 1978; Peters et al., 2005). Due to the absence of Pr, Py, and n-31 in the OI zone of WV-7, these comparisons are based on the data obtained from the OR zone only. The Pr/Py ratio in the OR zone of WV-6 and WV-7 are 1.65 and 1.33, respectively (Table 2). This indicates that both sites were primarily dominated by a contribution from marine OM sources deposited in an anoxic–suboxic environment in the OR zone. However, the higher Pr/Py ratio in WV-6, when compared to that in WV-7, indicates that it was probably deposited in relatively more oxic or shallower part of the marine basin as compared to WV 7. The n-alkane distribution also suggests that WV-6 had a higher influx of terrestrial OM.
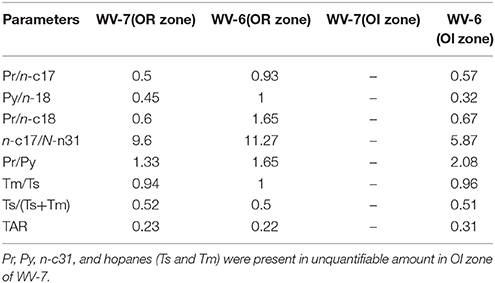
Table 2. The biomarker ratios calculated from samples collected from OR and OI zone in WV-6 and WV-7.
Pr/n-C17 vs. Py/n-C18 plot has been used extensively by researchers (for e.g., Peters et al., 2005; Adegoke et al., 2014; Song et al., 2014) to determine types of kerogen and redox conditions of deposition. Pr/n-c17 and Py/ n-c18 ratios in the plot lie inside or on the boundary of Type II-III kerogen field (Figure 8) indicating that both sites received mixed sources of OM. It also indicates that OI zone of WV-6 shale cores might have received higher terrestrial influx and was deposited in a more oxidizing environment as compared to OR zone. Using both SRA and biomarker proxies, it can be interpreted that both cores had mixed sources of OM with WV-6 having higher terrestrial matter influx, making it more gas prone. This, in conjunction with all other parameters discussed above, clearly supports that WV-6 was probably deposited near the basin margin and received relatively more input of terrigenous organic matter as compared to WV-7, which is in agreement with interpretations made by Chen et al. (2015).
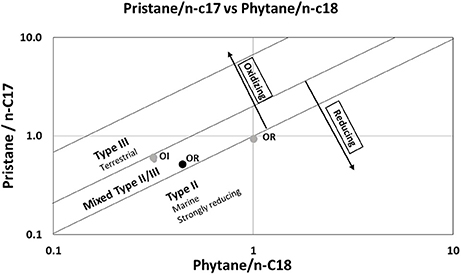
Figure 8. Pristane n-17 vs. Phytane/n-18 plots for WV6 (gray circle) and WV 7(black circles) samples. OR represents organic rich sample, OI represents organic intermediate sample.
These observations suggest that S1 vs. S2 plots, S2/S3 vs. TOC plots, S2 vs. TOC plots derived from SRA parameters as well as n-alkane distribution, Pr/Py ratio and Pr/n-C17 vs. Py/n-C18 plots derived from biomarker analysis can be used to determine changes in sources of OM and kerogen type for mature shales (VRo > 1). It is important to note that all samples used in this study had TOC values >1.13 wt.% and thermal maturity between VRo 1 and 3. Therefore, we propose that these SRA and biomarker proxies can be used for determining OM sources in mature shales with similar TOC and maturity values in the other basin of the world.
For WV-7 shale cores, a positive correlation is observed between HI vs. TOC plot and a negative correlation in OI vs. TOC plot (Figures 9A,B). This correlation trend indicates that OM was deposited in dominantly anoxic and reducing depositional conditions in low oxygen, low Eh, and low pH conditions, which are more prone for the generation of HC (Tissot and Welte, 1984). On the other hand, the samples from the WV-6 core show a poor correlation between HI, OI, and TOC (Figures 10A,B). This might indicate fluctuating paleo-redox and relatively poor OM preservation during the deposition of the WV-6 core.
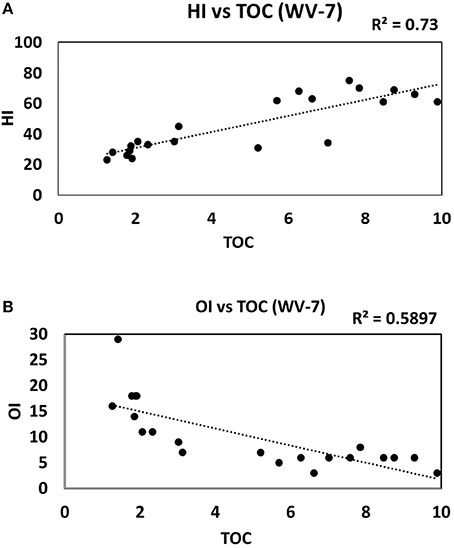
Figure 9. (A) HI vs. TOC and (B) OI vs. TOC plots for WV-7 samples.
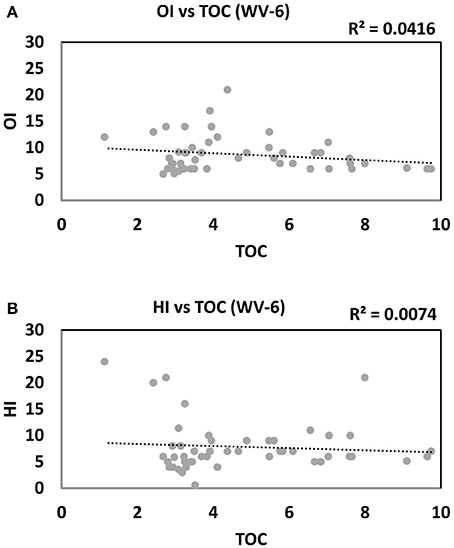
Figure 10. (A) HI vs. TOC and (B) OI vs. TOC plots for WV-6 samples.
In addition to OM source and type, biomarker ratios are also used to determine the paleo-redox conditions at the time of deposition. The Ts/Tm hopane ratio can be used to interpret paleo-redox because the oxidizing conditions favor preservation of Tm and reducing conditions favor preservation of Ts (Moldowan et al., 1985). The Ts/Tm values >2.0 indicate predominately anoxic conditions, values < 1.0 indicate predominately oxidizing conditions, and the values between 1.0 and 2.0 indicate alternating oxic and anoxic conditions (Šolević et al., 2008). The Ts/Tm ratios for both WV-6 and WV-7 were very similar ranging from 0.94 to 1. This indicates hopane ratios cannot be used to determine the paleo-redox environment in samples at maturity levels of VRo > 1.
The Pr/n-C17 and Py/n-C18 cross plots (Figure 8) suggest that OI zone of WV-6 shale cores were deposited in more oxidizing environment as compared to OR zone. This plot cannot be used to decipher any significant difference between the OR zone of WV-6 and WV-7. However, as discussed earlier, the higher Pr/Py ratio for OR zone of WV-6 as compared to the OR zone of WV-7 (Table 2) suggest that sediments in OR zone of WV-6 cores were deposited in comparatively more oxic conditions as compared to OR zone of WV-7. These observations complement the interpretations derived from the calculated SRA parameters (this study) and the established geochemical proxies in the previous study by Chen et al. (2015). This suggests that HI vs. TOC plot and OI vs. TOC plot derived from SRA parameters and Pr/n-C17 and Py/n-C18 derived from biomarker analysis might serve as an important tool for determining paleo-redox conditions during deposition of mature black shales in other basins of the world.
Every oil or natural gas shale play is unique, and this distinction is not only dependent on the source rock but also on the thermal maturity of the basin. The traditional way to determine the thermal maturity of shales is by determining Tmax from SRA or vitrinite reflectance (VRo). Tmax values and calculated vitrinite reflectance of WV-7 shale cores, (Table 1) suggests WV-7 belongs to the wet-gas window (average Tmax = 464°C, average calculated VRo = 1.19). However, Tmax determined for WV-6 shales show anomalous values possibly due to very low values of S2, and it cannot be used to determine thermal maturity. However, the presence of a higher ratio of RC/PC (average RC/PC of WV-7 is 167.42 and of WV-6 is 1104.12) and the conversion of a greater fraction of OM to hydrocarbon (f) for WV-6 (average f for WV-7 is 84%, average f for WV-6 is 97%) (Table 1) indicate that WV-6 is more mature than WV-7 shales. This also suggests that WV-6 shale should probably belong to dry gas maturity stage. Fraction conversion to HC from organics depends on the hydrogen index of immature shale samples (HI0), which is assumed to be 250 mg/g rock as observed for immature Marcellus Shales in New York (Bruner and Smosna, 2011). PI0 is assumed to be 0.02 (Peters et al., 2005).
Several biomarker proxies have been used to determine the thermal maturity of source rocks including Pr/n-17, Py/n-18, and Ts/Ts+Tm (Peter and Moldowan, 1993; Peters et al., 2005). On maturation, Pr/n-17 and Py/n-18 ratios increase while Ts/Ts+Tm decrease (Peter and Moldowan, 1993; Peters et al., 2005). For the OR zone of WV-6 and WV-7 shales, Pr/n17 and Py/n-18 are higher for WV-6 shales (Table 2), which is consistent with the inferences drawn from the SRA data. However, Ts/Ts+Tm ratio is very similar in both WV-6 and WV-7 shale samples probably due to selective thermal degradation/alteration of hopane biomarkers (Farrimond et al., 1998). This indicates that hopane biomarker ratios cannot be used to determine thermal maturity for mature source rocks (VRo > 1). However, parameters such as fraction of OM to hydrocarbon (f), RC/PC ratio as well as Pr/n17 and Py/n-18 ratios can be utilized to evaluate thermal maturity in mature shales.
Source rock analysis (SRA) and aliphatic biomarker analysis were conducted on mature Marcellus Shale samples. Due to low concentrations of biomarkers in our samples, we used improved biomarker extraction procedures and analyzed them using high resolution GC × GC-FID technique. Source rock analysis (SRA) indicates that sediments in WV-7 core had comparatively higher amounts of free HC (S1), and HC released from cracking of kerogen (S2) than the samples from the WV-6 core. The traditional hydrogen and oxygen indices (HI vs. OI plot) could not be used to determine the kerogen type due to very low values of HI and OI. However, S1 vs. S2 and S2/S3 vs. TOC cross plots indicate that both cores received mixed sources of OM indicative of Type II-III kerogen. These plots also indicate WV-6 core received a higher influx of terrestrial OM, and therefore, the kerogen is more gas prone as compared to that in the WV-7 core. The fraction conversion of OM to HC, the ratio of residual carbon/pyrolyzable carbon (RC/PC), thermal maturity parameter (Tmax), and calculated vitrinite reflectance (VRo), together suggest that samples from WV-7 and WV-6 belong in the wet and dry gas window, respectively, which is in agreement with hydrocarbon production data of these wells. The higher maturity of WV-6 samples is also supported by higher values of Pr/n17 and Py/n-18 ratios as compared to WV-7 in OR zone. The Pr/n-17 vs. Py/n-18 cross plots as well as n-alkane biomarker distribution indicate that both cores have mixed Type II-III kerogen complementing the interpretations from SRA analysis. The higher Pr/Py ratio in OR zone of WV-6 samples indicate that sediments were deposited in more oxic conditions when compared to OR zone of WV-7. Our data indicate that hopane biomarkers are not useful for interpreting paleo-redox or thermal maturity in shale samples with VRo > 1.
The interpretations based on the SRA and biomarker data match well with the conclusions drawn from a previously published study on these two cores and the hydrocarbon production data of the wells. We propose that the methods used in this study could be used to determine OM sources, paleo-redox conditions, and thermal maturation in mature shales with similar TOC values, and maturity ranges in other basins of the world.
VA and SS were involved in initial conception and design of the study, analysis and interpretation of data, drafting and revising of the manuscript.
The authors declare that the research was conducted in the absence of any commercial or financial relationships that could be construed as a potential conflict of interest.
The research was funded by Department of Energy's National Energy Technology Laboratory (DE# FE0024297; DE# FE0004000) and National Science Foundation (NSF DEB-1342732) grants to S. Sharma. The authors thank Dr. Harvey Eastman and Chloe Wonnell from NETL, Dr. Robert K. Nelson from WHOI, and Dr. Ajay Warrier from the WVU IsoBioGem Lab for help with sample analysis.
Adahchour, M., Beens, J., and Brinkman, U. A. T. (2008). Recent developments in the application of comprehensive two-dimensional gas chromatography. J. Chromatogr. A 1186, 67–108. doi: 10.1016/j.chroma.2008.01.002
Adegoke, A. K., Abdullah, W. H., Hakimi, M. H., and Sarki Yandoka, B. M. (2014). Geochemical characterisation of Fika Formation in the Chad (Bornu) Basin, northeastern Nigeria: implications for depositional environment and tectonic setting. Appl. Geochem. 43, 1–12. doi: 10.1016/j.apgeochem.2014.01.008
Agrawal, V., and Sharma, S (2018). Molecular characterization of kerogen and its implications for determining hydrocarbon potential, organic matter sources and thermal maturity in marcellus shale. Fuel 228, 429–437. doi: 10.1016/j.fuel.2018.04.053
Ahad, J. M. E., Ganeshram, R. S., Bryant, C. L., Cisneros-Dozal, L. M., Ascough, P. L., Fallick, A. E., et al. (2011). Sources of n-alkanes in an urbanized estuary: insights from molecular distributions and compound-specific stable and radiocarbon isotopes. Mar. Chem. 126, 239–249. doi: 10.1016/j.marchem.2011.06.002
Behar, F., Beaumont, V., De, B., and Penteado, H. L. (2001). Rock-eval 6 technology: performances and developments. Oil Gas Sci. Technol. 56, 111–134. doi: 10.2516/ogst:2001013
Boyer, C., Kieschnick, J., Suarez-Rivera, R., Lewis, R. E., and Waters, G. (2006). Producing gas from its source. Oilfields Rev. 18, 36–49. Available online at: https://www.slb.com/resources/publications/industry_articles/oilfield_review/2006/or2006aut03_producing_gas.aspx
Brocks, J. J., Buick, R., Logan, G., and Summons, R. E (2003). Composition and syngeneity of molecular fossils from the 2.78 to 2.45 billion-year-old Mount 27 Bruce Supergroup, Pilbara Craton, Western Australia. Geochim. Cosmochim. Acta 67, 4289–4319. doi: 10.1016/S0016-7037(03)00208-4
Bruner, K. R., and Smosna, R. (2011). A Comparative Study of the Mississippian Barnett Shale, Fort Worth Basin, and Devonian Marcellus Shale, Appalachian Basin, DOE/NETL-2011/1478 U.S. Department of Energy.
Chen, R., Sharma, S., Bank, T., Soeder, D., and Eastman, H. (2015). Comparison of isotopic and geochemical characteristics of sediments from a gas- and liquids-prone wells in Marcellus Shale from Appalachian Basin, West Virginia. Appl. Geochem. 60, 59–71 doi: 10.1016/j.apgeochem.2015.01.001
Clark, J. R. C., and Blumer, M. (1967). Distribution of n-paraffins in marine organisms and sediment1. Limnol. Oceanogr. 12, 79–87. doi: 10.4319/lo.1967.12.1.0079
Cranwell, P. A. (1973). Chain-length distribution of n-alkanes from lake sediments in relation to post-glacial environmental change. Freshw. Biol. 3, 259–265. doi: 10.1111/j.1365-2427.1973.tb00921.x
Cranwell, P. A. (1982). Lipids of aquatic sediments and sedimenting particulates. Progr. Lipid Res. 21, 271–308. doi: 10.1016/0163-7827(82)90012-1
Dahl, B., Bojesen-Koefoed, J., Holm, A., Justwan, H., Rasmussen, E., and Thomsen, E. (2004). A new approach to interpreting Rock-Eval S2 and TOC data for kerogen quality assessment. Organ. Geochem. 35, 1461–1477. doi: 10.1016/j.orggeochem.2004.07.003
Dayal, A. M., Mani, D., Madhavi, T., Kavitha, S., Kalpana, M. S., Patil, D. J., et al. (2014). Organic geochemistry of the Vindhyan sediments: implications for hydrocarbons. J. Asian Earth Sci. 91, 329–338. doi: 10.1016/j.jseaes.2014.03.010
Didyk, B. M., Simoneit, B. R. T., Brassell, S. C., and Eglinton, G. (1978). Organic geochemical indicators of palaeoenvironmental conditions of sedimentation. Nature 272, 216–222. doi: 10.1038/272216a0
Eglinton, G., and Hamilton, R. J. (1967). Leaf epicuticular waxes. Science 156, 1322–1335. doi: 10.1126/science.156.3780.1322
EIA (2013). Available online at: https://www.eia.gov/analysis/studies/worldshalegas/pdf/overview.pdf
EIA (2016). Available online at: http://www.eia.gov/petroleum/drilling/archive/2016/01/#tabs-summary-2
Elie, M., Faure, P., Michels, R., Landais, P., and Griffault, L. (2000). Natural and laboratory oxidation of low-organic-carbon-content sediments: comparison of chemical changes in hydrocarbons. Energy Fuels 14, 854–861. doi: 10.1021/ef9902146
Engelder, T., and Lash, G. (2008). Marcellus Shale Play's Vast Resource Potential Creating Stir in Appalachia. Haysville, KY: The American Oil and Gas Reporter.
Farrimond, P., Taylor, A., and TelnÆs, N. (1998). Biomarker maturity parameters: the role of generation and thermal degradation. Organ. Geochem. 29, 1181–1197. doi: 10.1016/S0146-6380(98)00079-5
Forster, A., Sturt, H., and Meyers, P. A., and The Leg 207 Shipboard Scientific Party (2004). “Molecular biogeochemistry of Cretaceous black shales from the Demerara Rise: preliminary shipboard results from sites 1257 and 1258, Leg 207,” in Proceedings of the Ocean Drilling Program, Initial Reports, eds J. Erbacher, D. C. Mosher, and M. J. Malone et al. (College Station, TX), 1–22.
Horsfield, B., and Schulz, H.-M. (2012). Shale gas exploration and exploitation. Mar. Petrol. Geol. 31, 1–2. doi: 10.1016/j.marpetgeo.2011.12.006
Hunt, J. M., Philp, R. P., and Kvenvolden, K. A. (2002). Early developments in petroleum geochemistry. Org. Geochem. 33:1025. doi: 10.1016/S0146-6380(02)00056-6
Jarvie, D. M., Hill, R. J., Ruble, T. E., and Pollastro, R. M. (2007). Unconventional shale-gas systems: the Mississippian Barnett Shale of north-central Texas as one model for thermogenic shale-gas assessment. AAPG Bull. 91, 475–499. doi: 10.1306/12190606068
Jarvie, D. M., and Lundell, L. L. (1991). “Hydrocarbon generation modeling of naturally and artificially matured Barnett Shale, Fort Worth Basin,” in Texas: Southwest Regional Geochemistry Meeting. The Woodlands.
Kroon, J. (2011). Biomarkers in the Lower Huron Shale (Upper Devonain) as Indicators of Organic Matter Source, Depositional Environment, and Thermal Maturity. All theses. Available online at: http://tigerprints.clemson.edu/all_theses/1166
Lafargue, E., Marquis, F., and Pillot, D. (1998). Rock-Eval 6 applications in hydrocarbon exploration, production, and soil contamination studies. Rev. l'Inst. Franç. Pétrol. 53, 421–437.
Lash, G. G., and Engelder, T. (2008). “Marcellus shale subsurface stratigraphy and thickness trends: Eastern New York to Northeastern West Virginia (abs.),” in American Association of Petroleum Geologists Eastern Section Meeting. (Pittsburgh, PA).
Lash, G. G., and Engelder, T. (2011). Thickness trends and sequence stratigraphy of the middle devonian marcellus formation, appalachian basin: implications for acadian foreland basin evolution. Am. Assoc. Pet. Geol. Bull. 95, 61–103.
Langford, F. F., and Blanc-Valleron, M.-M. (1990). Interpreting rock-eval pyrolysis data using graphs of pyrolizable hydrocarbons vs. total organic carbon (1). AAPG Bull. 74, 799–804.
Littke, R. (2006). Deposition, Diagenesis and Weathering of Organic Matter-Rich Sediments. Berlin; Heidelberg: Springer.
Martínez, M., and Escobar, M. (1995). Effect of coal weathering on some geochemical parameters. Organ. Geochem. 23, 253–261.
Meyers, P. A. (1997). Organic geochemical proxies of paleoceanographic, paleolimnologic, and paleoclimatic processes. Organ. Geochem. 27, 213–250. doi: 10.1016/S0146-6380(97)00049-1
Moldowan, J. M., Seifert, W. K., and Gallegos, E. J. (1985). Relationship between petroleum composition and depositional environment of petroleum source rocks. AAPG Bull. 69, 1255–1268.
Olcott, A. N. (2007). The utility of lipid biomarkers as paleoenvironmental indicators. PALAIOS 22, 111–113. doi: 10.2110/palo.2007.S02
Peter, K. E., and Moldowan, J. M. (1993). The Biomarker Guide: Interpreting Molecular Fossils in Petroleum and Ancient Sediments. Englewood Cliffs, NJ: Prentice Hall.
Peters, K. E. (1986). Guidelines for evaluating petroleum source rock using programmed pyrolysis. AAPG Bull. 70, 318–329.
Peters, K. E., Walters, C. C., and Moldowan, J. M. (2005). The Biomarker Guide. Cambridge: Cambridge University Press.
Philp, R. P. (1985). Biological markers in fossil fuel production. Mass Spectrom. Rev. 4, 1–54. doi: 10.1002/mas.1280040102
Powell, T. G., and Mckirdy, D. M. (1973). Relationship between ratio of pristane to phytane, crude oil composition and geological environment in Australia. Nature 243, 37–39. doi: 10.1038/physci243037a0
Romero, A. M., and Philp, R. P. (2012). Organic geochemistry of the Woodford Shale, southeastern Oklahoma: how variable can shales be? AAPG Bull. 96, 493–517. doi: 10.1306/08101110194
Sageman, B. B., Murphy, A. E., Werne, J. P., Ver Straeten, C. A., Hollander, D. J., and Lyons, T. W. (2003). A tale of shales: the relative roles of production, decomposition, and dilution in the accumulation of organic-rich strata, Middle–Upper Devonian, Appalachian basin. Chem. Geol. 195, 229–273. doi: 10.1016/S0009-2541(02)00397-2
Sherman, L. S., Waldbauer, J. R., and Summons, R. E. (2007). Improved methods for isolating and validating indigenous biomarkers in Precambrian rocks. Org. Geochem. 38, 1987–2000. doi: 10.1016/j.orggeochem.2007.08.012
Šolević, T., Stojanović, K., Bojesen-Koefoed, J., Nytoft, H. P., Jovančićević, B., and Vitorović, D. (2008). Origin of oils in the Velebit oil-gas field, SE Pannonian Basin, Serbia - Source rocks characterization based on biological marker distributions. Org. Geochem. 39, 118–134.
Song, J., Littke, R., Maquil, R., and Weniger, P. (2014). Organic facies variability in the Posidonia Black Shale from Luxembourg: implications for thermal maturation and depositional environment. Palaeogeogr. Palaeoclimatol. Palaeoecol. 410, 316–336. doi: 10.1016/j.palaeo.2014.06.002
Tissot, B. P., and Welte, D. H. (1978). Petroleum Formation and Occurrence, 1st Edn. Berlin: Springer Verlag.
Tissot, B. P., and Welte, D. H. (1984). Petroleum Formation and Occurrence, 2nd Edn. Berlin: Springer Verlag.
Tourtelot, H. A. (1979). Black shale - its deposition and diagenesis. Clays Clay Miner. 27:313321. doi: 10.1346/CCMN.1979.0270501
Van Krevelen, D. W. (1961). Coal: Typology – Chemistry – Physics – Constitution, 1st Edn. Amsterdam: Elsevier.
Werne, J. P., Sageman, B. B., Lyons, T. W., and Hollander, D. J. (2002). An integrated assessment of a “type euxinic” deposit: evidence for multiple controls on black shale deposition in the middle Devonian Oatka Creek formation. Am. J. Sci. 302, 110–143. doi: 10.2475/ajs.302.2.110
Keywords: Marcellus Shale, biomarkers, pyrolysis, organic matter, paleo-redox, thermal maturity
Citation: Agrawal V and Sharma S (2018) Testing Utility of Organogeochemical Proxies to Assess Sources of Organic Matter, Paleoredox Conditions, and Thermal Maturity in Mature Marcellus Shale. Front. Energy Res. 6:42. doi: 10.3389/fenrg.2018.00042
Received: 08 October 2017; Accepted: 26 April 2018;
Published: 29 May 2018.
Edited by:
Jennifer Wilcox, Colorado School of Mines, United StatesReviewed by:
Frantisek Buzekfrantisek, Czech Geological Survey, CzechiaCopyright © 2018 Agrawal and Sharma. This is an open-access article distributed under the terms of the Creative Commons Attribution License (CC BY). The use, distribution or reproduction in other forums is permitted, provided the original author(s) and the copyright owner are credited and that the original publication in this journal is cited, in accordance with accepted academic practice. No use, distribution or reproduction is permitted which does not comply with these terms.
*Correspondence: Vikas Agrawal, dmlhZ3Jhd2FsQG1peC53dnUuZWR1
Disclaimer: All claims expressed in this article are solely those of the authors and do not necessarily represent those of their affiliated organizations, or those of the publisher, the editors and the reviewers. Any product that may be evaluated in this article or claim that may be made by its manufacturer is not guaranteed or endorsed by the publisher.
Research integrity at Frontiers
Learn more about the work of our research integrity team to safeguard the quality of each article we publish.