 Emir Tas1,2,3,4*†
 Shasha Bai1,5†
 Xiawei Ou4,6Kelly Mercer1,3,4
 Haixia Lin1,4Kori Mansfield6Robert Buchmann1,6Eva C. Diaz1,3,4Jon Oden1,2,3
 Elisabet Børsheim1,3,4Sean H. Adams1,3,4Jonathan Dranoff3,7
- 1Department of Pediatrics, University of Arkansas for Medical Sciences, Little Rock, AR, United States
- 2Endocrinology and Diabetes, Arkansas Children's Hospital, Little Rock, AR, United States
- 3Arkansas Children's Research Institute, Little Rock, AR, United States
- 4Arkansas Children's Nutrition Center, Little Rock, AR, United States
- 5Center for Biostatistics, The Ohio State University Wexner Medical Center, Columbus, OH, United States
- 6Department of Radiology, University of Arkansas for Medical Sciences, Little Rock, AR, United States
- 7Department of Medicine, Division of Gastroenterology and Hepatology, University of Arkansas for Medical Sciences, Little Rock, AR, United States
Background: There is a pressing need for effective and non-invasive biomarkers to track intrahepatic triglyceride (IHTG) in children at-risk for non-alcoholic fatty liver disease (NAFLD), as standard-of-care reference tools, liver biopsy and magnetic resonance imaging (MRI), are impractical to monitor the course disease.
Objective: We aimed to examine the association between serum fibroblast growth factor (FGF)-21 to adiponectin ratio (FAR) and IHTG as assessed by MRI in children with obesity.
Methods: Serum FGF21 and adiponectin levels and IHTG were measured at two time points (baseline, 6 months) in obese children enrolled in a clinical weight loss program. The association between percent change in FAR and IHTG at final visit was examined using a multiple linear regression model.
Results: At baseline, FAR was higher in the subjects with NAFLD (n = 23, 35.8 ± 41.9 pg/ng) than without NAFLD (n = 35, 19.8 ± 13.7 pg/ng; p = 0.042). Forty-eight subjects completed both visits and were divided into IHTG loss (≥1% reduction than baseline), no change (within ±1% change), and gain (≥1% increase than baseline) groups. At 6 months, the percent change in FAR was different among the three groups (p = 0.005). Multiple linear regression showed a positive relationship between percent change in FAR and the final liver fat percent in sex and pubertal stage-similar subjects with NAFLD at baseline (slope coefficient 6.18, 95% CI 1.90–10.47, P = 0.007), but not in those without NAFLD.
Conclusions: Higher value in percent increase in FAR is positively associated with higher level of IHTG percent value at 6 months in children with baseline NAFLD. FAR could be a potential biomarker to monitor the changes in IHTG in children with NAFLD.
Introduction
Non-alcoholic fatty liver disease (NAFLD) is the most common etiology of chronic liver disease in children and adults (1, 2). The estimated prevalence of NAFLD is 29 to 38% in children with obesity; however, findings vary among populations studied and diagnostic criteria used (1).
NAFLD represents a disease spectrum, ranging from simple steatosis (i.e., presence of macrovesicular fat in more than 5% of the liver volume) to non-alcoholic steatohepatitis (NASH), cirrhosis, and liver failure (3). The diagnosis of NAFLD requires a demonstration of fatty infiltration on histology or imaging. Obesity is the most important risk factor for the development of steatosis, although in rare instances, individuals with no apparent obesity may also have NAFLD (4). Factors that predict disease progression from steatosis to more advanced stages are not fully understood; however, people with one or more of the components of metabolic syndrome are at a higher risk for adverse outcomes (5). Recently, the degree of hepatic fat accumulation has been hypothesized to play an independent role in the development of NASH and fibrosis (6, 7). This notion was supported by the finding that among adult NAFLD patients with no baseline hepatic fibrosis, those with a higher baseline liver fat (≥15.7%) developed fibrosis at a much higher rate (OR 6.67, 95% CI: 1.01–44.1, p < 0.05) after a 1.75 year follow up (8). Moreover, genetic variants that are associated with NAFLD and disease progression, including PNPLA3 and others, regulate intrahepatic fat trafficking and cause increased hepatic fat accumulation (9). Routine measurements of liver fat, fibrosis, and molecular liver markers to track NAFLD and NAFLD progression are not facile or appropriate for many clinical settings. Thus, identifying biomarkers that can predict static and longitudinal changes of the hepatic fat content and, in particular, the NAFLD phenotype would have prognostic value for disease progression, and serve as a tool to monitor response interventions.
Liver biopsy and magnetic resonance-based imaging techniques are the reference standards for the diagnosis and monitoring of NAFLD (10); however, both have significant limitations for routine use, such as high cost and limited availability (11). Considering the magnitude of NAFLD in the general population, and the limitations of the currently available clinical screening tools (e.g., waist circumference, serum ALT level, liver ultrasonography), recent studies have focused on identifying biomarkers that are effective and cost-efficient for screening, diagnosis and monitoring of NAFLD. Fibroblast Growth Factor-21 (FGF21) has been recognized as an important mediator in hepatic lipid metabolism, and suggested as a biomarker for NAFLD.
Our working hypothesis is that blood analytes associated with whole-body and liver metabolic health (e.g., FGF21 and one of its downstream effectors adiponectin), either singly or in combination, can be used as adjunct predictive tools for NAFLD status and liver fat changes in children. Fibroblast Growth Factor-21 (FGF21) is a distinct metabolic regulator with pleiotropic effects on whole-body energy metabolism (12–14). FGF21 is primarily expressed in the liver and secreted in the circulation in response to starvation/amino acid deprivation and acute exercise (13, 15). An important site of action for FGF21 is adipose tissue, where it increases adiponectin synthesis and secretion (16). Animal and human studies have shown that FGF21 improves peripheral insulin sensitivity, stimulates glucose uptake and lipid oxidation, and decreases lipogenesis, at least in part through increased adiponectin (14, 17–19). Paradoxically, the circulating level of FGF21 is higher, but adiponectin level is lower in individuals with NAFLD, suggesting a state of adipose tissue FGF21 resistance (17, 20–23). Moreover, pharmacological administration of recombinant FGF21 reduced serum triglyceride (TG) and low-density lipoprotein cholesterol (LDL) while increased high-density lipoprotein cholesterol (HDL) levels, and it reversed steatosis in mouse models of obesity and diabetes (14, 17, 24). Humans with obesity and type 2 diabetes had a similar response in serum lipid profile to exogenous FGF21 (25–27). A positive dose-response relationship was observed between the dose of FGF21 administered and the concentration of serum adiponectin in these studies. Therefore, adiponectin levels could potentially reflect, in part, FGF21 actions. With this in mind, we hypothesize that monitoring both hormones has value in terms of biomarker utility in tracking liver fat content in individuals with NAFLD.
This study aims to determine the short-term longitudinal relationship between FGF21, adiponectin and liver fat and to investigate the role of FGF21-Adiponectin Ratio (FAR) as a potential marker to monitor change in liver fat percent (as assessed by MRI) in obese children and adolescents at risk for NAFLD.
Materials and Methods
Subjects
Sixty children ages 10–17 years who were seen for weight management at the Center for Obesity And its Consequences in Health (C.O.A.C.H.) clinic at the Arkansas Children's Hospital were recruited. Inclusion criteria included body mass index (BMI) ≥95th percentile for age and sex, all ethnicities, and absence of diabetes (diabetes was defined as fasting glucose ≥126 mg/dL or an HbA1c ≥6.5%). Subjects were excluded from the study if they had a history of cardiac, pulmonary, renal, neurological diseases, and liver disease including autoimmune hepatitis, viral hepatitis, Wilson's disease, hemochromatosis, and biopsy or magnetic resonance imaging-confirmed diagnosis of NAFLD. Also, those taking any prescription medications that are known to have a direct effect on hepatic lipid metabolism (i.e., metformin, statins, fibrates, steroids, thyroid hormones, growth hormones) were excluded.
The Institutional Review Board of the University of Arkansas for Medical Sciences approved the study. Written informed consent and assent were obtained from the legal representatives of each subject and participants, respectively, before participation.
Study Design
All subjects had a complete medical history and physical exam, including determination of pubertal status by the same Endocrinologist, according to Tanner staging at the baseline visit. Participants in Tanner stage II or III of pubertal development were classified as being in the early stages of puberty, and those in Tanner stage IV or V were classified as being in late stages of puberty. At baseline, each participant received standard of care lifestyle counseling regarding weight management, including guidance about diet and physical activity by a registered dietitian and physical therapist, respectively. Final study visit took place when subjects returned to C.O.A.C.H clinic after 6 months. Adherence to recommendations was not assessed due to the observational nature of the study.
Blood Analytes
We obtained blood samples by venipuncture (typically from the antecubital vein) after an overnight fast to measure the comprehensive metabolic profile. Serum concentrations of glucose, insulin, triglyceride (TG), high-density lipoprotein (HDL), low-density lipoprotein (LDL), free fatty Acid (FFA), and the level of liver enzymes [alanine aminotransferase (ALT), aspartate aminotransferase (AST), gamma-glutamyl transferase (GGT)] were measured via clinical analyzer (Siemens Atellica, Malvern, PA) at the Arkansas Children's Hospital Chemistry. Serum FGF21 (Human FGF21 Quantikine), adiponectin (Human Total Adiponectin/Acrp30 Quantikine), and leptin (Human Leptin Quantikine) were measured via ELISA per manufacturer's protocols (R&D Systems, Minneapolis, MN). FGF21 to Adiponectin Ratio (FAR) was calculated simply by dividing the FGF21 concentration (pg/mL) to adiponectin concentration (ng/mL). “Percent change” in FAR was calculated by subtracting the baseline value from the final value divided by the baseline value multiplied by 100. A positive number indicates an increase while a negative number indicates a decrease in FAR. Percent change was chosen over absolute change because of the wide interindividual variation in FGF21 concentrations and non-normal distribution of the FGF21 and FAR. Similarly, Leptin to Adiponectin Ratio (LAR) was calculated simply by dividing the leptin concentration (pg/mL) to adiponectin concentration (ng/mL). Homeostatic Model Assessment for Insulin Resistance (HOMA-IR) was calculated by the following formula: fasting glucose (mg/dL) × fasting insulin (mIU/mL) divided by 405.
Body Composition
Total body adiposity was assessed via bioimpedance technique using InBody® 570 body composition analyzer (InBody USA, Cerritos, CA) according to the manufacturer's protocols. In brief, tissue impedance is measured over 60 s when a low intensity current travels between the bare feet and hands of the subjects. The total body fat (TBF) estimate was obtained from the equipment software. TBF estimate via InBody correlates well with the Dual X-Ray Absorptiometry (DXA) scan (28).
Liver Magnetic Resonance Imaging
All subjects had an estimation of intrahepatic triglyceride (IHTG) percent by magnetic resonance imaging (MRI) at baseline and final visits. Specifically, a multi-echo multi-slice gradient-echo pulse was used to acquire in/out of phase images of the whole liver using a 1.5T MRI scanner (Philips Healthcare, Best, The Netherlands). MRI method was chosen over conventional magnetic resonance spectroscopy (MRS) because MRI in principle uses the same method (Dixon method) as MRS, but can provide an evaluation of the fat concentration of the whole liver (other than one single imaging voxel by MRS that also has to be manually placed), which would be preferred for this longitudinal study. In addition, studies have shown close agreement between MRI and MRS measurements of fat fraction in children with known or suspected NAFLD (29). The triple-echo method was used to control/reduce the confounding effects of intrinsic T2/T1 relaxation in the liver fat quantification (30, 31).
Quantification of Intrahepatic Triglyceride (IHTG) Content and Percent
All raw MRI images were exported to a workstation with MATLAB software (The MathWorks Inc., Natick, MA) and customized script for post-processing and for calculation of whole liver average fat concentration. Two experienced raters (XO, KM) sketched a region-of-interests (ROI) for each subject which included the whole liver as much as possible, but avoided intrahepatic vessels and perihepatic fat as well as all edges. The average signal intensity in the selected ROI was computed, and the liver fat concentration for the subject was calculated from these signal intensities.
Subjects were classified as having NAFLD if the liver fat percent by MRI was ≥5% at baseline or final visits. Furthermore, we divided the subjects into three groups based on the “absolute change” in the IHTG percent between the baseline and final studies: (i) subjects whose final liver percent was ≥1% point lower than the baseline (Loss), (ii) subjects whose final liver fat percent was within −1% and +1% point of the baseline (No change), and (iii) subjects whose final liver fat percent was ≥1% point higher than the baseline (Gain). For instance, a subject with 5% IHTG at baseline, with a repeat MRI showing ≤4% liver fat, would be categorized in the loss group. Using this same example, if the repeat MRI shows ≥6% liver fat, then the individual would be categorized in the gain group; however, if the repeat MRI shows liver fat between 4 and 6%, then this individual will be in the no change group. In our study, 1% absolute change in IHTG corresponded to a 46% relative reduction of the liver fat in the loss group and 37% relative increase in the gain group. Patel et al. (32) utilizing paired MRI and liver biopsy data showed that a 29% relative reduction in liver fat was associated with a histological improvement in patients with NASH. As such, it is reasonable to expect the subjects in the loss vs. gain groups in our study to have a clinically relevant amount of improvement vs. worsening in their liver histology, respectively.
Statistical Analysis
Summary statistics presented are mean (SD, standard deviation) or median (Q1, Q3) for continuous variables, and count (percentages) for categorical variables. Comparative analyses between two groups (loss vs. gain, or NAFLD vs. No NAFLD) were assessed by Wilcoxon Rank-sum test for continuous variables due to small sample size or non-normality, two-sample t-test for normally distributed continuous variables, and Fisher's exact test or Chi-square test for categorical variables. Comparative analyses between three groups (loss, no change, and gain) were assessed by Kruskal–Wallis test for continuous variables due to small sample size or non-normality, and Fisher's exact test for categorical variables. Due to the wide variability of FGF21 reported in previous literature, all outlying values outside of the whiskers of the boxplots were retained in the analyses. Sensitivity analyses were conducted using different cut-off values for the definition of loss and gain groups. Finally, a multiple linear regression model predicting IHTG percent at final visit was built using percent change in FAR, baseline NAFLD status, and their interaction, and adjusting for sex and pubertal stage in order to assess the relationship between FAR and liver fat percent. A similar model was also fit using LAR in replacement of FAR. P < 0.05 were considered statistically significant. All analyses were implemented in Stata 16.1 (StataCorp, College Station, TX).
Results
Subjects' Characteristics
Of the sixty subjects recruited, fifty-eight completed baseline study visit and liver MRI measurements. Twenty-three subjects (39%) had NAFLD at baseline. Ten participants were lost to follow-up (retention rate 48/58 = 83%). Overall, 48 subjects completed both study visits and MRI (baseline and 6-month), and are included in the final comparative analyses. Regardless of the baseline NAFLD status, 13 (27%) subjects had ≥1% reduction in IHTG percent (loss group), while 17 (35%) subjects had ≥1% increase in IHTG percent (gain group) than baseline level. Eighteen (38%) subjects were categorized in the no change group as they had <1% increase or decrease in IHTG percent.
Clinical and Laboratory Characteristics
Characteristics of subjects with and without NAFLD at baseline were summarized in Table 1. Comparison of the baseline characteristics of all subjects by sex and pubertal stage provided in the Supplementary Tables 1, 2. At baseline mean FAR was significantly higher in the subjects with NAFLD compared to those without NAFLD, while FGF21 and adiponectin levels were not significantly different. The difference in FAR among those with and without NAFLD was independent of total adiposity as serum leptin concentrations and percent body fat were comparable between these two groups. Subjects with NAFLD had significantly higher waist circumference, fasting insulin, HOMA-IR, and ALT levels. Weight, BMI, BMI-z, and LAR were all higher in subjects with NAFLD, but none of them reached statistical significance (Table 1). FAR at baseline was correlated with the IHTG percent on MRI (Spearman correlation coefficient r = 0.27, p = 0.0397). Among the participants with paired MRI and FAR data (n = 47), the percent change in FAR correlated significantly with the percent change in IHTG (Spearman correlation coefficient r = 0.53, p < 0.001; Supplementary Table 3).
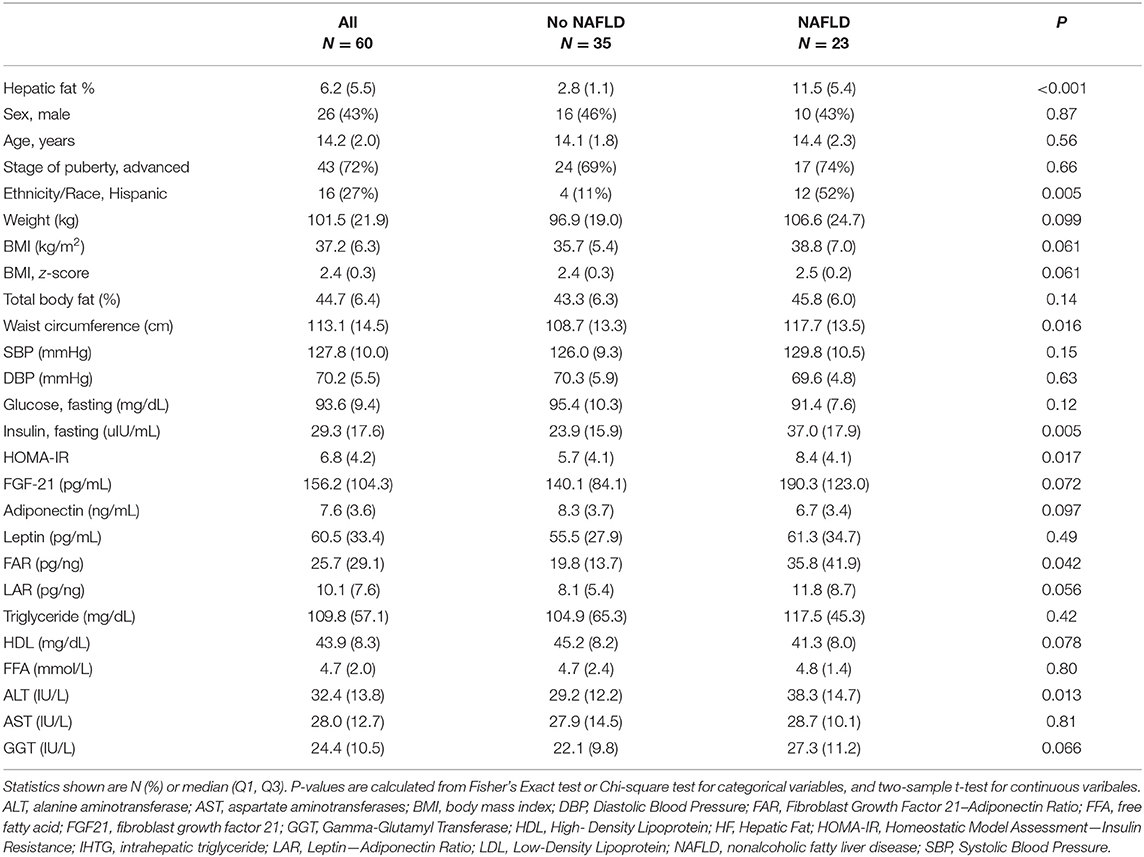
Table 1. Summary of all subject characteristics at baseline and comparison among subjects with and without NAFLD.
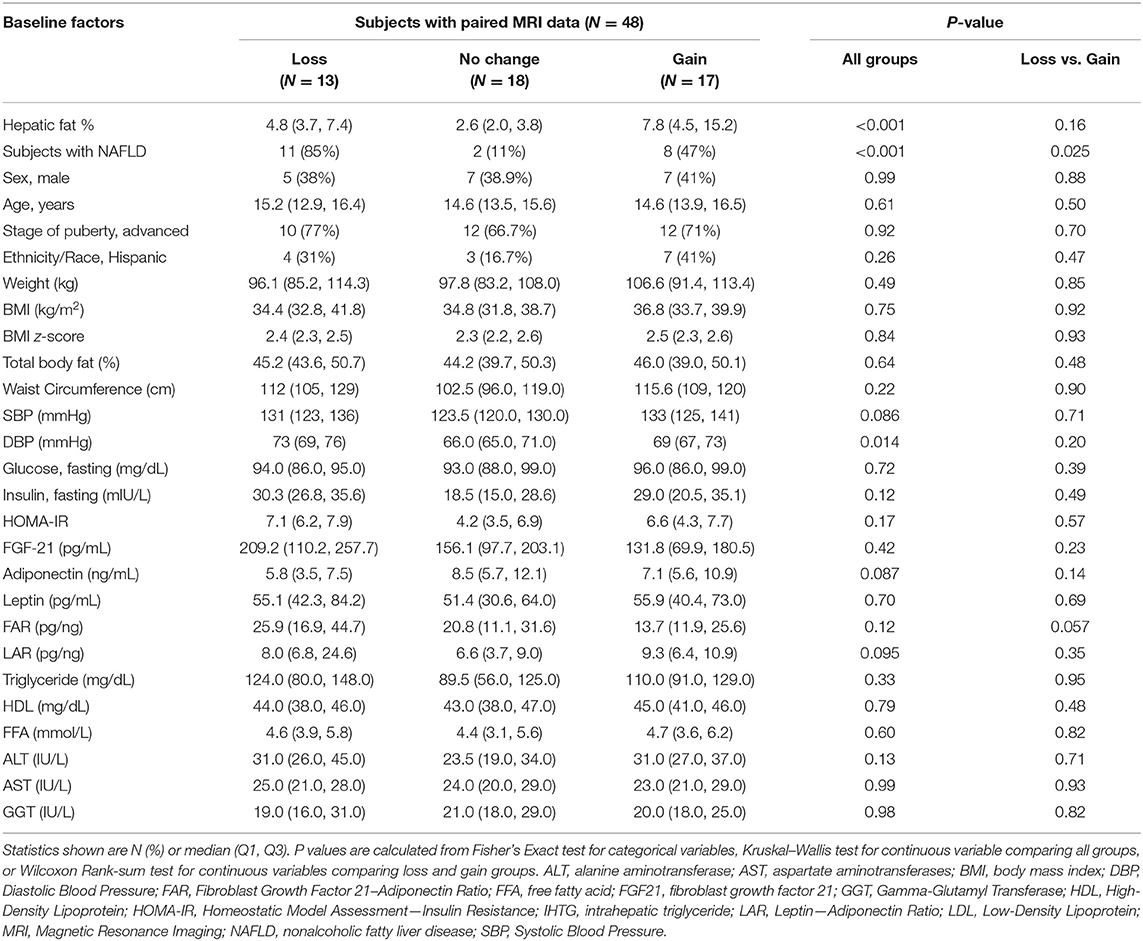
Table 2. Summary and comparison of baseline characteristics between loss, no change, and gain groups.
Table 2 summarizes the comparison of baseline characteristics among the loss, no change and gain groups as determined by repeated MRI. To examine how changes in liver fat are associated with baseline FAR and other parameters, comparisons among all three groups, as well as between the loss and gain groups were made. The only pairwise comparison was between loss and gain groups because this was the primary comparison of interest. These two groups were comparable for sex, age, stage of puberty, race/ethnicity, baseline measurements of weight, BMI, BMI z-score, percent total body fat, fasting concentrations of glucose, insulin, triglycerides, HDL, free fatty acids, serum ALT, AST, GGT, and LAR levels, and FGF21 and adiponectin concentrations (Table 2). FAR level was higher in the loss group [median (Q1, Q3), 25.9 pg/ng (16.9, 44.7)] compared to gain group [13.7 pg/ng (11.9, 25.6)] (p = 0.057) while HOMA-IR and LAR were not different between groups. Although a higher percentage of subjects in the loss group had NAFLD at baseline compared to gain group (85 vs. 47%; p = 0.025), the median liver fat percent was not statistically different [4.8% (3.7, 7.4) vs. 7.8% (4.5, 15.2); p = 0.16] between the two groups (Table 2).
Changes in FAR and Liver Fat, and LAR and Liver Fat Are Positively Associated
Next, percent changes between two study visits were computed for all biomarkers, and those were compared among the three groups, in order to assess the relationship between change in biomarkers and the changes in the liver fat. Percent change was chosen over absolute change because of the wide between individual variation in biomarkers and non-normal distribution of certain clinical measures, such as FGF21 and FAR. The percent change in FAR was significantly different among groups [−24 (−31, 4) vs. −13 (−42, 31) vs. 75 (23, 117) in the loss vs. no change vs. gain groups, respectively; p = 0.005 by Kruskal–Wallis]. Similarly, percent change in LAR was also significantly different among groups [−17 (−34, 1) vs. −17 (−32, 1) vs. 23 (16, 55) in the loss vs. no change vs. gain groups, respectively; p = 0.014 by Kruskal–Wallis]. Importantly, there was no difference in the markers of insulin resistance (fasting glucose, insulin, or HOMA-IR) between groups (Table 3). To further appreciate the significant correlation between FAR and LAR and change in liver fat, the percent change of FGF21, adiponectin and leptin (Figure 1), and FAR and LAR (Figure 2) were plotted using a boxplot by the IHTG groups.
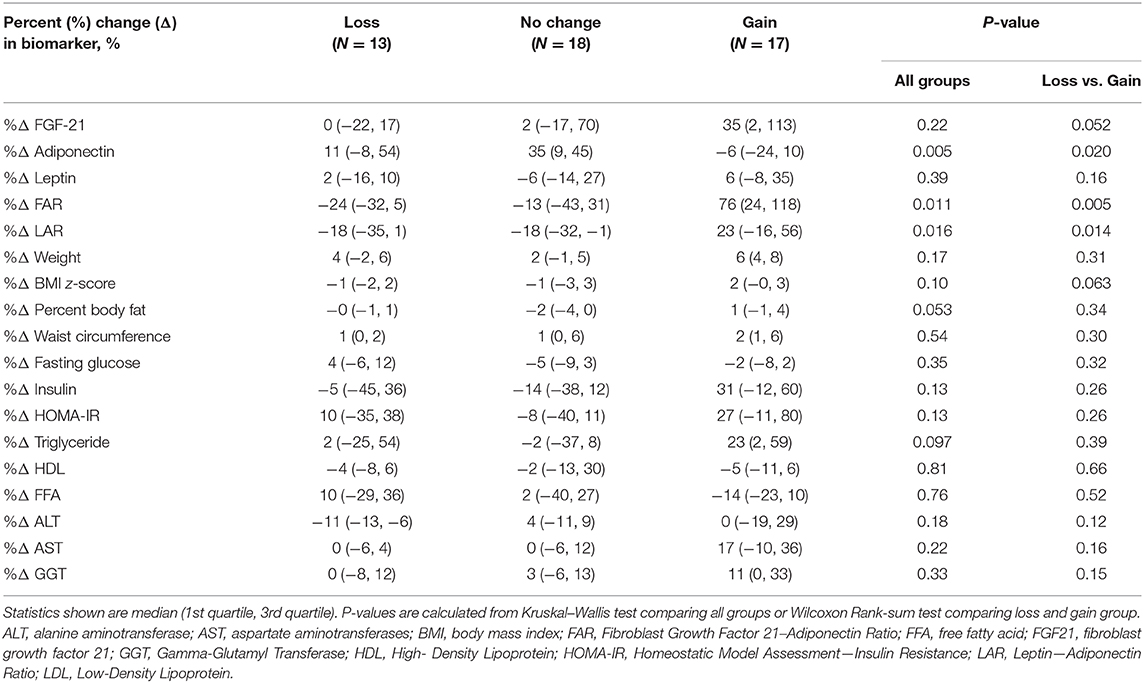
Table 3. Summary and comparison of percent change in biomarkers between loss, no change, and gain groups.
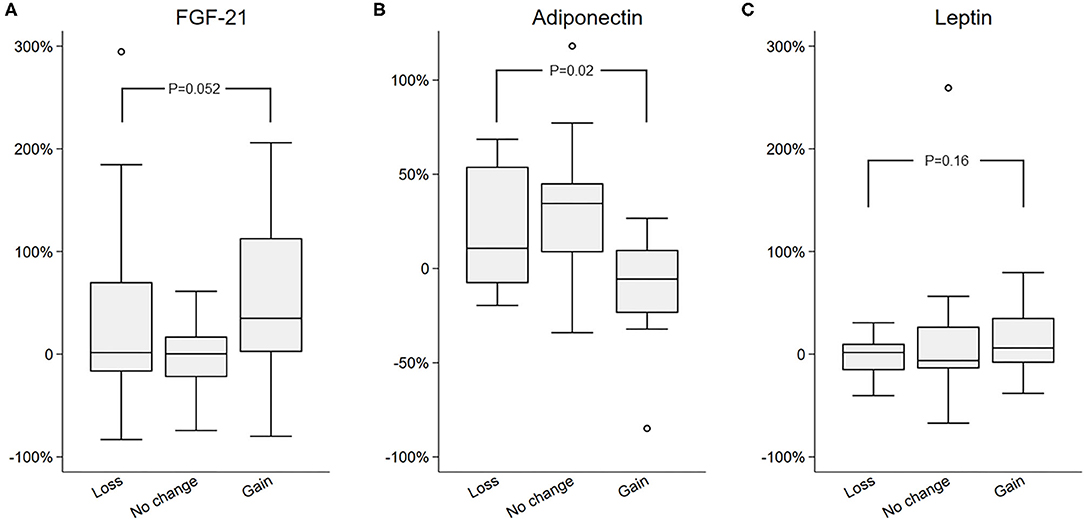
Figure 1. Comparison of percent change in (A) FGF21, (B) Adiponectin, and (C) Leptin in the loss, no change, and gain groups.
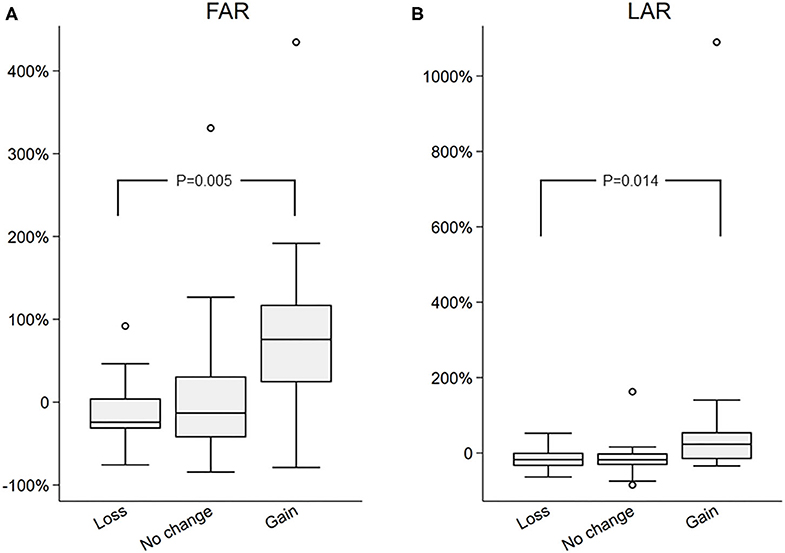
Figure 2. Comparison of percent change in (A) FGF21 to Adiponectin Ratio (FAR) and (B) Leptin to Adiponectin Ration (LAR) in the loss, no change, and gain groups.
Change in FAR, but Not LAR Predicts Final Liver Fat Percent in NAFLD Subjects
Finally, we examined the association between percent change in FAR and the IHTG percent at final visit using a multiple linear regression model including the interactions between percent change in FAR and baseline NAFLD status (Figure 3). Our data showed a significant positive relationship between percent change in FAR and the final IHTG percent in subjects with baseline NAFLD (slope coefficient 6.40, 95% CI 2.23–10.57, P = 0.005), but not in those without baseline NAFLD (slope coefficient 0.33, 95% CI −0.25–0.91, P = 0.25). Adjusting model for sex and pubertal stage gave similar results (slope coefficient 6.18, 95% CI 1.90–10.47, P = 0.007, figure not shown). This suggests that for sex and pubertal stage-similar subjects with baseline NAFLD, the higher value in percent increase in FAR is positively associated with a higher level of liver fat percent at final visit. Using the same multiple linear regression model, we also examined the association between percent change in LAR and the final IHTG percent, but did not find any significant relationship [Slope coefficient: 5.64 (95% CI −1.74, 13.03), P = 0.125 for NAFLD; slope coefficient: 0.078 (95% CI −0.27, 0.43) P = 0.65 for non-NAFLD].
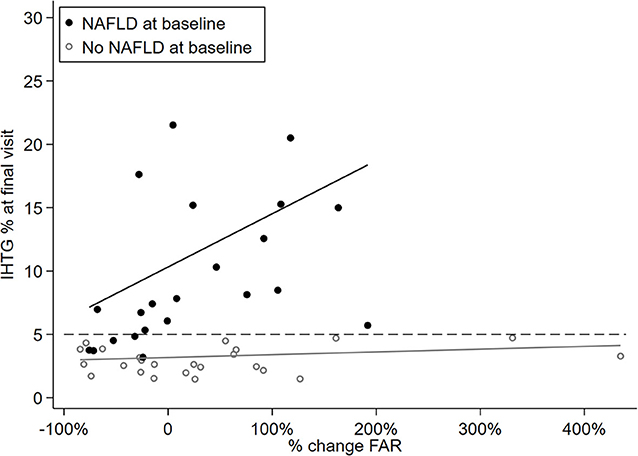
Figure 3. Scatterplot showing linear association between hepatic fat percent at final visit and percent change in the FAR by baseline NALFD status.
Discussion
In this observational study, we investigated the relationship of FGF21, adiponectin, and FAR with IHTG percent in a clinically well-characterized pediatric cohort of pubertal children with obesity participating in a short-term (6-month) lifestyle intervention program. We provided new evidence that FAR associates with NAFLD status even before such a relationship becomes apparent between FGF21 and NAFLD, or adiponectin and NAFLD. We also showed that FAR is positively related to the changes in IHTG percent in subjects with NAFLD even in the absence of a discernable difference in routinely available clinical markers such as weight, BMI-z score, waist circumference, total body fat percent, and serum markers of insulin resistance, liver enzymes, free fatty acid, and lipid profile. Although the FAR was predictive of final liver fat percent in those with NAFLD at baseline, a cause-and-effect relationship cannot be proven in this observational study.
Obesity is generally regarded as an FGF21-resistant state, and weight loss has been shown to be associated with decreasing FGF21 levels (24, 33). Although weight loss is one of the mainstay treatments for the obesity-associated complications such as NAFLD, recent studies focusing on the effect of exercise on NAFLD had shown improved steatosis even when no weight loss was achieved (34–36). Therefore, tracking weight cannot reliably reflect the changes in liver fat. On the other hand, while available evidence seems to suggest that FGF21 patterns may have promising relevance to the assessment of NAFLD status, it alone cannot fully account for differences between no steatosis, simple steatosis, or advanced stages (20, 21, 37, 38). This is mostly related to significant interindividual variations and overlapping values of circulating FGF21 concentrations in lean or obese, and in those with or without NAFLD (20). Furthermore, Dushay et al. reported lower FGF21 levels in patients with NASH compared to simple steatosis (39), and findings of Yan et al. suggest that the lack of a positive relationship between FGF21 levels and steatosis at advanced stages (40). Therefore, FGF21 by itself has limited value as an independent, stand-alone biomarker to diagnose NAFLD or stage the disease. Surprisingly, we have not shown a substantial difference in FGF21 levels among subjects with or without NAFLD in our cohort (Table 1), which could possibly be attributed to different stages of liver disease at baseline in patients with NAFLD in this cohort. Moreover, FGF21 levels were not significantly different among the loss and gain groups matched for baseline liver fat percent.
Adiponectin, as one downstream effector of FGF21, is believed to antagonize excess hepatic lipid accumulation through stimulation of fatty acid oxidation and inhibition of fatty acid synthase activity in the liver (16, 41, 42). Interestingly, the physiological relationship between these two hormones appear to be dissociated under pathological conditions such as insulin resistance and NAFLD (17) For instance, epidemiological studies in adults showed that lower baseline serum adiponectin (40, 43, 44) and higher baseline serum FGF21 levels (38) are independent predictors of NAFLD development. However, pharmacological doses of FGF21 treatment have been shown to restore this impaired relationship even in human subjects with diabetes and NAFLD, as demonstrated in a small number of clinical trials (25–27). In a randomized, double-blinded, placebo-controlled study, Charles et al. showed a positive dose-dependent relationship between PEGylated FGF21 analog treatment and serum adiponectin levels in obese patients with type 2 diabetes and NAFLD while no significant change in HOMA-IR was observed (27) Their findings provide direct evidence that FGF21 has a substantial role in the regulation of circulating adiponectin concentrations even in the absence of a change in insulin resistance state. Although the NAFLD status was only indirectly assessed, the authors showed improvements in NAFLD-associated biomarkers, which, in part, was attributed to increased adiponectin levels (27). Rodent studies have also demonstrated a positive relationship between FGF21 and adiponectin (14, 17), while also shown that the beneficial effects of FGF21 on steatosis are ablated in adiponectin knock-out mice (12, 45). These reports provide the basis that FGF21-Adiponectin Ratio (FAR) could be a promising tool to detect the presence of steatosis and even monitor the change in liver fat given the inverse relationship between FGF21 and adiponectin levels in the circulation. Our findings support this notion, as FAR in our cohort was associated with the NAFLD status even before such association was observed between FGF21 or adiponectin as individual hormones. Besides, percent change in FAR was also related to the liver fat percent at the final visit in those with NAFLD at baseline.
The importance of these findings and the utility of FAR in clinical practice requires further investigations. Current study is not designed to identify the diagnostic role of FAR as a biomarker. Although FAR level was different between subjects with or without NAFLD, there is no recommended pediatric cut-point in the literature to test the sensitivity or specificity of our results. Also, how FAR relates to other clinical markers (e.g., HOMA-IR) and the effect of such interaction on the NAFLD outcomes are yet to be determined.
There are a few limitations to our study. Although FGF21 is a potent stimulus for adiponectin secretion, it is not the only one. Proinflammatory cytokines and oxidative stress, often upregulated in obesity, have direct regulatory roles on adiponectin secretion. Since there were no significant changes in BMI z-scores throughout the follow-up period among the loss, no change, or gain groups, it allowed us to evaluate associations of liver fat and serum hormones in a weight-independent manner. Also, a lack of difference in HOMA-IR among groups further suggests that the change in FAR is likely due to the regulatory effect of FGF21 on adiponectin and not an effect of insulin resistance on the latter. However, it is acknowledged that HOMA-IR is only an indirect measure of insulin resistance and cannot reliably assess differential insulin resistance in different body sites as do the clamps studies. Another potential limitation is that the MRI method used in this study did not assess presence of fibrosis, which could have affected the FGF21 and adiponectin levels. That said, given the characteristics of the cohort (young age, no known other risk factors such as diabetes, etc.) this may have had negligible relevance. Although we did not have histological data to compare, we strongly believe that one-percent point change in liver fat is a remarkable change to produce changes in liver histology as suggested by Patel et al. (32). Furthermore, we explored different cut off points, ranging from ± 1–± 1.5% with 0.1% increments, to define these three groups (loss, no change, gain) and the resulting distribution of percent change in liver fat content between groups was similar, while the ± 1% point provided the most balanced group assignment (Supplementary Table 4). The predictive value of the FAR might, in theory, be improved by adding more biomarker variables or methods, such as transient elastography with controlled attenuated parameter (Fibroscan®, EchoSens, Paris). FibroScan is being used with increasing frequency in adults for the diagnosis and monitoring of various liver conditions. However, its utility in the pediatric population has been under-explored. Furthermore, FibroScan provides a semi-quantitative and static assessment of the liver fat, and the diagnostic cut-off points for the controlled attenuated parameter in children are currently missing (in fact, elastography measurements to assess fibrosis in children are not fully established). Thus, longitudinal studies to compare performances of the FAR and FibroScan findings in the diagnosis and monitoring of NAFLD would be helpful only when norms are established. Finally, the lack of such an association between the FAR and change in liver fat in subjects without NAFLD at baseline requires further investigation. Unfortunately, we were unable to compare between the groups defined by a change in NAFLD status due to the small number of subjects flipping NAFLD status at the end of the study period (five children with NAFLD at baseline had resolution of the NAFLD status at 6-months, and two subjects who did not have NAFLD at baseline had developed NAFLD at the final visit). Study duration was limited to 6-months to minimize the effect of pubertal progression on results, and 6-months was previously shown to be sufficient time to achieve a meaningful decline in the weight of the subjects participating in a weight management therapy primarily focusing on lifestyle interventions.
In conclusion, the FGF21-Adiponectin Ratio was associated with NAFLD status, and there was a positive correlation between FAR and final liver fat, even after controlling for sex and pubertal stage, in those with NAFLD at baseline as determined by repeated MRI scans before and after a 6-month lifestyle intervention. These findings suggest that the monitoring the change in FAR could be a promising clinical tool to help detect a clinically meaningful change in liver fat independent of or in combination with anthropometrics or routinely used biomarkers (e.g., HOMA-IR, ALT).
Data Availability Statement
The raw data supporting the conclusions of this article will be made available by the authors, without undue reservation, to any qualified researcher.
Ethics Statement
The studies involving human participants were reviewed and approved by Institutional Review Board at the University of Arkansas for Medical Sciences. Written informed consent to participate in this study was provided by the participants' legal guardian/next of kin.
Author Contributions
The authors' responsibilities were as follows: ET and SB designed the research. ET conducted the study. ET, XO, KMe, HL, KMa, RB, ED, JO, EB, SA, and JD processed and interpreted the clinical and imaging data. SB performed the statistical analyses. ET and SB wrote the manuscript. ET had primary responsibility for final content and edits. All authors read and approve the final manuscript.
Funding
This work was funded by the National Institute of General Medical Sciences of the National Institutes of Health under Award Number 5P20GM109096. ET, XO, KMe, HL, ED, EB, and SA also receive support from the US Department of Agriculture-Agricultural Research Service Project 6026-51000-012-06S.
Conflict of Interest
The authors declare that the research was conducted in the absence of any commercial or financial relationships that could be construed as a potential conflict of interest.
Acknowledgments
We thank Judith Weber, Ph.D., Reid Landes, Ph.D., and Radhika Muzumdar, M.D., for their valuable feedback and comments and Matthew Cotter and Oleksandra Pavliv for their help with the laboratory analysis of serum samples. The authors thank the participants for their time and dedication to the study, as well as the clinical research team, the Biostatistical Core, and the Metabolism and Bioenergetics Core at the Center for Childhood Obesity Prevention at the Arkansas Children's Research Institute.
Supplementary Material
The Supplementary Material for this article can be found online at: https://www.frontiersin.org/articles/10.3389/fendo.2020.00654/full#supplementary-material
Abbreviations
HbA1c, hemoglobin A1c; ALT, alanine aminotransferase; AST, aspartate aminotransferases; BMI, body mass index; DXA, dual-energy X-ray absorptiometry; FAR, Fibroblast Growth Factor 21–Adiponectin Ratio; FFA, free fatty acids; FGF21, fibroblast growth factor 21; GGT, Gamma-Glutamyl Transferase; IHTG, intrahepatic triglycerides; IR, insulin resistance; MRI, magnetic resonance imaging; NAFLD, non-alcoholic fatty liver disease.
References
1. Vos MB, Abrams SH, Barlow SE, Caprio S, Daniels SR, Kohli R, et al. NASPGHAN clinical practice guideline for the diagnosis and treatment of nonalcoholic fatty liver disease in children: recommendations from the expert committee on NAFLD (ECON) and the North American society of pediatric gastroenterology, hepatology nutrition. J Pediatr Gastroenterol Nutr. (2017) 64:319–34. doi: 10.1097/MPG.0000000000001482
2. Younossi ZM, Koenig AB, Abdelatif D, Fazel Y, Henry L, Wymer M. Global epidemiology of non-alcoholic fatty liver disease-meta-analytic assessment of prevalence, incidence and outcomes. Hepatology. (2016) 64:73–84. doi: 10.1002/hep.28431
3. Benedict M, Zhang X. Non-alcoholic fatty liver disease: an expanded review. World J Hepatol. (2017) 9:715–32. doi: 10.4254/wjh.v9.i16.715
4. Kim D, Kim WR. Nonobese fatty liver disease. Clin Gastroenterol Hepatol. (2017) 15:474–85. doi: 10.1016/j.cgh.2016.08.028
5. Kim D, Touros A, Kim WR. Nonalcoholic fatty liver disease and metabolic syndrome. Clin Liver Dis. (2018) 22:133–40. doi: 10.1016/j.cld.2017.08.010
6. Dongiovanni P, Stender S, Pietrelli A, Mancina RM, Cespiati A, Petta S, et al. Causal relationship of hepatic fat with liver damage and insulin resistance in nonalcoholic fatty liver. J Intern Med. (2018) 283:356–70. doi: 10.1111/joim.12719
7. McPherson S, Hardy T, Henderson E, Burt AD, Day CP, Anstee QM. Evidence of NAFLD progression from steatosis to fibrosing-steatohepatitis using paired biopsies: Implications for prognosis and clinical management. J Hepatol. (2015) 62:1148–55. doi: 10.1016/j.jhep.2014.11.034
8. Ajmera V, Park CC, Caussy C, Singh S, Hernandez C, Bettencourt R, et al. Magnetic resonance imaging proton density fat fraction associates with progression of fibrosis in patients with nonalcoholic fatty liver disease. Gastroenterology. (2018) 155:307–10.e2. doi: 10.1053/j.gastro.2018.04.014
9. Luukkonen PK, Nick A, Hölttä-Vuori M, Thiele C, Isokuortti E, Lallukka-Brück S, et al. Human PNPLA3-I148M variant increases hepatic retention of polyunsaturated fatty acids. JCI Insight. (2019) 4:e127902. doi: 10.1172/jci.insight.127902
10. Gu J, Liu S, Du S, Zhang Q, Xiao J, Dong Q, Xin Y. Diagnostic value of MRI-PDFF for hepatic steatosis in patients with non-alcoholic fatty liver disease: a meta-analysis. Eur Radiol. (2019) 29:3564–73. doi: 10.1007/s00330-019-06072-4
11. National Institute for Health and Care Excellence. Non-alcoholic Fatty Liver Disease: Assessment and Management. London: National Institute for Health and Care Excellence (2016).
12. Lin Z, Tian H, Lam KSL, Lin S, Hoo RCL, Konishi M, et al. Adiponectin mediates the metabolic effects of FGF21 on glucose homeostasis and insulin sensitivity in mice. Cell Metab. (2013) 17:779–89. doi: 10.1016/j.cmet.2013.04.005
13. Kliewer SA, Mangelsdorf DJ. Fibroblast growth factor 21: from pharmacology to physiology. Am J Clin Nutr. (2010) 91:254S−7S. doi: 10.3945/ajcn.2009.28449B
14. Kharitonenkov A, Wroblewski VJ, Koester A, Chen YF, Clutinger CK, Tigno XT, et al. The metabolic state of diabetic monkeys is regulated by fibroblast growth factor-21. Endocrinology. (2007) 148:774–81. doi: 10.1210/en.2006-1168
15. Tanimura Y, Aoi W, Takanami Y, Kawai Y, Mizushima K, Naito Y, et al. Acute exercise increases fibroblast growth factor 21 in metabolic organs and circulation. Physiol Rep. (2016) 4:e12828. doi: 10.14814/phy2.12828
16. Staiger H, Keuper M, Berti L, de Angelis MH, Häring HU. Fibroblast growth factor 21-metabolic role in mice and men. Endocr Rev. (2017) 38:468–88. doi: 10.1210/er.2017-00016
17. Hui X, Feng T, Liu Q, Gao Y, Xu A. The FGF21-adiponectin axis in controlling energy and vascular homeostasis. J Mol Cell Biol. (2016) 8:110–9. doi: 10.1093/jmcb/mjw013
18. Zhang Y, Lei T, Huang JF, Wang SB, Zhou LL, Yang ZQ, et al. The link between fibroblast growth factor 21 and sterol regulatory element binding protein 1c during lipogenesis in hepatocytes. Mol Cell Endocrinol. (2011) 342:41–7. doi: 10.1016/j.mce.2011.05.003
19. Emanuelli B, Vienberg SG, Smyth G, Cheng C, Stanford KI, Arumugam M, et al. Interplay between FGF21 and insulin action in the liver regulates metabolism. J Clin Invest. (2014) 124:515–27. doi: 10.1172/JCI67353
20. Giannini C, Feldstein AE, Santoro N, Kim G, Kursawe R, Pierpont B, et al. Circulating levels of FGF-21 in obese youth: associations with liver fat content and markers of liver damage. J Clin Endocrinol Metab. (2013) 98:2993–3000. doi: 10.1210/jc.2013-1250
21. Bril F, Lomonaco R, Orsak B, Chang Z, Ortiz-Lopez C, Hecht J, et al. Role of Plasma FGF21 as a Biomarker for Nonalcoholic Fatty Liver Disease (NAFLD) and Steatohepatitis (NASH): The Liver Meeting 2013: American Association for the Study of Liver Diseases (AASLD). Washington, DC: Wiley (2013).
22. Li H, Fang Q, Gao F, Fan J, Zhou J, Wang X, et al. Fibroblast growth factor 21 levels are increased in nonalcoholic fatty liver disease patients and are correlated with hepatic triglyceride. J Hepatol. (2010) 53:934–40. doi: 10.1016/j.jhep.2010.05.018
23. Barb D, Bril F, Kalavalapalli S, Cusi K. Plasma fibroblast growth factor 21 is associated with severity of nonalcoholic steatohepatitis in patients with obesity and type 2 diabetes. J Clin Endocrinol Metab. (2019) 104:3327–36. doi: 10.1210/jc.2018-02414
24. Fisher FM, Chui PC, Antonellis PJ, Bina HA, Kharitonenkov A, Flier JS, et al. Obesity is a fibroblast growth factor 21 (FGF21)-resistant state. Diabetes. (2010) 59:2781–9. doi: 10.2337/db10-0193
25. Talukdar S, Zhou Y, Li D, Rossulek M, Dong J, Somayaji V, et al. A long-acting FGF21 molecule, PF-05231023, decreases body weight and improves lipid profile in non-human primates and type 2 diabetic subjects. Cell Metab. (2016) 23:427–40. doi: 10.1016/j.cmet.2016.02.001
26. Gaich G, Chien JY, Fu H, Glass LC, Deeg MA, Holland WL, et al. The effects of LY2405319, an FGF21 Analog, in obese human subjects with type 2 diabetes. Cell Metab. (2013) 18:333–40. doi: 10.1016/j.cmet.2013.08.005
27. Charles ED, Neuschwander-Tetri BA, Pablo Frias J, Kundu S, Luo Y, Tirucherai GS, et al. Pegbelfermin (BMS-986036), PEGylated FGF21, in patients with obesity and type 2 diabetes: results from a randomized phase 2 study. Obesity. (2019) 27:41–9. doi: 10.1002/oby.22344
28. Miller RM, Chambers TL, Burns SP. Validating inbody® 570 multi-frequency bioelectrical impedance analyzer versus DXA for body fat percentage analysis. J Exerc Physiol Online Med. (2016) 19:71–8. doi: 10.1249/01.mss.0000487979.68551.d7
29. Achmad E, Yokoo T, Hamilton G, Heba ER, Hooker JC, Changchien C, et al. Feasibility of and agreement between MR imaging and spectroscopic estimation of hepatic proton density fat fraction in children with known or suspected nonalcoholic fatty liver disease. Abdom Imaging. (2015) 40:3084–90. doi: 10.1007/s00261-015-0506-9
30. Guiu B, Petit JM, Loffroy R, Salem D Ben, Aho S, Masson D, et al. Quantification of liver fat content: Comparison of triple-echo chemical shift gradient-echo imaging and in vivo proton MR spectroscopy. Radiology. (2009) 250:95–102. doi: 10.1148/radiol.2493080217
31. Satkunasingham J, Besa C, Bane O, Shah A, De Oliveira A, Gilson WD, et al. Liver fat quantification: comparison of dual-echo and triple-echo chemical shift MRI to MR spectroscopy. Eur J Radiol. (2015) 84:1452–8. doi: 10.1016/j.ejrad.2015.05.001
32. Patel J, Bettencourt R, Cui J, Salotti J, Hooker J, Bhatt A, et al. Association of noninvasive quantitative decline in liver fat content on MRI with histologic response in nonalcoholic steatohepatitis. Therap Adv Gastroenterol. (2016) 9:692–701. doi: 10.1177/1756283X16656735
33. Reinehr T, Woelfle J, Wunsch R, Roth CL. Fibroblast growth factor 21 (FGF-21) and its relation to obesity, metabolic syndrome, and nonalcoholic fatty liver in children: a longitudinal analysis. J Clin Endocrinol Metab. (2012) 97:2143–50. doi: 10.1210/jc.2012-1221
34. Ok DP, Ko K, Bae JY. Exercise without dietary changes alleviates nonalcoholic fatty liver disease without weight loss benefits. Lipids Health Dis. (2018) 17:207. doi: 10.1186/s12944-018-0852-z
35. Johnson NA, Sachinwalla T, Walton DW, Smith K, Armstrong A, Thompson MW, George J. Aerobic exercise training reduces hepatic and visceral lipids in obese individuals without weight loss. Hepatology. (2009) 50:1105–12. doi: 10.1002/hep.23129
36. Hallsworth K, Fattakhova G, Hollingsworth KG, Thoma C, Moore S, Taylor R, Day CP, Trenell MI. Resistance exercise reduces liver fat and its mediators in non-alcoholic fatty liver disease independent of weight loss. Gut. (2011) 60:1278–83. doi: 10.1136/gut.2011.242073
37. Baek J, Nam HK, Rhie YJ, Lee KH. Serum FGF21 levels in obese Korean children and adolescents. J Obes Metab Syndr. (2017) 26:204–9. doi: 10.7570/jomes.2017.26.3.204
38. Li H, Dong K, Fang Q, Hou X, Zhou M, Bao Y, et al. High serum level of fibroblast growth factor 21 is an independent predictor of non-alcoholic fatty liver disease: A 3-year prospective study in China. J Hepatol. (2013) 58:557–63. doi: 10.1016/j.jhep.2012.10.029
39. Dushay J, Chui PC, Gopalakrishnan GS, Varela-Rey M, Crawley M, Fisher FM, et al. Increased fibroblast growth factor 21 in obesity and nonalcoholic fatty liver disease. Gastroenterology. (2010) 139:456–63. doi: 10.1053/j.gastro.2010.04.054
40. Yan H, Xia M, Chang X, Xu Q, Bian H, Zeng M, et al. Circulating fibroblast growth factor 21 levels are closely associated with hepatic fat content: a cross-sectional study. PLoS ONE. (2011) 6:e24895. doi: 10.1371/journal.pone.0024895
41. Hardie DG, Pan DA. Regulation of fatty acid synthesis and oxidation by the AMP-activated protein kinase. Biochem Soc Trans. (2002) 30 (Pt. 6):1064–70. doi: 10.1042/bst0301064
42. Awazawa M, Ueki K, Inabe K, Yamauchi T, Kaneko K, Okazaki Y, et al. Adiponectin suppresses hepatic SREBP1c expression in an AdipoR1/LKB1/AMPK dependent pathway. Biochem Biophys Res Commun. (2009) 382:51–6. doi: 10.1016/j.bbrc.2009.02.131
43. Pagano C, Soardo G, Esposito W, Fallo F, Basan L, Donnini D, et al. Plasma adiponectin is decreased in nonalcoholic fatty liver disease. Eur J Endocrinol. (2005) 152:113–8. doi: 10.1530/eje.1.01821
44. Zhang H, Niu Y, Gu H, Lu S, Zhang W, Li X, et al. Low serum adiponectin is a predictor of progressing to nonalcoholic fatty liver disease. J Clin Lab Anal. (2019) 33:e22709. doi: 10.1002/jcla.22709
Keywords: fibroblast growth factor-21, adiponectin, non-alcoholic fatty liver disease, childhood obesity, intrahepatic triglyceride, magnetic resonace imaging (MRI), leptin
Citation: Tas E, Bai S, Ou X, Mercer K, Lin H, Mansfield K, Buchmann R, Diaz EC, Oden J, Børsheim E, Adams SH and Dranoff J (2020) Fibroblast Growth Factor-21 to Adiponectin Ratio: A Potential Biomarker to Monitor Liver Fat in Children With Obesity. Front. Endocrinol. 11:654. doi: 10.3389/fendo.2020.00654
Received: 03 June 2020; Accepted: 11 August 2020;
Published: 17 September 2020.
Edited by:
Shingo Kajimura, University of California, San Francisco, United StatesReviewed by:
Francesc Villarroya, University of Barcelona, SpainKerry Loomes, The University of Auckland, New Zealand
Copyright © 2020 Tas, Bai, Ou, Mercer, Lin, Mansfield, Buchmann, Diaz, Oden, Børsheim, Adams and Dranoff. This is an open-access article distributed under the terms of the Creative Commons Attribution License (CC BY). The use, distribution or reproduction in other forums is permitted, provided the original author(s) and the copyright owner(s) are credited and that the original publication in this journal is cited, in accordance with accepted academic practice. No use, distribution or reproduction is permitted which does not comply with these terms.
*Correspondence: Emir Tas, ZXRhc0B1YW1zLmVkdQ==
†These authors have contributed equally to this work