 Barbara Lawrenz1,2*
 Leyla Depret Bixio1
 Carol Coughlan1
 Claus Yding Andersen3
 Laura Melado1
 Bhanu Kalra4
 Gopal Savjani4Human M. Fatemi1
 Ajay Kumar4
- 1IVF Department, IVIRMA Middle-East Fertility Clinic, Abu Dhabi, United Arab Emirates
- 2Department of Obstetrical, Women's University Hospital Tuebingen, Tübingen, Germany
- 3Laboratory of Reproductive Biology, The Juliane Marie Centre for Women, Children and Reproduction, Copenhagen University Hospital and Faculty of Health and Medical Sciences, University of Copenhagen, Copenhagen, Denmark
- 4Ansh Labs, Webster, TX, United States
The number of mature oocytes is a key factor in the success of Assisted Reproductive Techniques (ART). Exogenous gonadotropins are administered during ovarian stimulation in order to maximize the number of oocytes available for fertilization. During stimulation, monitoring is mandatory to evaluate individual response, to avoid treatment complications and assist in the determination of the optimal day for final oocyte maturation and oocyte retrieval. Routine monitoring during stimulation includes transvaginal ultrasound examinations and measurement of serum estradiol (E2). Due to multifollicular growth of follicles of varying size, serum E2 levels are commonly supraphysiological and often variable, rendering E2-measurement during ovarian stimulation unreliable as a determinant of oocyte maturity. In contrast to serum E2, serum Inhibin A levels increase once a minimum follicle size of 12–15 mm is achieved. Due to this fact, serum Inhibin A levels could present in combination with ultrasound monitoring a more reliable parameter to determine the optimal follicle size for final oocyte maturation, as only follicles with a size of 12 mm and beyond will contribute to the serum Inhibin A level. This prospective observational, cross-sectional study demonstrates, that on the day of final oocyte maturation serum Inhibin A is strongly correlated to the number of follicles ≥15 mm (0.72) and to the number of retrieved and mature oocytes (ρ 0.82/0.77, respectively), whereas serum E2 is moderately correlated to the parameters mentioned above (ρ 0.64/0.69/0.69, respectively). With an area under the curve (AUC) of 0.91 for Inhibin A, compared to an AUC of 0.84 for E2, Inhibin A can be regarded as a better predictor for the optimal timing of trigger medication with a threshold number of ≥10 mature oocytes. It can be concluded from this data that serum Inhibin A in combination with transvaginal ultrasound monitoring may be a more powerful tool in the decision making process on trigger timing as compared to E2.
Introduction
The number of retrieved oocytes is critical to the success of IVF treatment. As a result, the aim of ovarian stimulation for IVF is to maximize the number of oocytes available for fertilization (1, 2). In order to achieve this goal, ovarian stimulation prior to IVF requires the administration of exogenous gonadotropins to support multi-follicular growth until the day of final oocyte maturation (3). Currently, ultrasonographic determination of the antral follicle count (AFC) and/or the measurement of Anti-Müllerian-Hormone (AMH) prior to stimulation start assist in the determination of the optimal gonadotropin dose to prescribe, the identification of patients at risk of developing ovarian hyperstimulation syndrome (OHSS) (4) or a low/no response during stimulation (5). Despite the assessment of these parameters as an indicator for the expected treatment response prior to cycle initiation, close monitoring of individual response to ovarian stimulation is mandatory to avoid treatment complications, facilitate individualization of treatment and assist in the determination of the optimal day for final oocyte maturation and oocyte retrieval.
Routine monitoring of ovarian stimulation for IVF/ICSI includes transvaginal ultrasound examinations (TVUS) and measurement of serum estradiol (E2) (6). With TVUS, ovarian response to gonadotropin administration is monitored by recording the size and number of developing antral follicles and serum E2 levels that reflect the collective hormonal capacity of the follicles.
In a natural cycle, aromatase activity begins to increase on cycle day 5–8 in follicles larger than 8 mm (7, 8). Upon selection, the dominant follicle in a natural cycle produces more E2 than the other follicles and the E2 level increases with the increasing size of the dominant follicle.
Whereas, in a natural cycle the serum E2 level can give an indication of follicle size and the maturation process of the oocyte, serum E2 levels in ovarian stimulation cycles are supraphysiological and often variable due to growth of multiple follicles of varying size. Therefore, E2-measurement is not reliable in ovarian stimulation cycles as the sole determinant when choosing the optimal time for administration of trigger medication. In contrast to E2, Inhibin A levels increase from a follicle size of 12–15 mm and beyond (9–11). As only follicles from these sizes onwards will contribute to the serum Inhibin A levels, the combination of serum Inhibin A measurement and TVUS could present a more reliable parameter for determining the optimal timing for administration of final oocyte medication, as compared to serum E2 plus TVUS.
Previous publications have described Inhibin A levels during stimulation (11) and correlated these levels with ART outcome (12). To date the potential of serum Inhibin A as a decision-making tool in determining the optimal timing of final oocyte maturation has never been studied.
Therefore, the aim of this prospective observational, cross-sectional study was to evaluate the role of serum Inhibin A as predictor of the number of retrieved and mature oocytes as compared to serial measurements of E2 in a routine setting of a private IVF center and to define a cut-off level of serum Inhibin A above which retrieval of ≥10 mature oocytes is likely. This study will determine if serum Inhibin A could potentially serve as decision making tool meriting inclusion of Inhibin A into routine cycle monitoring.
Materials and Methods
This observational prospective, cross-sectional study was performed in IVIRMA Fertility Clinic, Abu Dhabi, UAE, between September 2018 and January 2019. All patients, independent of the AFC as a quantitative marker of the ovarian reserve, undergoing ovarian stimulation for IVF/ICSI due to primary or secondary infertility during this time period in a GnRH-antagonist-protocol and who consented to take part in this study, were included. Only one stimulation cycle was included from each patient.
On day 2 or 3 of the period of the planned treatment cycle, prior to initiation of stimulation, a vaginal ultrasound was performed to determine the AFC. All follicles with a diameter between 2 and 10 mm in each ovary were recorded and the numbers added to determine the total AFC-count (13). In keeping with routine clinical practice patients were monitored during ovarian stimulation for IVF/ICSI treatment with serial transvaginal ultrasound examinations. Transvaginal scans were performed using a Voluson 6 (GE Healthcare, Milwaukee, WI, USA) ultrasound machine, equipped with a 7–10 MHz two-dimensional transvaginal probe. The patients were asked to empty their bladders and were placed in the lithotomy position.
During ovarian stimulation, patients were seen two or three times for ultrasound monitoring of follicular response and serum hormonal measurement in accordance with ovarian response.
Follicle size and number was determined during the course of stimulation and on the day of final oocyte maturation by vaginal ultrasound, as previously described. Follicle diameter was determined by measuring two orthogonal diameters and the mean value was recorded as follicle size.
Blood samples for this study were taken in addition to routine hormonal measurements (FSH, LH, E2 and progesterone), used for stimulation monitoring, on cycle day 2 or 3 prior to initiation of stimulation and on the day of final oocyte maturation. The blood was centrifuged for 10 min at 2,688 g (relative centrifugal force) per minute and the supernatant was retrieved and frozen at −21°C. For the measurement of serum levels of E2, Inhibin A and Inhibin B, the samples were thawed by keeping them for maximum 90 min at room temperature (~20–24°C) and analyzed the same day with the same batch of reagents.
The following demographic data per patient were recorded: age, Body Mass Index (BMI), number of infertility years and number of previous stimulations. On the day of final oocyte maturation, the total number of follicles, the number of follicles <15 and ≥15 mm and the cycle day were registered. Moreover, the number of stimulation days, the total gonadotropin dose required and the number of retrieved and mature oocytes were recorded.
Ovarian Stimulation Protocols
Ovarian stimulations were performed in Gonadotropin-Releasing-Hormone (GnRH)-antagonist-protocols, using recFSH (recombinant Follicle-stimulating-hormone) or human-Menopausal-Gonadotropin (HMG) as stimulation medication. Stimulation medication dosage was individualized prior to stimulation start in accordance with the quantitative parameters, reflecting ovarian reserve (14). During ovarian stimulation, medication dose was adjusted in line with ovarian response as determined by ultrasound scan findings and measured serum levels of E2 and progesterone (P4). In order to avoid P4 elevation during the late follicular phase a reduction in medication dose may have been warranted as determined by serial monitoring of progesterone levels (15). Final oocyte maturation was achieved by administration of either 10.000 IU of hCG, 0.3 mg of GnRH agonist (Triptorelin) or dual trigger (hCG and GnRH-analog), as soon as ≥3 follicles ≥17 mm were present, depending on the ovarian response and clinician discretion. In low responders with <3 growing follicles, medication for final oocyte maturation was given when at least 1 follicle of ≥17 mm was present. Oocyte retrieval was carried out 36 h after administration of the trigger.
Ultrasound findings and serum E2 levels formed the basis on which decisions were taken regarding cycle monitoring and trigger timing. The blood samples, obtained for study-purposes, were later analyzed for serum levels of Inhibin A, B and again for E2 in order to avoid bias through batch-to-batch inconsistencies for the herein presented analysis.
Hormonal Analysis
Inhibin A Analysis
Commercially available hypersensitive and specific immunoassays from Ansh Lab, Texas, USA were used to detect levels of Inhibin-A (AL-123). All samples were run neat in Inhibin A ELISA. Samples reading higher than the highest Calibrator in the assay were diluted 1:10 in calibrator A/sample diluent of the kit and re-assayed. The coefficient of variation for the Inhibin A assay over 10 assay runs for two kit controls at 105 and 348 pg/mL and two serum controls at 47 and 135 pg/mL was 4.7, 3.4, 4.6, and 3.9%, respectively. The calibrators in the Inhibin A ELISA are traceable to WHO reference preparation (WHO 91/624). The traceability factor is reported as slope of observed WHO preparation w.r.t. known concentration when analyzed in the ELISA. Inhibin A = 1.68 (WHO 91/624). The assay is specific to Inhibin A and does not crossreact with closely related analytes such as Inhibin B, Activin A, Activin B, Activin AB, FST-315, and FSTL3 when spiked at 50 ng/mL in analyte free matrix.
The Inhibin A in serum is stable up to 3 freeze thaw cycles. The assay is designed to measure mature Inhibin A and does not detect Activin A and Inhibin alpha fragments.
Estradiol Analysis
Estradiol measurements were performed using commercially available kits from DRG International (EIA-2693, DRG ELISA). All samples were run neat. Samples reading higher than that Calibrator F in the assay were diluted 1:10 in the calibrator A/sample diluent of the kit and re-assayed. The coefficient of variation for the E2 assay over 10 assay runs for two spiked E2 controls at 111 and 423 pg/mL and one serum control at 796 pg/mL was 9.8, 3.9, and 6.3, respectively.
Inhibin B Analysis
Commercially available hypersensitive and specific Inhibin B immunoassay (AL-107) from Ansh Lab, Texas, USA were used to detect Inhibin-B levels in serum. All samples were run neat in inhibin B ELISA. Samples reading higher than the highest Calibrator in the assays were diluted 1:10 in calibrator A/sample diluent of the kit and re-assayed. The coefficient of variation for the inhibin B assay over 12 assay runs for two kit controls at 126 and 345 pg/mL and two serum controls at 87 and 218 pg/mL was 2.0, 2.3, 3.8, and 4.0%, respectively. The calibrators in the Inhibin B ELISA are traceable to WHO reference preparation. Inhibin B = 0.4 (WHO 96/784, the WHO preparation is a mixture of Inhibin A, Inhibin B, and Inhibin alpha). The assay is specific to Inhibin B and does not cross-react with closely related analytes such as Inhibin A, Activin A, Activin B, Activin AB, AMH, FST-315, and FSTL3 when spiked at 50 ng/mL in analyte free matrix.
The Inhibin B in serum is stable up to 3 freeze thaw cycles. The assay is designed to measure mature Inhibin B and does not detect Activin B and Inhibin alpha fragments.
Statistical Analysis
Continous data are presented as mean ± SD, 95%CI, minimum and maximum values when appropriate. The assumption of normality was checked using a proc univariate. Pearson's Fisher Z-Transformation test (ρ) was used to test the strength of the correlation between Inhibin A, Inhibin B, E2 serum levels, and different variables at given cycle times. One way ANOVA was used to analyze mean changes on serum levels of Inhibin A and B, E2, and number of follicles, number of retrieved and mature ocytes as category variables. Logistic regression was used to find the Area Under the Curve (AUC) to determine the capacity of Inhibin A and E2 serum levels to predict mature oocytes. ROC curve analysis was performed, using SAS studio™ software, with Inhibin A and E2 as the classifier to predict oocyte maturity. AUC and 95% confidence intervals around the AUC were computed.
To find the optimal treshold for serum Inhibin A level to predict mature oocytes, the Youden index was calculated (Youden index = sensitivity + specificity −1). For this analysis a cut-off of ≥10 mature oocytes was applied. All analyses were performed using SAS studio (Copyright © 2018 SAS Institute Inc., Cary, NC, USA.). For interpretation of the results, a p < 0.05 was considered to be statistically significant.
Interpretation of Pearson coefficient was done according to Schober et al. (16):
0.00–0.10 = Negligible correlation
0.10–0.39 = Weak correlation
0.40–0.69 = Moderate correlation
0.70–0.89 = Strong correlation
0.90–1.00 = Very strong correlation
For interpretation of the results, a p < 0.05 was considered to be statistically significant.
Interpretation of ROC curve was done according to Li and He (17):
0.90–1 = Excellent
0.80–0.90 = Good
0.70–0.80 = Fair
0.60–0.70 = Poor
0.50–0.60 = Fail.
Ethical Approval and Trial Registration Number
This study was approved by the ethics committee of the IVIRMA Abu Dhabi Fertility Clinic, Abu Dhabi, UAE (approval number: REFA019) and was registered with clinicaltrials.gov. under the number NCT03607409.
Results
Results of blood samples and parameters from the ovarian stimulation treatment for IVF/ICSI were available from a total of 145 patients at the start of ovarian stimulation (cycle day 2/3) and from 136 patients on the day of final oocyte maturation. From nine patients there were no recorded follicle measurements and no blood test results available on the day of final oocyte maturation due to cycle cancellation for various reasons (no/low response, patient's decision to cancel treatment due to personal reasons).
The mean age (±SD) of patients evaluated was 35.4 ± 6.5 years and mean BMI was 28.2 ± 4.8 kg/m2 with a history of 3.9 ± 3.0 years of infertility and a mean number of 3.1 ± 4.2 previous stimulations. Patients' characteristics, AFC, the serum levels of Inhibin A, E2, and Inhibin B on cycle day 2 or 3, are summarized in Table 1.
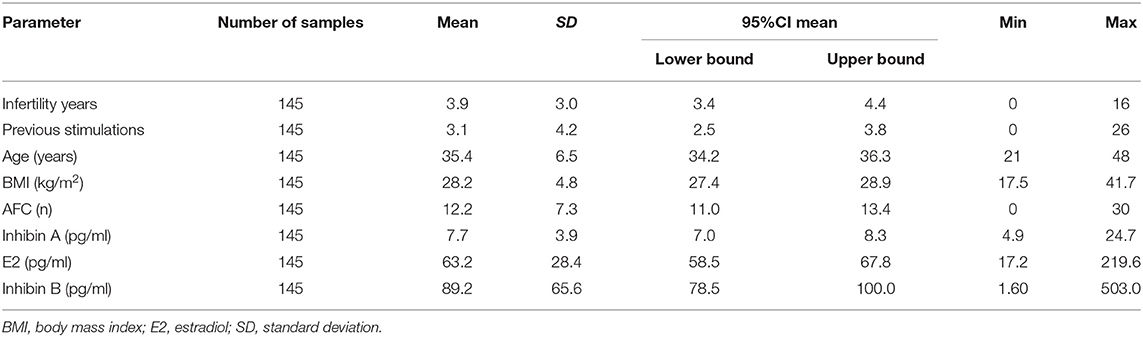
Table 1. Patients' characteristics and results of AFC, serum levels of Inhibin A, E2, and Inhibin B on cycle day 2 or 3.
A correlation test was applied in order to obtain the probability values (p-value) and the Pearson's coefficient (ρ). For the probability values, a statistically highly significant correlation was found between AFC and Inhibin B (p < 0.0001) and statistically no significant correlation between AFC and Inhibin A/E2 (p-value 0.16/0.41, respectively). The Pearson's coefficient (ρ) was moderate between AFC and Inhibin B (ρ 0.40; CI95% [0.26; 0.53]), weak/negligible between AFC and Inhibin A/E2 (ρ 0.12; CI95% [-0.04; 0.27]/−0.07; CI95% [−0.22; 0.09]), respectively.
On the day of final oocyte maturation, blood samples for Inhibin A, E2, and Inhibin B measurement were available from 136 patients. The results of hormonal measurements as well of the stimulation parameters and outcomes are listed in Table 2.
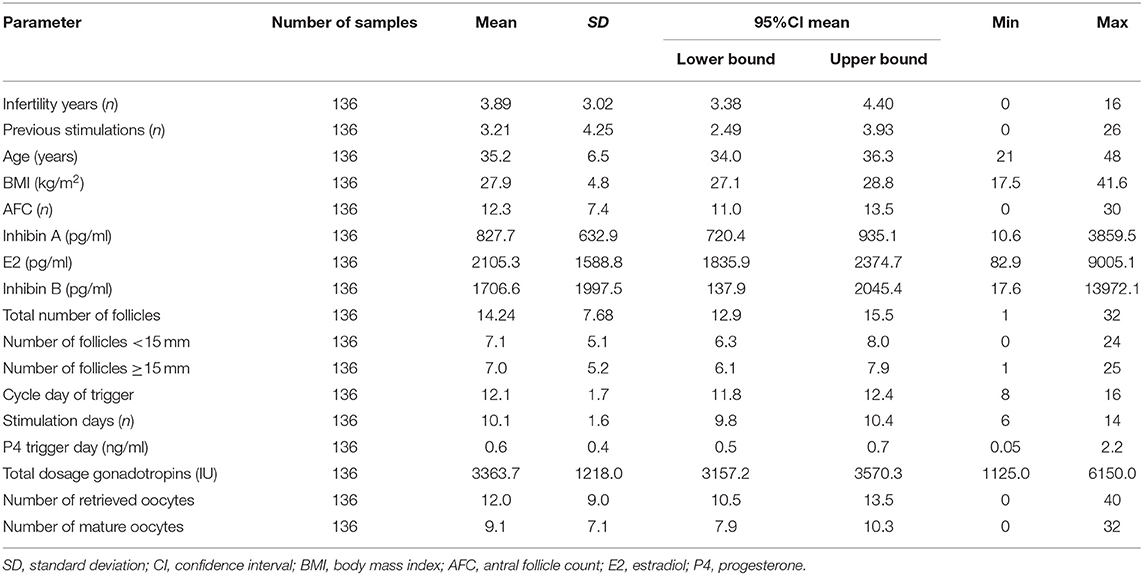
Table 2. Patients' characteristics and results of AFC, Inhibin A, estradiol, and Inhibin B on the day of final oocyte maturation.
All ultrasonographic stimulation parameters (total number of follicles, number of follicles <15 mm, number of follicles ≥15 mm) showed a statistically highly significant correlation with hormonal serum levels of Inhibin A, E2, and Inhibin B (p < 0.0001). A strong correlation was found with Pearson's coefficient between the total number of follicles and serum levels of Inhibin A, E2, and Inhibin B (0.78; CI95% [0.70; 0.84]/0.71; CI95% [0.63; 0.79]/0.73; CI95% [0.64; 0.80], respectively) and between the number of follicles ≥15 mm and Inhibin A (0.72; CI95% [0.62; 0.79]). Table 3 lists the correlations.
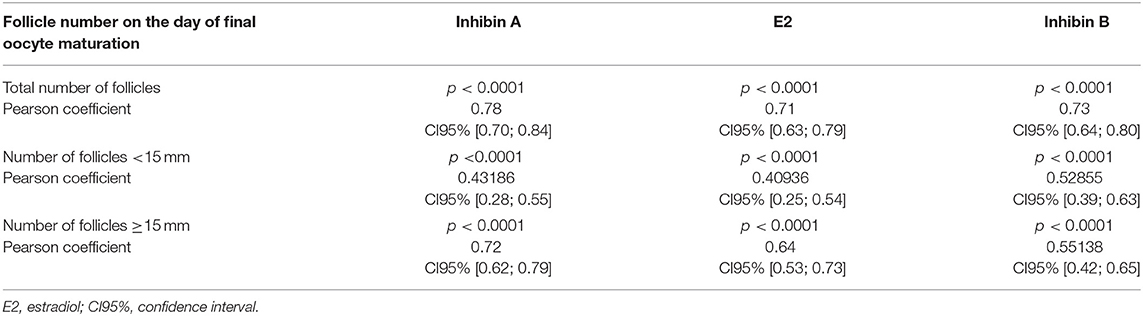
Table 3. Correlations on the day of final oocyte maturation between total numbers of follicles/numbers of follicles <15 mm/numbers of follicles ≥15 mm and Inhibin A, estradiol, and Inhibin B.
The stimulation parameters on the day of final oocyte maturation (total gonadotropin dosage, number of retrieved and mature oocytes) were statistically highly significant (p < 0.0001) correlated with the results of serum levels of Inhibin A, E2, and Inhibin B. A strong correlation was found between Inhibin A and number of retrieved oocytes and mature oocytes (ρ 0.82; CI95% [0.75; 0.86]/ρ 0.77; CI95% [0.69; 0.83]), E2 showed a moderate correlation (ρ 0.69; CI95% [0.60; 0.77]/ρ 0.69; CI95% [0.59; 0.77]), and Inhibin B a strong/moderate correlation (ρ 0.71; CI95% [0.62; 0.78]/ρ 0.65; CI95% [0.54; 0.74]), respectively. The correlations of the stimulation parameters with Inhibin A, estradiol and Inhibin B are summarized in Table 4 and Figure 1 depicts the correlations between serum Inhibin A and E2 levels and the number of retrieved and mature oocytes.
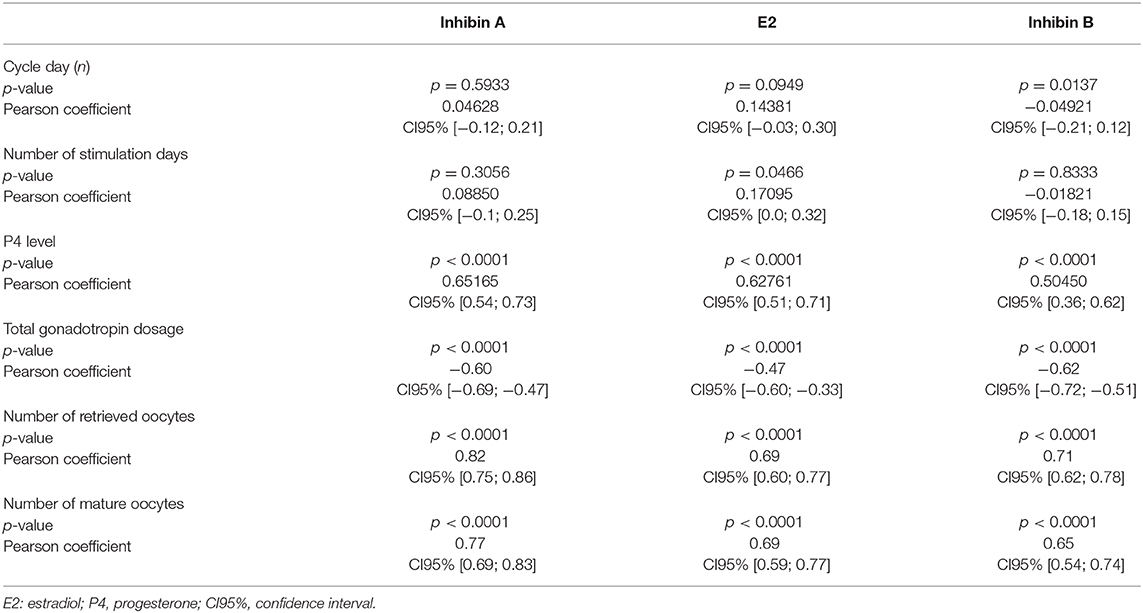
Table 4. Correlations on the day of final oocyte maturation between the stimulation parameters and Inhibin A, estradiol, and Inhibin B.
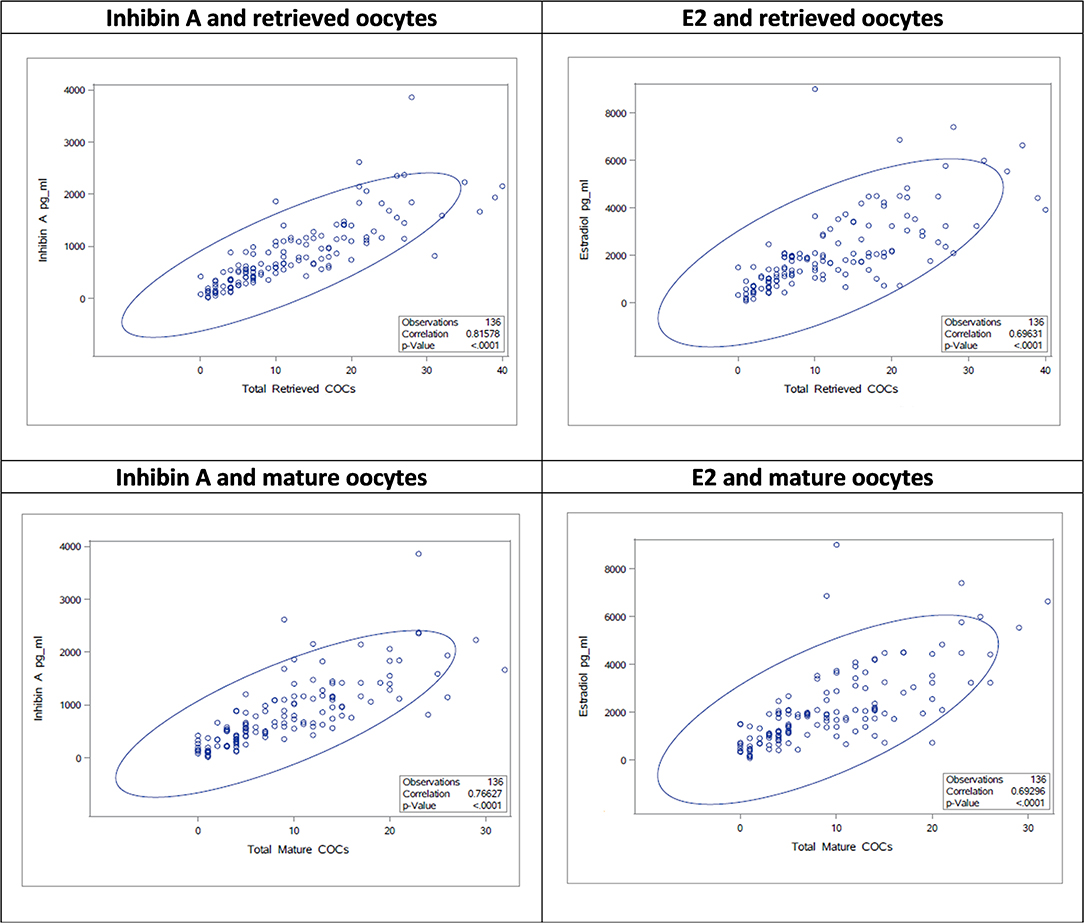
Figure 1. ROC curve analysis of Inhibin A and E2 according to the number of ≥10 mature oocytes.
A multivariate analysis was applied to evaluate the capacity of serum Inhibin A as a marker for retrieval of mature oocytes, controlling for age, and AFC on the day of final oocyte maturation. On the day of final oocyte maturation, serum Inhibin A level was found to be a predictive marker for the timing of final oocyte maturation (p < 0.0001) and was highly significantly correlated with the AFC (p < 0.0001), but not with age (p = 0.6473). The AUC for Inhibin A as a predictor for ≥10 mature oocytes was ρ 0.91 (CI95% [0.87; 0.96]) and ρ 0.84 (CI95% [0.7769; 0.9124]) for E2. The AUCs for both parameters are presented in Figure 2. The threshold level of serum Inhibin A level to predict the number of mature oocytes ≥10 (with an equivalent ratio of Sensitivity and Specificity) was 668.1 pg/mL (sensitivity = 88.0%, specificity = 82.0%).
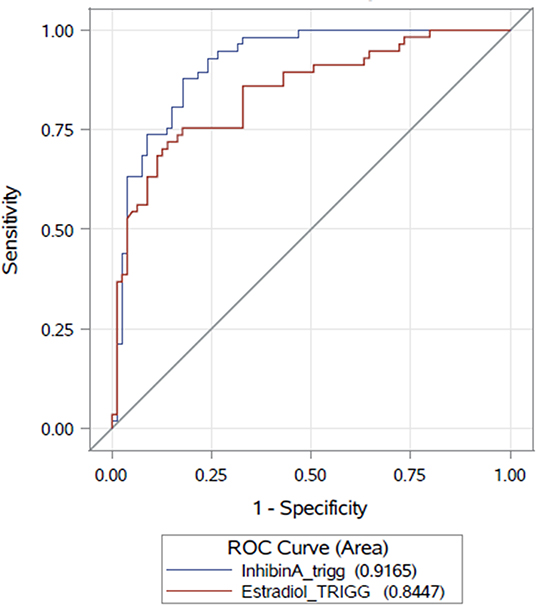
Figure 2. Correlations between Inhibin A/E2 and number of retrieved/mature oocytes as scatter plots.
In order to describe the mean, the SD (standard deviation), the 95% Confidence Interval (95%CI) as well as the ranges of the serum levels of Inhibin A and E2 depending on the number of ultrasonographic visible follicles on the day of final oocyte maturation, the follicle numbers were divided into groups and the results are presented in Supplementary Table 1. Supplementary Tables 2, 3 summarize the results of the descriptives of the serum levels of Inhibin A and E2, when analyzed according to the number of retrieved oocytes and mature oocytes.
Discussion
To the best of our knowledge, this is the largest prospective observational, cross-sectional study, measuring the levels of Inhibin A in blood samples, obtained during ovarian stimulation for IVF/ICSI, in order to evaluate the efficacy of serum Inhibin A levels as a predictive parameter for the timing of final oocyte maturation in ovarian stimulation for IVF/ICSI, in comparison to serum E2 levels.
The findings of our study demonstrate, that on the day of final oocyte maturation Inhibin A is strongly correlated to the number of follicles ≥15 mm (ρ 0.72) and to the number of retrieved and mature oocytes (ρ 0.82/0.77, respectively), whereas E2 has only moderate correlations to the parameters mentioned (ρ 0.65/0.69/0.69, respectively). With an AUC of 0.91 for Inhibin A, compared to an AUC of 0.84 for E2, serum Inhibin A levels can be regarded as a better predictor of the optimal time for administration of trigger medication with a number of ≥10 mature oocytes. As a consequence of these data it can be concluded, that serum levels of Inhibin A may represent in combination with TVUS a more accurate hormonal indicator for retrieval of mature oocytes and may be a more powerful tool in the decision making process on trigger timing as compared to serum levels of E2. Hence, it has to be stated that the clinical significance of this difference will have to be demonstrated in future studies.
Inhibin B, which is also used as a quantitative ovarian reserve parameter (18), was confirmed to be highly statistically significantly (p < 0.0001) correlated with AFC on cycle day 2 or 3 of the cycle confirming its role in assessing the existing follicle pool. Inhibin B levels were seen to increase during hormonal stimulation as a result of multifollicular growth, which is in keeping with previous reports (19). A moderate correlation was seen between Inhibin B, as well as between E2, and the number of mature oocytes. On this basis it can be concluded that the introduction of Inhibin B monitoring into routine clinical practice on the day of final oocyte maturation will not be of added benefit.
These findings do not concur with the study of Eldar-Geva et al. (20), who described a better correlation of Inhibin B with oocyte number, compared to Inhibin A and E2. The differences in the study findings may be explained by a larger sample size in our study (136 vs. 38) and a different patient population as our patients were older and had a higher BMI. Stimulation durations were approximately the same in both studies. Eldar-Geva et al. (20) stimulated either with a daily dosage of 100 or 200 IU, whereas in our population the mean stimulation dosage was 333 IU/day. Analyzing the differences in stimulation parameters in both studies, it can be assumed, that the patient population in the study of Eldar-Geva et al. (20) was predominantly composed of “good-prognosis” patients, whereas our study included patients undergoing ovarian stimulation for IVF/ICSI regardless of their ovarian reserve, a study population more closely reflecting “daily life” in an IVF center.
When serum levels of Inhibin B, E2, and Inhibin A were measured on day 5 of ovarian stimulation in a GnRH-agonist protocol, results indicated that Inhibin B may be a useful marker of follicular activity from smaller follicles at the time of recruitment and selection. On stimulation day 5, Inhibin B, but not E2, was shown to directly correlate with ovarian response. In addition, day 5 Inhibin A serum level correlated with the number of mature follicles in the late follicular phase. These study findings may be explained by the increased sensitivity of Inhibin B to the FSH-stimulus in the early follicular phase of ovarian stimulation as compared to serum levels of Inhibin A and E2, leading to an earlier rise of Inhibin B in serum (21).
Cycle monitoring is, as previously mentioned, an essential part of ART treatment and serum E2 level monitoring has been the cornerstone of ovarian stimulation cycles with gonadotropins since IVF inception. In 1990, Hardiman et al. (22) critically analyzed the correlation between serum E2 levels and ultrasonographic follicular development and demonstrated that the concentration of E2 in serum as well as in saliva correlates better with the total follicle number rather than with the number of mature follicles. They concluded that E2 serum level is a poor indicator of follicular maturity compared to ultrasound findings. In the following years, more studies investigated the added benefit of E2 measurements to the outcome of IVF treatment: In an RCT (randomized controlled trial), Golan et al. (23) monitored patients, undergoing HMG stimulation in a GnRH-agonist protocol, either with ultrasonography and serum E2 measurements or with ultrasound in isolation. No significant differences were found between the two groups in terms of HMG stimulation duration, the total gonadotropin dosage, the number of oocytes retrieved and embryos transferred and the pregnancy rates. This study concluded that addition of E2 serum level measurements to ultrasound findings during cycle monitoring does not increase the number of mature oocytes retrieved. A further study by Vandekerckhove et al. (24) concurred with this study conclusion. Moreover, the theory that a certain E2-to-oocyte ratio at the time of hCG administration would result in improved implantation, pregnancy and live-birth (25) was refuted by Lass and UK Timing of hCG Group (26), who did not find any clinical benefit to including E2 measurement as a factor to consider when deciding when to administer hCG (human Chorionic Gonadotropin) for final oocyte maturation. The updated (6) Cochrane review (27), based on 6 instead of only 2 RCTs, did not find evidence for a better outcome by the addition of E2 in cycle monitoring. Despite the absence of conclusive evidence of a benefit to E2 monitoring, the Cochrane review recommended that a combined monitoring protocol including both, TVUS and serum E2, may need to be retained as precautionary good clinical practice.
Serum levels of E2 levels are often referred to as being an important marker for the prediction of ovarian hyperstimulation syndrome (OHSS) (28), which is a severe and possibly life-threatening complication of ovarian stimulation for IVF (29). However, OHSS can also occur in patients who conceived spontaneously or in patients with low serum E2 levels on the day of final oocyte maturation, thereby challenging the “E2 myth” in OHSS prediction (30). Further studies demonstrated that the number of developing follicles (31, 32) are superior to the E2 concentration on day of final oocyte maturation for identifying patients at risk for OHSS.
Crucial to the success of ART outcome is the number of mature oocytes, available for fertilization. Hence, cycle monitoring tools should consist of parameters with the capability of identifying the optimal time for final oocyte maturation.
Ultrasonographic measurement of the follicle number and size, is an essential part of cycle monitoring and several studies have been conducted to evaluate the “optimal” follicle size for triggering ovulation. Current literature suggests that follicles of sizes 16–22 mm on the day of oocyte retrieval contribute the most to the number of oocytes retrieved and that oocytes, derived from medium size follicles (13–23 mm), have equal maturity rates, fertilization rates, and blastocyst development compared to oocytes from large size follicles (≥23 mm). These rates were significantly lower for oocytes obtained from small follicles (8–12 mm) (33–35). Follicle growth is assumed to occur at a pace of ~1.7 mm/day, theoretically resulting in a follicle size at the time of trigger administration, 34–38 h prior oocyte retrieval procedure, of 12–18 mm. Abbara et al. (36) confirmed the follicle size of 12–19 mm on the day of trigger as the size which is most likely to yield mature oocytes.
Inhibins are produced by granulosa cells and exist as heterodimeric glycoproteins, composed of an α-subunit linked to either a ßA-subunit (Inhibin A) or a ßB-subunit (Inhibin B) (37). Together with E2, Inhibin A, and Inhibin B play a role in restraining FSH in order to ensure the development of a single dominant follicle (38). Inhibin B is mainly secreted by the smaller, non-selected cohort follicles, whereas Inhibin A is mainly produced by the dominant follicle and in a natural cycle, Inhibin A levels start to rise in the late follicular phase with the presence of larger size follicles of a size of ~15 mm (11, 39). Oocytes, derived from medium size follicles have equal maturity-, fertilization-, and blastocyst development rates as compared to oocytes from large size follicles.
An Inhibin A serum level of 668.1 pg/ml could be identified as a minimum threshold above which it is likely to retrieve ≥10 mature oocytes. In light of previous publications, evaluating the association between the number of retrieved oocytes and live birth (2)/cumulative live birth rates (40) and describing a number of retrieved oocytes to maximize live birth rate as ~15 (2)/and a relatively unchanged live birth probability between seven and 20 oocytes retrieved (40), respectively, the number of ≥10 mature oocytes presents a robust marker for a successful ART outcome. The only publication referring to the number of mature oocytes in the context of live birth rates derived their data from oocyte donation cycles (41). They described the threshold number as >10 oocytes retrieved, mature oocytes, zygotes, and cleaved embryos, as significant predictors of live birth as compared to <10 of each of these variables. Therefore, Inhibin A serum level represents an excellent parameter for the planning of trigger administration and oocyte retrieval in combination with TVUS.
The strength of our study lies in the sample size and the inclusion of patients independent of their quantitative ovarian reserve parameters, representing the “real life scenario” of an IVF center. Inhibin A has the potential to serve as a decision making tool when deciding the optimal time to trigger. Limitations of the study are that some of the included patients had previously performed stimulation cycles which may have influenced the decision when to administer medication for final oocyte maturation and that Inhibin A results were not taken into account when deciding on the trigger timing and therefore Inhibin A serum level was not used as a decision-making tool in this setting.
Conclusions
The herein presented data revealed that serum levels of Inhibin A correlates better with the number of follicles ≥15 mm on the day of final oocyte maturation as well as with the number of retrieved and mature oocytes, compared to serum levels of E2. Therefore, serum Inhibin A levels may represent in combination with TVUS a promising tool for the planning of oocyte retrieval procedures. Currently there are no other studies demonstrating the predictive value of serum levels of Inhibin A on the number of mature oocytes. Large, prospective randomized studies are required to confirm our study findings and before the introduction of serum Inhibin A monitoring into routine clinical practice.
Data Availability Statement
All datasets generated for this study are included in the article/Supplementary Material.
Ethics Statement
The studies involving human participants were reviewed and approved by Ethics committee of IVIRMA Middle East Fertility Clinic Abu Dhabi, United Arab Emirates. The patients/participants provided their written informed consent to participate in this study.
Author Contributions
BL: conceptualization of the study, data analysis, drafting, and review of paper. LD: statistical analysis and review of paper. CC: review of paper and linguistic revision of paper. CA and LM: review of paper. BK: immunoassay design and hormone measurements and review of paper. GS: immunoassay design and review of paper. HF and AK: conceptualization of the study and review of paper.
Funding
This study was supported by Ansh Labs, Webster, Texas, United States. The funder provided support in the form of performing the hormonal analysis of Inhibin A, B, and E2 and salary for author BK, GS, and AK.
Conflict of Interest
BK, GS, and AK are employees of Ansh Labs. They participated in the blinded analysis of the samples, however the final data collection and statistical analysis of the results, as well as the decision to publish was taken by BL, CA, and HF. The funder did not have any additional role in the study design, data collection and analysis, decision to publish, or preparation of the manuscript. The commercial affiliation of BK, GS, and AK did not play any role in the study.
The remaining authors declare that the research was conducted in the absence of any commercial or financial relationships that could be construed as a potential conflict of interest.
Acknowledgments
We thank Prof. Leif Bungum for support in conceptualization of this study and Ms. Shieryl Digma and Ms. Jonalyn Edades for the data registration.
Supplementary Material
The Supplementary Material for this article can be found online at: https://www.frontiersin.org/articles/10.3389/fendo.2020.00307/full#supplementary-material
References
1. Malchau SS, Henningsen AA, Forman J, Loft A, Nyboe Andersen A, Pinborg A. Cumulative live birth rate prognosis based on the number of aspirated oocytes in previous ART cycles. Hum Reprod. (2019) 34:171–80. doi: 10.1093/humrep/dey341
2. Sunkara SK, Rittenberg V, Raine-Fenning N, Bhattacharya S, Zamora J, Coomarasamy A. Association between the number of eggs and live birth in IVF treatment: an analysis of 400.135 treatment cycles. Hum Reprod. (2011) 26:1768–74. doi: 10.1093/humrep/der106
3. Macklon NS, Stouffer RL, Giudice LC, Fauser BCJM. The science behind 25 years of ovarian stimulation for in vitro fertilization. Endocr Rev. (2006) 27:170–207. doi: 10.1210/er.2005-0015
4. Usta T, Oral E. Is the measurement of anti-Müllerian hormone essential? Curr Opin Obstet Gynecol. (2012) 24:151–7. doi: 10.1097/GCO.0b013e3283527dcf
5. Grisendi V, Mastellari E, La Marca A. Ovarian reserve markers to identify poor responders in the context of Poseidon classification. Front Endocrinol. (2019) 10:281. doi: 10.3389/fendo.2019.00281
6. Kwan I, Bhattacharya S, Kang A, Woolner A. Monitoring of stimulated cycles in assisted reproduction (IVF and ICSI). Cochrane Database Syst Rev. (2014) 2014:CD005289. doi: 10.1002/14651858.CD005289.pub3
7. Kristensen SG, Mamsen LS, Jeppesen JV, Bøtkjær JA, Pors SE, Borgbo T, et al. hallmarks of human small antral follicle development: implications for regulation of ovarian steroidogenesis and selection of the dominant follicle. Front Endocrinol. (2018) 8:376. doi: 10.3389/fendo.2017.00376
8. Shoham Z, Schachter M. Estrogen biosynthesis-regulation, action, remote effects, and value of monitoring in ovarian stimulation cycles. Fertil Steril. (1996) 65:687– 701. doi: 10.1016/S0015-0282(16)58197-7
9. Andersen CY. Inhibin-B secretion and FSH isoform distribution may play an integral part of follicular selection in the natural menstrual cycle. Mol Hum Reprod. (2017) 23:16–24. doi: 10.1093/molehr/gaw070
10. Laven JS, Fauser BC. Inhibins and adult ovarian function. Mol Cell Endocrinol. (2004) 225:37–44. doi: 10.1016/j.mce.2004.02.011
11. Hohmann FP, Laven JS, de Jong FH, Fauser BC. Relationship between Inhibin A and B, estradiol and follicle growth dynamics during ovarian stimulation in normo- ovulatory women. Eur J Endocrinol. (2005) 152:395–401. doi: 10.1530/eje.1.01871
12. Hall JE, Welt CK, Cramer DW. Inhibin A and Inhibin B reflect ovarian function in assisted reproduction but are less useful at predicting outcome. Hum Reprod. (1999) 14:409–15. doi: 10.1093/humrep/14.2.409
13. Practice Committee of the American Society for Reproductive Medicine. Testing and interpreting measures of ovarian reserve: a committee opinion. Fertil Steril. (2015) 103:e9–17. doi: 10.1016/j.fertnstert.2014.12.093
14. La Marca A, Sunkara SK. Individualization of controlled ovarian stimulation in IVF using ovarian reserve markers: from theory to practice. Hum Reprod Update. (2014) 20:124–40. doi: 10.1093/humupd/dmt037
15. Lawrenz B, Labarta E, Fatemi HM, Bosch E. Premature progesterone elevation: targets and rescue strategies. Fertil Steril. (2018) 109:577–82. doi: 10.1016/j.fertnstert.2018.02.128
16. Schober P, Boer C, Schwarte L. Correlation coefficients: appropriate use and interpretation. Anesthesia Analgesia. (2018) 126:1763–8. doi: 10.1213/ANE.0000000000002864
17. Li F, He H. Assessing the accuracy of diagnostic tests. Shanghai Arch Psychiatry. (2018) 30:207–12. doi: 10.11919/j.issn.1002-0829.218052
18. Committee on Gynecologic Practice. Committee opinion no. 618: ovarian reserve testing. Obstet Gynecol. (2015) 125:268–73. doi: 10.1097/01.AOG.0000459864.68372.ec
19. Urbancsek J, Hauzman E, Klinga K, Rabe T, Papp Z, Strowitzki T. Use of serum Inhibin B levels at the start of ovarian stimulation and at oocyte pickup in the prediction of assisted reproduction treatment outcome. Fertil Steril. (2005) 83:341–8. doi: 10.1016/j.fertnstert.2004.06.065
20. Eldar-Geva T, Robertson DM, Cahir N, Groome N, Gabbe MP, Maclachlan V, et al. Relationship between serum Inhibin A and B and ovarian follicle development after a daily fixed dose administration of recombinant follicle- stimulating hormone. J Clin Endocrinol Metab. (2000) 85:607–13. doi: 10.1210/jcem.85.2.6383
21. Peñarrubia J, Balasch J, Fábregues F, Carmona F, Casajitjana R, Moreno V, et al. Day 5 Inhibin B serum concentrations as predictors of assisted reproductive technology outcome in cycles stimulated with gonadotrophin-releasing hormone agonist-gonadotropin treatment. Hum Reprod. (2000) 15:1400–504. doi: 10.1093/humrep/15.7.1499
22. Hardiman P, Thomas M, Osgood V, Vlassopoulou V, Ginsburg J. Are estrogen assays essential for monitoring gonadotropin stimulant therapy? Gynecol Endocrinol. (1990) 4:261– 9. doi: 10.3109/09513599009024980
23. Golan A, Herman A, Soffer Y, Bukovsky I, Ron-El R. Ultrasonic control without hormone determination for ovulation induction in in-vitro fertilization/embryo transfer with gonadotrophin-releasing hormone analogue and human menopausal gonadotrophin. Hum Reprod. (1994) 9:1631–3. doi: 10.1093/oxfordjournals.humrep.a138764
24. Vandekerckhove F, Gerris J, Vansteelandt S, De Sutter P. Adding serum estradiol measurements to ultrasound monitoring does not change the yield of mature oocytes in IVF/ICSI. Gynecol Endocrinol. (2014) 30:649–52. doi: 10.3109/09513590.2014.912267
25. Loumaye E, Engrand P, Howles CM, O'Dea L. Assessment of the role of serum luteinizing hormone and estradiol response to follicle-stimulating hormone on in vitro fertilization treatment outcome. Fertil Steril. (1997) 67:889 −99. doi: 10.1016/S0015-0282(97)81402-1
26. Lass A, UK Timing of hCG Group. Monitoring of in vitro fertilization-embryo transfer cycles by ultrasound versus by ultrasound and hormonal levels: a prospective, multicenter, randomized study. Fertil Steril. (2003) 80:80–5. doi: 10.1016/S0015-0282(03)00558-2
27. Kwan I, Bhattacharya S, McNeil A, van Rumste MM. Monitoring of stimulated cycles in assisted reproduction (IVF and ICSI). Cochrane Database Syst Rev. (2008) 2014:CD005289. doi: 10.1002/14651858.CD005289.pub2
28. Aboulghar M. Prediction of ovarian hyperstimulation syndrome (OHSS). Estradiol level has an important role in the prediction of OHSS. Hum Reprod. (2003) 18:1140–1. doi: 10.1093/humrep/deg208
29. Humaidan P, Nelson SM, Devroey P, Coddington CC, Schwartz LB, Gordon K, et al. Ovarian hyperstimulation syndrome: review and new classification criteria for reporting in clinical trials. Hum Reprod. (2016) 31:1997–2004. doi: 10.1093/humrep/dew149
30. Orvieto R. Prediction of ovarian hyperstimulation syndrome. Challenging the estradiol mythos. Hum Reprod. (2003) 18:665–7. doi: 10.1093/humrep/deg166
31. Papanikolaou EG, Pozzobon C, Kolibianakis EM, Camus M, Tournaye H, Fatemi HM, et al. Incidence and prediction of ovarian hyperstimulation syndrome in women undergoing gonadotropinreleasing hormone antagonist in vitro fertilization cycles. Fertil Steril. (2005) 85:112–20. doi: 10.1016/j.fertnstert.2005.07.1292
32. Tarlatzi TB, Venetis CA, Devreker F, Englert Y, Delbaere A. What is the best predictor of severe ovarian hyperstimulation syndrome in IVF? A cohort study. J Assist Reprod Genet. (2017) 34:1341–51. doi: 10.1007/s10815-017-0990-7
33. Andersen CY. Characteristics of human follicular fluid associated with successful conception after in vitro fertilization. JCEM. (1993) 77:1227–34. doi: 10.1210/jc.77.5.1227
34. Revelli A, Martiny G, Delle Piane L, Benedetto C, Rinaudo P, Tur-Kaspa I. A critical review of bi-dimensional and three-dimensional ultrasound techniques to monitor follicle growth: do they help improving IVF outcome? Reprod Biol Endocrinol. (2014) 12:107. doi: 10.1186/1477-7827-12-107
35. Wirleitner B, Okhowat J, Vištejnová L, Králíčková M, Karlíková M, Vanderzwalmen P, et al. Relationship between follicular volume and oocyte competence, blastocyst development and live-birth rate: optimal follicle size for oocyte retrieval. Ultrasound Obstet Gynecol. (2018) 51:118–25. doi: 10.1002/uog.18955
36. Abbara A, Vuong LN, Ho VNA, Clarke SA, Jeffers L, Comninos AN, et al. Follicle size on day of trigger most likely to yield a mature oocyte. Front Endocrinol. (2018) 9:193. doi: 10.3389/fendo.2018.00193
37. De Kretser DM, Robertson DM. The isolation and physiology of inhibin and related proteins. Biol Reprod. (1989) 40:33–47. doi: 10.1095/biolreprod40.1.33
38. Welt CK. Regulation and function of inhibins in the normal menstrual cycle. Semin Reprod Med. (2004) 22:187–93. doi: 10.1055/s-2004-831894
39. Roberts VJ, Barth S, el-Roeiy A, Yen SS. Expression of inhibin/activin subunits and follistatin messenger ribonucleic acids and proteins in ovarian follicles and the corpus luteum during the human menstrual cycle. J. Clin Endocrinol Metab. (1993) 77:1402–10. doi: 10.1210/jcem.77.5.8077341
40. Polyzos NP, Drakopoulos P, Parra J, Pellicer A, Santos-Ribeiro S, Tournaye H, et al. Cumulative live birth rates according to the number of oocytes retrieved after the first ovarian stimulation for in vitro fertilization/intracytoplasmic sperm injection: a multicenter multinational analysis including ~15,000 women. Fertil Steril. (2018) 110:661–70. doi: 10.1016/j.fertnstert.2018.04.039
Keywords: Inhibin A, Inhibin B, estradiol, ovarian stimulation, oocyte maturity
Citation: Lawrenz B, Depret Bixio L, Coughlan C, Andersen CY, Melado L, Kalra B, Savjani G, Fatemi HM and Kumar A (2020) Inhibin A—A Promising Predictive Parameter for Determination of Final Oocyte Maturation in Ovarian Stimulation for IVF/ICSI. Front. Endocrinol. 11:307. doi: 10.3389/fendo.2020.00307
Received: 25 February 2020; Accepted: 22 April 2020;
Published: 15 May 2020.
Edited by:
Katja Teerds, Wageningen University, NetherlandsReviewed by:
Waljit Dhillo, Imperial College London, United KingdomJing Xu, Oregon Health and Science University, United States
Copyright © 2020 Lawrenz, Depret Bixio, Coughlan, Andersen, Melado, Kalra, Savjani, Fatemi and Kumar. This is an open-access article distributed under the terms of the Creative Commons Attribution License (CC BY). The use, distribution or reproduction in other forums is permitted, provided the original author(s) and the copyright owner(s) are credited and that the original publication in this journal is cited, in accordance with accepted academic practice. No use, distribution or reproduction is permitted which does not comply with these terms.
*Correspondence: Barbara Lawrenz, YmFyYmFyYS5sYXdyZW56JiN4MDAwNDA7aXZpcm1hLmNvbQ==