 Oana Pînzariu
 Bogdan Georgescu2
 Carmen E. Georgescu
- 16th Department of Medical Sciences, Department of Endocrinology, Iuliu Hatieganu University of Medicine and Pharmacy, Cluj-Napoca, Romania
- 2Department of Ecology, Environmental Protection and Zoology, University of Agricultural Sciences and Veterinary Medicine Cluj-Napoca, Cluj-Napoca, Romania
- 3Endocrinology Clinic, Cluj County Emergency Clinical Hospital, Cluj-Napoca, Romania
Background: Metabolomics—the novel science that evaluates the multitude of low-molecular-weight metabolites in a biological system, provides new data on pathogenic mechanisms of diseases, including endocrine tumors. Although development of metabolomic profiling in pituitary disorders is at an early stage, it seems to be a promising approach in the near future in identifying specific disease biomarkers and understanding cellular signaling networks.
Objectives: To review the metabolomic profile and the contributions of metabolomics in pituitary adenomas (PA).
Methods: A systematic review was conducted via PubMed, Web of Science Core Collection and Scopus databases, summarizing studies that have described metabolomic aspects of PA.
Results: Liquid chromatography tandem mass spectrometry (LC-MS/MS) and nuclear magnetic resonance (NMR) spectrometry, which are traditional techniques employed in metabolomics, suggest amino acids metabolism appears to be primarily altered in PA. N-acetyl aspartate, choline-containing compounds and creatine appear as highly effective in differentiating PA from healthy tissue. Deoxycholic and 4-pyridoxic acids, 3-methyladipate, short chain fatty acids and glucose-6-phosphate unveil metabolite biomarkers in patients with Cushing's disease. Phosphoethanolamine, N-acetyl aspartate and myo-inositol are down regulated in prolactinoma, whereas aspartate, glutamate and glutamine are up regulated. Phosphoethanolamine, taurine, alanine, choline-containing compounds, homocysteine, and methionine were up regulated in unclassified PA across studies. Intraoperative use of ultra high mass resolution matrix-assisted laser desorption/ionization mass spectrometry imaging (MALDI-MSI), which allows localization and delineation between functional PA and healthy pituitary tissue, may contribute to achievement of complete tumor resection in addition to preservation of pituitary cell lines and vasopressin secretory cells, thus avoiding postoperative diabetes insipidus.
Conclusion: Implementation of ultra high performance metabolomics analysis techniques in the study of PA will significantly improve diagnosis and, potentially, the therapeutic approach, by identifying highly specific disease biomarkers in addition to novel molecular pathogenic mechanisms. Ultra high mass resolution MALDI-MSI emerges as a helpful clinical tool in the neurosurgical treatment of pituitary tumors. Therefore, metabolomics appears to be a science with a promising prospect in the sphere of PA, and a starting point in pituitary care.
Introduction
Metabolomics, one of the newest “omics” sciences, assesses small molecules with molecular mass below 1,500 Da (1) within various bio-fluids (e.g., serum, plasma, cerebrospinal fluid, urine, saliva etc.) or tissues, to potentially set correlates to physiological or pathological status of an organism. Given its contribution to the understanding of cellular signaling mechanisms, in addition to identification and quantification of novel biomarkers in various clinical conditions, metabolomics is underpinning the development of personalized medicine.
Metabolites include carbohydrates, amino acids, nucleic acids, lipids, vitamins, organic acids, polyphenols, alkaloids, and inorganic species. A range of analytical techniques is applied, with either nuclear magnetic resonance (NMR), also known as magnetic resonance spectroscopy (MRS), or, more frequently, mass spectrometry (MS)-based platforms being routinely employed in assessing the metabolic fingerprint, the later method as a combination with other analysis techniques (i.e., gas-chromatography-mass spectrometry (GC-MS), liquid chromatography-mass spectrometry (LC-MS) (2, 3), ultra-performance liquid-chromatography tandem mass spectrometry (UPLC–MS/MS) (4, 5), ultra-high performance liquid chromatography-quadrupole time-of-flight mass spectrometry (UHPLC/Q-TOF-MS) (6, 7), capillary electrophoresis (CE-MS) (8, 9) or matrix-assisted laser desorption/ionization mass spectrometry (MALDI-MS) (10, 11) etc.) to overcome the limitations of MS, such as erroneous interpretation of the metabolomic analysis in presence of impurities or modest reproducibility of the method (12, 13). Further, complex informatics tools (e.g., principal component analysis, Mascot search etc.) that significantly improve identification of metabolomic panels by multivariate statistical analysis are integrated into most types of equipment.
Ionization of atoms and molecules followed by their separation according to the mass/charge ratio is a key principle of MS-based techniques; the methods most commonly used being electrospray ionization and electron impact ionization, followed by atmospheric pressure photoionization and atmospheric pressure chemical ionization (14).
Although sensitivity of MS is clearly superior to NMR spectrometry, the later is increasingly employed because the method is fast, highly reproducible and does not require additional steps of biological samples preparation, including separation and derivatization (15). In addition, NMR spectrometry can identify unknown compounds with identical masses, even those with different isotopic distribution.
The basic principle of NMR spectrometry consists of the spinning of atomic nuclei. The most common nuclei used in this technique are 1H (proton), 13P (phosphorus), 15N (nitrogen) and 13C (carbon), the highest sensitivity being attributed to 1H (16). With the time, MRS has proven to be a highly used and non-invasive technique in cerebral tumors, particularly in vivo MRS, using brain MRI images (17). The technique allows identification of various metabolites by obtaining signals from a cerebral region of interest (ROI), more exactly a three-dimensional volume of this region measuring at least 1 cm3 or the so-called voxel (18). However, a considerable disadvantage using this technique is the identification of a limited number of metabolites, those with extremely high concentrations (17).
Matrix-assisted laser desorption/ionization mass spectrometry imaging (MALDI-MSI) profiles as a valuable method that is able to identify peptides and proteins with a mass of up to 50,000 Da (19–21). In view of this aspect, MALDI-MSI appears to be useful in approaching pituitary gland disorders, since most of the pituitary hormones are proteins or peptides. The underlying principle of MALDI-MSI is to use a matrix that absorbs the energy emitted from an ultraviolet or infrared laser beam, followed by desorption and ionization of the analyzed metabolite, similarly to electrospray ionization (19). The method is fast and highly sensitive (22). Implementation of MALDI-MSI has made it possible to shift from assessing the metabolic fingerprint in biological products such as plasma, serum or urine directly to tissue sections.
A major advantage of the development of this technique is the correlation of MALDI-MSI results with the tumor histopathology, thus the demarcation of the tumor contour can be established. Further, MALDI-MSI is able to identify new biomarkers in an in situ context (i.e., paraphin embedded tissue or fixed tissue sections), while the combination of MALDI-MSI with computed tomography (CT), magnetic resonance imaging (MRI) or positron emission tomography (PET) imaging aims to improve the future approach to research (22).
Whichever technique is used, untargeted metabolomic analysis allows rapid and global description of a large number of metabolites (e.g., lipids, amino acids etc.), termed metabolomic fingerprint in a single sample that subsequently is subjected to interpretation and validation to define differences between physiological and pathological conditions (15, 23–25); while, targeted metabolomic analysis consists of the qualitative and quantitative assessment of a small number of preselected well known metabolites that are specific to a particular metabolic pathway (15).
The future prospects for improving the identification and quantification of metabolites are the combination of NMR spectrometry (MRS) and MS (26).
In past years, metabolomics has considerably developed in the field of endocrinology, including diabetes mellitus (27–30), obesity (27, 31, 32), polycystic ovary syndrome (33–37), thyroid cancer (38–41), osteoporosis (42, 43) and particularly adrenal diseases, i.e., adrenal cancer, Cushing's syndrome (44, 45), primary aldosteronism (46, 47) and pheochromocytoma (48) and resulted in description of novel cellular and molecular signaling mechanisms and characterization of complex panels of biomarkers of risk.
Metabolomics in pituitary disorders is currently at an early stage. In 2014, Höybye et al. (49) conducted a pilot study comparing serum metabolites in adult patients with growth hormone deficiency (GHD) to a healthy control group. The endpoint was to identify potential biomarkers for the diagnosis of GHD, concomitantly aiming to draw up a metabolomics-based individualized recombinant human GH (rhGH) replacement treatment protocol among affected subjects. Metabolomics analysis performed by GC-MS identified a number of 285 untargeted metabolites, 13 of them differentiating between patients with GHD and controls. Among these, lower levels of threonic acid, cystine, cysteine and palmitoleic acid and higher levels of glutamic acid, glyceric acid, aspartic acid, uridine and hypoxanthine-like were reported in adult GHD. Furthermore, rhGH treatment caused a decrease in levels of glutamic and glyceric acid and an increase in levels of hexadecanoic and palmitoleic acid.
Recently, Zhan and Desiderio (50) described the remarkable contribution that “omics” sciences, including metabolomics, will play in understanding the heterogeneity of pituitary adenomas (PA). The present review will focus on the contribution that metabolomics analysis techniques might provide to improve the diagnosis of PA, aiming to shed light on some molecular mechanisms underlying their tumor development.
Materials and Methods
Search Strategy and Eligibility Criteria
A systematic review of the literature was conducted independently by two of the authors via PubMed, Web of Science Core Collection and Scopus databases until 11th December 2018, using following keywords: metabolomics pituitary adenoma/tumor, metabolomic biomarker pituitary adenoma/tumor, metabolomic analysis pituitary adenoma/tumor, metabolomic profile pituitary adenoma/tumor, metabolites pituitary adenoma, LC-MS pituitary adenoma/tumor, GC-MS pituitary adenoma/tumor, NMR spectrometry pituitary adenoma/tumor, MALDI pituitary adenoma/tumor, deoxycholic acid pituitary adenomas, 4-pyridoxic acid pituitary adenomas, phosphoethanolamine pituitary adenomas, alanine pituitary adenomas, N-acetyl aspartate pituitary adenomas, myo-inositol pituitary adenomas, 3-methyladipate pituitary adenomas, glutamate pituitary adenomas, glutamine pituitary adenomas, taurine pituitary adenomas. Search keywords included specific metabolites to optimize data selection. The endpoint was to perform an overview of metabolomic aspects relevant to the approach of PA and potentially provide a source of detection and treatment targets for pituitary tumors. Inclusion criteria were represented by (1) studies that have evaluated the metabolomic profile or metabolomic biomarkers associated with PA or the contribution of NMR spectrometry and MS-based techniques in PA, (2) studies written in English, and (3) studies on human subjects. Exclusion criteria included (1) absence of PA group, (2) evaluation of other types of pituitary tumors, (3) studies that provide insufficient data on metabolomics in PA, (4) studies including overlapping groups of patients, (5) studies written in languages other than English, (6) proteomics studies, (7) high molecular weight compounds studies, and (8) reviews. According to the flowchart (Figure 1), 1,107 articles were included for analysis by searching electronic databases. Additionally, an article has been added to our research through hand searching (51). Duplicate (n = 389) and irrelevant (n = 692) articles were excluded. An article was excluded due to insufficient data on metabolomics in PA (52). Three articles studied the same group of patients with PA (53–55), so only the last one (55) was included in our review, the other two being excluded (53, 54). An article was excluded because it was not written in English (56). Two articles were excluded because they provided proteomics data (57, 58) and another article was excluded, evaluating compounds with a molecular weight greater than 1,500 Da (59). A study that evaluated other types of pituitary tumors (60) and a review (61) were also excluded. Finally, 18 studies enrolling 241 patients with PA were eligible for our review (Table 1). Of these, 8 articles described in vivo MRS approach in PA, providing specific metabolites measurements.
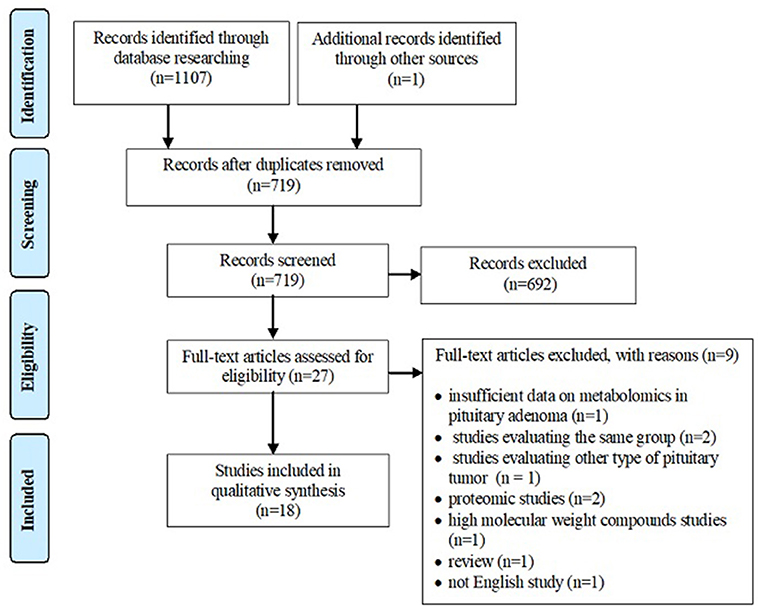
Figure 1. PRISMA style flowchart of the selected studies.
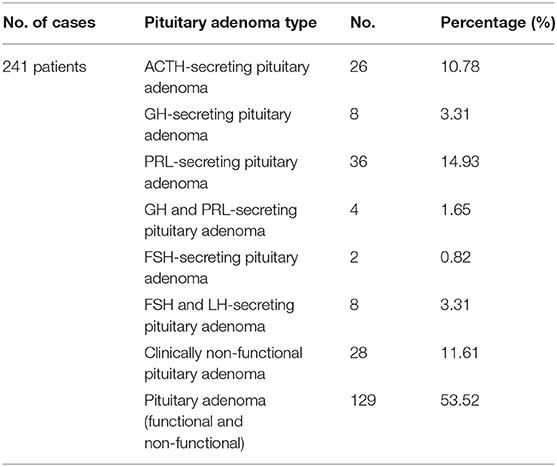
Table 1. Clinical cases of pituitary adenomas (PA) included for metabolomics analysis.
Study Quality Assessment
Assessment of the quality of included studies was performed using the QUADAS2 tool (62) following four domains: patient selection, index test, reference standard and flow and timing. The index test was represented by metabolomic analysis. Histopatological examination was the reference standard for PA diagnosis. We evaluated the risk of bias using all four domains of QUADAS2 tool. We also used the first three domains for the concern regarding applicability.
Results
Metabolomics vs. Immunohistochemistry in Functional PA
Calligaris et al. (63) demonstrated the specific endocrine functionality of both non-pathological pituitary tissue (6 samples) and pituitary tumors (45 samples), using MALDI-MSI. The purpose of this study was to locate functional PA and to identify the delineation between them and healthy pituitary tissue, an aspect of potentially key relevance, especially during surgery, on one hand facilitating total adenoma resection and on the other hand preserving vasopressin secretory cells within the neurohypophysis and pituitary stalk, thus avoiding central diabetes insipidus, the most common postoperative complication. In a first step, using positive-mode MALDI-MS, the metabolic fingerprint of non-pathological pituitary tissue was assessed, to confirm presence of vasopressin and neurophysin 2 in the neurohypophyseal tissue in addition to GH, α-melanocytic stimulation hormone (MSH), adrenocorticotrophic hormone (ACTH), β-endorphin, joining peptide, γ-lipotrophin (LPH), and β-LPH in the anterior pituitary (Table 2). Afterwards, using matrix sublimation/recrystallization, prolactin (PRL) was identified in the lactotrophic area of the anterior lobe, in addition to detection of neurophysin 1 in the posterior pituitary. The distribution of these metabolites, reported by this study, highly corresponds to the immunohistochemical distribution of hormones within the pituitary gland (79).
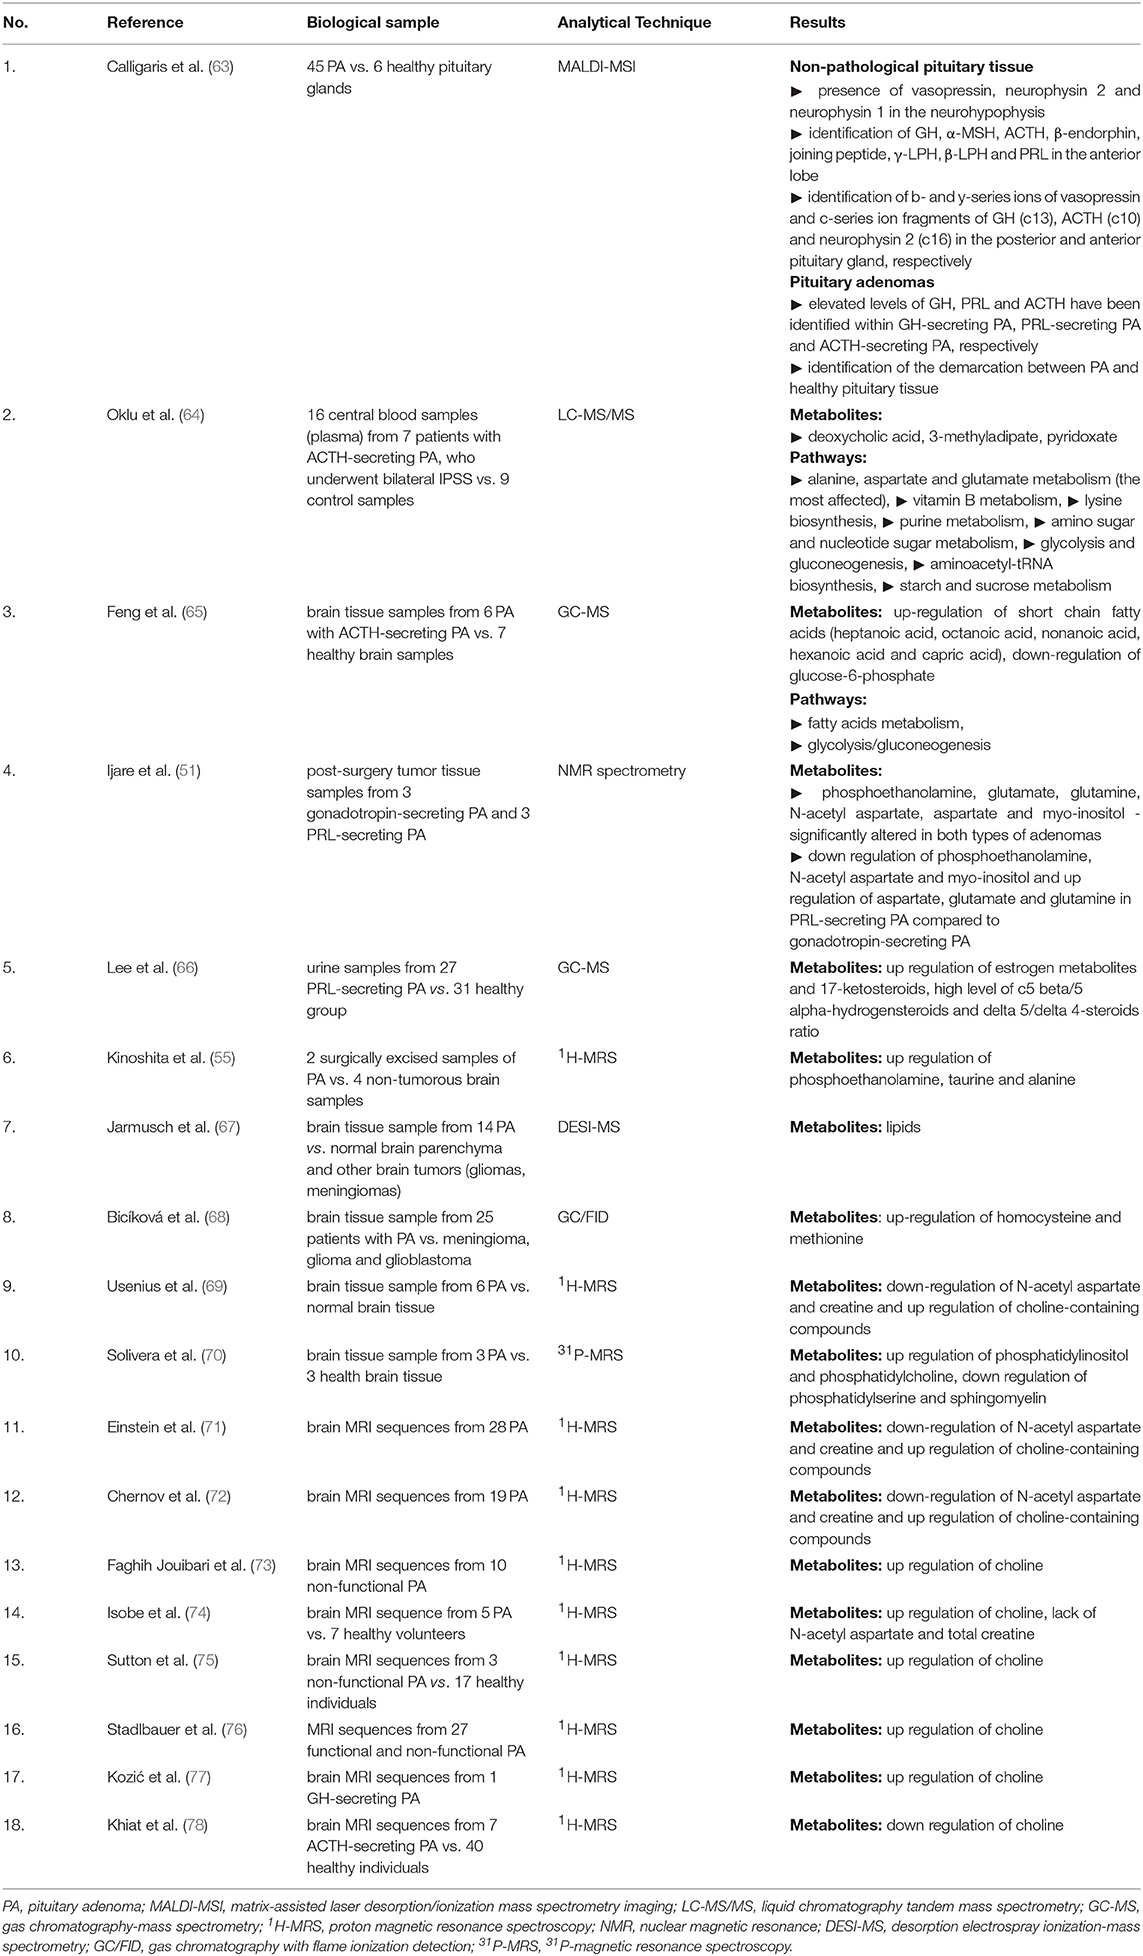
Table 2. Metabolomic aspects in pituitary adenomas (PA).
GH, ACTH and neurophysin 2 were identified by Mascot searches. In addition, secretion of these peptides was confirmed by MALDI in-source decay (ISD) fragmentation, by identification of c-series ion fragments of GH (c13), ACTH (c10) and neurophysin 2 (c16) in the anterior and posterior pituitary gland. Moreover, the identification of b- and y-series ions of vasopressin was possible using MALDI time-of-flight/time-of-flight mass spectrometry (MALDI TOF/TOF).
In his study, Calligaris et al. (63) included ACTH- (n = 6), GH- (n = 7), PRL- (n = 6), GH- and PRL- (n = 4), FSH- (n = 2), FSH- and LH-secreting PA (n = 5) and clinically non-functional PA (n = 15). In the majority of cases, metabolomics analysis confirmed hormonal hypersecretion within pituitary tumor cells in agreement to clinical and biochemical suspicion. Metabolomics data correlated with histopathological findings, including haematoxylin-eosin and reticulin staining, respectively. Therefore, identification of intact GH and the c13 ion fragment, corroborated with a disruption of reticulin fiber network diagnosed GH-secreting PA. In the same manner, identification of intact ACTH and the c10 ion fragment, corroborated with a disruption of reticulin fiber network diagnosed ACTH-secreting PA.
Besides the ability to confirm pituitary hypersecretion, MALDI-MSI seems to be a good approach in differentiating pituitary tumor tissue from intact pituitary tissue with an overall specificity (Sp) of 93% and a sensitivity (Se) of 83%. To be emphasized, sensitivity was highly variable among various types of PA, reaching 100% in ACTH-secreting PA but only 50% in prolactinomas and 82% in GH-secreting PA. On the contrary, specificity was high, irrespective of the type of PA (i.e., 93% in ACTH-secreting PA and 100% in PRL- and GH-secreting PA, respectively).
Metabolomic Pathways in ACTH-Secreting PA
In a metabolomics research, Oklu et al. (64) evaluated 8 patients with suspicion of Cushing's disease in whom clinical features of hypercorticism were present (i.e., weight gain, hypertension, osteoporosis, easy bruising, moon face, fatigue, diabetes mellitus, and hirsutism), nonetheless with indeterminate pituitary imaging.
To confirm diagnosis, all patients underwent bilateral inferior petrosal sinus sampling (IPSS). ACTH-secreting PA was confirmed in 7 patients, while in one patient the diagnosis was excluded. The metabolic profile was determined in plasma samples from the ipsilateral IPS of patients (7 samples) and compared to contralateral samples plus two samples from the patient in whom ACTH hypersecretion failed to be confirmed (9 samples).
Postoperative follow-up showed improvement of symptomatology in 4 patients and disease remission in the remaining three.
Using LC-MS/MS, 12 distinct metabolites were reported in patients with ACTH-secreting PA in comparison to the control group, specifically 2-hydroxybutyric acid, aminoadipic acid, L-aspartic acid, 3-hydroxyphenylacetic acid, hypoxanthine, 4-pyridoxic acid, quinolinic acid, sucrose, xanthine, glucose 6-phosphate, deoxycholic acid, and 3-methyladipate. After Bonferroni adjustment, however, only deoxycholic and 4-pyridoxic acids and 3-methyladipate remained statistically significant (Table 2).
Using Kyoto Encyclopedia of Genes and Genomes (KEGG) pathway database, 8 main pathways affected in Cushing's disease were identified (64) that involved: (1) Alanine, aspartate and glutamate metabolism, which appeared to be the most affected metabolic pathway, (2) Vitamin B metabolism, (3) Lysine biosynthesis, (4) Purine metabolism, (5) Amino sugar and nucleotide sugar metabolic pathways, (6) Glycolysis and gluconeogenesis pathways, (7) Aminoacetyl-tRNA biosynthesis, and (8) Starch and sucrose metabolism (Table 2).
Recently, Feng et al. (65) conducted a metabolomic (via GC-MS) and proteomic study in a group of patients with ACTH-secreting PA. For metabolomic analysis, the author included brain tumor samples from 6 patients with ACTH-secreting PA vs. healthy brain tissue from 7 control subjects. It was found that short chain fatty acids (heptanoic acid, octanoic acid, nonanoic acid, hexanoic acid and capric acid) were up regulated, while glucose-6-phosphate was down regulated. Thus the metabolomic pathways involved in PA were the metabolism of fatty acids and glycolysis/gluconeogenesis (Table 2).
Metabolomics Studies in Gonadotropin- and PRL-Secreting PA
In 2017, Ijare et al. (51) used ex vivo NMR spectrometry to assess the metabolomic profile of postoperative pituitary tissue sampled from patients with gonadotropin- and PRL-secreting PA, respectively, with the main finding that both types of PA contain central nervous system metabolites such as phosphoethanolamine, glutamate, glutamine, N-acetyl aspartate, aspartate, and myo-inositol.
When comparing these two types of PA, it was found that phosphoethanolamine, N-acetyl aspartate and myo-inositol are down regulated in prolactinoma, whereas aspartate, glutamate and glutamine are up regulated (Table 2). Ijare's study is currently underway, so a larger number of patients could provide additional insights into the evaluation of the metabolomic fingerprint in these types of pituitary tumors. However, a true control group was apparently not considered, a major limitation of this study.
Lee et al. (66) conducted a study of 26 women with PRL-secreting PA compared to 31 healthy controls, analyzing their urine using GC-MS. A high level of all estrogen metabolites and 17-ketosteroids in the urine of these patients was shown. In addition, high c5 beta/5 alpha-hydrogensteroids and delta 5/delta 4-steroids ratios were identified (Table 2).
Metabolites of PA Compared to Other Brain Tumors
In 2015, Jarmusch et al. (67) performed a study of 58 brain tumors, including 14 patients with PA, the rest of the tumors being gliomas, astrocytomas and meningiomas. Analyzing brain tissue samples through desorption electrospray ionization (DESI)-MS, the author identified lipid peaks, which allow differentiation of PA from normal brain parenchyma and other brain tumors (gliomas, meningioma), respectively (Table 2). Moreover, the discriminant model of brain tumors using DESI-MS shows an overall Sp of 99.7% and Se of 99.4%. The metabolomic profile was explicitly described in the case of gliomas, indicating a decrease in N-acetyl aspartate and 2-hydroxyglutaric acid, while this was not very well achieved in PA.
Bicíková et al. (68) analyzed tumoral brain tissue samples from 25 patients with PA within a series of brain tumors, using GC with flame ionization detection (GC/FID). Patients with PA presented a marked increase in homocysteine. Homocysteine was also increased in patients with glioblastoma. At the opposite pole, meningiomas and gliomas were characterized by low level of homocysteine. Likewise, PA were characterized by an increased level of methionine, while gliomas exhibited low levels of this amino acid (Table 2).
A large body of evidence resulted from MRS-based studies (55, 69, 70) to show alterations of phospholipid metabolism in PA tumor samples as evidenced by high levels of phosphoetanolamine (55), phosphatidylcholine (69, 70) and phosphatidylinositol (70) concentrations (Table 2). The pattern is not specific, as phosphoetanolamine and choline-containing compounds were abundantly present in meningioma (55), medulloblastoma (80), glioblastoma (81) and malignant lymphoma tumor samples (70). Cerebral metastases from hepatocellular carcinoma presented high concentrations of choline-containing compounds, while craniopharyngiomas showed decreased levels of these (55). Elevated alanine but low N-acetyl-aspartate concentrations were reported in PA, nonetheless, a similar pattern was apparent in meningioma and gliomas (55, 69). Additionally, a high level of taurine was observed in PA, medulloblastoma and cerebral metastases with kidney starting point (55, 80) (Table 2). Ependymoma presented an increased level of myo-inositol, whereas pilocytic astrocytoma exhibited increased levels of fatty acids (80).
An increased concentration of glycine was linked to neuroectodermal tumors (81), while neurinomas, glioblastomas (55) and ependymomas (80) showed a high peak of myo-inositol.
PA Metabolites by in vivo Proton MRS
A series of studies performed single vortex proton (1H)-MRS on patients with various suprasellar tumors that included cases of PA. Across 3 studies including a total of 57 patients with both functional (29/57) and non-functional (28/57) PA, markedly decreased N-acetyl aspartate levels were demonstrated by single vortex 1H MRS, in addition to absent or low levels of creatine and moderately elevated levels of choline-containing compounds (71–73) (Table 2). Moreover, in up to 50% of cases, including 2 cases of pituitary apoplexy, the concentration of N-acetyl aspartate remained unidentified. No significant differences between the two types of PA were observed (71, 72). Nonetheless, a similar metabolomic pattern was found in suprasellar gliomas and chordomas while craniopharyngiomas presented low levels of all evaluated metabolites (71, 72). Further, it was found that in diagnosis of suprasellar tumors the overall efficacy of proton MRS in association with MRI (87%) was greater than MRI alone (69.6%), but this difference was not statistically significant (73). Referring to other types of suprasellar tumors, the authors reported low levels of N-acetyl aspartate and creatine and high levels of choline-containing compounds in the case of gliomas. Chordomas showed low levels of N-acetyl aspartate and creatine, but high levels of lipids and choline-containing compounds. Craniopharyngiomas showed low levels of all evaluated metabolites (71, 72).
Likewise, in a series of brain tumors from 57 patients, including 5 PA vs. 7 healthy volunteers, Isobe et al. (74) identified an increased peak of choline and a lack of N-acetyl aspartate and total creatine. The choline peak was confirmed in a small series of 3 children with non-functional PA (75) (Table 2).
Stadlbauer et al. (76) evaluated 27/37 patients with large functional and non-functional PA and a volume ≥4 cm3. Of the 27, 11 PA presented hemorrhagic areas, while 16 were non-hemorrhagic. Non-hemorrhagic PA group revealed a peak of choline (Table 2). The concentration of this metabolite was strongly correlated with the MIB-1 index on the immunohistochemical examination of these 16 patients.
Kozić et al. (77) described the case of a 41-year-old patient with an ectopic 53/40 mm pituitary macroadenoma. Preoperatively, the patient was examined using in vivo single vortex 1H-MRS, and a high peak of choline was noticed (Table 2). Due to disease persistence, after surgery the patient required treatment with somatostatin analogs (lanreotide 120 mg/4 weeks). Approximately 1 year later marked adenoma shrinkage and the lack of choline peak in the tumor were demonstrated along with a favorable clinical outcome.
Khiat et al. (78) evaluated a series of 13 patients including 7 patients with ACTH-secreting PA and 6 patients with ACTH-independent Cushing's syndrome vs. 40 healthy individuals. The objective of the study was the characterization of cerebral metabolites in the thalamic, temporal and frontal region by analyzing the brain MRI sequences. Irrespective of the etiology of Cushing's syndrome, choline/creatine ratio showed a marked decrease in the thalamus and frontal area (Table 2).
Quality Assessment of Studies
The risk of bias and the concern regarding applicability in included studies is illustrated in Figures 2, 3. Patient selection in studies was low in 16.66% of cases. Regarding the index test, 88.88% of studies accurately described the metabolomic analysis. The reference standard for PA diagnosis was histopatological examination that was described in 66.66% of cases. The flow of patients through the study and timing of reference standard and the index test were low in 27.77% of cases.
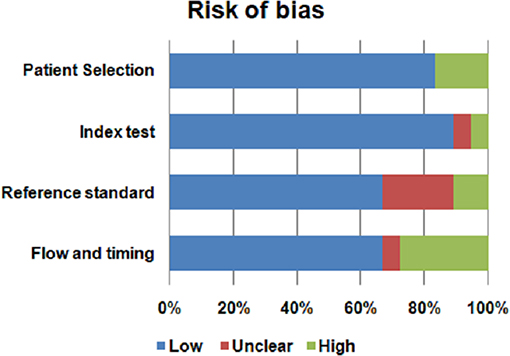
Figure 2. Risk of bias of the included studies.
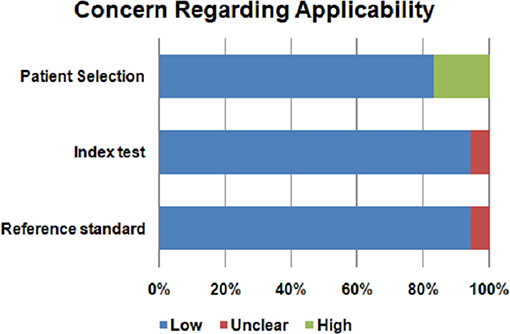
Figure 3. Concern regarding applicability of the included studies.
Discussion
The approach of metabolomics techniques in neuroendocrinology and neurosurgery has grown in recent years, providing additional information to genomics and proteomics. As from the metabolomic perspective, glioblastoma, the most common and severe type of brain cancer in adults (82), has begun to be studied years ago when elevated concentration of phosphocholine was reported and found to be even higher in primary glioblastoma compared to recurrent disease (81). Recently, MALDI-MSI has been successfully implemented in differentiation of brain tumor vs. healthy brain tissue on a murine model of high-grade glioblastoma (83).
Metabolomic analysis has already proven its potential with regard to brain tumors, as in the classification of both meningioma and astrocytoma, depending on their aggressiveness. High-grade meningioma presents decreased levels of alanine and creatine in comparison to low-grade meningioma (84). Also, N-acetyl aspartate, myo-inositol, lactate, creatine and glycine show statistically significant differences depending on tumor aggression in astrocytoma (85).
The present review, conducted in a systematic manner, identified a series of metabolites to be altered in PA as illustrated in Figure 4.
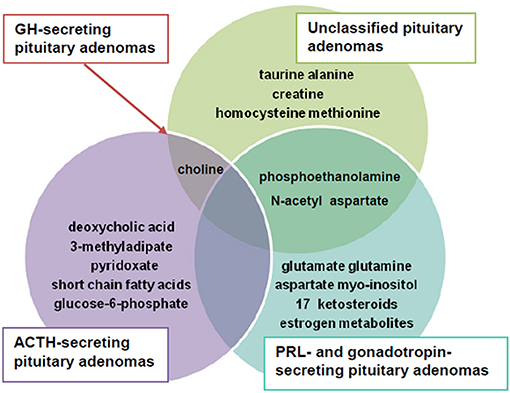
Figure 4. The main altered metabolites in pituitary adenomas (PA).
Summarizing data, we observed that N-acetyl aspartate, choline-containing compounds and creatine were main metabolites highly effective in differentiating PA from healthy tissue. The most obvious pattern consisted of decreased N-acetyl aspartate and creatine and increased choline-containing compounds levels.
N-acetyl aspartate is a derivative of aspartic acid abundantly found in the human brain. Except for Canavan disease, a genetic disorder characterized by toxic accumulation of N-acetyl aspartate caused by aspartoacylase inactivation (86), down regulation of this metabolite seems to be constant in clinical conditions that associate neuronal dysfunction, including epilepsy (87–89), multiple sclerosis (90), Alzheimer's disease (91, 92), schizophrenia (93, 94), stroke (95), brain injury (96, 97) and brain tumors (98, 99).
Choline-containing compounds (choline, phosphatidylcholine etc.) are involved in the synthesis and degradation of the cell membrane. Thus, a high concentration of these compounds is suggestive of accelerated cell membrane turnover in PA (100). In addition, the high level of choline correlates with tumor proliferation (71). Decreased creatine availability may suggest a disruption of energy metabolism in PA, given that this metabolite plays an important role in the ATP/ADP cycle (71).
Phosphoethanolamine, which appeared to be the key metabolite found in pituitary tumor tissue vs. non-tumoral pituitaries, is a precursor of phosphatidylcholine and phosphatidylethanolamine, both of which are components of cell membranes. It seems that phosphoethanolamine down regulation is involved in tumor genesis, given that pharmacologic administration of phosphoethanolamine suppressed tumor growth both in vivo and in vitro studies performed in mice bearing melanoma (101). In line with that, Ferreira et al. (102) reported that synthetic phosphoethanolamine reduces tumor growth and has an inhibitory action on clonal metastases in an acute promyelocytic leukemia model.
Another observation of our review included the alteration of myo-inositol, aspartate, glutamate and glutamine in gonadotropin- and PRL-secreting PA. More than that, phosphoethanolamine, myo-inositol and N-acetyl aspartate were down regulated in prolactinoma, whereas aspartate, glutamate and glutamine were up regulated.
Myo-inositol, a component of many phospholipids that is found in considerable amounts in the brain functions as a second messenger in multiple intracellular signaling pathways. The low concentration of myo-inositol is linked to an imbalance in osmolyte function of malignant cells (103, 104). Myo-inositol is responsible for cell cycle control, apoptosis, inhibition of the PI3K/Akt pathway and NF-kB activity (105). Moreover, it exerts antioxidant, anti-inflammatory and anti-tumoral effects, through insulin modulation (104). Its potential role has been described in breast and colon cancer (106, 107). Accordingly, Kesler et al. (106) reported an increased level of prefrontal myo-inositol in a group of 19 breast cancer survivors after chemotherapy. Moreover, Derbal-Wolfrom et al. (107) postulated that myo-inositol trispyrophosphate treatment increased the oxygen load to result in inhibition of colon tumor growth and stimulation of homeobox gene Cdx2 expression within the intestinal wall.
As in the research conducted by Oklu et al. (64), Ijare et al. (51) also identified that the aspartate and glutamate metabolism is affected in PRL-secreting PA. Glutamine is another abundant free amino acid with roles in protein synthesis. Thus, it plays important roles in the growth of normal and cancerous cells and many studies have demonstrated these cells are dependent on glutamine concentration (108, 109), while glutamine deprivation on cell cultures is associated with malignant cells death (110, 111). The down regulation of this metabolite, which is particularly emphasized in PRL-secreting PA, seems to be involved in tumor genesis. At the opposite pole, the up-regulation of phosphoethanolamine in unclassified PA may suggest an activation of phosphatidylethanolamine metabolism, which is involved in membrane shape changes in tumor cells (55).
Alterations of the amino acids metabolism in PA, especially involving alanine, glutamate and aspartate represents another feature that deserves to be taken into account. Alanine, a non-essential amino acid, is an end product of glutamate oxidation, which is a major source of respiratory energy in the tumor cell. In addition, alanine exerts proliferative effects on malignant cells (112, 113).
A similar effect is attributed to glutamate (114); its actions are mediated through two main receptors predominantly expressed in the brain: ionotropic glutamate receptors (iGluRs) and metabotropic glutamate receptors (mGluRs) (114). Recent studies have described these receptors in peripheral organs and implicitly in a wide range of cancers such as lung, thyroid, digestive tract, breast and ovarian cancer (115–120).
Aspartate is a metabolite of the urea cycle, involved in gluconeogenesis, being derived from asparaginase. The concentration of this metabolite is decreased in malignant cells, being synthesized from oxaloacetate by aminotransferase activity (121). In 2015, Xie et al. (122) noticed a decreased level of aspartate in the plasma of 35 patients with breast cancer. In addition, Dornfeld et al. (123) demonstrated improved cell mitochondrial function and reduction of doxorubicin toxicity in breast cancer samples.
Up-regulation of homocysteine in PA may be responsible for citotoxicity (68) and oxidative stress. Increased levels of homocysteine have also been reported in anxiety disorders, Alzheimer's disease, dementia, breast cancer and thyropathies (68). Moreover, the alteration of methionine metabolism leads to neurological dysfunction (68).
The identification of estrogen metabolites and 17-ketosteroids in the urine of patients with PRL-secreting adenomas is most likely to be due to decreased activity of 3 beta-hydroxysteroid dehydrogenase and 5α-reductase that occurs among these patients (66).
Another important finding is the identification of deoxycholic acid, 4-pyridoxic acid, 3-methyladipate, short chain fatty acids and glucose-6-phosphate as potential metabolomic biomarkers in patients with Cushing's disease (64, 65).
Deoxycholic acid is a bile acid that acts as a fat emulsifier, improving intestinal absorption. Moreover, it induces deoxyribonucleic acid (DNA) damage by increasing intracellular production of oxidative stress (124, 125). Up to now, increased levels of deoxycholic acid have been demonstrated in digestive (126, 127) and breast cancers (128), but its involvement in the appearance of pituitary tumors has not yet been documented.
4-pyridoxic acid is a urinary catabolite of vitamin B6, being a biomarker of vitamin B6 status. Thus, deficiency of 4-pyridoxic acid is correlated with a deficiency in vitamin B6 that has been shown to be involved in tumor development and its progression by following mechanisms: cell cycle alteration, angiogenesis, chromosomal instability, inflammation and increased oxidative stress (129–131).
13-methyladipate is a catabolic product of phytanic acid, being a saturated fatty acid obtained by eating dairy products and ruminant meat. Recent studies have shown that the intake of phytanic acid is associated with an enhanced risk of non-Hodgkin lymphoma (132) and prostate cancer (133, 134).
Metabolic pathway analysis has shown that amino acid metabolism is the most altered one among patients with Cushing's disease. The same aspect has been highlighted in other endocrine tumors, such as thyroid cancer, where an elevated concentration of methionine, glutamine, glycine, tyrosine and taurine was reported (39, 103, 104, 135–139). This high level of amino acids is linked to cell proliferation and energy substrate. The main sources of amino acids are represented by the combination between the increase of protein catabolism, de novo amino acids synthesis and augmented extracellular matrix degradation (140–142). On the other hand, by using 1H-NMR, a down-regulation of leucine, lysine, valine, serine, alanine and tyrosine was observed in plasma and serum of patients with thyroid cancer (138, 139). Also, alterations in amino acid metabolism have been observed in ovarian (143), breast (144) and prostate cancer (145)
Another important aspect was the involvement of short chain fatty acids metabolism in the pathogenesis of ACTH-secreting PA. This dysregulation is likely correlated with the increased cell turnover and lipids demand in membrane biosynthesis needed for cell proliferation (146).
Likewise, the decreased level of glucose-6-phosphate, which is a glycolic metabolite, along with pyruvate, represents a first step in demonstrating the involvement of glycolysis/gluconeogenesis pathway in ACTH-secreting PA.
The contribution of MALDI-MSI technique in the diagnosis of functional PA appears to be a major one, due to its high sensitivity and specificity in identifying pituitary hormones and fragments in addition to the possibility of delineating pituitary tumor tissue, making this method the most pertinent metabolomic assessment to be employed in the investigation of pituitary tumors.
The present review shows several limitations. Although conducted in a systematic fashion, only few articles could be included. Further, the limited number of patients/samples included in studies, the different types of biological samples analyzed (plasma, post-surgical tumor tissue, urine), differences in analytical techniques and a lack of homogeneity of PA may explain the heterogeneous results. Sensitivity and specificity of the metabolomic techniques was described in few studies. Moreover, the use of single voxel 1H-MRS in some studies was able to identify only a limited number of metabolites by analyzing the brain MRI sequences. Furthermore, the sensitivity of these methods in the detection of PA needs to be considerably improved, perhaps the best approach in the future would imply the combination of NMR and MS-based techniques, the implementation of MALDI-MSI on an increased group of patients or the combination of MALDI-MSI with CT, MRI or PET imaging.
Future Perspectives
Although an emerging science, metabolomics has a huge potential compared to genomics, transcriptomics or proteomics, given its ability to characterize the molecular phenotype (147). This aspect makes it possible to significantly improve clinical approach to pituitary disorders in a personalized manner, for example in the diagnosis of MRI negative ACTH-secreting PA or gonadotropin-secreting PA. Likewise, identification of new metabolomic biomarkers in GH-secreting PA would considerably alleviate the prognosis of acromegaly and, potentially, predict therapeutic response. Characterization of specific metabolic pathways underlying PA including their functional alteration would bring new data into understanding their pathogenesis, thus making it possible to identify new therapeutic targets.
Metabolomics seems to be a promising tool in the future in neurosurgery, given that LC/MS and nanostructure imaging mass spectrometry (NIMS) have been able to identify brain region mapping on the animal model (148) and that first steps toward clinical application of MALDI MSI were initiated (63). Nonetheless, further studies are warranted to confirm preliminary results and deepen knowledge in the field.
Conclusion
Implementation of ultra high performance metabolomics analysis techniques in the study of PA will significantly improve diagnosis and, potentially, the therapeutic approach, by identifying highly specific disease biomarkers in addition to novel molecular pathogenic mechanisms. Ultra high mass resolution MALDI-MSI emerges as a helpful clinical tool in the neurosurgical treatment of pituitary tumors. Therefore, metabolomics appears to be a science with a promising prospect in the sphere of PA, and a starting point in pituitary care.
Author Contributions
OP collected data, drafted the manuscript and wrote the review. BG contributed to the data collection. CG conceived the study design and wrote the review.
Funding
This work was supported by Iuliu Hatieganu University of Medicine and Pharmacy Cluj-Napoca, Romania, Ph.D. research grant no. 1300/50/13.01.2017.
Conflict of Interest Statement
The authors declare that the research was conducted in the absence of any commercial or financial relationships that could be construed as a potential conflict of interest.
References
1. Xiao JF, Zhou B, Ressom HW. Metabolite identification and quantitation in LC-MS/MS-based metabolomics. Trends Analyt Chem. (2012) 32:1–14. doi: 10.1016/j.trac.2011.08.009
2. Zhang T, Wu X, Ke C, Yin M, Li Z, Fan L, et al. Identification of potential biomarkers for ovarian cancer by urinary metabolomic profiling. J Proteome Res. (2003) 12:505–12. doi: 10.1021/pr3009572
3. Chen J, Zhou L, Zhang X, Lu X, Cao R, Xu CJ, et al. Urinary hydrophilic and hydrophobic metabolic profiling based on liquid chromatography–mass spectrometry methods: differential metabolite discovery specific to ovarian cancer. Electrophoresis (2012) 33:3361–9. doi: 10.1002/elps.201200140
4. Hampel D, York ER, Allen LH. Ultra-performance liquid chromatography tandem mass-spectrometry (UPLC–MS/MS) for the rapid, simultaneous analysis of thiamin, riboflavin, flavin adenine dinucleotide, nicotinamide and pyridoxal in human milk. J Chromatogr B Analyt Technol Biomed Life Sci. (2012) 903:7–13. doi: 10.1016/j.jchromb.2012.06.024
5. De Brouwer V, Storozhenko S, Stove CP, Van Daele J, Van der Straeten D, Lambert WE. Ultra-performance liquid chromatography-tandem mass spectrometry (UPLC-MS/MS) for the sensitive determination of folates in rice. J Chromatogr B Analyt Technol Biomed Life Sci. (2010) 878:509–13. doi: 10.1016/j.jchromb.2009.12.032
6. Zhang L, Shen H, Xu J, Xu JD, Li ZL, Wu J, et al. UPLC-QTOF-MS/MS-guided isolation and purification of sulfur-containing derivatives from sulfur-fumigated edible herbs, a case study on ginseng. Food Chem. (2018) 246:202–10. doi: 10.1016/j.foodchem.2017.10.151
7. Ibáñez M, Borova V, Boix C, Aalizadeh R, Bade R, Thomaidis NS, et al. UHPLC-QTOF MS screening of pharmaceuticals and their metabolites in treated wastewater samples from Athens. J Hazard Mater. (2017) 323(Pt A):26–35. doi: 10.1016/j.jhazmat.2016.03.078
8. Zhang W, Hankemeier T, Ramautar R. Next-generation capillary electrophoresis–mass spectrometry approaches in metabolomics. Curr Opin Biotechnol. (2017) 43:1–7.doi: 10.1016/j.copbio.2016.07.002
9. Mischak H, Coon JJ, Novak J, Weissinger EM, Schanstra JP, Dominicza AF. Capillary electrophoresis–mass spectrometry as a powerful tool in biomarker discovery and clinical diagnosis: an update of recent developments. Mass Spectrom Rev. (2009) 28:703–24. doi: 10.1002/mas.20205
10. Fujimura Y, Miura D. MALDI mass spectrometry imaging for visualizing in situ metabolism of endogenous metabolites and dietary phytochemicals. Metabolites (2014) 4:319–46. doi: 10.3390/metabo4020319
11. Miura D, Fujimura Y, Wariishi H. In situ metabolomic mass spectrometry imaging: Recent advances and difficulties. J Proteomics (2012) 75:5052–60. doi: 10.1016/j.jprot.2012.02.011
12. Aretz I, Meierhofer D. Advantages and pitfalls of mass spectrometry based metabolome profiling in systems biology. Int J Mol Sci. (2016) 17:632. doi: 10.3390/ijms17050632
13. Lei Z, Huhman DV, Sumner LW. Mass spectrometry strategies in metabolomics. J Biol Chem. (2011) 286:25435–42. doi: 10.1074/jbc.R111.238691
14. Gowda GA, Djukovic D. Overview of mass spectrometry-based metabolomics: opportunities and challenges. Methods Mol Biol. (2014) 1198:3–12. doi: 10.1007/978-1-4939-1258-2_1
15. Emwas AH. The strengths and weaknesses of NMR spectroscopy and mass spectrometry with particular focus on metabolomics research. Methods Mol Biol. (2015) 1277:161–93. doi: 10.1007/978-1-4939-2377-9_13
16. Markley JL, Brüschweiler R, Edison AS, Eghbalnia HR, Powers R, Raftery D, et al. The future of NMR-based metabolomics. Curr Opin Biotechnol (2017) 43:34–40. doi: 10.1016/j.copbio.2016.08.001
17. van der Graaf M. In vivo magnetic resonance spectroscopy: basic methodology and clinical applications. Eur Biophys J. (2010) 39:527–40. doi: 10.1007/s00249-009-0517-y
18. Quadrelli S, Mountford C, Ramadan S. Hitchhiker's guide to voxel segmentation for partial volume correction of in vivo magnetic resonance spectroscopy. Magn Reson Insights (2016) 27:1–8. doi: 10.4137/MRI.S32903
19. Walch A, Rauser S, Deininger SO, Höfler H. MALDI imaging mass spectrometry for direct tissue analysis: a new frontier for molecular histology. Histochem Cell Biol. (2008) 130:421–34. doi: 10.1007/s00418-008-0469-9
20. Murphy RC, Hankin JA, Barkley RM. Imaging of lipid species by MALDI mass spectrometry. J Lipid Res. (2009) 50:S317–22. doi: 10.1194/jlr.R800051-JLR200
21. DeKeyser SS, Kutz-Naber KK, Schmidt JJ, Barrett-Wilt GA, Li L. Mass spectral imaging of neuropeptides in decapod crustacean neronal tissues. J Proteome Res. (2007) 6:1782–91. doi: 10.1021/pr060603v
22. Franck J, Arafah K, Elayed M, Bonnel D, Vergara D, Jacquet A, et al. MALDI imaging mass spectrometry: state of the art technology in clinical proteomics. Mol Cell Proteomics (2009) 8:2023–33. doi: 10.1074/mcp.R800016-MCP200
23. Nicholson JK, Lindon JC. Systems biology: metabonomics. Nature (2008) 455:1054–6. doi: 10.1038/4551054a
24. Want EJ, Nordström A, Morita H, Siuzdak G. From exogenous to endogenous: the inevitable imprint of mass spectrometry in metabolomics. J Proteome Res. (2007) 6:45. doi: 10.1021/pr060505
25. Kind T, Wohlgemuth G, Lee DY, Lu Y, Palazoglu M, Shahbaz S, et al. Fiehnlib: mass spectral and retention index libraries for metabolomics based on quadrupole and time-of-flight gas chromatography/mass spectrometry. Anal Chem. (2009) 81:10038–48. doi: 10.1021/ac9019522
26. Bingol K, Brüschweiler R. Two elephants in the room: new hybrid nuclear magnetic resonance and mass spectrometry approaches for metabolomics. Curr Opin Clin Nutr Metab Care (2015) 18:471–7. doi: 10.1097/MCO.0000000000000206
27. Abu Bakar MH, Sarmidi MR, Cheng KK, Ali Khan A, Suan CL, Zaman Huri H, et al. Metabolomics - the complementary field in systems biology: a review on obesity and type 2 diabetes. Mol Biosyst. (2015) 11:1742–74. doi: 10.1039/c5mb00158g
28. Guasch-Ferré M, Hruby A, Toledo E, Clish CB, Martínez-González MA, Salas-Salvadó J, et al. Metabolomics in prediabetes and diabetes: a systematic review and meta-analysis. Diabetes Care (2016) 39:833–46. doi: 10.2337/dc15-2251
29. Sas KM, Karnovsky A, Michailidis G, Pennathur S. Metabolomics and diabetes: analytical and computational approaches. Diabetes (2015) 64:718–32. doi: 10.2337/db14-0509
30. Liu X, Gao J, Chen J, Wang Z, Shi Q, Man H, et al. Identification of metabolic biomarkers in patients with type 2 diabetic coronary heart diseases based on metabolomic approach. Sci Rep. (2016) 6:30785. doi: 10.1038/srep30785
31. Rauschert S, Uhl O, Koletzko B, Hellmuth C. Metabolomic biomarkers for obesity in humans: a short review. Ann Nutr Metab. (2014) 64:314–24. doi: 10.1159/000365040
32. Bagheri M, Farzadfar F, Qi L, Yekaninejad MS, Chamari M, Zeleznik OA, et al. Obesity-related metabolomic profiles and discrimination of metabolically unhealthy obesity. J Proteome Res. (2018) 17:1452–62. doi: 10.1021/acs.jproteome.7b00802
33. Murri M, Insenser M, Escobar-Morreale HF. Metabolomics in polycystic ovary syndrome. Clin Chim Acta (2014) 429:181–8. doi: 10.1016/j.cca.2013.12.018
34. Dong F, Deng D, Chen H, Cheng W, Li Q, Luo R, et al. Serum metabolomics study of polycystic ovary syndrome based on UPLC-QTOF-MS coupled with a pattern recognition approach. Anal Bioanal Chem. (2015) 407:4683–95. doi: 10.1007/s00216-015-8670-x
35. Georgescu CE, Moraru I, Ilie I, Vonica C, Pinzariu O, Socaciu C. Metabolomics, a novel approach to polycystic ovary syndrome. Acta Endo. (2017) 13(Suppl. 1):9.
36. Zou Y, Zhu FF, Fang CY, Xiong XY, Li HY. Identification of potential biomarkers for urine metabolomics of polycystic ovary syndrome based on gas chromatography-mass spectrometry. Chin Med J. (2018) 131:945–9. doi: 10.4103/0366-6999.229899
37. Omabe M, Elom S, Omabe KN. Emerging metabolomics biomarkers of polycystic ovarian syndrome; targeting the master metabolic disrupters for diagnosis and treatment. Endocr Metab Immune Disord Drug Targets (2018) 18:221–9. doi: 10.2174/1871530318666180122165415
38. Shang X, Zhong X, Tian X. Metabolomics of papillary thyroid carcinoma tissues: potential biomarkers for diagnosis and promising targets for therapy. Tumour Biol. (2016) 37:11163–75. doi: 10.1007/s13277-016-4996-z
39. Li Y, Chen M, Liu C, Xia Y, Xu B, Hu Y, et al. Metabolic changes associated with papillary thyroid carcinoma: a nuclear magnetic resonance-based metabolomics study. Int J Mol Med. (2018) 41:3006–14. doi: 10.3892/ijmm.2018.3494
40. Wojakowska A, Chekan M, Widlak P, Pietrowska M. Application of metabolomics in thyroid cancer research. Int J Endocrinol. (2015) 2015:1–13. doi: 10.1155/2015/258763
41. Ryoo I, Kwon H, Kim SC, Jung SC, Yeom JA, Shin HS, et al. Metabolomic analysis of percutaneous fine-needle aspiration specimens of thyroid nodules: potential application for the preoperative diagnosis of thyroid cancer. Sci Rep. (2016) 6:30075. doi: 10.1038/srep30075
42. Moayyeri A, Cheung CL, Tan KC, Morris JA, Cerani A, Mohney RP, et al. Metabolomic pathways to osteoporosis in middle-aged women: a genome-metabolome-wide mendelian randomization study. J Bone Miner Res. (2018) 33:643–50. doi: 10.1002/jbmr.3358
43. Lv H, Jiang F, Guan D, Lu C, Guo B, Chan C, et al. Metabolomics and its application in the development of discovering biomarkers for osteoporosis research. Int J Mol Sci. (2016) 17:2018. doi: 10.3390/ijms17122018
44. Kotłowska A, Puzyn T, Sworczak K, Stepnowski P, Szefer P. Metabolomic biomarkers in urine of cushing's syndrome patients. Int J Mol Sci. (2017) 18:294. doi: 10.3390/ijms18020294
45. Eisenhofer G, Masjkur J, Peitzsch M, Di Dalmazi G, Bidlingmaier M, Grüber M, et al. Plasma steroid metabolome profiling for diagnosis and subtyping patients with cushing syndrome. Clin Chem. (2018) 64:586–96. doi: 10.1373/clinchem.2017.282582
46. Arlt W, Lang K, Sitch AJ, Dietz AS, Rhayem Y, Bancos I, et al. Steroid metabolome analysis reveals prevalent glucocorticoid excess in primary aldosteronism. JCI Insight (2017) 2:93136. doi: 10.1172/jci.insight.93136
47. Lang K, Beuschlein F, Biehl M, Dietz A, Riester A, Hughes BA, et al. Urine steroid metabolomics as a diagnostic tool in primary aldosteronism. Endocr Abstracts (2015) 38:OC1.6. doi: 10.1530/endoabs.38.OC1.6
48. Imperiale A, Moussallieh FM, Roche P, Battini S, Cicek AE, Sebag F, et al. Metabolome profiling by HRMAS NMR spectroscopy of pheochromocytomas and paragangliomas detects SDH deficiency: clinical and pathophysiological implications. Neoplasia (2015) 17:55–65. doi: 10.1016/j.neo.2014.10.010
49. Höybye C, Wahlström E, Tollet-Egnell P, Norstedt G. Metabolomics: a tool for the diagnosis of GH deficiency and for monitoring GH replacement? Endocr Connect (2014) 3:200–6. doi: 10.1530/EC-14-0098
50. Zhan X, Desiderio DM. Editorial: systems biological aspects of pituitary tumors. Front Endocrinol. (2016) 7:86. doi: 10.3389/fendo.2016.00086
51. Ijare O, Baskin DS, Pichumani K. Characterization of metabolism of pituitary tumors by NMR spectroscopy. Neuro-Oncology (2017) 19(Suppl. 6):145. doi: 10.1093/neuonc/nox168.592
52. Szigety SK, Allen PS, Huyser-wierenga D, Urtasun RC. The effect of radiation on normal human CNS as detected by NMR spectroscopy. Int J Radiat Oncol Biol Phys. (1993) 25:695–701 doi: 10.1016/0360-3016(93)90018-Q
53. Kinoshita Y, Yokota A, Koga Y. Phosphorylethanolamine content of human brain tumors. Neurol Med Chir. (1994) 34:803–652. doi: 10.2176/nmc.34.803
54. Kinoshita Y, Kajiwara H, Yokota A, Koga Y. Proton magnetic resonance spectroscopy of brain tumors: an in vitro study. Neurosurgery (1994) 35:606–13 doi: 10.1227/00006123-199410000-00005
55. Kinoshita Y, Yokota A. Absolute concentrations of metabolites in human brain tumors using in vitro proton magnetic resonance spectroscopy. NMR Biomed. (1997) 10:2–12.
56. Yoshida Y, Yoshioka Y. [Utility of proton magnetic resonance spectroscopy in the diagnosis of human brain tumors]. No Shinkei Geka (1991) 19:421–7.
57. Kertesz V, Calligaris D, Feldman DR, Changelian A, Laws ER, Santagata S, et al. Profiling of adrenocorticotropic hormone and arginine vasopressin in human pituitary gland and tumor thin tissue sections using droplet-based liquid-microjunction surface-sampling-HPLC-ESI-MS-MS. Anal Bioanal Chem. (2015) 407:5989–98. doi: 10.1007/s00216-015-8803-2
58. Zhan X, Desiderio DM. Nitroproteins from a human pituitary adenoma tissue discovered with a nitrotyrosine affinity column and tandem mass spectrometry. Anal Biochem. (2006) 354:279–89. doi: 10.1016/j.ab.2006.05.024
59. Kríz L, Bicíková M, Mohapl M, Hill M, Cerný I, Hampl R. Steroid sulfatase and sulfuryl transferase activities in human brain tumors. J Steroid Biochem Mol Biol. (2008) 109:31–9. doi: 10.1016/j.jsbmb.2007.12.004
60. Feng J, Zhang Q, Li C, Zhou Y, Zhao S, Hong L, et al. Enhancement of mitochondrial biogenesis and paradoxical inhibition of lactate dehydrogenase mediated by 14-3-3η in oncocytomas. J Pathol. (2018) 245:361–72. doi: 10.1002/path.5090
61. Kaibara T, Tyson RL, Sutherland GR. Human cerebral neoplasms studied using MR spectroscopy: a review. Biochem Cell Biol. (1998) 76:477–86 doi: 10.1139/o98-048
62. Whiting PF, Rutjes AW, Westwood ME, Mallett S, Deeks JJ, Reitsma JB, et al. QUADAS-2: a revised tool for the quality assessment of diagnostic accuracy studies. Ann Intern Med. (2011) 155:529–36. doi: 10.7326/0003-4819-155-8-201110180-00009
63. Calligaris D, Feldman DR, Norton I, Olubiyi O, Changelian AN, Machaidze R, et al. MALDI mass spectrometry imaging analysis of pituitary adenomas for near-real-time tumor delineation. Proc Natl Acad Sci USA. (2015) 112:9978–83. doi: 10.1073/pnas.1423101112
64. Oklu R, Deipolyi AR, Wicky S, Ergul E, Deik AA, Chen JW, et al. Identification of small compound biomarkers of pituitary adenoma: a bilateral inferior petrosal sinus sampling study. Neuro Intervent Surg. (2014) 6:541–6. doi: 10.1136/neurintsurg-2013-010821
65. Jie Feng, Qi Zhang, Yang Zhou, Shenyuan Yu, Lichuan Hong, Sida Zhao et al. Integration of proteomics and metabolomics revealed metabolite-protein networks in ACTH- pituitary adenoma. Front Endocrinol. (2018) 9:678. doi: 10.3389/fendo.2018.00678
66. Lee SH, Nam SY, Chung BC. Altered profile of endogenous steroids in the urine of patients with prolactinoma. Clin Biochem. (1998) 31:529–35 doi: 10.1016/S0009-9120(98)00063-0
67. Jarmusch AK, Pirro V, Baird Z, Hattab EM, Cohen-Gadol AA, Cooks RG. Lipid and metabolite profiles of human brain tumors by desorption electrospray ionization-MS. Proc Natl Acad Sci USA. (2016) 113:1486–91. doi: 10.1073/pnas.1523306113
68. Bicíková M, Kríz L, Mohapl M, Burkonová D, Tallová J, Husek P. Aminothiols in human brain tumors. Clin Chem Lab Med. (2006) 44:978–82. doi: 10.1515/CCLM.2006.170
69. Usenius JP, Kauppinen RA, Vainio PA, Hernesniemi JA, Vapalahti MP, Paljärvi LA, et al. Quantitative metabolite patterns of human brain tumors: detection by 1H NMR spectroscopy in vivo and in vitro. J Comput Assist Tomogr (1994) 18:705–13.
70. Solivera J, Cerdán S, Pascual JM, Barrios L, Roda JM. Assessment of 31P-NMR analysis of phospholipid profiles for potential differential diagnosis of human cerebral tumors. NMR Biomed. (2009) 22:663–74.
71. Einstein A, Virani RA. Clinical relevance of single-voxel 1H Mrs metabolites in discriminating suprasellar tumors. J Clin Diagn Res (2016) 10:TC01–TC04.
72. Chernov MF, Kawamata T, Amano K, Ono Y, Suzuki T, Nakamura R, et al. Possible role of single-voxel (1)H-MRS in differential diagnosis of suprasellar tumors. J Neurooncol. (2009) 91:191–8. doi: 10.1007/s11060-008-9698-y
73. Faghih Jouibari M, Ghodsi SM, Akhlaghpoor S, Mehrazin M, Saadat S, Khoshnevisan A, et al. Complementary effect of H MRS in diagnosis of suprasellar tumors. Clin Imaging (2012) 36:810–5. doi: 10.1016/j.clinimag.2012.01.021
74. Isobe T, Yamamoto T, Akutsu H, Shiigai M, Shibata Y, Takada K, et al. Preliminary study for differential diagnosis of intracranial tumors using in vivo quantitative proton MR spectroscopy with correction for T2 relaxation time. Radiography (2015) 21:42–6. doi: 10.1016/j.radi.2014.06.002
75. Sutton LN, Wang ZJ, Wehrli SL, Marwaha S, Molloy P, Phillips PC, et al. Proton spectroscopy of suprasellar tumors in pediatric patients. Neurosurgery (1997) 41:388–94. discussion: 394–5 doi: 10.1097/00006123-199708000-00009
76. Stadlbauer A, Buchfelder M, Nimsky C, Saeger W, Salomonowitz E, Pinker K, et al. Proton magnetic resonance spectroscopy in pituitary macroadenomas: preliminary results. J Neurosurg. (2008) 109:306–12. doi: 10.3171/JNS/2008/109/8/0306
77. Kozic D, Medic-Stojanoska M, Ostojic J, Popovic L, Vuckovic N. Application of MR spectroscopy and treatment approaches in a patient with extrapituitary growth hormone secreting macroadenoma. Neuro Endocrinol Lett. (2007) 28:560–4.
78. Khiat A, Bard C, Lacroix A, Rousseau J, Boulanger Y. Brain metabolic alterations in Cushing's syndrome as monitored by proton magnetic resonance spectroscopy. NMR Biomed. (1999) 12:357–63. doi: 10.1002/(SICI)1099-1492(199910)12:6<357::AID-NBM584>3.0.CO;2-U
79. Larkin S, Ansorge O. Development and microscopic anatomy of the pituitary gland. In: De Groot LJ, Chrousos G, Dungan K, Feingold KR, Grossman A, Hershman JM, Koch C, Korbonits M, McLachlan R, New M, Purnell J, Rebar R, Singer F, Vinik A, editors. Endotext. South Dartmouth, MA: MDText.com, Inc. (2000). (Accessed February, 15 2017).
80. Cuellar-Baena S, Morales JM, Martinetto H, Calvar J, Sevlever G, Castellano G, et al. Comparative metabolic profiling of paediatric ependymoma, medulloblastoma and pilocytic astrocytoma. Int J Mol Med (2010) 26:941–8. doi: 10.3892/ijmm_00000546
81. Vettukattil R, Gulati M, Sjøbakk TE, Jakola AS, Kvernmo NA, Torp SH, et al. Differentiating diffuse World Health Organization grade II and IV astrocytomas with ex vivo magnetic resonance spectroscopy. Neurosurgery (2013) 72:186–95. doi: 10.1227/NEU.0b013e31827b9c57
82. Davis ME. Glioblastoma: overview of disease and treatment. Clin J Oncol Nurs. (2016) 20:S2–8. doi: 10.1188/16.CJON.S1.2-8
83. Dilillo M, Ait-Belkacem R, Esteve C, Pellegrini D, Nicolardi S, Costa M, et al. Ultra-high mass resolution MALDI imaging mass spectrometry of proteins and metabolites in a mouse model of glioblastoma. Sci Rep. (2017) 7:603. doi: 10.1038/s41598-017-00703-w
84. Pfisterer WK, Nieman RA, Scheck AC, Coons SW, Spetzler RF, Preul MC. Using ex vivo proton magnetic resonance spectroscopy to reveal associations between biochemical and biological features of meningiomas. Neurosurg Focus (2010) 28:E12. doi: 10.3171/2009.11.FOCUS09216
85. Chen W, Lou H, Zhang H, Nie X, Lan W, Yang Y, et al. Grade classification of neuroepithelial tumors using high-resolution magic-angle spinning proton nuclear magnetic resonance spectroscopy and pattern recognition. Sci China Life Sci. (2011) 54:606–16. doi: 10.1007/s11427-011-4193-7
86. Namboodiri AM, Peethambaran A, Mathew R, Sambhu PA, Hershfield J, Moffett JR, et al. Canavan disease and the role of N-acetylaspartate in myelin synthesis. Mol Cell Endocrinol. (2006) 252:216–23. doi: 10.1016/j.mce.2006.03.016
87. Garcia PA, Laxer KD, van der Grond J, Hugg JW, Matson GB, Weiner MW. Correlation of seizure frequency with N-acetyl-aspartate levels determined by 1H magnetic resonance spectroscopic imaging. Magn Reson Imaging (1997) 15:475–8 doi: 10.1016/S0730-725X(96)00327-X
88. Vielhaber S, Kudin AP, Kudina TA, Stiller D, Scheich H, Schoenfeld A, et al. Hippocampal N-acetyl aspartate levels do not mirror neuronal cell densities in creatine-supplemented epileptic rats. Eur J Neurosci. (2003) 18:2292–300 doi: 10.1046/j.1460-9568.2003.02954.x
89. Vielhaber S, Niessen HG, Debska-Vielhaber G, Kudin AP, Wellmer J, Kaufmann J, et al. Subfield-specific loss of hippocampal N-acetyl aspartate in temporal lobe epilepsy. Epilepsia (2008) 49:40–50. doi: 10.1111/j.1528-1167.2007.01280.x
90. Enzinger C, Ropele S, Strasser-Fuchs S, Kapeller P, Schmidt H, Poltrum B, et al. Lower levels of N-acetylaspartate in multiple sclerosis patients with the apolipoprotein E epsilon4 allele. Arch Neurol. (2003) 60:65–70 doi: 10.1001/archneur.60.1.65
91. Chen JG, Charles HC, Barboriak DP, Doraiswamy PM. Magnetic resonance spectroscopy in Alzheimer's disease: focus on N-acetylaspartate. Acta Neurol Scand Suppl. (2000) 176:20–6 doi: 10.1034/j.1600-0404.2000.00303.x
92. Nitta A, Noike H, Sumi K, Miyanishi H, Tanaka T, Takaoka K, et al. Shati/Nat8l and N-acetylaspartate (NAA) have important roles in regulating nicotinic acetylcholine receptors in neuronal and psychiatric diseases in animal models and humans. In: Akaike A, Shimohama S, Misu Y, editors. Nicotinic Acetylcholine Receptor Signaling in Neuroprotection. Singapore: Springer (2018). p. 89–111.
93. Stanley AJ, Vemulapalli M, Nutche J, Montrose DM, Sweeney JA, Pettegrew JW, et al. Reduced n-acetyl-aspartate levels in schizophrenia patients with a younger onset age: a single-voxel 1h spectroscopy study. Schizophr Res. (2007) 93:23–32. doi: 10.1016/j.schres.2007.03.028
94. Mondino M, Brunelin J, Saoud M. N-acetyl-aspartate level is decreased in the prefrontal cortex in subjects at-risk for schizophrenia. Front Psychiatry (2013) 4:99.doi: 10.3389/fpsyt.2013.00099
95. Igarashi H, Suzuki Y, Huber VJ, Ida M, Nakada T. N-acetylaspartate decrease in acute stage of ischemic stroke: a perspective from experimental and clinical studies. Magn Reson Med Sci. (2015) 14:13–24. doi: 10.2463/mrms.2014-0039
96. Moffett JR, Arun P, Ariyannur PS, Namboodiri AMA. N-Acetylaspartate reductions in brain injury: impact on post-injury neuroenergetics, lipid synthesis, and protein acetylation. Front Neuroenergetics (2013) 5:11. doi: 10.3389/fnene.2013.00011
97. Shannon RJ, van der Heide S, Carter EL, Jalloh I, Menon DK, Hutchinson PJ, et al. Extracellular N-acetylaspartate in human traumatic brain injury. J Neurotrauma (2016) 33:319–29.doi: 10.1089/neu.2015.3950
98. Rigotti DJ, Inglese M, Gonen O. Whole-brain N-acetylaspartate as a surrogate marker of neuronal damage in diffuse neurologic disorders. AJNR Am J Neuroradiol. (2007) 28:1843–9. doi: 10.3174/ajnr.A0774
99. Long PM, Moffett JR, Namboodiri AMA, Viapiano MS, Lawler SE, Jaworski DM. N-Acetylaspartate (NAA) and N-Acetylaspartylglutamate (NAAG) promote growth and inhibit differentiation of glioma stem-like cells. J Biol Chem. (2013) 288:26188–200. doi: 10.1074/jbc.M113.487553
100. Horská A, Barker PB. Imaging of brain tumors: MR spectroscopy and metabolic imaging. Neuroimaging Clin N Am. (2010) 20:293–310. doi: 10.1016/j.nic.2010.04.003
101. Ferreira AK, Meneguelo R, Marques FL, Radin A, Filho OM, Neto SC, et al. Synthetic phosphoethanolamine a precursor of membrane phospholipids reduce tumor growth in mice bearing melanoma B16-F10 and in vitro induce apoptosis and arrest in G2/M phase. Biomed Pharmacother. (2012) 66:541–8. doi: 10.1016/j.biopha.2012.04.008
102. Ferreira AK, Santana-Lemos BA, Rego EM, Filho OM, Chierice GO, Maria DA. Synthetic phosphoethanolamine has in vitro and in vivo anti-leukemia effects. Br J Cancer (2013) 109:2819–28. doi: 10.1038/bjc.2013.510
103. Torregrossa L, Shintu L, Nambiath Chandran J, Tintaru A, Ugolini C, Magalhães A, et al. Toward the reliable diagnosis of indeterminate thyroid lesions: a HRMAS NMR-based metabolomics case of study. J Proteome Res. (2012) 11:3317–25. doi: 10.1021/pr300105e
104. Deja S, Dawiskiba T, Balcerzak W, Orczyk-Pawiłowicz M, Głód M, Pawełka D, et al. Follicular adenomas exhibit a unique metabolic profile. 1H NMR studies of thyroid lesions. PLoS ONE (2013) 8:e84637. doi: 10.1371/journal.pone.0084637
105. Bizzarri M, Dinicola S, Bevilacqua A, Cucina A. Broad spectrum anticancer activity of myo-inositol and inositol hexakisphosphate. Int J Endocrinol. (2016) 2016:5616807. doi: 10.1155/2016/5616807
106. Kesler SR, Watson C, Koovakkattu D, Lee C, O'Hara R, Mahaffey ML, et al. Elevated prefrontal myo-inositol and choline following breast cancer chemotherapy. Brain Imagin Behav. (2013) 7:501–10. doi: 10.1007/s11682-013-9228-1
107. Derbal-Wolfrom L, Pencreach E, Saandi T, Aprahamian M, Martin E, Greferath R, et al. Increasing the oxygen load by treatment with myo-inositol trispyrophosphate reduces growth of colon cancer and modulates the intestine homeobox gene Cdx2. Oncogene (2013) 32:4313–18. doi: 10.1038/onc.2012.445
108. Medina MA. Glutamine and cancer. J Nutr. (2001) 131(Suppl. 9):2539S−42S. doi: 10.1093/jn/131.9.2539S
109. Wise DR, Thompson CB. Glutamine addiction: a new therapeut target in cancer. Trends Biochem Sci. (2010) 35:427–33. doi: 10.1016/j.tibs.2010.05.003
110. Eagle H. Nutrition needs of mammalian cells in tissue culture. Science (1955) 122:501–14 doi: 10.1126/science.122.3168.501
111. Mathews EH, Liebenberg L. Cancer control via glucose and glutamine deprivation. J Intern Med. (2013) 274:492. doi: 10.1111/joim.12068
112. Costello LC, Franklin RB. ‘Why do tumour cells glycolyse?’: from glycolysis through citrate to lipogenesis. Mol Cell Biochem. (2005) 280:1–8. doi: 10.1007/s11010-005-8841-8
113. Gu Y, Chen T, Fu S. Perioperative dynamics and significance of amino acid profiles in patients with cancer. J Transl Med. (2015) 13:35. doi: 10.1186/s12967-015-0408-1
114. Stepulak A, Rola R, Polberg K, Ikonomidou C. Glutamate and its receptors in cancer. J Neural Transm. (2014) 121:933–44. doi: 10.1007/s00702-014-1182-6
115. North WG, Gao G, Jensen A, Memoli VA, Du J. NMDA receptors are expressed by small-cell lung cancer and are potential targets for effective treatment. Clin Pharmacol. (2010) 2:31–40. doi: 10.2147/CPAA.S6262
116. Stepulak A, Luksch H, Gebhardt C, Uckermann O, Marzahn J, Sifringer M, et al. Expression of glutamate receptor subunits in human cancers. Histochem Cell Biol. (2009) 132:435–45. doi: 10.1007/s00418-009-0613-1
117. Liu JW, Kim MS, Nagpal J, Yamashita K, Poeta L, Chang X, et al. Quantitative hypermethylation of NMDAR2B in human gastric cancer. Int J Cancer (2007) 121:1994–2000 doi: 10.1002/ijc.22934
118. Li S, Qian J, Yang Y, Zhao W, Dai J, Bei JX, et al. GWAS identifies novel susceptibility loci on 6p21.32 and 21q21.3 for hepatocellular carcinoma in chronic hepatitis B virus carriers. PLoS Genet (2012) 8:e1002791. doi: 10.1371/journal.pgen.1002791
119. North WG, Gao G, Memoli VA, Pang RH, Lynch L. Breast cancer expresses functional NMDA receptors. Breast Cancer Res Treat (2010) 122:307–14. doi: 10.1007/s10549-009-0556-1
120. Choi CH, Choi JJ, Park YA, Lee YY, Song SY, Sung CO, et al. Identification of differentially expressed genes according to chemosensitivity in advanced ovarian serous adenocarcinomas: expression of GRIA2 predicts better survival. Br J Cancer (2012) 107:91–9. doi: 10.1038/bjc.2012.217
121. Allen EL, Ulanet DB, Pirman D, Mahoney CE, Coco J, Si Y, et al. Differential aspartate usage identifies a subset of cancer cells particularly dependent on OGDH. Cell Rep. (2016) 17:876–90. doi: 10.1016/j.celrep.2016.09.052
122. Xie G, Zhou B, Zhao A, Qiu Y, Zhao X, Garmire L, et al. Lowered circulating aspartate is a metabolic feature of human breast cancer. Oncotarget (2015) 6: 33369–81. doi: 10.18632/oncotarget.5409
123. Dornfeld K, Madden M, Skildum A, Wallace KB. Aspartate facilitates mitochondrial function, growth arrest and survival during doxorubicin exposure. Cell Cycle (2015) 14:3282–91. doi: 10.1080/15384101.2015.1087619
124. Ajouz H, Mukherji D, Shamseddine A. Secondary bile acids: an underrecognized cause of colon cancer. World J Surg Oncol. (2014) 12:164. doi: 10.1186/1477-7819-12-164
125. Bernstein H, Bernstein C, Payne CM, Dvorakova K, Garewal H. Bile acids as carcinogens in human gastrointestinal cancers. Mutat Res. (2005) 589:47–65 doi: 10.1016/j.mrrev.2004.08.001
126. Milovic V, Teller IC, Murphy GM, Caspary WF, Stein J. Deoxycholic acid stimulates migration in colon cancer cells. Eur J Gastroenterol Hepatol. (2001) 13:945–9 doi: 10.1097/00042737-200108000-00012
127. Abdel-Latif MM, Inoue H, Reynolds JV. Opposing effects of bile acids deoxycholic acid and ursodeoxycholic acid on signal transduction pathways in oesophageal cancer cells. Eur J Cancer Prev. (2016) 25:368–79. doi: 10.1097/CEJ.0000000000000198
128. Costarelli V, Sanders TAB. Plasma deoxycholic acid concentration is elevated in postmenopausal women with newly diagnosed breast cancer. Eur J Clin Nutr. (2002) 56:925–7. doi: 10.1038/sj.ejcn.1601396
129. Galluzzi L, Vacchelli E, Michels J, Garcia P, Kepp O, Senovilla L, et al. Effects of vitamin B6 metabolism on oncogenesis, tumor progression and therapeutic responses. Oncogene (2013) 32:4995–5004. doi: 10.1038/onc.2012.623
130. Ames BN, Wakimoto P. Are vitamin and mineral deficiencies a major cancer risk? Nat Rev Cancer (2002) 2:694–704 doi: 10.1038/nrc886
131. Wondrak GT, Jacobson EL. Vitamin B6: beyond coenzyme functions. Subcell Biochem. (2012) 56:291–300. doi: 10.1007/978-94-007-2199-9_15
132. Ollberding NJ, Aschebrook-Kilfoy B, Caces DB, Wright ME, Weisenburger DD, Smith SM, et al. Phytanic acid and the risk of non-Hodgkin lymphoma. Carcinogenesis (2013) 34:170–5. doi: 10.1093/carcin/bgs315
133. Wright EM, Albanes D, Moser AB, Weinstein SJ, Snyder K, Männistö S, et al. Serum phytanic and pristanic acid levels and prostate cancer risk in Finnish smokers. Cancer Med. (2014) 3:1562–9. doi: 10.1002/cam4.319
134. Wright ME, Bowen P, Virtamo J, Albanes D, Gann PH. Estimated phytanic acid intake and prostate cancer risk: a prospective cohort study. Int J Cancer (2012) 131:1396–406. doi: 10.1002/ijc.27372
135. Chen M, Shen M, Li Y, Liu C, Zhou K, Hu W, et al. GC-MS-based metabolomic analysis of human papillary thyroid carcinoma tissue. Int J Mol Med. (2015) 36:1607–14. doi: 10.3892/ijmm.2015.2368
136. Tian Y, Nie X, Xu S, Li Y, Huang T, Tang H, et al. Integrative metabonomics as potential method for diagnosis of thyroid malignancy. Sci Rep. (2015) 5:14869. doi: 10.1038/srep14869
137. Xu Y, Zheng X, Qiu Y, Jia W, Wang J, Yin S. Distinct metabolomic profiles of papillary thyroid carcinoma and benign thyroid adenoma. J Proteome Res. (2015)14:3315–21. doi: 10.1021/acs.jproteome.5b00351
138. Wojtowicz W, Zabek A, Deja S, Dawiskiba T, Pawelka D, Glod M, et al. Serum and urine 1H NMR-based metabolomics in the diagnosis of selected thyroid diseases. Sci Rep. (2017) 7:9108. doi: 10.1038/s41598-017-09203-3
139. Lu J, Hu S, Miccoli P, Zeng Q, Liu S, Ran L, et al. Non-invasive diagnosis of papillary thyroid microcarcinoma: a NMR-based metabolomics approach. Oncotarget (2016) 7:81768–77. doi: 10.18632/oncotarget.13178
140. Cheng Y, Yang X, Deng X, Zhang X, Li P, Tao J, et al. Metabolomics in bladder cancer: a systematic review. Int J Clin Exp Med. (2015) 8:11052–63.
141. Hirayama A, Kami K, Sugimoto M, Sugawara M, Toki N, Onozuka H, et al. Quan-titative metabolome profiling of colon and stomach cancer microenvironment by capil-lary electrophoresis time-of-flight mass spec-trometry. Cancer Res. (2009) 69:4918–25. doi: 10.1158/0008-5472.CAN-08-4806
142. Argilés JM, Azcón-Bieto J. The metabolic environment of cancer. Mol Cell Biochem. (1988) 81:3–17.
143. Plewa S, Horała A, Derezinski P, Klupczynska A, Nowak-Markwitz E, Matysiak J, et al. Usefulness of amino acid profiling in ovarian cancer screening with special emphasis on their role in cancerogenesis. Int J Mol Sci. (2017) 18:2727. doi: 10.3390/ijms18122727
144. Possemato R, Marks KM, Shaul YD, Pacold ME, Kim D, Birsoy K, et al. Functional genomics reveal that the serine synthesis pathway is essential in breast cancer. Nature (2011) 476:346–50. doi: 10.1038/nature10350
145. Kelly RS, Vander Heiden MG, Giovannucci EL, Mucci LA. Metabolomic biomarkers of prostate cancer: prediction, diagnosis, progression, prognosis and recurrence. Cancer Epidemiol Biomarkers Prev. (2016) 25:887–906. doi: 10.1158/1055-9965.EPI-15-1223
146. Chen Y, Li P. Fatty acid metabolism and cancer development. Sci Bull. (2016) 61:1473–9. doi: 10.1007/s11434-016-1129-4
147. Clish CB. Metabolomics: an emerging but powerful tool for precision medicine. Cold Spring Harb Mol Case Stud. (2015) 1:a000588. doi: 10.1101/mcs.a000588
Keywords: pituitary adenoma, metabolomics, metabolite, mass spectrometry (MS), nuclear magnetic resonance (NMR), MALDI-MS, magnetic resonance spectroscopy (MRS)
Citation: Pînzariu O, Georgescu B and Georgescu CE (2019) Metabolomics—A Promising Approach to Pituitary Adenomas. Front. Endocrinol. 9:814. doi: 10.3389/fendo.2018.00814
Received: 03 September 2018; Accepted: 27 December 2018;
Published: 17 January 2019.
Edited by:
Xianquan Zhan, Central South University, ChinaReviewed by:
Leila Warszawski, Instituto Estadual de Diabetes e Endocrinologia Luiz Capriglione, BrazilNa Li, Central South University, China
Copyright © 2019 Pînzariu, Georgescu and Georgescu. This is an open-access article distributed under the terms of the Creative Commons Attribution License (CC BY). The use, distribution or reproduction in other forums is permitted, provided the original author(s) and the copyright owner(s) are credited and that the original publication in this journal is cited, in accordance with accepted academic practice. No use, distribution or reproduction is permitted which does not comply with these terms.
*Correspondence: Carmen E. Georgescu, Y2dlb3JnZXNjdUB1bWZjbHVqLnJv