 Alina V. Shevchenko1,2*
 Viktor N. Dvigalo2
 Edgar U. Zorn1
 Magdalena S. Vassileva1,3
 Francesco Massimetti1,4
 Thomas R. Walter1Ilya Yu. Svirid2Sergey A. Chirkov2Alexey Yu. Ozerov2Valery A. Tsvetkov2Ilya A. Borisov2
- 1German Research Centre for Geosciences GFZ, Potsdam, Germany
- 2Institute of Volcanology and Seismology FEB RAS, Petropavlovsk-Kamchatsky, Russia
- 3Institute of Photogrammetry and GeoInformation, Leibniz University Hannover, Hannover, Germany
- 4Department of Earth Sciences, University of Turin, Turin, Italy
Dome-building volcanoes often develop by intrusion and extrusion, recurrent destabilization and sector collapses, and renewed volcanic growth inside the collapse embayment. However, details of the structural architecture affiliated with renewed volcanic activity and the influences of regional structures remain poorly understood. Here, we analyze the recent activity of Shiveluch volcano, Kamchatka Peninsula, characterized by repeated episodes of lava dome growth and destruction due to large explosions and gravity-driven collapses. We collect and process a multisensor dataset comprising high-resolution optical (aerial and tri-stereo Pleiades satellite), radar (TerraSAR-X and TanDEM-X satellites), and thermal (aerial and MODIS, Sentinel-2, and Landsat 8 satellites) data. We investigate the evolution of the 2018–2019 eruption episode and evaluate the morphological and structural changes that led to the August 29, 2019 explosive eruption and partial dome collapse. Our results show that a new massive lava lobe gradually extruded onto the SW flank of the dome, concurrent with magmatic intrusion into the eastern dome sector, adding 0.15 km3 to the lava dome complex. As the amphitheater infilled, new eruption craters emerged along a SW-NE alignment close to the amphitheater rim. Then, the large August 29, 2019 explosive eruption occurred, followed by partial dome collapse, which was initially directed away from this SW-NE trend. The eruption and collapse removed 0.11 km3 of the dome edifice and led to the formation of a new central SW-NE-elongated crater with dimensions of 430 m × 490 m, a collapse scar at the eastern part of the dome, and pyroclastic density currents that traveled ∼12 km downslope. This work sheds light on the structural architecture dominated by a SW-NE lineament and the complex interplay of volcano constructive and destructive processes. We develop a conceptual model emphasizing the relevance of structural trends, namely, 1) a SW-NE-oriented (possibly regional) structure and 2) the infilled amphitheater and its decollement surface, both of which are vital for understanding the directions of growth and collapse and for assessing the potential hazards at both Shiveluch and dome-building volcanoes elsewhere.
Introduction
Volcanic edifices develop as a result of interactions between volcano growth and mass wasting - constructive and destructive processes, respectively. A volcano is constructed as a result of the deposition of lava flows, lava domes, cinder- or stratocones, shallow magma intrusions, among others. Volcanoes are destroyed again by the formation of craters, collapse scars, landslides, and calderas. Important volcano architectures comprising detachment surfaces, fault zones, and lithological contrasts evolve in association with these activities, and these structures may control the future evolution of a volcano and its magma pathways (Gudmundsson, 2020).
The constructive and destructive dynamics of volcanoes have been analyzed for various volcano types and are particularly dramatic at dome-building volcanoes. Some volcanoes are constructed through the accumulation of viscous lava, resulting in the formation of lava domes; examples include Mount St. Helens, United States (Swanson and Holcomb, 1990), Bezymianny, Russia (Gorshkov and Bogoyavlenskaya, 1965), Unzen, Japan (Nakada et al., 1999), and Popocatépetl, Mexico (Gómez-Vazquez et al., 2016). In contrast, if the lavas have a lower viscosity, they do not lead to the formation of steep domes but rather tend to flow over long distances, thereby forming thick and massive coulees, as those at Merapi, Indonesia (Walter et al., 2013), and Kizimen, Russia (Dvigalo et al., 2013). Lava domes can grow endogenously by the intrusion of new material into their bodies or exogenously by the extrusion of separate lava lobes onto their surfaces through cracks or vents (Williams and McBirney, 1979; Hale et al., 2009). The accumulation of coherent volcaniclastic deposits together with unconsolidated ejecta results in the growth of dome-building volcanoes and the formation of composite volcanoes (Karátson et al., 2010), where the transition from a lava dome to a stratovolcano can be observed (Shevchenko et al., 2020). On the other hand, volcanoes are destroyed by explosive eruptions that produce craters and excavate part of the edifice. For example, a large explosion at Bezymianny in 2006 produced a summit crater in the center of the dome (Girina, 2013; Shevchenko et al., 2020). Additionally, subsidence in the summit areas of active volcanoes results in the formation of collapse calderas (Geshi et al., 2002) or in the deepening of already existing depressions (Walker, 1984), and these features may be obscured in the future by growing lava domes (Tatsumi et al., 2018). Furthermore, sector collapses can destroy large parts of a volcanic edifice (Watt, 2019). For instance, the catastrophic sector collapses that occurred at Bezymianny in 1956 (Gorshkov, 1959; Belousov and Belousova, 1998), at Mount St. Helens in 1980 (Lipman and Mullineaux, 1981) and at Anak Krakatau, Indonesia, in 2018 (Walter et al., 2019) resulted in the formation of large and wide-open collapse amphitheaters that span 0.5–2 km in width; in contrast, smaller-scale partial dome collapses, e.g., those that occurred at Soufriere Hills, Montserrat, in 1997 (Voight et al., 2002) and 2010 (Stinton et al., 2014) and at Merapi, Indonesia, in 2006 (Ratdomopurbo et al., 2013), produce narrower collapse scars and are more common.
Such constructive and destructive processes may act simultaneously or in alternating ways. Both types of processes are largely affected by existing and evolving tectonic structures, both of which are related to the regional tectonics and local volcano-tectonics (Gudmundsson, 2020). Sector collapses evolving along decollements yield open amphitheaters that are infilled by renewed volcanism until a repeat collapse occurs (Walter and Schmincke, 2002), and the original sliding plane is preserved as a mechanically weak zone that affects future activities. Furthermore, tectonic alignments may control the direction of growth (such as the preferred geometry of dike intrusions) and the direction of collapse (directed away from fault zones), potentially allowing the location of such a collapse to be inferred indirectly (Merle et al., 2001; Acocella, 2005). While infilled sliding planes and former decollements may be represented by inclined to horizontal lithologies, exposed tectonic faults may be nearly vertical. Nevertheless, since constructive and destructive processes may interfere with regional and local tectonic processes, details regarding their structural alignments are commonly difficult to decipher.
Remote sensing is an efficient and safe method for monitoring the evolution of a volcano; effective observation techniques include thermal remote sensing (Coppola et al., 2020), synthetic aperture radar (SAR) analysis from spaceborne or airborne platforms (Schaefer et al., 2016), and multisensor approaches (Corradini et al., 2016). Freely available satellite data and smart data science allow the monitoring of deformation fields, thermal anomalies, and gas emissions in near real time (e.g., Valade et al., 2019; Massimetti et al., 2020). In this study, we use a multisensor remote sensing approach to investigate Shiveluch, one of the most active volcanoes in Kamchatka (Figures 1A,B).
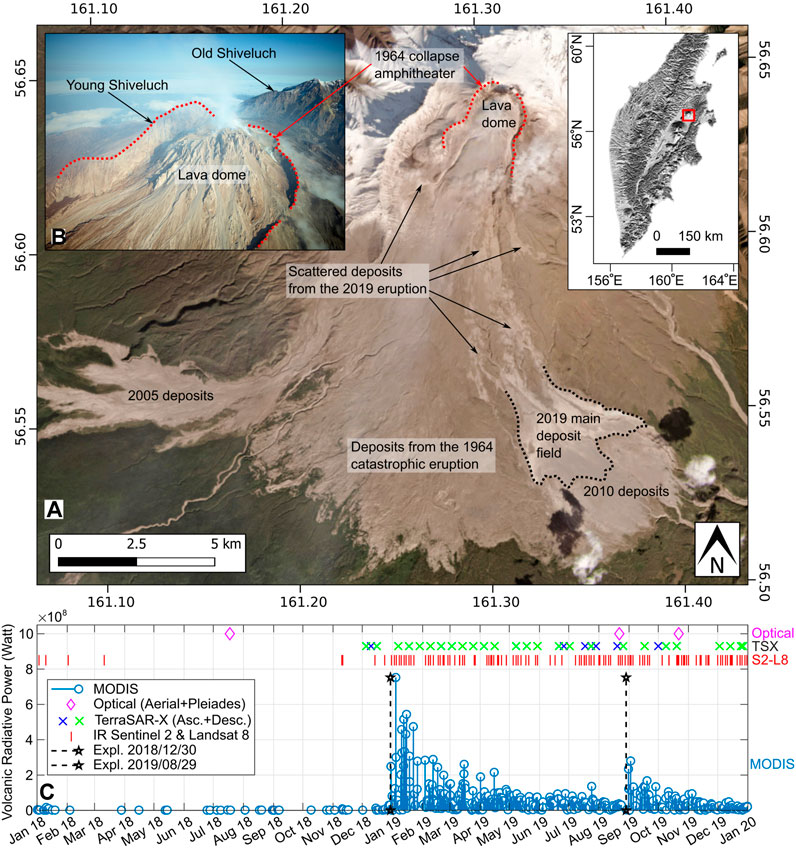
FIGURE 1. Shiveluch volcano and its deposit field (A) Optical image from the Dove satellite (Planet Labs, Inc.https://api.planet.com) acquired on September 13, 2019 showing the location of the active lava dome encircled by the 1964 collapse amphitheater (red dotted line), from which all subsequent eruptive deposits (labeled 1964, 2005, 2010, and 2019) spread outward toward the south. The scattered deposits from the 2019 eruption are visible and marked by black arrows. The upper right inset map shows the location of the volcano (red square) on the Kamchatka Peninsula (B) Oblique helicopter flight view to the north showing the Shiveluch lava dome on August 22, 2019. The 1964 collapse amphitheater is delineated by a red dotted line. The map was generated using ArcGIS 10.2.1 in the WGS84 coordinate system (C) Data used in the investigation. The high-resolution optical data (diamonds) acquired before and during the eruption were used for topographic analysis and compared with the TSX satellite radar data (green triangles). The thermal emissions were analyzed using the Sentinel 2 and Landsat 8 satellites (red bars). Blue lines with circles summarize the 2018–2019 VRP time series (in watts) provided by the MIROVA system (www.mirovaweb.it). Black stars and dotted lines mark the occurrence of the two main explosions on December 30, 2018 and August 29, 2019.
Shiveluch, which can be characterized by long-term interactions between constructive (dome growth) and destructive (explosions, dome collapses) processes, is located at the junction of the Aleutian and Kuril-Kamchatka volcanic arcs in the northern part of the Central Kamchatka depression. The volcano is situated to the north of the Klyuchevskaya volcanic group, which comprises the active volcanoes Tolbachik, Bezymianny, and Klyuchevskoy (Koulakov et al., 2020). The details of the structural trend at Shiveluch remain unclear, but the volcano appears to be associated with a regional SW–NE-aligned tectonic architecture that is traceable by an alignment of monogenic cones in this direction (Koulakov et al., 2020).
The age of Shiveluch is estimated to reach 60–70 ka (Melekestsev et al., 2003). Its edifice consists of two parts: 1) the remnants of Old Shiveluch (Stariy Shiveluch), a stratovolcano visible to the NE that was destroyed by a giant collapse at 30 ka (Ponomareva et al., 1998), and 2) Young Shiveluch (Molodoy Shiveluch), which is visible to the SW and is currently active (Dvigalo, 1988; Dirksen et al., 2006; Shevchenko et al., 2015).
On 12 November 1964, a catastrophic event occurred at Young Shiveluch (Belousov, 1995) in association with 1) the collapse of a complex of lava domes, 2) the formation of a collapse amphitheater open to the SSW with dimensions of 1.8 km × 3.5 km, 3) the emplacement of a debris-avalanche covering an area of 104 km2 (Dvigalo and Shevchenko, 2015) at the southern foot of the volcano, and 4) a Plinian eruption caused by decompression due to the collapse (Belousov, 1995). This major destructive event was soon followed by the new construction of an edifice located atop the former decollement plane and gradual infilling of the amphitheater.
Fifteen years following this event, in 1979, the first photogrammetric aerial survey of Shiveluch’s collapse amphitheater was performed by the Institute of Volcanology and Seismology (IVS). A comparison of the 1979 data with the data obtained during the second survey in 1980 revealed precursors of further activity: surface deformation of the amphitheater floor, fractures, and the disappearance of thermal lakes that were previously observed (Kirsanova, 1970; Dvigalo, 1988; Dvigalo, 2000). The evolving activity was further monitored and in August 1980, the growth of a new lava dome was observed within the amphitheater; this growth continued over several intervals to the present (2021). During the first two growth periods in 1980–1981 and 1993–1995, the dome grew endogenously (Dvigalo, 1988; Melekestsev et al., 2004). However, the activity shifted in 2001 (Fedotov et al., 2001) with the manifestation of exogenous growth as lava lobes began to extrude and crease structures formed (Shevchenko et al., 2015). These constructive episodes continued, but the dome edifice became unstable due to the growing load, uneven distribution of the extrusive bodies, episodic endogenous growth, and increased explosive activity (Shevchenko et al., 2015). As a consequence, the construction of the Shiveluch dome was repeatedly interrupted by destructive events (Shevchenko and Svirid, 2014): the two largest events occurred in 2005 and 2010, which left collapse scars on the SSW and SSE flanks of its edifice, respectively, and the pyroclastic density currents (PDCs) from these collapses extended distances of ∼19 and ∼16 km, respectively (Dvigalo et al., 2011; Ramsey et al., 2012). The eruption columns from the explosive events reached a height of 15 km (Ozerov et al., 2020). To the best of our knowledge, the Shiveluch lava dome has not been visited for direct study since 2008 because it is hazardous to access and exhibits unpredictable activity. Therefore, the remote sensing techniques employed in this work are relevant for studying the ongoing evolution of the Shiveluch dome in detail.
During the 2018–2019 period, the Kamchatka Volcanic Eruption Response Team (KVERT) (http://www.kscnet.ru/ivs/kvert/index?lang=en; Gordeev and Girina, 2014) and the online Middle Infrared Observation of Volcanic Activity (MIROVA) system (https://www.mirovaweb.it; Coppola et al., 2016) suggested pronounced two-stage activity consisting of a constructive-destructive episode at Shiveluch volcano. Additionally, the regional seismic network operated by the Kamchatka Branch of the Unified Geophysical Service (http://www.emsd.ru; Chebrov et al., 2013) detected evidence reflecting the culminating activity of this episode. The MIROVA system showed that the 2018 thermal activity was weak and discontinuous and consisted of low-power anomalies, indicating that hot exposed magmatic material was absent and that these anomalies were related just to moderate gas and steam. Changes in the thermal emissions of the volcano were observed in late December 2018, when an explosive event that marked the beginning of a new eruptive phase was identified by KVERT, which issued a Volcano Observatory Notice for Aviation (VONA) on December 30, 2018 (VONA note 20201229/0050Z). Thereafter, the thermal flux continued to be high but gradually declined throughout 2019, suggesting ongoing shallow activity and the production of hot ejecta over the dome edifice. Another large explosive eruption occurred on August 29, 2019 (VONA note 20190829/0339Z), marking another peak in thermal emissions on September 02, 2019 that then declined by the end of 2019. This trend in volcanic radiative power (VRP) was monitored by the online MIROVA system, which revealed abrupt changes after the explosion and suggested an important role of explosive events in the shallow volcanic behavior and the production of diverse volcanic products and styles. According to data from the Kamchatka Branch of the Unified Geophysical Service, the seismicity exceeded the background level on August 29, 2019, with 53 events occurring across the edifice. Continuous spasmodic volcanic tremors up to 0.5 μm/s were detected, and from 00:57 to 06:00 (GMT), a series of shallow events were recorded, possibly accompanying a powerful explosive eruption with ash emissions reaching 12 km above sea level (a.s.l.).
In this study, we utilize a set of multisensor data (Figure 1C; Shevchenko et al., 2021) to explore these events in the frame of the complex constructive-destructive behavior that Shiveluch typically exhibits with regard to its volcanic activity. Moreover, we discuss the influence of structural control, possibly manifesting as a tectonic SW–NE-oriented structure together with a local decollement. To better understand the relationship between these constructive and destructive events and to shed some light on the structural architecture of the volcano, we investigated the 2018–2019 activity and revealed an interesting and complex relationship among the different intrusive, extrusive, explosive, and thermal characteristics of the dome.
Data and Methods
This study of the 2018–2019 eruptive activity at Shiveluch is based on remote sensing data acquired by optical sensors complemented by SAR and thermal sensors. While optical sensors provide a high spatial resolution and permit the three-dimensional mapping, SAR sensors possess the high temporal resolution required to detect and measure the processes involved. Accordingly, the methods section describes the techniques used to process and analyze the optical, radar, and thermal sensor data. The limitations of these methods are discussed in the Supplementary Material Limitations section.
Photogrammetry and Digital Elevation Model Analysis
An initial overview was obtained by utilizing satellite imagery acquired by the Dove satellites, the largest satellite constellation dedicated to imaging the Earth, and distributed by Planet Labs, Inc. (https://api.planet.com). We downloaded the available Planet data and imported the 3-m resolution imagery as background information in a geoinformatics framework using ArcGIS 10.2.1 to aid the interpretation of our higher-resolution photogrammetric dataset.
The photogrammetric dataset was acquired by processing high-resolution aerial and satellite optical imagery. Photogrammetry was conducted to extract the pre-eruption topography for July 18, 2018 and to monitor the co-eruption topography on August 22, 2019 and October 22, 2019. We also reprocessed the July 12, 2012 data described in (Shevchenko et al., 2015) with new techniques to achieve a better resolution and used the data in this work to continue the topographic chronology recorded for 2001–2012 (Shevchenko et al., 2015).
The optical satellite data were tri-stereo panchromatic 1-m resolution imagery acquired on July 18, 2018 with the Pleiades satellite PHR1B sensor. We processed the data in Erdas Imagine 2015 v15.1 similar to (Bagnardi et al., 2016; Shevchenko et al., 2020). To determine the relative orientation of the images, 37 tie points were calculated automatically with a manual correction, while a rational polynomial coefficient block adjustment, which is a transformation from pixel information to latitude, longitude, and height, was automatically employed for the interior and exterior orientations. After constraining the image orientation, we obtained a photogrammetric model with a total root mean square error (RMSE) of 0.2 m. By using the Enhanced Automatic Terrain Extraction (eATE) module with the normalized cross-correlation algorithm implemented in Erdas Imagine, we were able to extract a 2-m resolution point cloud (PC) referenced to the World Geodetic System 1984 (WGS84) coordinate system (UTM zone 57). This PC was filtered with the CloudCompare v2.9.1 noise filter and then manually cleaned with the CloudCompare segmentation tool. As strong volcanic steam emissions caused a large gap in the PC in the NE part of the dome, we used a 5-m resolution DEM constructed from TanDEM-X data (see SAR Data and Monitoring the Material Redistribution (d)) to fill the gap and obtain the missing topography.
Helicopter surveys allowed us to acquire nadir and oblique aerial images during overflights on July 12, 2012 with a conventional Canon EOS 20D digital camera (focal length: 14.183 mm, resolution: 3,504 px × 2,336 px) and on August 22, 2019 and October 22, 2019 with a PhaseOne IXA 160 digital aerial camera (focal length: 28 mm, resolution: 8,984 px × 6,732 px). The average flying height was 4,000 m a.s.l. for the nadir survey and 3,200 m a.s.l. for the oblique survey. We processed the images in Agisoft Metashape 1.5.2. To ascertain the interior orientation, we set the camera parameters (focal length and sensor size), and the relative orientation was performed automatically by aligning the images and calculating tie points. To perform the exterior orientation and assign ground control points (GCPs), we used coordinates taken from stable, prominent topographic peaks identified in the 1979 photogrammetric model (Dvigalo, 1988; Dvigalo, 2000), which is referenced to the USSR State Geodetic Network coordinate system (Chumachenko, 1966); the same technique was employed to georeference the previous photogrammetric dataset of Shiveluch volcano (Shevchenko et al., 2015). The total RMSEs of the aerial models orientation vary from 1.5 to 2 m (Supplementary Table S1). As a result of processing, we obtained three aerial PCs with an average resolution of 2 m; these PCs were then filtered and cleaned in the same way described above. The gaps caused by volcanic steam emissions and by atmospheric clouds were filled in by collecting manual points using the anaglyph stereo mode of Photomod 5, which was performed by placing a floating mark on the visible surface and storing the XYZ coordinates of each point similar to (Schilling et al., 2008; Shevchenko et al., 2020).
The aerial PCs had the same spatial scale as the Pleiades PC but were geopositionally shifted due to the different coordinate systems. Hence, to compare the PCs, we aligned the aerial PCs to the Pleiades PC with several points along the rim of the amphitheater using the CloudCompare alignment tool. The RMSEs of the alignment vary from 2.3 to 3.1 m (Supplementary Table S1). Thus, we obtained four stacked PCs in WGS84 UTM57 and were able to calculate the differences between them. We outlined the areas of the lava dome, including the talus, separately for each date and calculated the volumes within these specific areas between two consecutive PCs. The total volumes of the dome were calculated relative to the 1979 DEM with the topography of the amphitheater floor prior to the dome growth (Dvigalo, 1988; Shevchenko et al., 2015). The time-averaged growth rates were obtained by dividing each volume difference by the time interval between the two corresponding consecutive acquisitions.
To estimate the uncertainties in the calculated volumes, we distributed the RMSE for each acquisition date (Supplementary Table S1) over the corresponding area of the dome (Table 1). For the volume derived from the Pleiades DEM, we used the RMSE of the photogrammetric model orientation; for the volumes derived from the aerial DEMs, we used the total RMSEs, which includes the orientation errors and the errors of alignment to the Pleiades PC. The maximum volume error is 12 × 106 m3 on August 22, 2019, which is 1.6% of the total dome volume (Table 1). The uncertainties in the growth rates were calculated by dividing the volume errors by the time interval between two neighboring dates. The maximum growth rate error amounts to 31,000 m3/day (0.36 m3/s) or 8.5% for the August 22, 2019 data (Table 1; Supplementary Table S1).
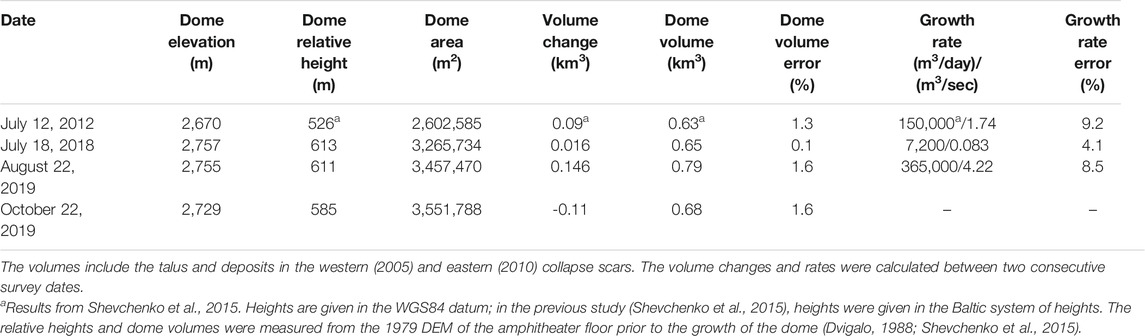
TABLE 1. Main geometric parameters summarizing the initial construction and later destruction of the Shiveluch dome.
SAR Data and Monitoring the Material Redistribution
Tasking the TerraSAR-X (TSX) satellite allows us to select a set of 6 ascending and 26 descending amplitude images of Shiveluch volcano from December 5, 2018 to December 25, 2019. The data were acquired in spotlight mode, which allows the redistribution of the dome material to be monitored at a ∼1-m spatial resolution with a temporal resolution reaching 11 days (for descending data). The SAR data were then analyzed in the following ways:
(a) First, we visually described the amplitude imagery used for interpretation in radar coordinates similar to the method previously applied to other volcanoes (e.g., Arnold et al., 2019). For this purpose, we mainly used the descending data, as their acquisition was more regular and the viewing geometry was more favorable with fewer foreshortening and shadowing effects than the ascending data. We loaded all available data into a coregistered stack using ENVI SARScape v. 5.5.3 and applied a 3 × 3 kernel filter to reduce the speckle effect and visualize the reflectance changes observed in the imagery.
(b) Second, we performed a more quantitative analysis of the shadowing effects located in areas containing approximately N–S-oriented topographic valleys and ridges with slopes at an angle higher than the SAR line-of-sight (LOS) incidence angle (similar to Wadge et al., 2011; Arnold et al., 2017; Arnold et al., 2019). In other words, radar shadows develop in deeply eroded ravines but disappear if these ravines are refilled by new volcanic materials. The radar shadow width is proportional to the relative height h of the topographic feature (h = wloscosϕ/tanθ), where wlos is the radar shadow width in the LOS direction and is measured as a distance in the geocoded image; ϕ is the angle between the satellite LOS direction and the slope direction based on the DEM and is measured as an angle between two lines in the geocoded image; and θ is the radar incidence angle, a given parameter related to the SAR acquisition geometry. For this purpose, we geocoded the coregistered and filtered TSX images and resampled them to 1 × 1 m2 pixels using the 2018–2019 optical DEMs (see Photogrammetry and Digital Elevation Model Analysis). Then, we applied the abovementioned radar shadow method to indirectly derive the minimum deposit thickness during this period of constructive and destructive activity assuming that shadows change by altering the depths of the ravines. We derived a time series of the minimum deposition thickness by comparing the shadow width between a reference image and a specific date. We used the QGIS v. 3.16.3 software package to perform the distance and angle measurements and further analysis. We measured wlos and ϕ at several points along the slopes where the shadow was projected, and obtained a pointwise measure of the deposit thickness. We note that this shadow method allows us to obtain only a minimum value of the thickness at some points, for instance, where the accumulated material exceeds the slope height casting the shadow. Accordingly, we can estimate the thickness up to the total height of the topographic features, but cannot measure how much deposited material has accumulated above that height. Finally, we estimated approximate deposit volumes for the different dates by dividing the deposition extents obtained by visual digitization using the SAR images into polygonal subareas (i.e., Voronoi diagrams) based on the deposit thicknesses calculated at given points. Polygons of different sizes varying between hundreds of square meters and hundreds of thousands of square meters were generated; for each polygon, a constant thickness was assumed. A sketch of this method is illustrated in Supplementary Figure S1.
(c) As small-scale (on the order of millimeter-to centimeter-level) deformations were not detectable using the differential interferometric SAR method due to decorrelation and coherence loss, we focused on investigating large-scale (meter-level) deformations using the pixel offset method. Accordingly, we determined pixel offsets by applying the particle image velocimetry (PIV) technique using the LaVision DaVis v10.0.5 software package to track and visualize changes in the coregistered SAR images. This method vectorizes pixel offsets in the image plane based on the intensity value of the image. The image cross-correlation and pixel offset methods have been used to solve other geodetic problems for many years; for instance, these techniques have been applied to optical imagery and SAR data of glaciers (Evans, 2000), to analyze the displacements of landslides and man-made activities (Sun and Muller, 2016), and to monitor seismogenic and volcanic terrains (Funning et al., 2005; Casu et al., 2011). The pixel offset method has also been used to measure the subpixel deformations of dome-building volcanoes at high resolution (Salzer et al., 2016; Zorn et al., 2020). Unlike optical data, SAR pixel offset vectors are measured in the LOS (range) direction and in the satellite’s along-track flight direction, where the data row and column (range and azimuth) offsets between two consecutive acquisitions are determined (Pathier et al., 2006). These pixel offset measurements are ideally scaled to units of meters because even submeter displacements may be determined (Casu et al., 2011). Here, we derived an approximate uniform pixel-to-meter scale only, which is based on the dimensions of known, prominent cliff faces (0.59 px/m for the ascending view and 0.73 px/m for the descending view). We thus focused on qualitatively interpreting the pixel-scale range/azimuth displacements. However, as the image perspective is the same between images, we can still quantify the pattern, the relative magnitude, and the approximate direction of the displacements. Features are tracked on the coregistered images with repeat passes of decreasing subwindows, twice with 128 px × 128 px and 50% overlap and once with 68 px × 68 px and 75% overlap.
(d) Finally, we used the SAR images to construct a 5-m resolution DEM from the July 10, 2018 descending TanDEM-X (TDX) data to fill the gap in the 2018 Pleiades DEM (see Photogrammetry and Digital Elevation Model Analysis). TDX is a bistatic SAR mission formed by adding a second, almost identical spacecraft to TSX (Kubanek et al., 2021). Therefore, this mission allows the acquisition of two simultaneous SAR images over the same area, thereby eliminating possible temporal decorrelations between the images and maintaining a normal baseline between 250 and 500 m, which is suitable for SAR interferometry and the generation of a DEM. We used the interferometric module in ENVI SARscape to build the interferogram, perform the unwrapping step, and finally convert the result into height information using a forward transformation from radar to geographic coordinates. The RMSE of the generated DEM was evaluated to be approximately 5 m based on the coherence value, i.e., the quality of the interferogram.
Thermal Infrared Data and Determination of Migrating Temperature Anomalies
Satellite-acquired thermal infrared data were also used in this study and were validated during our fieldwork overflights using handheld cameras.
(a) The satellite images used for this study were acquired by different infrared satellite platforms, including Moderate Resolution Imaging Spectroradiometer (MODIS) images from the Terra and Aqua satellites, Multispectral Instrument (MSI) images from Sentinel-2 (S2), and Landsat 8 (L8) Operational Land Imager (OLI) images (Coppola et al., 2020; Plank et al., 2021). These products are complementary, as, for instance, MODIS acquires images with a near-daily temporal resolution at a low spatial resolution of 1 km, whereas the S2 and L8 sensors provide data at spatial resolutions of 20 and 30 m, respectively, although they have temporal resolutions of only 2–5 days and 8–16 days, respectively (Ramsey and Harris, 2013; Coppola et al., 2016). The MODIS data were processed by the MIROVA system in the mid-infrared (3.9 µm) region, providing the VRP (in watts) emitted by volcanic activity at magmatic temperatures (T > 500 K) with an average error of ±30% (Coppola et al., 2016). MODIS infrared data have a 1 km spatial resolution and a high revisit frequency (up to four times daily) for volcanic monitoring purposes. High-spatial resolution thermal satellite datasets, including S2 and L8, have been investigated by applying a novel hotspot detection algorithm based on fixed ratios in the shortwave infrared (SWIR) regions with a contextual threshold derived from a statistical distribution of hotspot pixel clusters (Massimetti et al., 2020), as SWIR signals, in particular, record almost purely thermal emissions produced by hot emitting bodies (Blackett, 2017). Images were analyzed considering the SWIR top-of-atmosphere (TOA) reflectances in the ρ12 (2.19 µm), ρ11 (1.61 µm), and ρ8A (0.86 µm) bands for the S2 MSI and the ρ7 (2.11–2.29 µm), ρ6 (1.57–1.65 µm), and ρ5 (0.85–0.88 µm) bands for the L8 OLI. The algorithm works on both imagery datasets and detects the number of “hot” pixels (S2-L8 number of pixels), where a hotter area is superficially exposed, with an overall estimate of 2–4% false alerts detected (Massimetti et al., 2020). The reliability of the applied algorithm has already been successfully verified on a variety of different volcanological thermal-emitting phenomena worldwide (Valade et al., 2019; Massimetti et al., 2020). The combined thermal datasets allow major hot volcanic thermal processes and their effects to be tracked, particularly those in a complex volcanic context such as Shiveluch volcano with a variety of volcanic products and styles.
(b) We also acquired thermal infrared images of the lava dome from a helicopter in conjunction with the optical survey (see Photogrammetry and Digital Elevation Model Analysis) before and after the August 29, 2019 eruption. On the first flight, we used a FLIR Tau 2 camera with a 9 mm lens and a TEAX ThermalCapture frame grabber set to a sampling rate of 8 Hz. The resulting images had a resolution of 640 px × 512 px and provided radiometric temperature data. The images were processed and exported using Thermoviewer (v3.0.4) assuming a constant emissivity of 0.95, a transmissivity of 0.7 and environmental and path temperatures of 10°C, which are comparable to those in similar studies (Stevenson and Varley, 2008; Walter et al., 2013a; Zorn et al., 2020). For the second flight, we used a ThermaCAM P640 camera at a resolution of 640 px × 480 px, and the images were exported and processed with FLIR Tools (v.5.13) while assuming the same environmental parameters as before.
Results
Morphological Changes Derived From a Comparison of the Optical DEMs
For a base map, we used a photogrammetric dataset that was acquired on July 12, 2012 and has already been described earlier (Shevchenko et al., 2015). This base map shows the collapse amphitheater resulting from the 1964 collapse, the central dome that grew inside the amphitheater, and two smaller scars that formed in 2005 and 2010 (highlighted in Figure 2A). Two lava lobes can be identified on the dome: the northern lobe that partially overlaps the NW rim of the 2010 scar and the SSE lobe with a crater on top (see Figure 3 and the details in Shevchenko et al., 2015). Reprocessing the data at a higher resolution allowed us to identify a SW–NE-striking lineament with an azimuth of 027°N (dashed line in Figure 3A). This lineament is also traceable through complex topography; because it notably bisects the lava lobes, the crater, and the talus in the NE sector of the amphitheater and is visible in both the optical and the topographic data, this lineament may represent an important structural feature (Figures 2A, 3A).
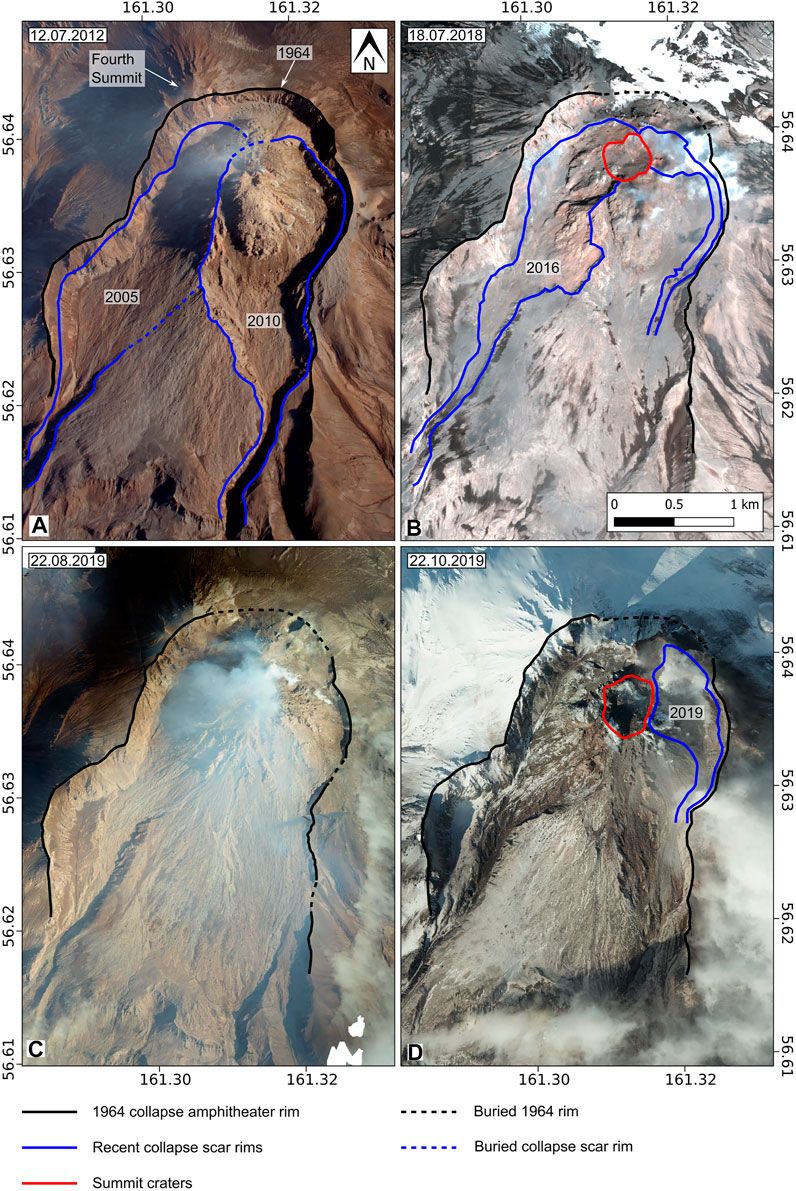
FIGURE 2. Orthophotos of Young Shiveluch constructed from aerial (A,C,D) and Pleiades satellite (B) data with the main destruction features indicated by the colored lines.
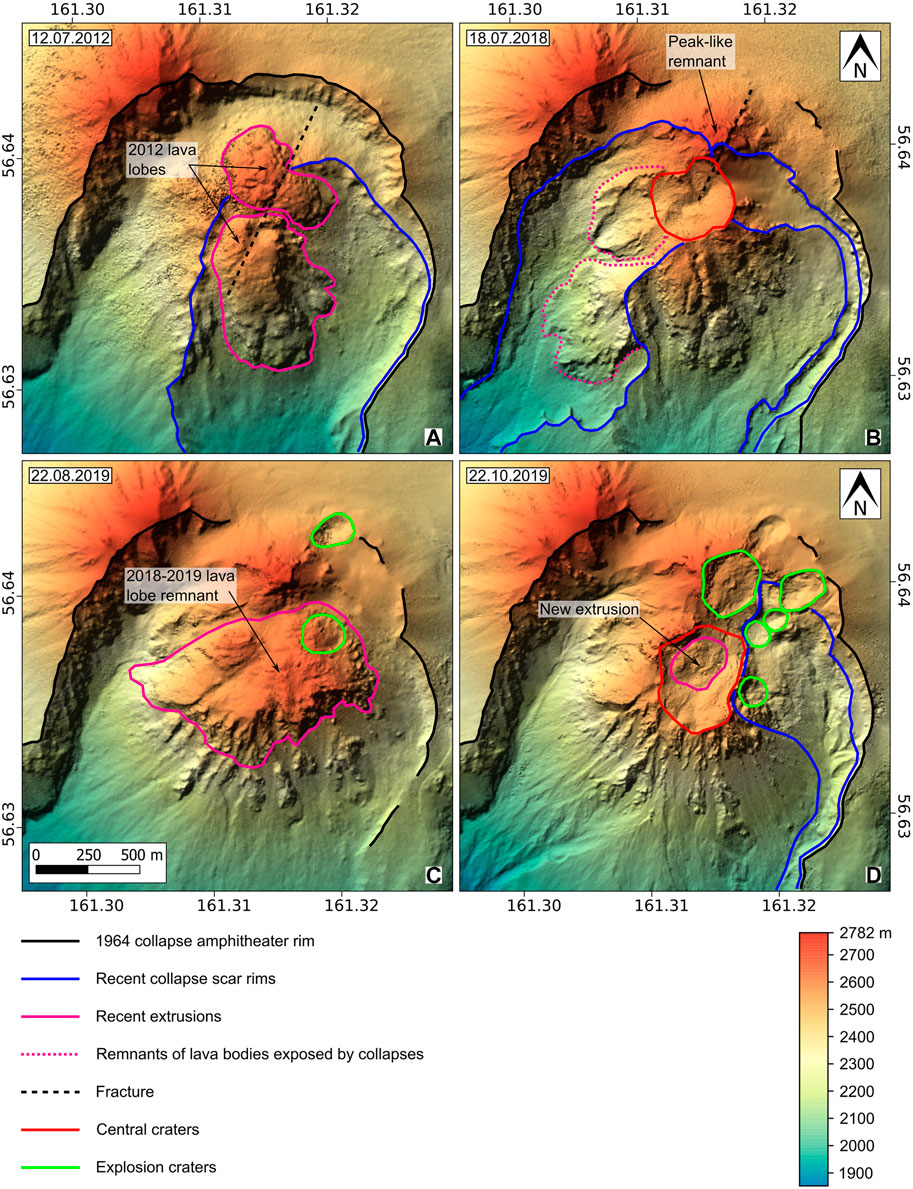
FIGURE 3. Hillshade maps of the Young Shiveluch dome for the 2012 base map and three acquisitions covering the 2018–2019 construction-destruction period. Note the formation of new central craters (red circles) and short-lived explosion craters (green circles). The DEMs were derived from aerial photogrammetric data (A,C,D) and from Pleiades satellite data locally complemented by TDX data (B).
The DEM that we constructed from the July 18, 2018 Pleiades dataset (Figures 2B, 3B) shows the morphology of the volcano several months prior to the beginning of the studied extrusive eruption (which commenced in December 2018). The western to SW sector of the dome currently accommodates a new collapse scar (800 m × 2,000 m) originating from the September 18, 2016 partial collapse. This scar outcrops the core parts of the previously formed lava lobes and narrows towards the SSW into an avalanche chute within the borders of the 2005 scar. Another new, smaller scar (370 m × 700 m) can be observed on the NE flank of the dome, where it narrows into a chute following the eastern rim of the amphitheater. At the summit of the dome, a central crater with a diameter of approximately 350 m is identified (red outline in Figure 2B). The 2012 lava lobe on the SSE flank persists without any major morphological changes; it was destroyed only at the very summit due to the formation of the scar and crater. The main accumulation of material is detected in the northern sector of the dome near the former amphitheater rim (Figures 3B, 4A). A peak-like remnant of the northern part of the dome, which was destroyed by the two collapses (blue outlines in Figures 2B, 3B), had an elevation of 2,757 m and almost reached the highest point of Young Shiveluch, the Fourth Summit (Chetvertaya Vershina), which is 2,782 m in height. The abovementioned SW–NE-striking structural lineament is also observed here, where it bisects the peak-like remnant and the northern half of the central crater (Figure 3B). The relative height of the dome was 613 m. By July 2018, the northern and NE rims of the amphitheater had been almost completely buried under new unconsolidated material. The 2010 collapse scar at the SE foot of the dome was also filled with new material. By comparing the DEMs from 2012 to 2018, we estimate that the dome volume increased by 16 × 106 m3, with a total dome volume of approximately 646 × 106 m3 (Figure 4A). Hence, the average growth rate over the 2012–2018 period was 7,200 m3/day (0.08 m3/s), and further details are provided in Table 1.
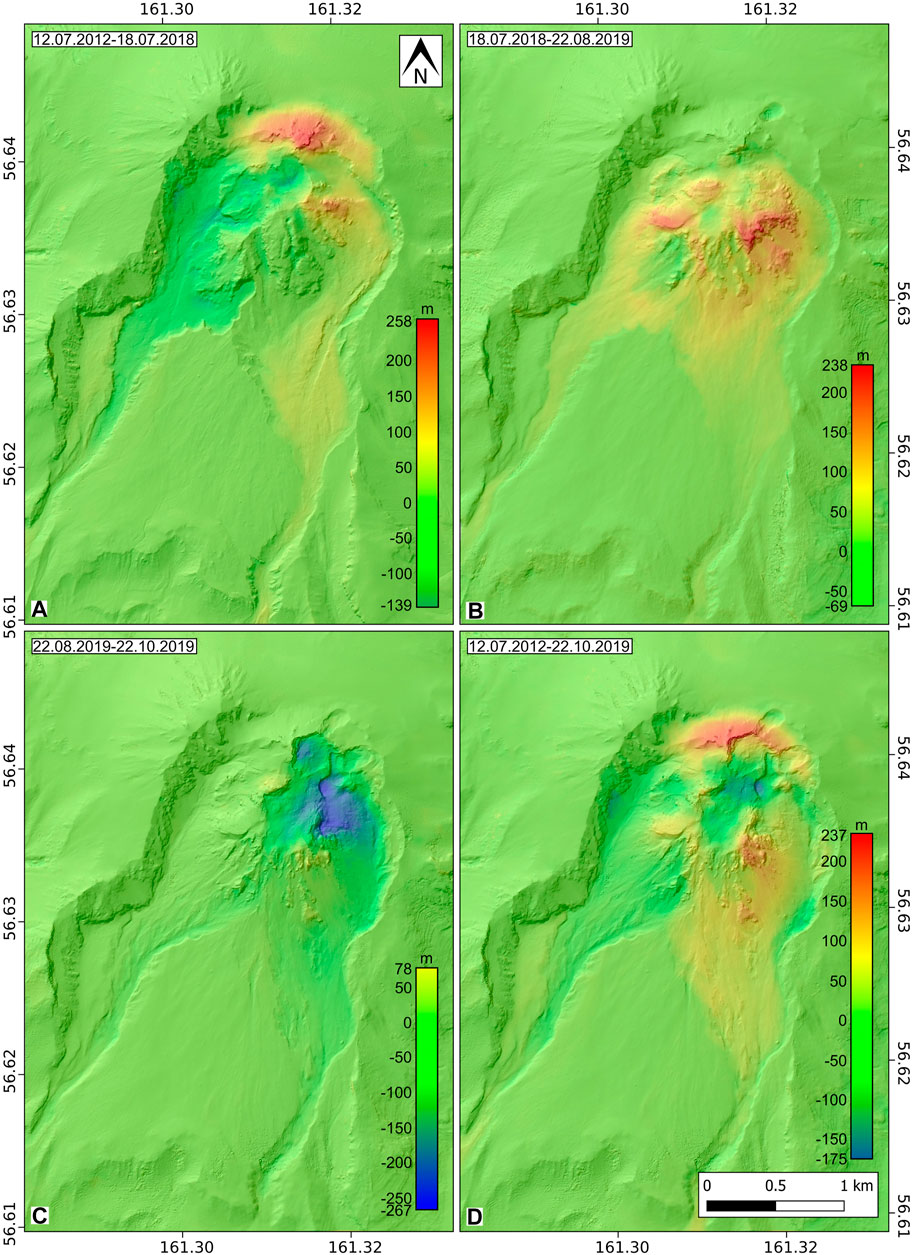
FIGURE 4. Incremental height difference maps generated from the base DEM and the 2018–2019 DEMs. Green indicates no major change, blue indicates material loss (destruction), and red indicates material addition (construction). (A) Comparison between the July 2012 and July 2018 DEMs; (B) comparison between the pre-December 2018 and post-August 2019 extrusive eruption DEMs; (C) comparison between the pre- and post-August 2019 explosive eruption DEMs; (D) comparison between the July 2012 and October 2019 DEMs (covering the whole period of study).
During the December 2018 – August 2019 period, a new extrusive eruption emplaced a massive lava lobe (see Chronology Derived From the TSX Amplitude Images). By August 2019, this lava lobe occupied the entire central part of the dome and covered its western flank (Figures 2C, 3C) with dimensions of 700 m × 1,080 m and a volume (as determined by DEM differencing) of 51 × 106 m3. The lava lobe might be the largest extrusive body that emerged on the dome over the current period of regrowth (since 2001). Furthermore, the data allow the recognition of two new craters: one in the NE sector of the lobe (approximately 180 m in diameter) and another along the northern rim of the amphitheater (130 m × 200 m). During the observation period (July 2018 – August 2019), the thickness of added loose material along the 2005 (western) collapse scar reached 90 and 100 m within the 2010 (eastern) scar. We also estimated the volumes of added material since July 2018 to be approximately 19 × 106 m3 in the 2005 scar and 33 × 106 m3 in the 2010 scar. The height of the dome remained almost the same at 611 m, as its highest northern part did not exhibit any morphological changes that can be identified in the DEMs. The dome volume increased by 146 × 106 m3 after July 2018, which includes the talus and deposits within the two collapse scars (Figure 4B). Ultimately, the total dome volume on August 22, 2019 was 792 × 106 m3. Thus, the average extrusion rate over 1 year was 365,000 m3/day (4.22 m3/s).
On August 29, 2019, a large explosive eruption occurred at Shiveluch, which led to a secondary partial dome collapse (see Chronology Derived From the TSX Amplitude Images). Analysis of the August 2019 (Figure 2C) and October 2019 (Figure 2D) aerial orthophotos allows us to describe details of the morphological changes that occurred in association with this eruption. A new large central summit crater is identified in the October 2019 dataset with dimensions of 430 m × 490 m, and a new extrusion is observed inside this crater with a blocky appearance and dimensions of 220 m × 250 m. At the northern part of the dome, another large crater 300 m in diameter can be recognized. We identify four new small side craters (Figure 3D) with diameters varying from 45 to 90 m. In the eastern and NE parts of the dome, a newly formed scar is visible, which narrows into an avalanche chute in the south; the size of this scar is 600 m × 1,100 m, and its depth varies from shallow (up to 50 m) in its southern sector to deep (up to 270 m) in its NE sector. The western (2005) and eastern (2010) scars also appear to have lost material (Figure 4C). The October 2019 dataset suggests that after the August 29, 2019 eruption, the western scar became deeper by 15 m, while the eastern scar deepened by 40 m on average. The volume within the western scar decreased by approximately 5 × 10⁶ m3, while that within the eastern scar decreased by 84 × 106 m3. The height of the dome decreased by 26 m due to the partial destruction of the northern peak and the formation of the northern crater, yielding a new height of 585 m. The total volume of the dome decreased by 110 × 106 m3 (including the scars); thus, the total dome volume became 682 × 106 m3.
The August 29, 2019 eruption produced a PDC that traveled 12.3 km towards the SE, and the majority of the volume was deposited on top of the 2010 PDC deposits, albeit with a shorter run-out distance. A visual inspection and measurements of the Planet satellite image (Figure 1A) suggest that the August 29, 2019 PDC was deposited in several scattered fields along its path over a total area of 12 km2. A small amount of material also descended along the western (2005) scar and was deposited at the SW foot over an area of 0.5 km2, but this deposition was not captured during our aerial survey. To further analyze the main August 2019 deposition field, we inspected the aerial orthophoto and performed a comparison of the optical DEMs (Figure 5). Material deposition occurred within an area of 7.2 km2 (Figure 5A), reaching a maximum thickness of almost 30 m and an average thickness of approximately 12 m (Figure 5B). We estimate that the volume of the main deposits was 87 × 106 m3, which is 23 × 106 m3 lower than the volume estimated to have been removed from the source edifice. The differences between the volumes of the source material and the deposits can be explained by the scattered regions of deposition in other areas not captured during the aerial survey, by the lack of dense rock equivalent (DRE) measurements, and by the dispersion of fine particles to more distant locations. A geometric analysis of the deposition area implies that this was the third-largest PDC that occurred during the current period (since 2001), after the 2005 and 2010 deposits, which extended over distances of 19 and 16 km, respectively, and spanned areas of 25 km2 (Ramsey et al., 2012) and 27 km2 (Dvigalo et al., 2011).
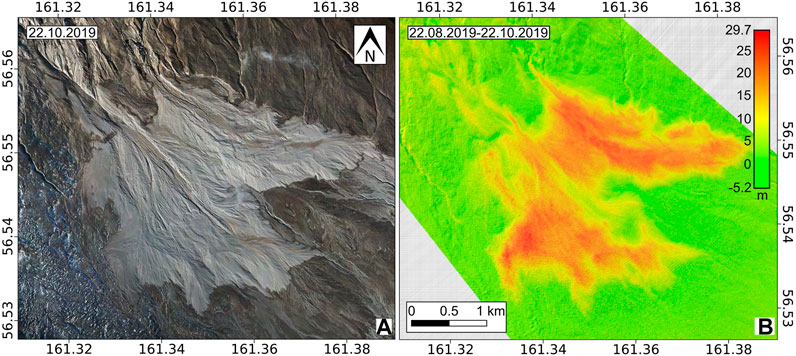
FIGURE 5. Orthophoto (A) and height difference map (B) of the main PDC deposit field from the August 29, 2019 eruption. The location of the field is shown in Figure 1.
Topographic profiles help to further visualize the effects of the constructive and destructive processes at Shiveluch volcano over the studied period (Figure 6). The 2018 profiles show significant enlargement of the edifice in the northern part of the dome relative to 2012 but, in contrast, the loss of material in the central and western parts due to the 2016 collapse and formation of the summit crater (Figures 4A, 6B,C). By August 22, 2019, the edifice height had increased with respect to that in 2012 in the central part and notably surpassed the 2018 height in the eastern sector of the dome (Figures 4B, 6B,C). Because of the substantial loss of material due to the August 29, 2019 eruption, the central dome height decreased even in comparison with the 2012 height; relative to the 2019 pre-eruption morphology, this decrease in height exceeded 250 m in the eastern part of the dome (Figures 4C,D, 6B,C). The accumulation of loose material alternated with its removal within the western (2005) and eastern (2010) scars (Figures 6D,E). In 2018, there was a significant loss of material in the western scar due to the 2016 collapse; then, new material was added in 2019 and eroded again during the 2019 explosive eruption and collapse (Figures 4A–C, 6D). In the eastern scar, deposits accumulated significantly after 2012 but were subsequently removed due to the 2019 destructive events (Figures 4A–C, 6E).
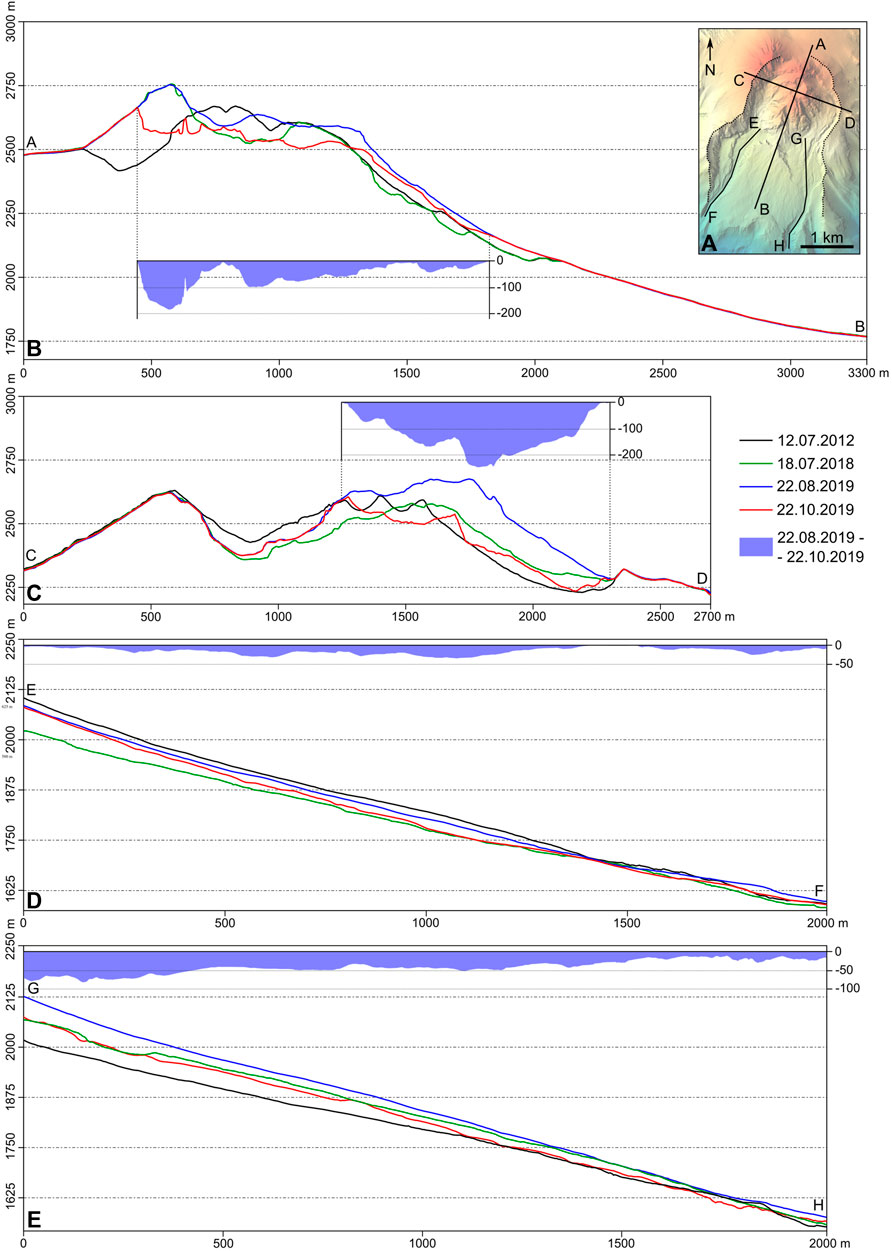
FIGURE 6. Topographic profiles of the Shiveluch lava dome (B,C) and collapse scars (D,E). The profile lines are shown in the insert map (A). The blue shading represents a negative difference between the pre- and post-2019 destructive events.
Material Redistribution Observed by Satellite Radar Observations
Chronology Derived From the TSX Amplitude Images
The analysis of TSX amplitude images provides a more continuous overview of the deformation, as the active system onboard TSX can penetrate dense clouds and thus provide ground scattering observations that can display morphological details. Here, we examine descending orbit images only; however, the ascending imagery is provided in Supplementary Figure S2. The TSX data reveal that the morphology of the dome remained almost the same throughout the year from January 2018 to December 2018 (Figure 7A; Supplementary Movie S1) until December 27, 2018 (Figure 7B), when the new lava lobe became visible at the top of the Shiveluch dome (see Morphological Changes Derived From a Comparison of the Optical DEMs). This new lobe seems to have extruded from the summit crater and spread laterally towards the SW flank. The image from January 7, 2019 shows a further extension of the new lobe (Figure 7C) that covers the older lithology, including the 2012 lava lobe. By January 18, 2019, two sectors of the new lobe had slumped (Figure 7D). In the January 29, 2019 TSX image (Figure 7E), we identify a new half-circular darkened area resulting from low signal backscatter located along the northern rim of the amphitheater and the adjacent outer slope. This darkening is possibly associated with the shadowing effects caused by steepening topography. By February 20, 2019, we can identify the beginning of the gradual destruction of the front of the new lava lobe (Figure 7F). The March 14, 2019 image shows a new small crater (see Morphological Changes Derived From a Comparison of the Optical DEMs) at the top of the lobe in its NE sector (Figure 7G). On April 16, 2019, another new small crater (see Morphological Changes Derived From a Comparison of the Optical DEMs) can be seen in our TSX imagery at the northern rim of the amphitheater (Figure 7H) where the half-circular darkened area had previously been located (Figure 7E). The image from May 8, 2019 shows the continuation of the gradual collapse of the lobe’s front and a noticeable increase in the deposition of loose material along the eastern rim of the amphitheater (Figure 7I). Subsequently, no major morphological changes are revealed, and the image from August 26, 2019 (Figure 7J) shows a very similar morphology, with the exception of the continued minor collapse of the lobe’s front and the deposition of loose material, as well as a new small area of darkening visible at the NE rim of the amphitheater. The extrusion of the lava lobe continued throughout almost the whole observation period, being more intense from the end of December 2018 to the end of April 2019, when the lava lobe virtually ceased growing and was visible only as minor deformations in the vent area (further details are provided in Lava Dome Deformations Revealed by PIV; Supplementary Movie S1).
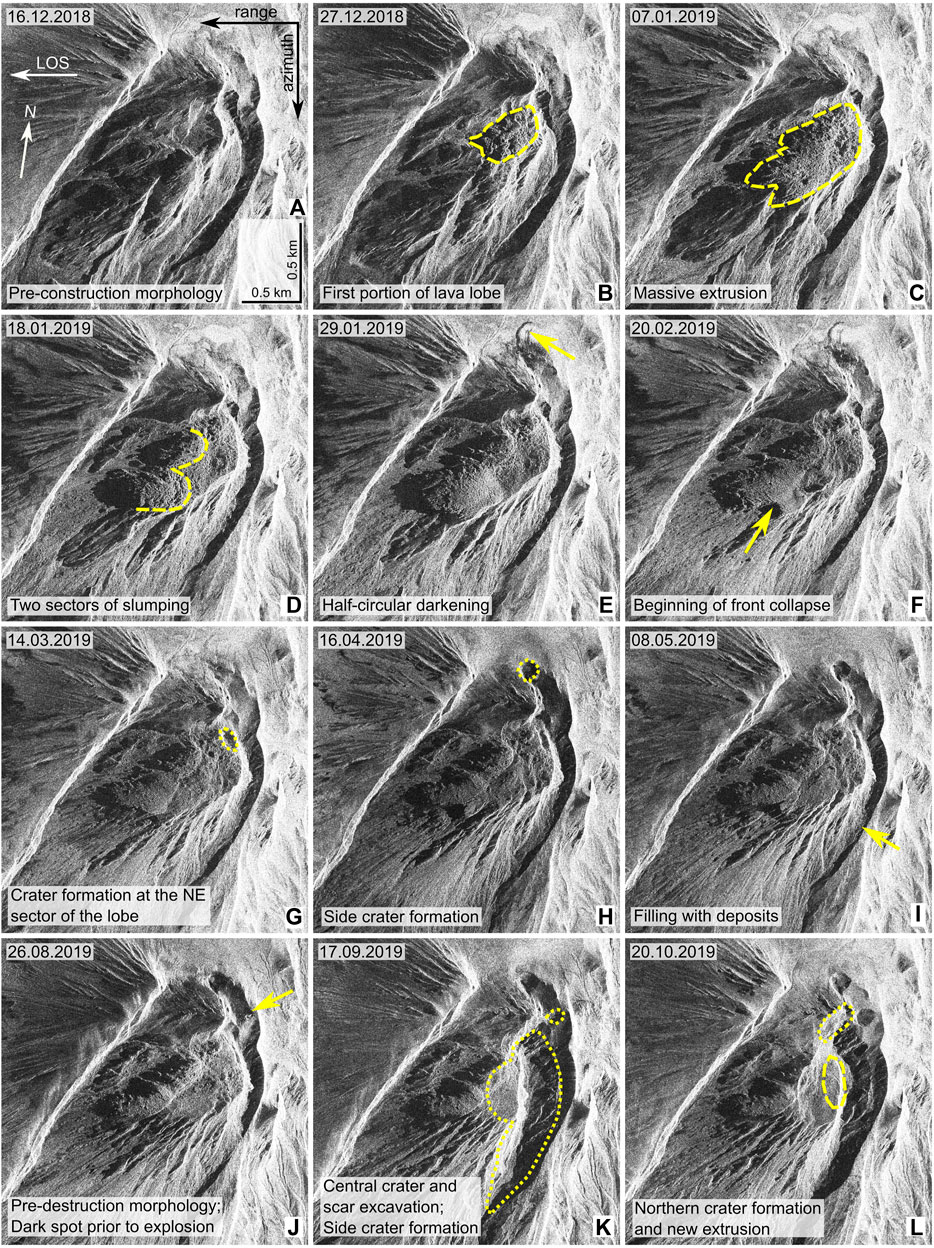
FIGURE 7. Time series of TSX descending orbit amplitude images (in radar coordinates: azimuth and range) showing the chronology of the eruptive events and main morphological changes that occurred over the studied period. Low-amplitude features (craters and scars) are shown with dotted lines; high-amplitude features (extrusive bodies) are shown with dashed lines. Arrows point to the features labeled in the bottom left corners of the images.
The most profound changes are identified in the first post-eruption (i.e., after August 29, 2019) TSX image, which was acquired on September 17, 2019 (Figure 7K); this image reveals the large central crater (see Morphological Changes Derived From a Comparison of the Optical DEMs) that opens eastward into the deep collapse scar, which rotates southward. One new small side crater is visible close to the NE rim of the amphitheater exactly where the area of darkening was previously observed (Figure 7J). The other two craters identified in the aerial data (see Morphological Changes Derived From a Comparison of the Optical DEMs) are not visible in the TSX images due to distortion and shadowing. The southern flank of the dome did not collapse. The image from October 20, 2019 (Figure 7L) shows extrusion occurring from the central crater and destruction of the upper part of the peak (see Morphological Changes Derived From a Comparison of the Optical DEMs) at the northern sector of the dome coincident with the formation of a second large crater. Therefore, although the TSX amplitude images are geometrically distorted, important chronological details of morphological changes can be distinguished, including the relatively precise timing of lava lobe extrusion and the appearance of new craters and collapse scars.
Lava Dome Deformations Revealed by PIV
The TSX amplitude data allowed us to determine pixel offsets. As regular TSX acquisitions were realized in descending orbit, they captured the period covered in this study better than the acquisition in ascending orbit, as the ascending view was less regular and available only during the timeframe preceding the August 29, 2019 eruption and dome collapse. The tracking results are highlighted in Figure 8, and the full tracking sequence can be found in Supplementary Figure S3. The results are displayed in radar coordinates to preserve the constant-pixel dimensions, where the displacement vectors combine range and azimuth offsets. The tracking initially shows the emplacement of the lava lobe in January 2019, presenting a mostly decorrelated surface at the top and in the western sector of the dome due to the intense extrusion of new material. With the gradual slowing of extrusion, increased vector lengths can be observed along the ESE dome flank, which was not covered by the new lava lobe. These offsets started in early February 2019 and persisted through February–March 2019 (Figures 8A,B,E). The main area of motion was then restricted to the summit dome, which presented deformations of the upper part of the lava lobe; however, slower motion of the lower flanks persisted (Figures 8C,F). No definitive statement can be made regarding the exact growth direction (the range depends on both horizontal and vertical motions); however, since both the ascending and the descending views appear to show predominantly SE motion, the dominant growth direction was likely toward the SE with little or no vertical motion.
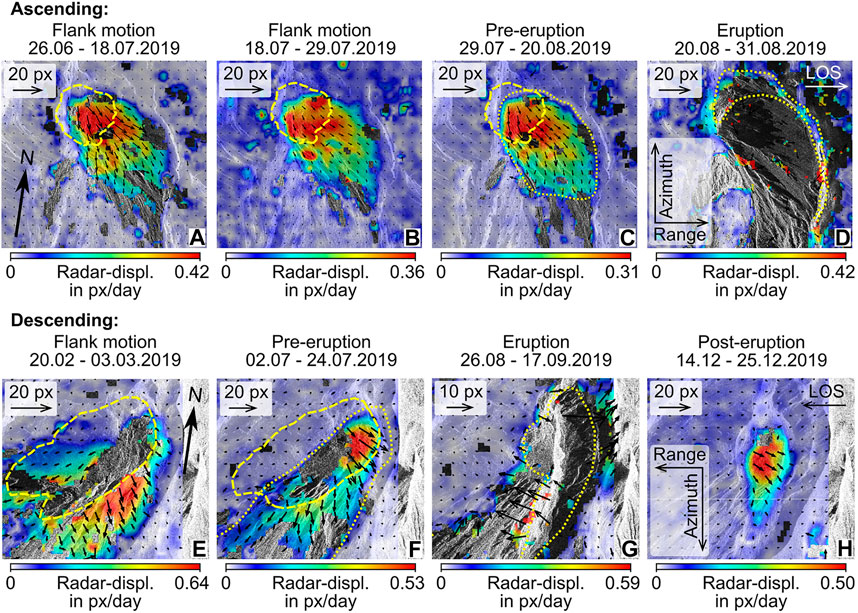
FIGURE 8. Selected PIV tracking maps from the TSX data in ascending (A–D) and descending (E–H) orbits. The yellow dashed lines outline the new lava lobe; the yellow dotted lines indicate the outlines of motion before the partial destruction of the dome (C,F) and the shape of the area affected by destruction (D,G). The approximate scales are 0.59 px/m for the ascending view and 0.73 px/m for the descending view, but these scales should be used with caution (see the Data and Methods). The full time series of the tracking results can be found in the supplementary material (Supplementary Figure S3). For the base images, please refer to Figure 7 for the descending data and to Supplementary Figure S2 for the ascending data.
The pixel offsets were measured at varying rates, which were highest during the first measurement in March 2019 (Figure 8E) at nearly 0.65 px/day (orthogonal to the radar LOS). The rates then decreased and varied between 0.30 and 0.45 px/day, being higher only between mid-June 2019 and mid-July 2019. In the weeks before the large explosive eruption and dome collapse, the offsets returned to their previous levels. In the ascending view, the pixel offsets similarly varied between 0.31 and 0.42 px/day, which are slower rates compared to those during the same timespan in the descending view, likely due to the different perspectives. The decorrelated area after the explosion and collapse events on August 29, 2019 is consistent with the area of high deformation preceding the collapse, both in the ascending (Figures 8C,D) and the descending (Figures 8F,G) views. Due to the significant surface changes, no further measurements could be made in descending orbit until December 2019, when a new extrusion occurred at the top of the dome with a steady-state pixel offset of approximately 0.50 px/day (Figure 8H).
Deposit Accumulation and Discharge Within the 2005 and 2010 Collapse Scars
We were able to detect changes in the radar shadows located on the western (2005) and eastern (2010) collapse scars due to the accumulation and removal of materials. In the following, we refer to these materials as deposits, although we cannot distinguish the exact types of rock and deposition mechanisms (e.g., pyroclastics, collapse material, tephra). We applied the radar shadow method to the geocoded TSX amplitude images for the period from December 2018 to December 2019 to estimate the pointwise thicknesses and derive the deposit volumes by using Voronoi diagrams (see Data and Methods SAR Data and Monitoring the Material Redistribution (b)). The results are presented in Figure 9 and Table 2. Based on the available SAR data, we can distinguish three main periods/episodes: the first construction/deposition period that occurred between December 16, 2018 and August 26, 2019 estimated in relation to the December 16, 2018 image; the second destruction episode related to the August 29, 2019 explosion and partial dome collapse and described by one pre-eruption image (August 26, 2019) and one post-eruption image (September 17, 2019); and the third period of new deposition between September 17, 2019 and December 25, 2019 estimated in relation to the September 17, 2019 image. During the first period, we observe a higher accumulation rate in the first month with an average rate of 670,000 m3/day or 7.7 m3/s (December 16, 2018 – January 18, 2019) and a cumulative volume increase of 22 × 106 m3 (Figure 9A). After that, the accumulation rate slowed down to an average value of 106,000 m3/day or 1.2 m3/s (January 18 – March 25, 2019) and then to 39,000 m3/day or 0.4 m3/s (March 25 – August 26, 2019), reaching a cumulative volume increase of 29 × 106 m3 (Figure 9B) at the end of March and a cumulative volume increase of 35 × 106 m3 (Figure 9C) by the end of August. After the August 29, 2019 eruption and partial dome collapse, a significant volume (65 × 106 m3) of material was removed (Figures 9D,G). Since the TSX acquisitions just before and after the collapse episode cover a time span of only 22 days, we cannot constrain the exact duration of the period during which material was removed from the scars. Subsequently, a new accumulation period, caused the refilling of the scars, mainly the eastern collapse scar. The material accumulation rate was 790,000 m3/day or 9.1 m3/s from September 17 to October 20, 2019, reaching a cumulative volume increase of 26 × 106 m3 (Figure 9E), while the rate was 90,000 m3/day or 1 m3/s from October 20 to December 25, 2019, reaching a final cumulative volume increase of 32 × 106 m3 (Figure 9F).
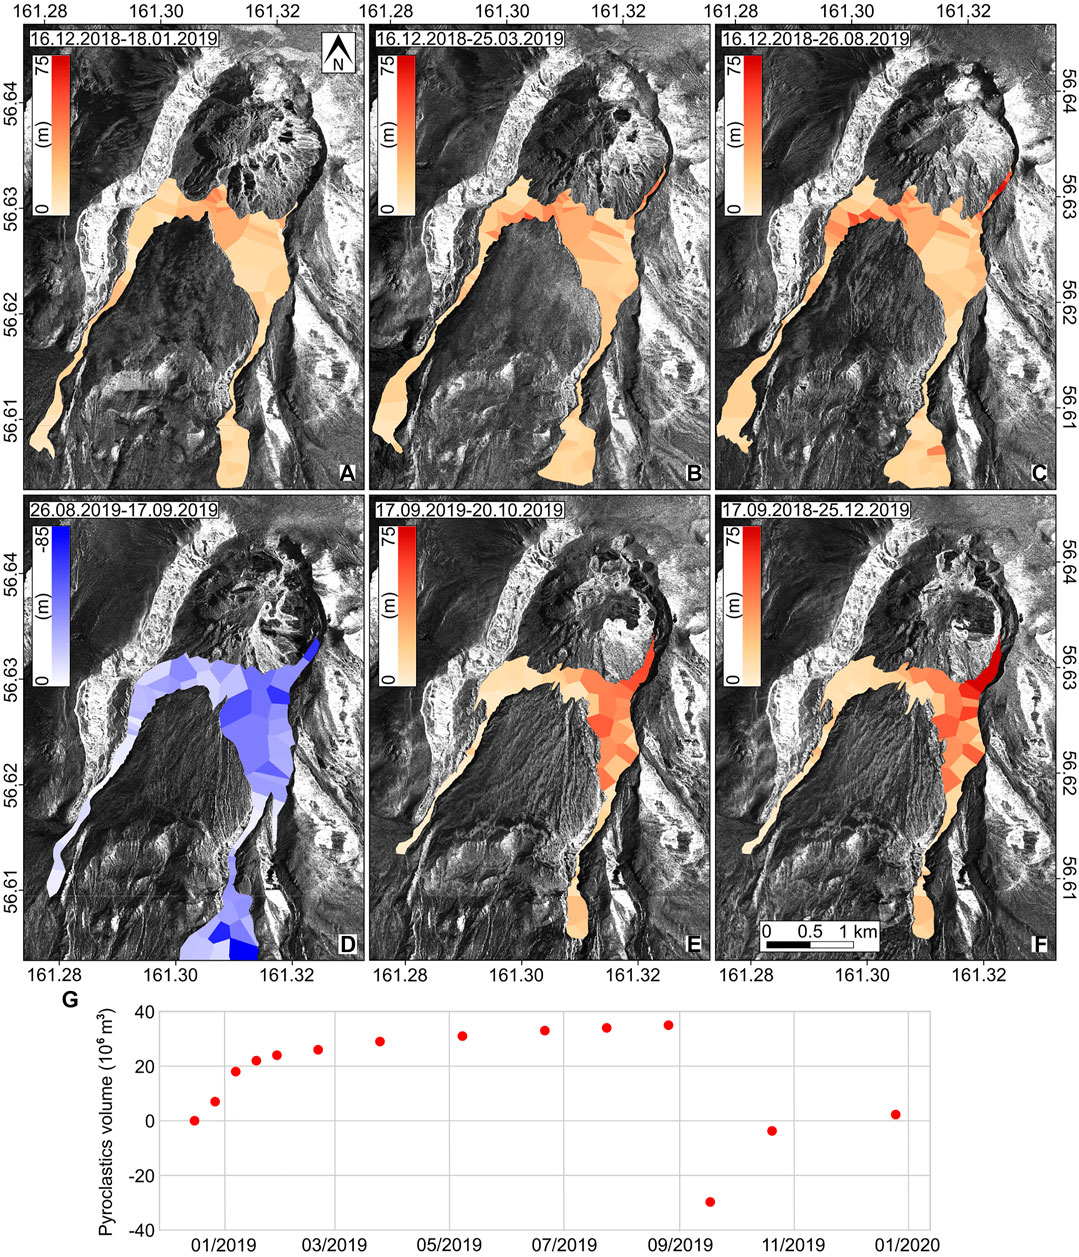
FIGURE 9. Time series of the minimum deposit thickness within the 2005 and 2010 collapse scars estimated using the radar shadow method for several SAR acquisitions between December 2018 and December 2019 (see Data and Methods SAR Data and Monitoring the Material Redistribution (b)). Reddish and bluish polygons show the Voronoi diagram approximations of the area of accumulation and removal of material, respectively (A–C) show the first period of deposition starting from the dome reactivation in December 2018 up to just before the August 29, 2019 explosion estimated with respect to the December 16, 2018 image (D) shows the material removal episode that occurred after the explosion estimated in relation to the August 26, 2019 image (E,F) show the successive material accumulation episodes estimated in relation to the September 17, 2019 image. As the background images for (A–F), the dates of the compared geocoded TSX images are displayed; (G) presents the time series of the deposit volume change; all values are relative to the December 16, 2018 image.
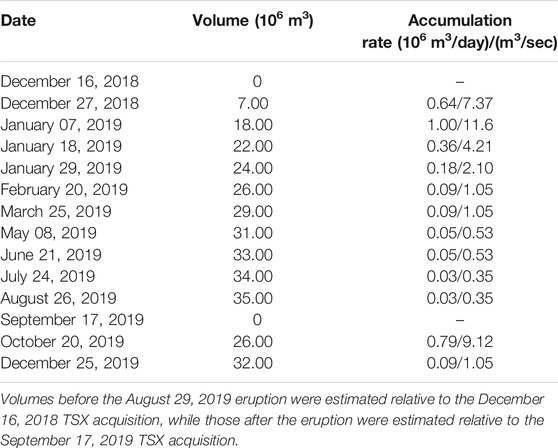
TABLE 2. Minimum volumetric accumulation of deposits and corresponding deposition rates in the western and eastern collapse scars combined.
During the construction episode, deposits accumulated within the 2005 and 2010 collapse scars, reaching an average thickness of 15–20 m and a maximum thickness of 75 m in the upper part of the scars. After the August 29, 2019 destruction episode, the deposited material was concentrated mainly at the top section of the 2010 scar, reaching a thickness of 50 m. Hence, the August 2019 eruption and partial dome collapse caused the removal of material from the two scars (twice the volume of material that had accumulated in the first period).
Analysis of Thermal Anomalies
2018–2019 Satellite Infrared Data Series
The evolution of thermal anomalies over the Shiveluch dome area is derived from the S2 and L8 imagery in SWIR bands (Figure 10). Our analysis begins in December 2018, when intense degassing and fumarolic activity obscured the summit of the dome mainly over the central and northern sectors (Figure 10A). In the previous S2 MSI and L8 OLI images during October–December 2018 (see Supplementary Figure S4), signs of newly emplaced gray deposits (most likely related to PDCs, gravitational collapses, hot avalanches, and/or ash fall deposits), probably produced by sporadic explosive activity, are visible due to the contrast with the snow-covered ground. Moreover, some thermal anomalies are visible on the upper surface of the dome and become more apparent during December 2018; these anomalies, which appeared one and one-half months prior to the main explosion on December 30, 2018, were localized mainly in the central summit crater atop Shiveluch and its eastern sector (see Supplementary Figures S4, S5). The first image to be collected after the strong explosion on December 30, 2018 was acquired one day later on December 31, 2018, revealing a glow emanating from the flanks of the dome associated with extrusions and newly deposited, still-incandescent material (likely sourced by collapses, hot avalanches or PDCs) that is traceable up to 5.5 km from the summit towards the SW (Supplementary Figure S4).
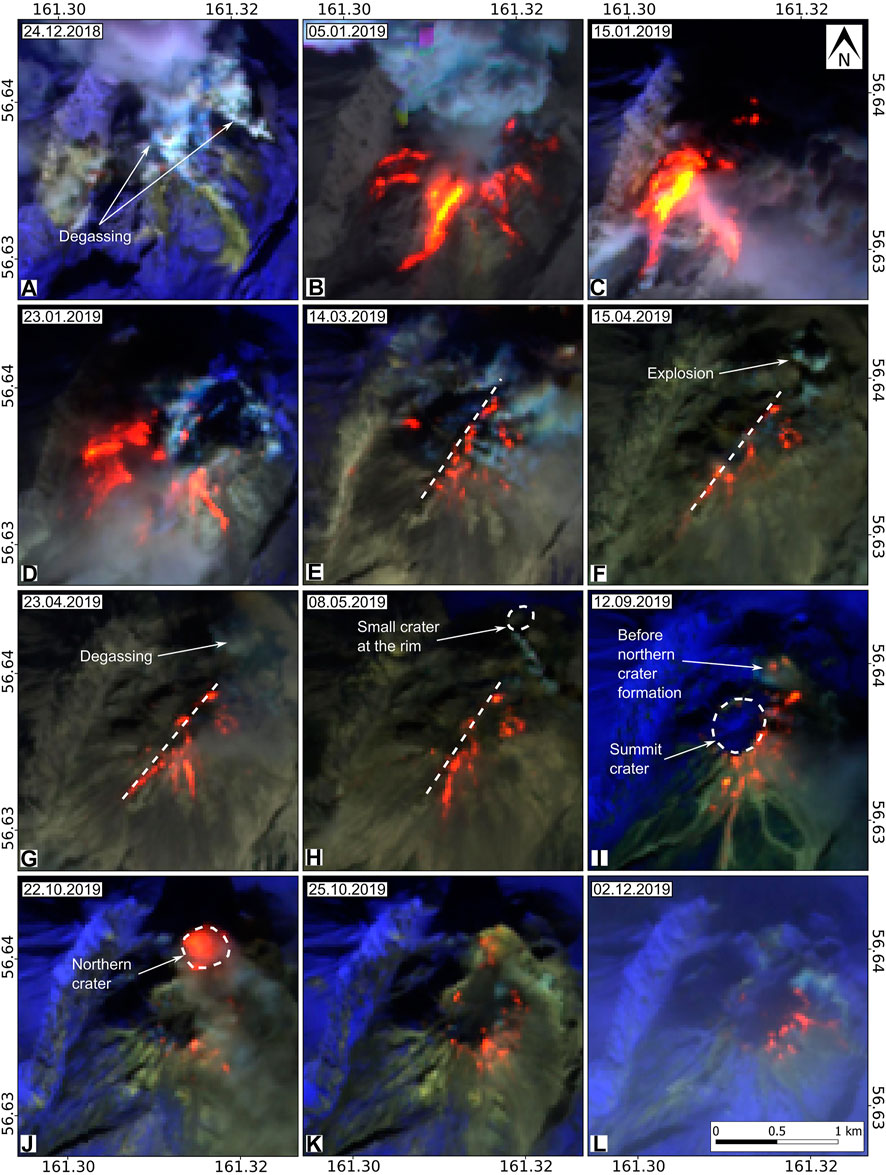
FIGURE 10. Selected thermal imagery. S2 MSI RGB false-color composite bands 12-11-8a (SWIR) showing the evolution of the Shiveluch dome from December 2018 to December 2019. Brownish and grayish colors display cold deposits and bedrock. Blue indicates snow cover. Reddish to yellowish gradients represent hot magmatic ejecta and materials (see the text for details). Images are cropped over the Shiveluch dome top within an area of 2 km × 2 km. White dashed lines indicate the features described in Morphological Changes Derived From a Comparison of the Optical DEMs.
During January 2019, we identify intense thermal activity due to an explosive event, hot ejecta, and rockfalls causing elongated thermal anomalies on the volcano flanks (Figure 10B). During this period of rockfalls and SW-directed lava extrusion, the uppermost summit area is only partially thermally expressed, with a few hotspots visible (Figures 10B–D), and persistent white plume emissions are observable from the northern sector of the dome (Figure 10D).
A series of cloud-free images from March 2019 allowed us to investigate the details of new features expressed near the summit of the Shiveluch dome (Figures 10E–H). Several glowing hotspots are present, representing a thermally active area in an elongated zone traversing the summit of the dome in a SW-NE direction. We find that the eastern sector of this region is thermally more expressed than the western sector. Most of the thermal hotspots appear to change over time, but some remain stable and persist over several months (see also Supplementary Figures S5, S6). The SW-NE-elongated zone, well identified in the cloud-free thermal imagery (March–September 2019), is also morphologically expressed by a pronounced structural lineament and crater rows, as mentioned before (Figures 3A,D). Furthermore, small collapses of the lobe’s front are observed to trigger hot PDCs that mainly travel towards the south and east. Moreover, by September 2019, we recognize a thermal anomaly at a location where a new explosion crater will later develop in the northern part of the dome (Figure 10I). We note that the summit crater (the location of the August 29, 2019 explosion) appears cold in the thermal imagery (Figures 10I,J), whereas this new northern crater is hot (Figure 10J). However, the thermal activity inside this new northern crater wanes rapidly (Figure 10K). The thermal image taken in December 2019 (Figure 10L) reveals thermal anomalies localized on the eastern flank, mainly on the outer walls of the central crater, and only minor thermal activity on the western inner crater wall; in contrast, the new northern crater appears cold.
Aerial Infrared Data Before and After the August 29, 2019 Eruption
To further elaborate on the appearance of new explosion craters located close to the intersection of the newly identified SW–NE structure and the former amphitheater rim, we analyzed high-resolution aerial thermal infrared survey data. The data were acquired using handheld cameras from a helicopter on August 22, 2019 and October 22, 2019; thus, data were recorded both before and after the August 29, 2019 explosive event (Figure 11). The infrared data similarly reveal the locations of temperature anomalies throughout the dome, thereby highlighting the areas affected by ongoing extrusion, rockfalls, and degassing at a resolution not seen in the satellite imagery. The data taken a week before the event highlight four distinct areas with elevated temperatures at an approximate ground resolution of 3 m. First, we note the upper edge of the steep southern flank, which regularly sources smaller rockfalls appearing as thin lines spreading radially outward from the dome towards the south. Similarly, on the eastern flank, distributed smaller anomalies are observed, stemming mostly from fumaroles and cooling products. The central dome area is cold but displays a N–S-striking thermal anomaly of unknown origin (Figure 11A), which is located almost in the center of the future crater (marked by a yellow solid line in Figure 11B). We detect a patch of high-temperature anomalies on the northern edge of the dome that coincides with the strongest fumarole activity. Here, the highest measured temperatures exceed 270°C, although these temperatures may still be underestimated, as localized temperature anomalies may be smaller than the sensor resolution.
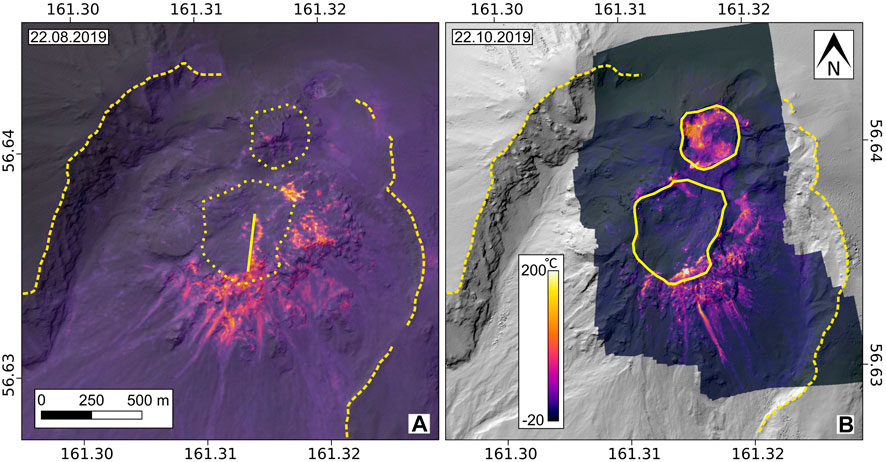
FIGURE 11. Aerial FLIR data of the lava dome superimposed onto the DEMs of the pre-eruption survey on August 22, 2019 (A) and the post-eruption survey on October 22, 2019 (B). While the southern side of the dome remained mostly intact and unchanged, the eruption was followed by a significant new anomaly in the northern part of the dome. The yellow lines in (B) outline new craters, and the dotted lines in (A) show the areas before these craters formed. The yellow dashed line outlines the 1964 amphitheater. The top of the dome is bisected by a N-S-striking anomaly shown with a solid yellow line in (A) in the area where the central crater was subsequently formed (B). The scale bar maximum is 200°C because only a few local pixels significantly exceed this value.
The post-eruption recording (Figure 11B) reveals a significant redistribution of thermal activity. While the southern flank remained intact, the high-temperature fumaroles were missing; in their place was a large central crater with low thermal emissions. The highest measured temperatures appear to the north of the dome within the fresh explosion crater. These observations perfectly coincide with the thermal satellite data (cf. Figure 10J), in which we detect a large anomaly north of the dome. Here, the highest recorded temperatures exceed 390°C, but as previously mentioned, these measurements may still underestimate the actual temperatures.
Discussion
The described eruptive activity during 2018–2019 was some of the strongest in the recent history of Young Shiveluch (since 1980) in terms of the eruption volume and morphological changes. A massive lava lobe developed at the dome during the extrusive period of December 2018 – April 2019, while a 430 m × 490 m SW–NE-elongated crater formed during the explosive eruption on August 29, 2019, which led to the significant destruction of the NE sector and the collapse of the eastern flank of the dome. The PDC generated from this eruption after the 2005 and 2010 flows was the largest on record for this volcano (Dvigalo et al., 2011; Ramsey et al., 2012; Shevchenko and Svirid, 2014; Krippner et al., 2018). Such composite destructive events are common during large explosive eruptions at dome-building volcanoes and have been recently observed during major eruptions and erosional ravine-forming episodes, such as in 2015 at Volcan de Colima, Mexico (Reyes-Dávila et al., 2016), and in 2010 at Merapi volcano (Surono et al., 2012).
Main Peculiarities of the 2018–2019 Eruptive Episode
One of the main distinctions between the 2019 and previous destructive events at Shiveluch is the preservation of the southern flank of the dome. The southern flank was partially destroyed during the 2005 eruption and completely destroyed during the 2010 collapse but appeared stable during the August 29, 2019 eruption. This preservation could be explained by the presence of the extensive lava lobe that formed in 2012, which remained stable on the flank for more than 7 years. We speculate that this lobe could have acted like armor blanketing the flank and preventing the collapse of unconsolidated material. For example, loading, gradual cooling, and degassing will close pore spaces and increase the compressive and tensile strengths of the lobe and dome rocks over time (Zorn et al., 2018). Additionally, hydrothermal alteration can significantly change the strength of volcanic rocks depending on the type of alteration (Heap et al., 2021). In most studied cases, hydrothermal alteration weakened volcanic rocks (Wyering et al., 2014; Ball et al., 2015; Mordensky et al., 2019) or even induced explosive behavior (Heap et al., 2019), mainly through changes in the mineral content, porosity and permeability of the rocks. However, volcanic rocks also exhibit increased strength under certain conditions through the deposition of minerals in hydrothermal areas (Heap et al., 2020). Here, it is not clear whether the dome or lobe were subject to either type of alteration, but since this lobe was relatively stationary and stable for several years, it would have likely experienced substantial cooling and degassing while also being subject to nearly constant hydrothermal alteration. Theoretically, these combined effects could have significantly increased the rock strength of the lobe. We also note similarities with Bezymianny volcano, on which the slopes of the lava dome were protected with lava flows that promoted stability and led to stratocone development (Shevchenko et al., 2020). Similarly, the western flank of Shiveluch, covered by the 2019 lava lobe, remained intact during the August 29, 2019 explosive event and partial destruction of the dome, which may indicate that the stabilization effect produced by lava lobes is significant for other episodes.
Another notable distinction from the previous activity is the never-before-seen formation of multiple small craters along the northern and NE peripheries of the dome, either at or near the rim of the former amphitheater (Figures 3C,D). The first of these craters appeared in mid-April 2019 (Figure 7H) at the northern rim of the amphitheater, which was covered by new material. The half-circular area of darkening in the region where this crater formed became noticeable in late January 2019, resembling the melting of perennial snow preserved by loose volcanic deposits coverage (see Chronology Derived From the TSX Amplitude Images and Figure 7E). The second peripheral crater appeared at the NE rim of the amphitheater after the August 29, 2019 eruption (Figure 7K) and was preceded by the appearance of a dark spot (Figure 7J). Furthermore, clusters of craters originated within the new 2019 collapse scar, probably due to the contact of the incandescent outcropped dome core with meteoric water. As these craters appeared suddenly and in association with only short eruptive/explosive activity, they may be considered monogenetic. Our careful analysis of available photogrammetric data does not reveal an extrusion or emission of large volumes of materials from these new crater sites. This finding, together with the observation of high thermal emissions, suggests that the origin of these craters could be phreatomagmatic.
Additionally, the locations of the new craters, either elongated along the SW–NE structural trend or along the former amphitheater rim (Figures 3C,D, 7H,I,K), argue for a structural control, as further discussed below.
Craters that form during an explosion (Figures 3C, 7G) due to degassing or an interaction with meteoric water are typical on Shiveluch and have been previously recognized on lava lobes (Shevchenko et al., 2015) but never along or near the amphitheater rim. The central crater caused by the August 29, 2019 eruption is similar to the 2005 crater (∼750 m in diameter) but with smaller dimensions (430 m × 490 m), probably due to the smaller magnitude of the explosion.
We find that some of the explosion craters are thermally well expressed, while others appear cold. Some craters, such as the central summit crater, are characterized by thermal anomalies around the rim only but not on the crater floor. A cold crater floor might have different explanations, both volcanological and observational: the extrusion of cold crystalline material (Mania et al., 2019), the surface crust of cool lava masking hotter material beneath (Sahetapy-Engel and Harris, 2008), the occurrence of a phreatic explosion not followed by the extrusion of lava (Barberi et al., 1992), low thermal activity due to hydrothermal sealing or the tectonic blocking of fluid paths (Matthews et al., 1997; Laiolo et al., 2017), or even satellite techniques that are too inaccurate to detect anomalies with excessively inclined observation geometries or sensors that have an inadequate spatial resolution (Coppola et al., 2016; Blackett, 2017). One more reason that cannot be entirely excluded in this context is that the thermal infrared signal was partially covered and thus biased by the steam of whitish vapor (Hashimoto et al., 2018); however, these craters did not show any strong visible steaming. As we observed cold crater floors in multiple S2 acquisitions and our helicopter overflight, we are confident that the low temperatures in these craters are real. Therefore, we can also assume that the extrusion of new blocky material observed in this crater that started in September shortly after the eruption could represent the extrusion of cold debris. Indeed, the crater that developed off-center and farther to the north exhibited one of the highest thermal anomalies in the study area during the period of observation (Figures 10J, 11B).
The growth rate calculated for the period from July 2018 to August 2019 was 365,000 m3/day (4.22 m3/s), which is significantly higher than the long-term average growth rate over the 2001–2012 period (225,000 m3/day or 2.6 m3/s) but comparable to that over the 2001–2003 period (320,000 m3/day or 3.7 m3/s) (Shevchenko et al., 2015). These growth rates are also higher than the average growth rates at other dome-building volcanoes: 26,400 m3/day (0.31 m3/s) at Bezymianny in 1956–2017 (Shevchenko et al., 2020), 37,000 m3/day (0.43 m3/s) at Santa Maria, Guatemala, in 1922–2000 (Ebmeer et al., 2012), and 173,000 m3/day (2 m3/s) at Mount St. Helens in 2004–2005 (Schilling et al., 2008). At Shiveluch, we further identified particularly strong activity during the first month of eruptive activity coincident with the extrusion of the lava lobe. While no discrete growth rates for the whole dome could be measured, only loose material accumulated within the scars during the first month of eruptive activity, with the deposition rate reaching 670,000 m3/day (7.7 m3/s). Thus, the growth rates during the construction period significantly exceed the average rates presented here, illustrating that this volcano is currently very productive compared to its own previous episodes and other volcanoes.
The SW–NE Lineament and Structural Implications
The SW–NE lineament is inferred from 1) a pronounced linear kink in the slope during 2012, 2) structural features bisecting the peak-like remnant in 2018, 3) aligned explosion (monogenetic) craters that evolved during 2018–2019, and 4) thermal anisotropy. Moreover, we conjecture that the collapses (and especially the collapse directions) are largely governed by this structural feature. However, whether this feature has deeper roots and/or is the surface expression of a fault remains speculative. Accordingly, we hypothesize that this SW–NE lineament (Figure 12) could play an important role in the development of the dome and in its construction and destruction. The same SW–NE structural trend can be identified in optical and topographic data as early as 2012 (see Figures 2A, 3A) and was hypothesized in a previous study based on monogenetic cones located in the surrounding areas and lower apron of the Shiveluch edifice (Koulakov et al., 2020). Nevertheless, this is the first evidence of the presence and relevance of the structural architecture at the summit of Shiveluch volcano governed by a SW–NE-trending structure and of the alleged intersection between the curved plane and amphitheater of the 1964 sector collapse.
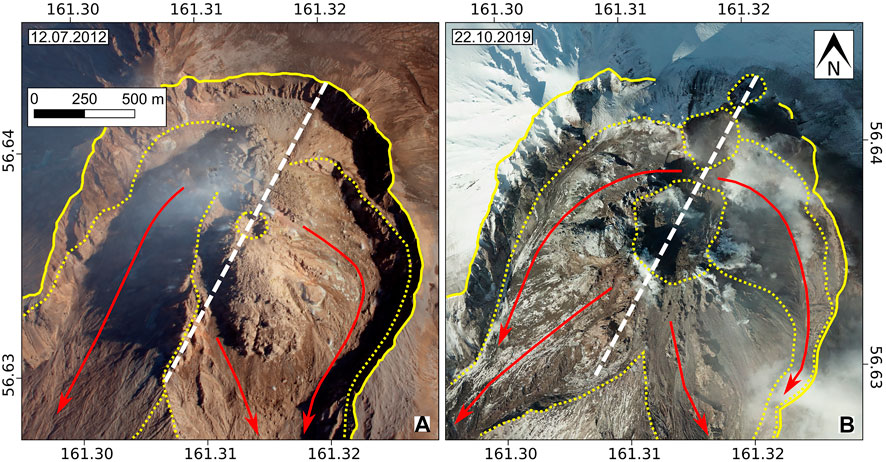
FIGURE 12. SW–NE lineament in relation to the Shiveluch dome’s features. The lineament is shown as the white dashed line. The yellow line outlines the collapse amphitheater, and the dotted lines outline the features (craters and collapse scars). The red arrows show the directions of partial dome collapses. The base images are aerial orthophotos.
The observed SW–NE-trending feature is identified on the Shiveluch dome only. We could not find any evidence for its continuation farther north, such as crossing the amphitheater headwall, implying that this lineament is either a local volcano-tectonic feature or a structure that is amplified and strongly expressed on the Young Shiveluch edifice only. Similar local tectonic features have been suggested to impact the structural architecture of lava domes at other volcanoes, such as Merapi (Walter et al., 2015), supporting the idea that regional faults may indeed affect dome growth and collapse processes.
If we assume a SW–NE-trending, nearly vertical fracture zone to be present, then we may expect a curved intersection arc at the base of Young Shiveluch along the former décollement surface (Figure 13). We note, however, that although multiple lines of evidence support such a structural trend, a critical view regarding the emergence and locations of explosion vents is warranted. We note that many craters are consistent with this lineament, such as the crater on the upper surface of the 2012 lava lobe (Figures 3A, 12A), the summit crater in the center of the dome in 2018 (Figure 3B), and three craters (the central and northern craters and the side crater on the NE amphitheater rim) that originated during the period of study (Figures 3D, 12B), which is why we suggest that this structural feature can affect the formation of these craters. However, neither the radar observations nor the pixel offset method could confirm whether the fracture slides as a strike-slip or dip-slip fault or is an opening fracture. This lack of fault displacement evidence might indicate that the activity of this structure is below the detection threshold, that the fault kinematics simply did not activate over the observation period, that the lineament is a fracture zone without clear kinematics, or that it is possibly associated with shear fracturing, as identified in experimental studies of rock properties simulating shallow depths (Heap et al., 2015). Nevertheless, an assessment of the crater locations might provide evidence for an elongated zone or for several parallel alignments striking SW–NE, possibly associated with a fracture zone that is wide rather than focused along a single fault. The thermal anomaly locations (Figures 10E–H; Supplementary Figure S6) are also in agreement with this lineament. Moreover, this structure is parallel to the 1964 collapse direction, to the lineaments of the northern groups of volcanoes described in (Koulakov et al., 2020), to the regional tectonic structures (Kozhurin et al., 2006), and to the Kuril-Kamchatka volcanic arc in general. However, the recent partial dome collapse directions are approximately perpendicular (east-west) to the lineament in the upper sectors of the collapse scars and oblique (SE and SW) to the lineament in the lower sectors (Figure 12B). According to (Tibaldi et al., 2008), the tectonics of a volcano substrate influence the evolution of its edifice, and normal and strike-slip faults propagating through a volcano induce its instability in the directions perpendicular and oblique to the fault strike, respectively.
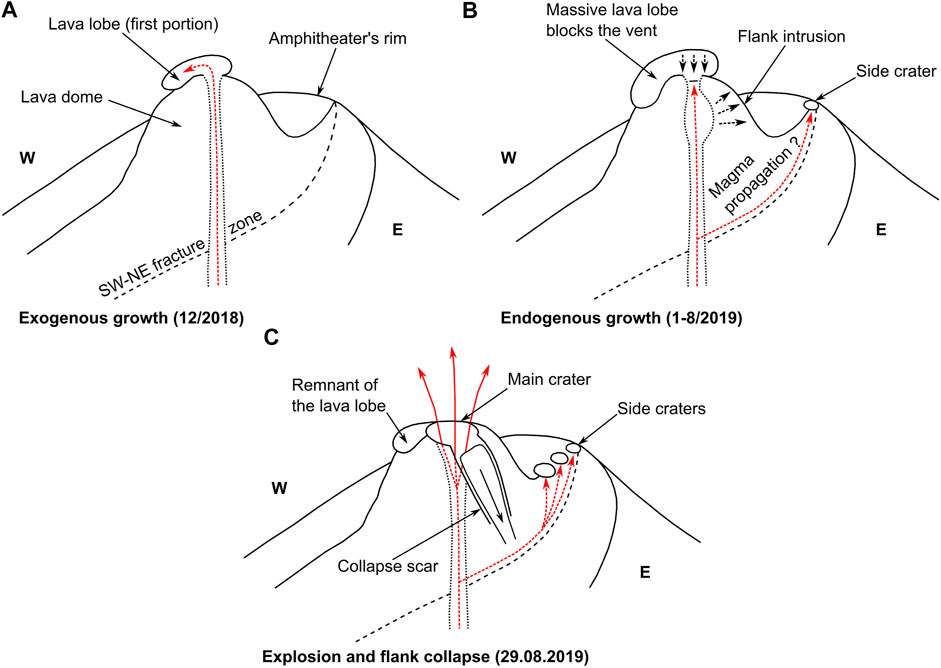
FIGURE 13. Conceptual model of the 2018–2019 eruptive activity (A) The initial stage of increased eruptive activity and the deposition of the new lava lobe (B) The presence of the new lobe hindered the further extrusion of lava and induced endogenous swelling of the eastern flank (C) The explosive eruption and collapse of the eastern dome sector. The SW–NE lineament is shown with the black dashed line as a projection onto the decollement surface.
Conceptual Model for the 2018–2019 Constructive and Destructive Events
The complex interrelation and even bidirectional interaction of events responsible for constructing and destroying the volcano edifice have been identified for volcanoes worldwide, both on land (Germa et al., 2015) and in the ocean (Sibrant et al., 2014). The relevant observations range from local-scale lava dome growth and collapse (Kelfoun et al., 2021) to large-scale ocean islands, where collapse-related unloading even affects deep crustal magma reservoirs (Manconi et al., 2009). The details of such growth and collapse, however, may be strongly dependent on the local site conditions. At Merapi, it was recently identified that the mechanism of collapse is controlled by the basement and dome slopes, which also control the directions of destruction episodes (Kelfoun et al., 2021). At Shiveluch, when considering the outlines and directions of the western (originating in 2005) and eastern (originating in 2010) collapse scars, we find that these azimuthal directions have a certain longevity. These two scars serve as accumulation centers and erosion pathways; for example, they accumulate deposits from small explosive eruptions and gradual collapses or disintegration of the lava lobes and then repeatedly discharge materials during large destructive events (see Deposit Accumulation and Discharge Within the 2005 and 2010 Collapse Scars). These unconsolidated deposits are rather weak and unstable compared to the lava material composing the main dome edifice; thus, the repeated discharge of loose material from these scars, which can occur due to gravitational processes or earthquakes, can be hazardous even if the dome flanks remain stable.
A previous study (Shevchenko et al., 2015) showed that the two major collapses at Shiveluch in 2005 and 2010 were preceded by periods of endogenous growth, while the dome remained stable during the extrusions of lava lobes due to the constant discharge of the new material. Collapses induced by intrusions and faulting activity at volcanoes have been debated based on experimental simulations (Acocella, 2005) and numerical modeling (Massaro et al., 2020), and evidence that intrusions such as plugs, dikes, and sills may ultimately cause complete or partial flank collapse is growing (Giampiccolo et al., 2020). Conversely, flank collapses may affect the locations and directions of intrusions (Maccaferri et al., 2017), so a complex interplay is likely (Lénat et al., 2012). This idea, together with the results of our remote sensing data analysis, led us to suggest the following conceptual model for the constructive and destructive events of Shiveluch (Figure 13). After intense extrusion (Figure 13A), a massive lava lobe covered the entire central part and SW flank of the dome. The lateral expansion and deformation of the eastern flank (see Lava Dome Deformations Revealed by PIV) started after the extrusion had slowed down, which could be evidence for blockage of the main vent by the massive solidified lava lobe on top of the dome that prevented the discharge of fresh eruptive material. As magma intruded the core of the dome, the flanks deformed and steepened, and several events of local instability occurred (slumping, hot avalanches, etc.), exposing hot materials and generating thermal anomalies. We hypothesize that, during this stage, when magma did not reach the surface, it began to propagate along the SW-NE fracture system, along the base of Young Shiveluch, or along the intersection between the fracture system and the decollement. As magma approached the surface to the north, close to the amphitheater rim, it could come into contact with meteoric water associated with rainfall and/or snowmelt (Figure 13B). Consequently, short-lived explosions formed craters aligned SW–NE. Further, the inability to discharge magma through extrusion led to a pressure buildup that could have caused the large August 29, 2019 explosive eruption and the formation of the central crater, which in turn led to the collapse of the eastern flank; another side crater appeared along the fault lineament after the eruption (Figure 13C).
The 2010 collapse was caused by dome instability due to gravitational processes and was followed by a relatively small decompression explosion. This is evidenced by the formation of the large and deep collapse scar that exposed the core of the dome, thereby revealing a small explosion crater at the top (Dvigalo et al., 2011; Shevchenko and Svirid, 2014; Shevchenko et al., 2015). In contrast, the 2005 collapse was secondary and was caused by a large explosive eruption that formed a 750-m diameter crater, which opened into the large collapse scar (Ramsey et al., 2012; Shevchenko and Svirid, 2014; Shevchenko et al., 2015). The formation of the large crater on top of the dome during the August 29, 2019 eruption suggests that the sequence of events (primary explosion and secondary collapse) is similar to the sequence of the 2005 destruction episode, though the collapse direction and deposition of the main part of the PDC coincide with the 2010 collapse.
The development of Shiveluch volcano is controlled through the interaction of constructive and destructive processes. Destruction follows construction when the dome height reaches a critical elevation and its flanks become oversteepened or when massive extrusive bodies block the vent and endogenous growth destabilizes its structure. Then, construction continues after destruction when the vent opens again, allowing new material to freely extrude onto the surface. Further modeling might help to better understand the details of these relationships, which are governed by stress changes, growing and changing masses and slopes, and material heterogeneities, such as fracture lines and former decollement surfaces. We speculate that if construction processes prevail at Shiveluch, they might lead to the formation of a new stratocone, as happened at Bezymianny (Shevchenko et al., 2020). The prerequisite for this phenomenon has already occurred, i.e., the 2012 lava lobe that stabilized the southern flank. Moreover, as was identified at Bezymianny, the establishment of a major and centralized summit crater, such as the Shiveluch central crater since 2018 (Figures 3B,D), might indicate the stabilization of a vent and the formation of a stratocone (Shevchenko et al., 2020). At Shiveluch, however, the relevance of the SW–NE structural trend and its intersection with the base of the edifice are of major importance and may govern future episodes of construction and destruction.
Conclusion
In this article, we analyzed a broad remote sensing dataset to shed light on the growth and collapse of the Shiveluch volcano, Kamchatka. We were able to conduct helicopter overflights shortly before and after one of the main explosive eruptions. We compared the high-resolution aerial data with the Pleiades satellite photogrammetric data, derived DEMs of the volcano during the 2018–2019 activity, and complemented the study with satellite radar and thermal data. The likely cause for the explosion and partial dome collapse is a blockage of the vent caused by the massive 2018 lava lobe extrusion, inducing endogenous swelling on the eastern dome flank. This gradually oversteepened the flank and induced gravitational instability. We could identify the presence of an important lineament oriented SW–NE, expressed first by a fracture bisecting the dome in 2012 and then by the formation of multiple side craters in the 2018–2019 period, which were not observed before. We discuss whether these craters evolved due to lateral migration of magmas along a basal decollement or along the newly identified SW–NE fracture system. The new craters all formed within the new deposits located at or close to the former amphitheater crater wall, arguing for a possible influence of structural reactivation and/or water percolation involved in the explosion initiation. While most of the craters are cold, we identify thermal anomalies related to the SW–NE structural trend. We also found that the collapse scars originated in 2005 and 2010 retain their outlines very well, being periodically filled and discharged with unconsolidated material, proximally forming deeply incised valleys that eventually curve into the main amphitheater direction.
Data Availability Statement
Data supporting the conclusions of this article are available through the GFZ Data Publishing Service at https://doi.org/10.5880/GFZ.2.1.2021.002
Author Contributions
Photogrammetric analysis was performed by AVS and VND, radar analysis was performed by MSV (shadow method, TDX processing), EUZ (PIV), and AVS (amplitude image interpretation), and thermal analysis was performed by FM (satellite data) and EUZ (aerial data). TRW was involved in the preparation and realization of the analysis. The 2019 field data were collected by AVS, EUZ, MSV, IYS, and SAC, with a contribution from AYO and assistance from VND, VAT, and IAB. AVS wrote the manuscript, and TRW, VND, EUZ, MSV, and FM contributed to the writing.
Funding
This is a contribution to VOLCAPSE, a research project funded by the European Research Council under the European Union’s H2020 Program/ERC consolidator grant ERC-CoG 646858. The fieldwork was funded by GFZ (Project X-021-19-01) and by IVS.
Conflict of Interest
The authors declare that the research was conducted in the absence of any commercial or financial relationships that could be construed as a potential conflict of interest.
Acknowledgments
We acknowledge Sergey Ushakov (IVS) for his assistance in organizing the fieldwork; our colleagues from GFZ and IVS for their discussions; Diego Coppola and Marco Laiolo (MIROVA team, University of Torino) for providing the MODIS-MIROVA dataset; the German Aerospace Center (DLR) for providing the TSX data through proposal GEO1505 and the TDX data through proposal motagh_XTI_LAND6959; the Planet Team, 2017 for providing the Planet data via the Planet application program interface: In Space for Life on Earth. San Francisco, CA. https://api.planet.com the Kamchatka Volcanic Eruption Response Team (KVERT) for releasing eruption chronology data, and the Kamchatka Branch of the Unified Geophysical Service of the Russian Academy of Sciences for providing the seismic data obtained with large-scale research facilities: “Seismic infrasound array for monitoring Arctic cryolitozone and continuous seismic monitoring of the Russian Federation, neighboring territories and the world.” We also thank the three journal reviewers and the editor for their very detailed reviews and comments that allowed us to further improve this work.
Supplementary Material
The Supplementary Material for this article can be found online at: https://www.frontiersin.org/articles/10.3389/feart.2021.680051/full#supplementary-material
References
Acocella, V. (2005). Modes of Sector Collapse of Volcanic Cones: Insights from Analogue Experiments. J. Geophys. Res. 110. doi:10.1029/2004JB003166
Gudmundsson, A. (2020). “Volcanotectonics,” in Volcanotectonics: Understanding the Structure, Deformation And Dynamics Of Volcanoes (Cambridge: Cambridge University Press), i–ii. doi:10.1007/s00445-020-01399-z
Arnold, D. W. D., Biggs, J., Anderson, K., Vallejo Vargas, S., Wadge, G., Ebmeier, S. K., et al. (2017). Decaying Lava Extrusion Rate at El Reventador Volcano, Ecuador, Measured Using High-Resolution Satellite Radar. J. Geophys. Res. Solid Earth 122, 9966–9988. doi:10.1002/2017JB014580
Arnold, D. W. D., Biggs, J., Dietterich, H. R., Vallejo Vargas, S., Wadge, G., and Mothes, P. (2019). Lava Flow Morphology at an Erupting Andesitic Stratovolcano: A Satellite Perspective on El Reventador, Ecuador. J. Volcanology Geothermal Res. 372, 34–47. doi:10.1016/j.jvolgeores.2019.01.009
Bagnardi, M., González, P. J., and Hooper, A. (2016). High-resolution Digital Elevation Model from Tri-stereo Pleiades-1 Satellite Imagery for Lava Flow Volume Estimates at Fogo Volcano. Geophys. Res. Lett. 43, 6267–6275. doi:10.1002/2016GL069457
Ball, J. L., Stauffer, P. H., Calder, E. S., and Valentine, G. A. (2015). The Hydrothermal Alteration of Cooling Lava Domes. Bull. Volcanol. 77, 102. doi:10.1007/s00445-015-0986-z
Barberi, F., Bertagnini, A., Landi, P., and Principe, C. (1992). A Review on Phreatic Eruptions and Their Precursors. J. Volcanology Geothermal Res. 52, 231–246. doi:10.1016/0377-0273(92)90046-G
Belousov, A. B., and Belousova, M. G. (1998). Bezymyannyi Eruption on March 30, 1956 (Kamchatka): Sequence of Events and Debris-Avalanche Deposits. Volcanol. Seismol. 20, 29–47.
Belousov, A. B. (1995). The Shiveluch Volcanic Eruption of 12 November 1964-explosive Eruption Provoked by Failure of the Edifice. J. Volcanology Geothermal Res. 66, 357–365. doi:10.1016/0377-0273(94)00072-O
Blackett, M. (2017). An Overview of Infrared Remote Sensing of Volcanic Activity. J. Imaging 3, 13. doi:10.3390/jimaging3020013
Casu, F., Manconi, A., Pepe, A., and Lanari, R. (2011). Deformation Time-Series Generation in Areas Characterized by Large Displacement Dynamics: The SAR Amplitude Pixel-Offset SBAS Technique. IEEE Trans. Geosci. Remote Sensing 49, 2752–2763. doi:10.1109/TGRS.2010.2104325
Chebrov, V. N., Droznin, D. V., Kugaenko, Y. A., Levina, V. I., Senyukov, S. L., Sergeev, V. A., et al. (2013). The System of Detailed Seismological Observations in Kamchatka in 2011. J. Volcanolog. Seismol. 7, 16–36. doi:10.1134/S0742046313010028
Chumachenko, Z. N. (1966). Instructions on the Construction of the State Geodetic Network of the USSR. Moscow: Nedra, 343. (In Russian).
Coppola, D., Laiolo, M., Cigolini, C., Donne, D. D., and Ripepe, M. (2016). Enhanced Volcanic Hot-Spot Detection Using MODIS IR Data: Results from the MIROVA System. Geol. Soc. Lond. Spec. Publications 426 (1), 181–205. doi:10.1144/SP426.5
Coppola, D., Laiolo, M., Cigolini, C., Massimetti, F., Delle Donne, D., Ripepe, M., et al. (2020). Thermal Remote Sensing for Global Volcano Monitoring: Experiences from the MIROVA System. Front. Earth Sci. 7, 362. doi:10.3389/feart.2019.00362
Corradini, S., Montopoli, M., Guerrieri, L., Ricci, M., Scollo, S., Merucci, L., et al. (2016). A Multi-Sensor Approach for Volcanic Ash Cloud Retrieval and Eruption Characterization: The 23 November 2013 Etna Lava Fountain. Remote Sensing 8, 58. doi:10.3390/rs8010058
Dirksen, O., Humphreys, M. C. S., Pletchov, P., Melnik, O., Demyanchuk, Y., Sparks, R. S. J., et al. (2006). The 2001-2004 Dome-Forming Eruption of Shiveluch Volcano, Kamchatka: Observation, Petrological Investigation and Numerical Modelling. J. Volcanology Geothermal Res. 155, 201–226. doi:10.1016/j.jvolgeores.2006.03.029
Dvigalo, V. N. (1988). Growth of a Dome in the Crater of Shiveluch Volcano in 1980–1981 from Photogrammetry Data. Volcanol. Seism. 6, 307–316.
Dvigalo, V. N., Melekestsev, I. V., Shevchenko, A. V., and Svirid, I. Y. (2013). The 2010-2012 Eruption of Kizimen Volcano: The Greatest Output (From the Data of Remote-Sensing Observations) for Eruptions in Kamchatka in the Early 21st century Part I. The November 11, 2010 to December 11, 2011 Phase. J. Volcanolog. Seismol. 7, 345–361. doi:10.1134/S074204631306002X
Dvigalo, V. N. (2000). Morphological Precursors (First Indications) of Volcanic Eruptions in Kamchatka. Volcanol. Seism. 22, 351–369.
Dvigalo, V. N., and Shevchenko, A. V. (2015). “New Data on the 1964 and 1854 Catastrophic Eruptions of Shiveluch Volcano According to the Results of Photogrammetric Studies,” in Proceedings of Regional conference “Volcanism and associated processes”: abstracts book, 26–29. (In Russian).
Dvigalo, V. N., Svirid, I. Y., Shevchenko, A. V., Sokorenko, A. V., and Demyanchuk, Y. V. (2011). “Active Volcanoes of the north Kamchatka as Seen from Aerophotogrammetric Data in 2010,” in Proceedings of Regional Conference “Volcanism and Associated Processes”: abstracts book, 26–36. (In Russian).
Ebmeier, S. K., Biggs, J., Mather, T. A., Elliott, J. R., Wadge, G., and Amelung, F. (2012). Measuring Large Topographic Change with InSAR: Lava Thicknesses, Extrusion Rate and Subsidence Rate at Santiaguito Volcano, Guatemala. Earth Planet. Sci. Lett. 335-336, 216–225. doi:10.1016/j.epsl.2012.04.027
Evans, A. N. (2000). Glacier Surface Motion Computation from Digital Image Sequences. IEEE Trans. Geosci. Remote Sensing 38, 1064–1072. doi:10.1109/36.841985
Fedotov, S. A., Dvigalo, V. N., Zharinov, N. A., Ivanov, V. V., Seliverstov, N. I., Khubunaya, S. A., et al. (2001). The Eruption of Shiveluch Volcano on May-July 2001. Volcanol. Seism, 6, 3–15. (In Russian).
Funning, G. J., Parsons, B., Wright, T. J., Jackson, J. A., and Fielding, E. J. (2005). Surface Displacements and Source Parameters of the 2003 Bam (Iran) Earthquake from Envisat Advanced Synthetic Aperture Radar Imagery. J. Geophys. Res. 110. doi:10.1029/2004JB003338
Germa, A., Lahitte, P., and Quidelleur, X. (2015). Construction and Destruction of Mont Pelée Volcano: Volumes and Rates Constrained from a Geomorphological Model of Evolution. J. Geophys. Res. Earth Surf. 120, 1206–1226. doi:10.1002/2014JF003355
Geshi, N., Shimano, T., Chiba, T., and Nakada, S. (2002). Caldera Collapse during the 2000 Eruption of Miyakejima Volcano, Japan. Bull. Volcanol. 64, 55–68. doi:10.1007/s00445-001-0184-z
Giampiccolo, E., Cocina, O., De Gori, P., and Chiarabba, C. (2020). Dyke Intrusion and Stress-Induced Collapse of Volcano Flanks: The Example of the 2018 Event at Mt. Etna (Sicily, Italy). Sci. Rep. 10, 6373. doi:10.1038/s41598-020-63371-3
Girina, O. A. (2013). Chronology of Bezymianny Volcano Activity, 1956-2010. J. Volcanology Geothermal Res. 263, 22–41. doi:10.1016/j.jvolgeores.2013.05.002
Gómez-Vazquez, A., De la Cruz-Reyna, S., and Mendoza-Rosas, A. T. (2016). The Ongoing Dome Emplacement and Destruction Cyclic Process at Popocatépetl Volcano, Central Mexico. Bull. Volcanol. 78, 58. doi:10.1007/s00445-016-1054-z
Gordeev, E. I., and Girina, O. A. (2014). Volcanoes and Their hazard to Aviation. Her. Russ. Acad. Sci. 84, 1–8. doi:10.1134/S1019331614010079
Gorshkov, G. S., and Bogoyavlenskaya, G. E. (1965). Bezymianny Volcano and Peculiarities of its Last Eruption (1955-1963). Moscow: Nauka, 172. (In Russian).
Gorshkov, G. S. (1959). Gigantic Eruption of the Volcano Bezymianny. Bull. Volcanol. 20, 77–109. doi:10.1007/BF02596572
Hale, A. J., Calder, E. S., Loughlin, S. C., Wadge, G., and Ryan, G. A. (2009). Modelling the Lava Dome Extruded at Soufrière Hills Volcano, Montserrat, August 2005-May 2006. J. Volcanology Geothermal Res. 187, 69–84. doi:10.1016/j.jvolgeores.2009.08.014
Hashimoto, T., Terada, A., and Tanaka, R. (2018). Volcanic Smoke Reduction in Visible and thermal Infrared Imagery. Earth Planets Space 70, 109. doi:10.1186/s40623-018-0886-5
Heap, M. J., Farquharson, J. I., Baud, P., Lavallée, Y., and Reuschlé, T. (2015). Fracture and Compaction of Andesite in a Volcanic Edifice. Bull. Volcanol. 77, 55. doi:10.1007/s00445-015-0938-7
Heap, M. J., Gravley, D. M., Kennedy, B. M., Gilg, H. A., Bertolett, E., and Barker, S. L. L. (2020). Quantifying the Role of Hydrothermal Alteration in Creating Geothermal and Epithermal mineral Resources: The Ohakuri Ignimbrite (Taupō Volcanic Zone, New Zealand). J. Volcanology Geothermal Res. 390, 106703. doi:10.1016/j.jvolgeores.2019.106703
Heap, M. J., Troll, V. R., Kushnir, A. R. L., Gilg, H. A., Collinson, A. S. D., Deegan, F. M., et al. (2019). Hydrothermal Alteration of Andesitic Lava Domes Can lead to Explosive Volcanic Behaviour. Nat. Commun. 10, 5063. doi:10.1038/s41467-019-13102-8
Heap, M. J., and Violay, M. E. S. (2021). The Mechanical Behaviour and Failure Modes of Volcanic Rocks: a Review. Bull. Volcanol. 83, 33. doi:10.1007/s00445-021-01447-2
Karátson, D., Favalli, M., Tarquini, S., Fornaciai, A., and Wörner, G. (2010). The Regular Shape of Stratovolcanoes: A DEM-Based Morphometrical Approach. J. Volcanology Geothermal Res. 193, 171–181. doi:10.1016/j.jvolgeores.2010.03.012
Kelfoun, K., Santoso, A. B., Latchimy, T., Bontemps, M., Nurdien, I., Beauducel, F., et al. (2021). Growth and Collapse of the 2018-2019 Lava Dome of Merapi Volcano. Bull. Volcanol. 83, 8. doi:10.1007/s00445-020-01428-x
Koulakov, I., Shapiro, N. M., Sens‐Schönfelder, C., Luehr, B. G., Gordeev, E. I., Jakovlev, A., et al. (2020). Mantle and Crustal Sources of Magmatic Activity of Klyuchevskoy and Surrounding Volcanoes in Kamchatka Inferred from Earthquake Tomography. J. Geophys. Res. Solid Earth 125, e2020JB020097. doi:10.1029/2020JB020097
Kozhurin, A., Acocella, V., Kyle, P. R., Lagmay, F. M., Melekestsev, I. V., Ponomareva, V., et al. (2006). Trenching Studies of Active Faults in Kamchatka, Eastern Russia: Palaeoseismic, Tectonic and hazard Implications. Tectonophysics 417, 285–304. doi:10.1016/j.tecto.2006.01.004
Krippner, J. B., Belousov, A. B., Belousova, M. G., and Ramsey, M. S. (2018). Parametric Analysis of Lava Dome-Collapse Events and Pyroclastic Deposits at Shiveluch Volcano, Kamchatka, Using Visible and Infrared Satellite Data. J. Volcanology Geothermal Res. 354, 115–129. doi:10.1016/j.jvolgeores.2018.01.027
Kubanek, J., Poland, M. P., and Biggs, J. (2021). Applications of Bistatic Radar to Volcano Topography-A Review of Ten Years of TanDEM-X. IEEE J. Sel. Top. Appl. Earth Observations Remote Sensing 14, 3282–3302. doi:10.1109/JSTARS.2021.3055653
Laiolo, M., Coppola, D., Barahona, F., Benítez, J. E., Cigolini, C., Escobar, D., et al. (2017). Evidences of Volcanic Unrest on High-Temperature Fumaroles by Satellite thermal Monitoring: The Case of Santa Ana Volcano, El Salvador. J. Volcanology Geothermal Res. 340, 170–179. doi:10.1016/j.jvolgeores.2017.04.013
Lénat, J.-F., Bachèlery, P., and Peltier, A. (2012). The interplay between collapse structures, hydrothermal systems, and magma intrusions: the case of the central area of Piton de la Fournaise volcano. Bull. Volcanol. 74, 407–421. doi:10.1007/s00445-011-0535-3
Lipman, P. W., and Mullineaux, D. R. (1981). The 1980 eruptions of Mount St. Helens, Washington, Prof. Paper, 1250, 844. doi:10.3133/pp1250
Maccaferri, F., Richter, N., and Walter, T. R. (2017). The Effect of Giant Lateral Collapses on Magma Pathways and the Location of Volcanism. Nat. Commun. 8. doi:10.1038/s41467-017-01256-2
Manconi, A., Longpre, M.-A., Walter, T. R., Troll, V. R., and Hansteen, T. H. (2009). The Effects of Flank Collapses on Volcano Plumbing Systems. Geology 37, 1099–1102. doi:10.1130/G30104A.1
Mania, R., Walter, T. R., Belousova, M., Belousov, A., and Senyukov, S. L. (2019). Deformations and Morphology Changes Associated with the 2016-2017 Eruption Sequence at Bezymianny Volcano, Kamchatka. Remote Sensing 11, 1278. doi:10.3390/rs11111278
Massaro, S., Sulpizio, R., Norini, G., Groppelli, G., Costa, A., Capra, L., et al. (2020). Analysing Stress Field Conditions of the Colima Volcanic Complex (Mexico) by Integrating Finite-Element Modelling (FEM) Simulations and Geological Data. Solid Earth 11, 2515–2533. doi:10.5194/se-11-2515-2020
Massimetti, F., Coppola, D., Laiolo, M., Valade, S., Cigolini, C., and Ripepe, M. (2020). Volcanic Hot-Spot Detection Using SENTINEL-2: A Comparison with MODIS-MIROVA Thermal Data Series. Remote Sensing 12, 820. doi:10.3390/rs12050820
Matthews, S. J., Gardeweg, M. C., and Sparks, R. S. J. (1997). The 1984 to 1996 Cyclic Activity of Lascar Volcano, Northern Chile: Cycles of Dome Growth, Dome Subsidence, Degassing and Explosive Eruptions. Bull. Volcanology 59, 72–82. doi:10.1007/s004450050176
Melekestsev, I. V., Dvigalo, V. N., Kirsanova, T. P., Ponomareva, V. V., and Pevzner, M. M. (2003). The 300 Years of Kamchatka Volcanoes: the Young Shiveluch. An Analysis of the Dynamics and Impact of Eruptive Activity during the 17–20th Centuries. Part I. 1650–1964. Volcanol. Seism., 1, 3–19. In Russian.
Melekestsev, I. V., Dvigalo, V. N., Kirsanova, T. P., Ponomareva, V. V., and Pevzner, M. M. (2004). The 300 Years of Kamchatka Volcanoes: the Young Shiveluch. An Analysis of the Dynamics and Impact of Eruptive Activity during the 17–20th Centuries. Part II. 1965–2000. Volcanol. Seism., 1, 5–24.
Merle, O., Vidal, N., and van Wyk de Vries, B. (2001). Experiments on Vertical Basement Fault Reactivation below Volcanoes. J. Geophys. Res. 106, 2153–2162. doi:10.1029/2000JB900352
Mordensky, S. P., Heap, M. J., Kennedy, B. M., Gilg, H. A., Villeneuve, M. C., Farquharson, J. I., et al. (2019). Influence of Alteration on the Mechanical Behaviour and Failure Mode of Andesite: Implications for Shallow Seismicity and Volcano Monitoring. Bull. Volcanol. 81, 44. doi:10.1007/s00445-019-1306-9
Nakada, S., Shimizu, H., and Ohta, K. (1999). Overview of the 1990-1995 Eruption at Unzen Volcano. J. Volcanology Geothermal Res. 89, 1–22. doi:10.1016/S0377-0273(98)00118-8
Ozerov, A. Y., Girina, O. A., Zharinov, N. A., Belousov, A. B., and Demyanchuk, Y. V. (2020). Eruptions in the Northern Group of Volcanoes, in Kamchatka, during the Early 21st Century. J. Volcanolog. Seismol. 14, 1–17. doi:10.1134/S0742046320010054
Pathier, E., Fielding, E. J., Wright, T. J., Walker, R., Parsons, B. E., and Hensley, S. (2006). Displacement Field and Slip Distribution of the 2005 Kashmir Earthquake from SAR Imagery. Geophys. Res. Lett. 33. doi:10.1029/2006GL027193
Plank, S., Massimetti, F., Soldati, A., Hess, K.-U., Nolde, M., Martinis, S., et al. (2021). Estimates of Lava Discharge Rate of 2018 Kīlauea Volcano, Hawaiʻi Eruption Using Multi-Sensor Satellite and Laboratory Measurements. Int. J. Remote Sensing 42, 1492–1511. doi:10.1080/01431161.2020.1834165
Ponomareva, V. V., Pevzner, M. M., and Melekestsev, I. V. (1998). Large Debris Avalanches and Associated Eruptions in the Holocene Eruptive History of Shiveluch Volcano, Kamchatka, Russia. Bull. Volcanology 59, 490–505. doi:10.1007/s004450050206
Ramsey, M. S., and Harris, A. J. L. (2013). Volcanology 2020: How Will thermal Remote Sensing of Volcanic Surface Activity Evolve over the Next Decade?. J. Volcanology Geothermal Res. 249, 217–233. doi:10.1016/j.jvolgeores.2012.05.011
Ramsey, M. S., Wessels, R. L., and Anderson, S. W. (2012). Surface Textures and Dynamics of the 2005 Lava Dome at Shiveluch Volcano, Kamchatka. Geol. Soc. America Bull. 124, 678–689. doi:10.1130/B30580.1
Ratdomopurbo, A., Beauducel, F., Subandriyo, J., Agung Nandaka, I. G. M., Newhall, C. G., Suharna, , et al. (2013). Overview of the 2006 Eruption of Mt. Merapi. J. Volcanology Geothermal Res. 261, 87–97. doi:10.1016/j.jvolgeores.2013.03.019
Reyes-Dávila, G. A., Arámbula-Mendoza, R., Espinasa-Pereña, R., Pankhurst, M. J., Navarro-Ochoa, C., Savov, I., et al. (2016). Volcán de Colima dome collapse of July, 2015 and associated pyroclastic density currents. J. Volcanology Geothermal Res. 320, 100–106. doi:10.1016/j.jvolgeores.2016.04.015
Sahetapy-Engel, S. T., Harris, A. J. L., and Marchetti, E. (2008). Thermal, Seismic and Infrasound Observations of Persistent Explosive Activity and Conduit Dynamics at Santiaguito Lava Dome, Guatemala. J. Volcanology Geothermal Res. 173, 1–14. doi:10.1016/j.jvolgeores.2007.11.026
Salzer, J. T., Thelen, W. A., James, M. R., Walter, T. R., Moran, S., and Denlinger, R. (2016). Volcano Dome Dynamics at Mount St. Helens: Deformation and Intermittent Subsidence Monitored by Seismicity and Camera Imagery Pixel Offsets. J. Geophys. Res. Solid Earth 121, 7882–7902. doi:10.1002/2016JB013045
Schaefer, L., Lu, Z., and Oommen, T. (2016). Post-eruption Deformation Processes Measured Using ALOS-1 and UAVSAR InSAR at Pacaya Volcano, Guatemala. Remote Sensing 8, 73. doi:10.3390/rs8010073
Schilling, S. P., Thompson, R. A., Messerich, J. A., and Iwatsubo, E. Y. (2008). Use of Digital Aerophotogrammetry to Determine Rates of Lava Dome Growth, Mount St. Helens, Washington, 2004-2005. Prof. Paper, 1750, 145–167. doi:10.3133/pp17508
Shevchenko, A. V., Dvigalo, V. N., and Svirid, I. Y. (2015). Airborne Photogrammetry and Geomorphological Analysis of the 2001-2012 Exogenous Dome Growth at Molodoy Shiveluch Volcano, Kamchatka. J. Volcanology Geothermal Res. 304, 94–107. doi:10.1016/j.jvolgeores.2015.08.013
Shevchenko, A. V., Dvigalo, V. N., Walter, T. R., Mania, R., Maccaferri, F., Svirid, I. Y., et al. (2020). The Rebirth and Evolution of Bezymianny Volcano, Kamchatka after the 1956 Sector Collapse. Commun. Earth Environ. 1, 15. doi:10.1038/s43247-020-00014-5
Shevchenko, A. V., Dvigalo, V. N., Zorn, E. U., Vassileva, M. S., Walter, T. R., Svirid, I. Y., et al. (2021). Shiveluch Volcano 2012-2019 Photogrammetric Dataset. GFZ Data Services. doi:10.5880/GFZ.2.1.2021.002
Shevchenko, A. V., and Svirid, I. Y. (2014). “Collapsing Processes of the Current Lava Dome at Molodoy Shiveluch Volcano,”Proceedings of the XIII regional youth conference “The natural environment of Kamchatka (Institute of Volcanology and Seismology FEB RAS, Petropavlovsk-Kamchatsky), 129–142. In Rusian.
Sibrant, A. L. R., Marques, F. O., and Hildenbrand, A. (2014). Construction and Destruction of a Volcanic Island Developed inside an Oceanic Rift: Graciosa Island, Terceira Rift, Azores. J. Volcanology Geothermal Res. 284, 32–45. doi:10.1016/j.jvolgeores.2014.07.014
Stevenson, J. A., and Varley, N. (2008). Fumarole monitoring with a handheld infrared camera: Volcán de Colima, Mexico, 2006-2007. J. Volcanology Geothermal Res. 177, 911–924. doi:10.1016/j.jvolgeores.2008.07.003
Stinton, A. J., Cole, P. D., Stewart, R. C., Odbert, H. M., and Smith, P. (2014). Chapter 7 the 11 February 2010 Partial Dome Collapse at Soufrière Hills Volcano, Montserrat. Geol. Soc. Lond. Mem. 39, 133–152. doi:10.1144/M39.7
Sun, L., and Muller, J.-P. (2016). Evaluation of the Use of Sub-pixel Offset Tracking Techniques to Monitor Landslides in Densely Vegetated Steeply Sloped Areas. Remote Sensing 8, 659. doi:10.3390/rs8080659
Surono, Jousset, P., Pallister, J., Boichu, M., Buongiorno, M. F., Budisantoso, A., et al. (2012). The 2010 Explosive Eruption of Java's Merapi Volcano-A '100-year' Event. J. Volcanology Geothermal Res. 241-242, 121–135. doi:10.1016/j.jvolgeores.2012.06.018
Swanson, D. A., and Holcomb, R. T. (1990). “Regularities in Growth of the Mount St. Helens Dacite Dome, 1980-1986,”IAVCEI Proceedings in Volcanology. Editor J. H. Fink (Berlin, Heidelberg: Springer Berlin Heidelberg), Vol. 2, 3–24. doi:10.1007/978-3-642-74379-5_1
Tatsumi, Y., Suzuki-Kamata, K., Matsuno, T., Ichihara, H., Seama, N., Kiyosugi, K., et al. (2018). Giant Rhyolite Lava Dome Formation after 7.3 Ka Supereruption at Kikai Caldera, SW Japan. Sci. Rep. 8, 2753. doi:10.1038/s41598-018-21066-w
Tibaldi, A., Corazzato, C., Kozhurin, A., Lagmay, A. F. M., Pasquarè, F. A., Ponomareva, V. V., et al. (2008). Influence of Substrate Tectonic Heritage on the Evolution of Composite Volcanoes: Predicting Sites of Flank Eruption, Lateral Collapse, and Erosion. Glob. Planet. Change 61, 151–174. doi:10.1016/j.gloplacha.2007.08.014
Valade, S., Ley, A., Massimetti, F., D’Hondt, O., Laiolo, M., Coppola, D., et al. (2019). Towards Global Volcano Monitoring Using Multisensor Sentinel Missions and Artificial Intelligence: The MOUNTS Monitoring System. Remote Sensing 11, 1528. doi:10.3390/rs11131528
Voight, B., Komorowski, J.-C., Norton, G. E., Belousov, A. B., Belousova, M., Boudon, G., et al. (2002). The 26 December (Boxing Day) 1997 Sector Collapse and Debris Avalanche at Soufrière Hills Volcano, Montserrat. Geol. Soc. Lond. Mem. 21, 363–407. doi:10.1144/GSL.MEM.2002.021.01.17
Wadge, G., Cole, P., Stinton, A., Komorowski, J.-C., Stewart, R., Toombs, A. C., et al. (2011). Rapid Topographic Change Measured by High-Resolution Satellite Radar at Soufriere Hills Volcano, Montserrat, 2008-2010. J. Volcanology Geothermal Res. 199, 142–152. doi:10.1016/j.jvolgeores.2010.10.011
Walker, G. P. L. (1984). Downsag Calderas, Ring Faults, Caldera Sizes, and Incremental Caldera Growth. J. Geophys. Res. 89, 8407–8416. doi:10.1029/JB089iB10p08407
Walter, T. R., Haghshenas Haghighi, M., Schneider, F. M., Coppola, D., Motagh, M., Saul, J., et al. (2019). Complex hazard cascade Culminating in the Anak Krakatau Sector Collapse. Nat. Commun. 10, 4339. doi:10.1038/s41467-019-12284-5
Walter, T. R., Legrand, D., Granados, H. D., Reyes, G., and Arámbula, R. (2013a). Volcanic Eruption Monitoring by thermal Image Correlation: Pixel Offsets Show Episodic Dome Growth of the Colima Volcano. J. Geophys. Res. Solid Earth 118, 1408–1419. doi:10.1002/jgrb.50066
Walter, T. R., Ratdomopurbo, A., Subandriyo, N., Aisyah, K. S., Salzer, J., et al. (2013b). Dome Growth and Coulée Spreading Controlled by Surface Morphology, as Determined by Pixel Offsets in Photographs of the 2006 Merapi Eruption. J. Volcanology Geothermal Res. 261, 121–129. doi:10.1016/j.jvolgeores.2013.02.004
Walter, T. R., Subandriyo, J., Kirbani, S., Bathke, H., Suryanto, W., Aisyah, N., et al. (2015). Volcano-tectonic Control of Merapi's Lava Dome Splitting: The November 2013 Fracture Observed from High Resolution TerraSAR-X Data. Tectonophysics 639, 23–33. doi:10.1016/j.tecto.2014.11.007
Walter, T., and Schmincke, H.-U. (2002). Rifting, Recurrent Landsliding and Miocene Structural Reorganization on NW-Tenerife (Canary Islands). Int. J. Earth Sci. (Geol Rundsch) 91, 615–628. doi:10.1007/s00531-001-0245-8
Watt, S. F. L. (2019). The Evolution of Volcanic Systems Following Sector Collapse. J. Volcanology Geothermal Res. 384, 280–303. doi:10.1016/j.jvolgeores.2019.05.012
Wyering, L. D., Villeneuve, M. C., Wallis, I. C., Siratovich, P. A., Kennedy, B. M., Gravley, D. M., et al. (2014). Mechanical and Physical Properties of Hydrothermally Altered Rocks, Taupo Volcanic Zone, New Zealand. J. Volcanol. Geotherm. Res. 288, 76–93. doi:10.1016/j.jvolgeores.2014.10.008
Zorn, E. U., Rowe, M. C., Cronin, S. J., Ryan, A. G., Kennedy, L. A., and Russell, J. K. (2018). Influence of Porosity and Groundmass Crystallinity on Dome Rock Strength: a Case Study from Mt. Taranaki, New Zealand. Bull. Volcanol. 80, 35. doi:10.1007/s00445-018-1210-8
Keywords: lava dome, shiveluch volcano, photogrammetry, extrusive eruption, flank collapse
Citation: Shevchenko AV, Dvigalo VN, Zorn EU, Vassileva MS, Massimetti F, Walter TR, Svirid IY, Chirkov SA, Ozerov AY, Tsvetkov VA and Borisov IA (2021) Constructive and Destructive Processes During the 2018–2019 Eruption Episode at Shiveluch Volcano, Kamchatka, Studied From Satellite and Aerial Data. Front. Earth Sci. 9:680051. doi: 10.3389/feart.2021.680051
Received: 13 March 2021; Accepted: 25 May 2021;
Published: 08 June 2021.
Edited by:
Stephen Self, University of California, Berkeley, United StatesReviewed by:
David Matthew Hyman, Cooperative Institute for Meteorological Satellite Studies (CIMSS), United StatesMatt Pritchard, Cornell University, United States
Nick Varley, University of Colima, Mexico
Copyright © 2021 Shevchenko, Dvigalo, Zorn, Vassileva, Massimetti, Walter, Svirid, Chirkov, Ozerov, Tsvetkov and Borisov. This is an open-access article distributed under the terms of the Creative Commons Attribution License (CC BY). The use, distribution or reproduction in other forums is permitted, provided the original author(s) and the copyright owner(s) are credited and that the original publication in this journal is cited, in accordance with accepted academic practice. No use, distribution or reproduction is permitted which does not comply with these terms.
*Correspondence: Alina V. Shevchenko, alinash@gfz-potsdam.de