- 1Key Laboratory of Meteorological Disaster, Ministry of Education (KLME), and International Joint Research Laboratory on Climate and Environment Change (ILCEC), and Collaborative Innovation Center on Forecast and Evaluation of Meteorological Disasters, Nanjing University of Information Science and Technology, Nanjing, China
- 2Guangzhou Institute of Tropical Marine Meteorology, China Meteorological Administration, Guangzhou, China
- 3Key Laboratory of Meteorology and Ecological Environment of Hebei Province, Hebei Provincial Institute of Meteorological Sciences, Shijiazhuang, China
- 4Key Laboratory of South China Sea Meteorological Disaster Prevention and Mitigation of Hainan Province, Haikou , China
- 5College of Geographic Sciences, Nanjing University of Information Science and Technology, Nanjing, China
- 6Nanjing Institute of Environmental Science, Ministry of Environmental Protection, Nanjing, China
- 7Nanjing Meteorological Bureau, Nanjing, China
- 8Meteorological Observation Center, China Meteorological Administration, Beijing, China
The eastern coastal areas of China span multiple climatic zones, and the impacts of climate warming on their ecological environment show regional differences. In this research, the Normalized Difference Vegetation Index (NDVI) was used as the indicator to characterize the ecological environment, and selected Guangdong, Jiangsu, and Liaoning as its typical research areas. The authors selected the NDVI, average temperature, and precipitation data of the yearly growth season, respectively, from 1982 to 2016. This study adopted the copula functions model based on Markov Chain Monte Carlo to carry out the research of bivariate joint distribution so as to calculate the joint probability, the joint exceedance probability, the joint return period and the co-occurrence return period. The results showed that 1) the temperature and precipitation in the three regions were respectively related to the NDVI sequence showing the characteristic that was correlated at the upper tail and asymptotically independent at the lower tail, which demonstrated that the temperature and precipitation had little effect on NDVI when they reached their minimum values, and the temperature and precipitation had obvious effect on NDVI when they reached their maximum values. 2) The shorter the return period was, the wider the ranges of the climate factor and the NDVI were, showing that when the climate factor was constant, the probability of the NDVI having a shorter return period was higher. The greater the climate factor was, the longer the return period was, indicating that the probability of plant growth inhibition was higher when the climate factor exceeded a certain threshold. 3) The suitable temperature and precipitation for vegetation growth in the three regions gradually decreased from south to north. These results provide some theoretical guidance and scientific foundation for the protection of regional ecological environment and enhance the understanding of the impact of climate change on the ecosystem.
Introduction
As the main body of the terrestrial ecosystem, vegetation is an important part connecting the atmosphere, soil water, and energy cycle (Huryna and Pokorný, 2016; Jin et al., 2017), and thus has great significance to regional climate regulation, surface energy balance and soil and water conservation, etc. (Li et al., 2016; Duveiller et al., 2018; He et al., 2018). Climate resources such as light, heat, and water are the basis of vegetation growth, and a vegetation variation is a key indicator to measure a regional environment and a climate change (Li et al., 2017; Zewdie et al., 2017; Wan et al., 2018). The interaction between the climate change and the vegetation has aroused widespread interest of scholars and become a research hotspot in recent years (Huete, 2016; Seidl et al., 2017).
There is a bidirectional feedback mechanism between the climate and the terrestrial ecosystem: a variation of a hydrothermal condition causes a change in a temporal and spatial distribution pattern of the terrestrial ecosystem (Huang et al., 2016; Huang et al., 2019); and the change of the ecosystem patterns affects a regional carbon cycle and water cycle process, which in turn reacts on the regional climate (Sippel et al., 2018; Quan et al., 2019). Under the background of climate warming, temperature, precipitation, radiation, and other factors in different regions are obviously different, and the influence of the climate change on the vegetation in different regions varies. The study held that the changes in factors such as temperature, water, and light affect the vegetation by participating in photosynthesis, respiration, and transpiration of the vegetation (Zandalinas et al., 2018; Dusenge et al., 2019). Meanwhile, the vegetation is sensitive and adaptable to the climate, resulting in differences in response rules of the regional vegetation to the climate change. Therefore, the interaction between the regional climate and the vegetation belongs to a nonlinear category (Wen et al., 2017).
Normalized difference vegetation index (NDVI), as an important representative indicator of the growth of surface vegetation, is widely used in the study on dynamic changes of the vegetation (Xu et al., 2016). China’s climate resources show obvious regional differences, vegetation types are diverse, and a relationship between the vegetation changes and the regional climate is heterogeneous. Existing researches on the relationship between the climate changes and the NDVI mainly focused on the overall correlation between various elements and the NDVI on the regional scale, or the interrelationship between them on the multi-time scale; while a relationship between different action subintervals of climate elements and their corresponding NDVI has not been excavated. Thus, the dynamic correlation analysis of climate factors and the NDVI cannot be achieved, nor can the optimal hydrothermal condition for the NDVI-based growth under the conditions of the regional climate and climate variability differences be described. Besides, no zoning discussion has been done according to the differences in the climatic zones.
Traditional correlation coefficients have been adopted as a popular method to study the correlation between variables, but cannot distinguish the dynamic correlation between the variables in different intervals or exclude the possibility of “pseudo correlation” between the variables (Ramos-Cordoba et al., 2016). In addition, although linear regression fitting is also commonly used in the modeling of multi-element interaction, the application prerequisite of such method is to assume that there is a linear relationship between the variables, which requires the data distribution to conform to the stationarity. In the context of climate warming, the temperature, precipitation, and NDVI all have the changing trend, and the data no longer meet the precondition of the hypothesis of the stationarity. These problems can be effectively solved by Copula function theory (Abdi et al., 2017). The Copula function can reflect a correlation structure of random variables independently from the marginal distribution of random variables. Any marginal distribution can be constructed into a joint distribution through the Copula function. There will be no information distortion and loss as the information of a single variable is included in the marginal distribution (Lee, 2018; Papalexiou and Serinaldi, 2020). The multi-dimensional joint distribution was built on the basis of the marginal distribution and correlation of the variables, and a probability distribution function was established through the Copula function theory to depict in detail the dependence of temperature-NDVI and precipitation-NDVI in different value ranges, and the probability of was obtained. This research has studied the influence of hydrothermal condition variations on an NDVI, explored the spatial differentiation rule of temperature, precipitation, and NDVI changes in different temperature zones and quantified the effect of hydrothermal combination to the vegetation growth, which can provide a theoretical basis for a deep understanding of the interaction between regional scale climate and its ecosystem. And this will be conducive to an active response to the climate changes, and serving environmental protection and decision-making plan of coping with the climate warming better.
This research consisted of five sections: Materials and Methods presented an outline introduction to the research areas and the used data and method. Through the establishment of joint probability distribution and exceedance probability distribution, Results Analysis analyzed the interaction relationship among the NDVI, the average temperature and the precipitation, and calculate the corresponding joint return period. Discussion section focused on the causes of NDVI dynamic change, and analyzed the response of NDVI to temperature and precipitation in detail. Finally, the conclusions were presented in Conclusion.
Materials and Methods
An Outline Introduction to the Research Areas
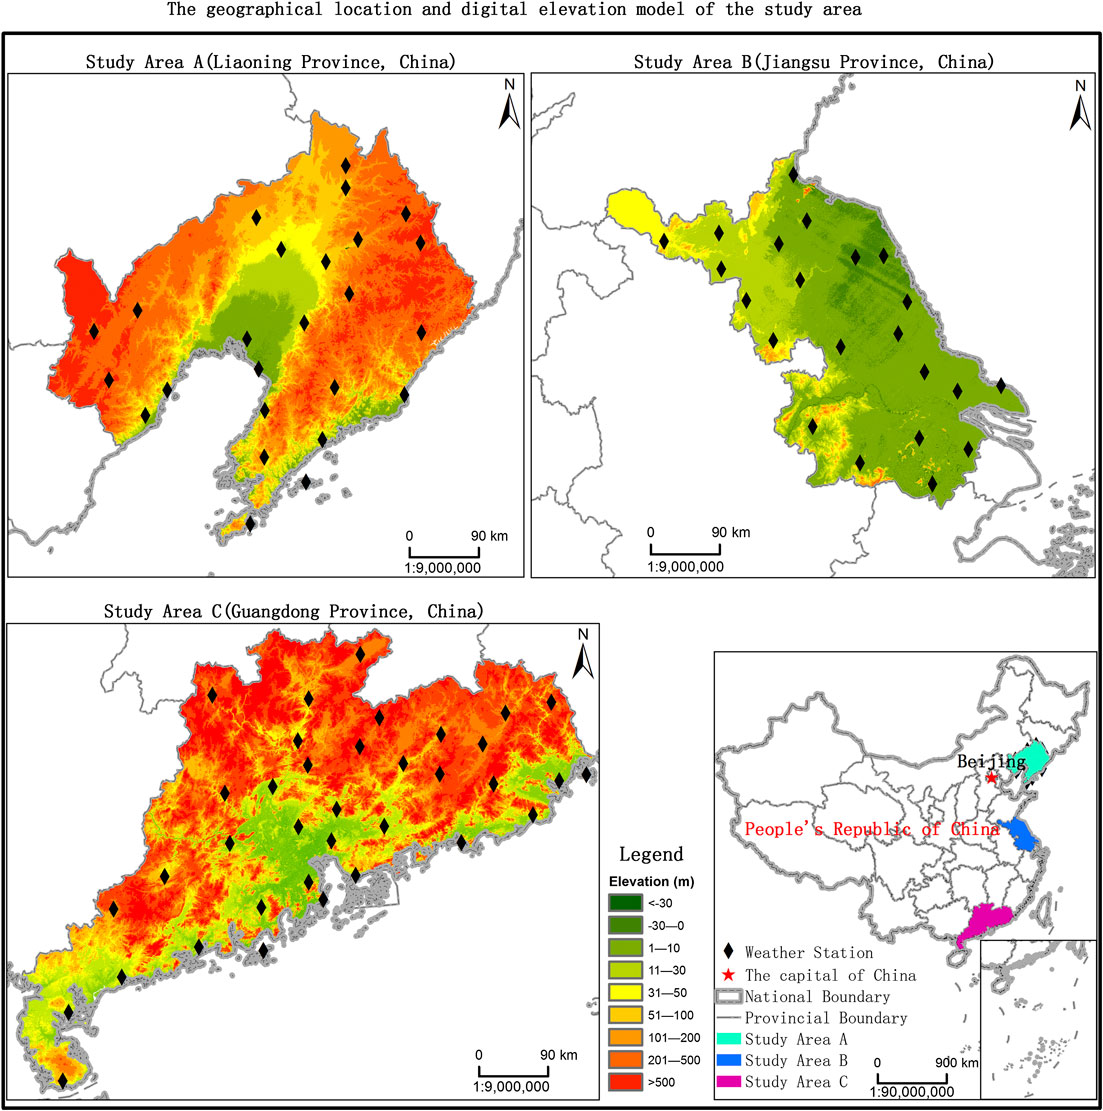
Figure 1 shows the geographical location of the study area. Guangdong is a southern province of China with a tropical and subtropical monsoon climate. Therefore, it has long summers and warm winters. The average annual temperature is from 20.4 to 23.1°C. Jiangsu is an eastern-central province of China and is situated in a transitional area between the temperate and subtropical zone. Generally, toward the south of the Huaihe River and sub-northern irrigation canal, humid subtropical climate zone is experienced, whereas, warm temperate climate zone is experienced toward the north. The annual mean temperature is from 13 to 16°C, increasing from the northeast to southwest area. Liaoning is a northern coastal province in Northeast of China and is located in temperate monsoon climate zone. The temperature in this area is characterized by uneven spatial distributions, decreasing from the plain to the mountain area. The annual average temperature in Liaoning is from 7 to 11°C (Figure 1).
Data and Preprocessing
Meteorological Data and Preprocessing
The daily temperature records from January 1, 1982 to December 31, 2016 were collected for the three provinces from 90 meteorological stations provided by the China Meteorological Administration (https://data.cma.cn/site/index.html). The stations were selected on the basis of the length of the time series, data completeness (missing values less than 5%), and spatial coverage. A series of quality control tests were applied to identify outliers at all stations and were marked with a quality control flag. The average daily temperatures were then extracted. It should be noted that the level of data completeness in the study exceeded the minimum requirement of 95%. At this level, scaling indices and scaling behaviors of the time series were not affected. The monthly regional average temperatures and precipitations of Guangdong, Jiangsu, and Liaoning provinces were calculated respectively according to the daily average air temperature and precipitation.
Normalized Difference Vegetation Index Data and Preprocessing
Two kinds of NDVI datasets including the latest updated version of the third generation Global Inventory Monitoring and Modeling System (GIMMS, available at https://ecocast.arc.nasa.gov/data/pub/gimms/3g.v1/ as nc4 files) and MODIS NDVI were both used in the study. The GIMMS NDVI 3g.v1 is generated from National Oceanic and Atmospheric Administration’s Advanced Very High Resolution Radiometer data, and the spatial resolution is 1/12°. Its temporal resolution is 15-days intervals with span from 1982 to 2013. This data set eliminates the effects of volcanic eruption, solar altitude angle, and sensor sensitivity changes over time, making the quality of the GIMMS data set superior to other NDVI data sets. The GIMMS data is the longest time series of NDVI data at present. It has a better correlation with other high-resolution data sets and has been extensively used in the world. The MODIS NDVI data (available at https://ladsweb.modaps.eosdis.nasa.gov/) is derived from the MODIS vegetation index product developed by NASA MODIS Land Product Team according to the unified algorithm. The MODIS NDVI used in the study is MOD13A2, i.e., the vegetation index with a resolution of 1 km and temporal resolution of 16 days.
The data sets of GIMMS NDVI and MODIS NDVI in Guangdong, Jiangsu, and Liaoning were obtained respectively after NDVI data were preprocessed through quality inspection, image mosaic, subset extraction, cropping, format, and projection conversion and so on. In order to get rid of the differences in temporal resolution there between, the Maximum Value Composite (MVC) was used to obtain monthly scale NDVI data, so as to further remove the impact of clouds and aerosols (Liu, 2017; Seong et al., 2020), and reduce the effect of the phenological cycle in the month (Fensholt and Proud, 2012). The averaged NDVI for growing season was calculated for analysis. The pixel values with an average of growing season NDVI <0.1 were masked as non-vegetated areas.
Due to the different spatial resolutions of the GIMMS data and the MODIS data, this research has adopted the GIMMS data with the time span from 1982 to 2013, and the MODIS data with the time series from 2001 to 2016. The correlation analysis of the monthly NDVI data was carried out in terms of data in overlapping periods. The correlation coefficient of the two data is 0.927, and the linear regression equation is NDVIGIMMS = 0.781 * NDVIMODIS − 0.0469(r2 = 0.9016, p-value < 0.05). Using the regression equation and combining MODIS-NDVI data from 2014 to 2016 to interpolate monthly GIMMS-NDVI data, the time span of GIMMS NDVI data set was extended to 1982–2016.
Methods
Maximum Value Composites
The MVC was proposed by Holben (1986). The specific formula of MVC (Kundu et al., 2018) is as follows:
where NDVIi refers to the NDVI in the ith month or the ith year; and NDVIij refers to the NDVI data on the jth 15-day in the ith month or on the jth month in the ith year.
Copula Function Theory
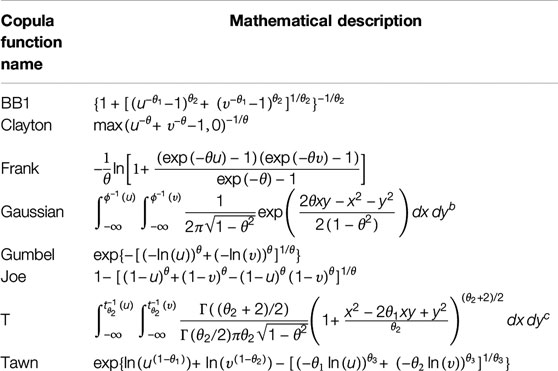
The Copula function raised by Sklar (Li et al., 2018) can use the marginal distribution and correlation framework to build a multi-dimensional joint distribution Copula function model (Salvadori and De Michele, 2007). The study selected eight Copula function clusters (Clayton, 1978; Genest and Favre, 2007; Li et al., 2013; Sraj et al., 2015), including 1) BB1, 2) Clayton, 3) Frank, 4) Gaussian, 5) Gumbel, 6) Joe, 7) t, and 8) Tawn. These eight forms of the Copula functions have always been common choices for related models due to their performances. The selected Copula functions were used to establish a two-dimensional joint distribution of climate elements and NDVI.
Parameter Estimation
The parameters of the Copula function were calculated by the non-parametric estimation method (Genest and Rivest, 1993). This technique is mainly related to the parameter θ of the Copula. See Table 1 for various Copula function forms.
Formula (2) shows the relationship between θ and τ (Kendall correlation coefficient). By calculating τ from the measured data, the corresponding joint distribution parameters can be obtained
Verification and Evaluation
To quantitatively evaluate the fitting error and select the appropriate Copula function, Akaike information criterion (AIC), Bayesian information criterion (BIC) (Pho et al., 2019), and root mean square error (Dodangeh et al., 2017) were employed as the criteria for selecting the Copula function clusters.
K was the number of estimated parameters in the model including the intercept and
where n is the number of observations, Xc is the theoretical probability of copula, and Xo is the empirical probabilities of observations.
Correlation Analysis and Establishment of Marginal Distribution Function
In order to determine whether there was a correlation between the NDVI and monthly mean temperature and monthly precipitation, this paper established a joint distribution function and adopted Kendall, Pearson, and Spearman rank correlation coefficients to analyze the correlation between the climate elements and the NDVI.
Multivariate Copula Analysis Toolbox, as a general software toolbox, uses Markov Chain Monte Carlo simulations to estimate Copula parameters (Sadegh et al., 2017). It was adopted to study the dependency structure between variables and select the optimal marginal distribution function for each variable. Distribution functions include 1) Beta, 2) Birnbaum-Saunders, 3) exponential, 4) extreme value, 5) Gamma, 6) generalized extreme value, 7) generalized Pareto, 8) inverse Gaussian, 9) logistic, 10) log-logistic, 11) lognormal, 12) Nakagami, 13) normal, 14) Rayleigh, 15) Rician, 16) T location scale, and 17) Weibull distributions. The parameters are estimated by the maximum likelihood approach. Detailed descriptions about these distributions refer to Sadegh et al. (2018).
Joint Probability Distribution
For the sake of the study of the joint probability of Tavg-NDVI and Pre-NDVI, the marginal distributions of Tavg, Pre, and NDVI were calculated respectively, and the parameters of this function were obtained. The comparison between a fitting result of the function and the actual data was evaluated by Quantile-Quantile plot. Based on the univariate marginal function, a two-dimensional Copula function was constructed, and three goodness-of-fit evaluation indexes of AIC, BIC, and root mean square error were used to select the optimal Copula function type from the Copula function clusters (Chen and Sun, 2015).
The Return Period of Normalized Difference Vegetation Index and Mean Temperature/Precipitation
The return period refers to the time when the value of the random variable appears in a longer period (Singh and Zhang, 2018). Calculating the return periods of the NDVI under different temperature and precipitation conditions can provide valuable information for a more meticulous study of how heat and water affect the NDVI. This paper calculates a bivariate joint return period and conditional return period because the univariate recurrence interval or return period often leads to overestimation or underestimation of the risk rate of an event (Shiau, 2006). It is defined that in the joint return period, X ≥ x and Y ≥ y, and in the conditional return period, X ≥ x or Y ≥ y.
In the above formulas, Tjoint represented the joint return period for X ≥ x and Y ≥ y; Tconditional indicated the conditional return period for X ≥ x or Y ≥ y; and E(L) showed an expected value of the time interval at which continuous events start. Detailed discussions on the relationships between univariate, bivariate, and conditional return periods could be found in Shiau (2006).
Results Analysis
Trend Analysis of Mean Temperature, Precipitation, and Normalized Difference Vegetation Index
From Guangdong to Liaoning, it spanned tropical, subtropical, and temperate zones, and climate and NDVI change rates in different regions vary markedly. Figure 2 showed the variation trends of mean temperature (Tavg), precipitation (Pre), and NDVI in Guangdong, Jiangsu, and Liaoning.
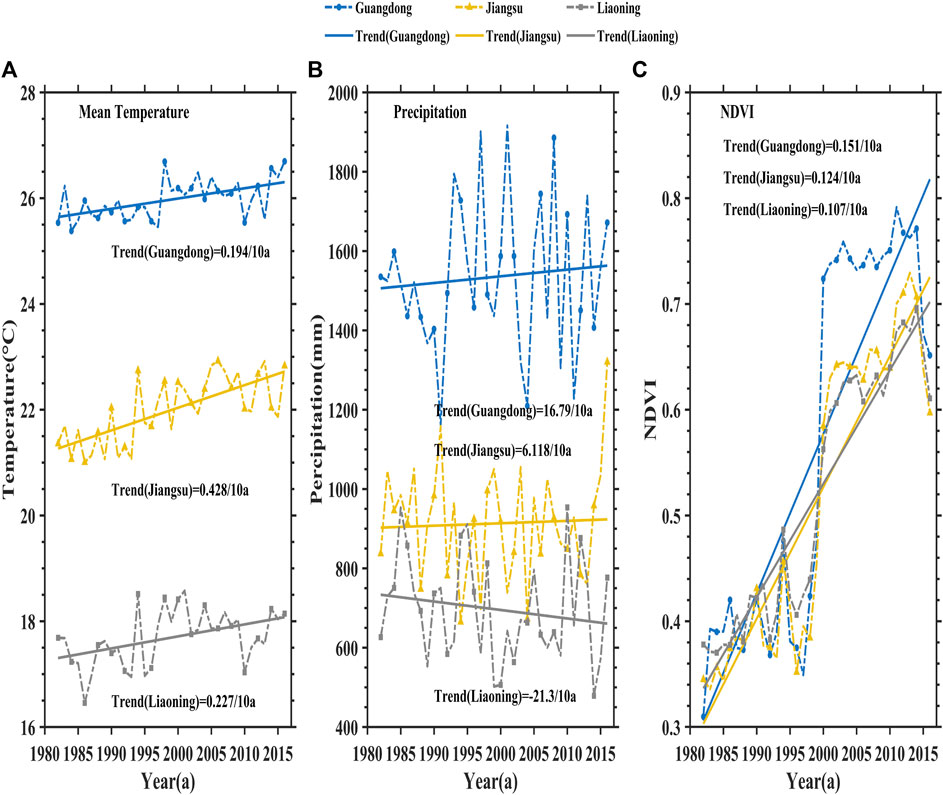
FIGURE 2. The historical trend variations of mean temperature (Tavg), precipitation (Pre), and NDVI in Guangdong, Jiangsu, and Liaoning provinces. (A) The mean temperature, (B) the precipitation, and (C) the normalized difference vegetation index (NDVI).
It can be seen from Figure 2A that Tavg in Guangdong, Jiangsu, and Liaoning provinces showed an obvious rising trend from 1982 to 2016 and displayed a larger regional difference in a descending order as follows: GuangDong > JiangSu > Liaoning. However, the mean temperature change rate was the smallest in Guangzhou and the largest in Jiangsu, which may be caused by the fact that climate regulation of sea surface temperature enhanced the stability of a climate system of Guangdong greatly influenced by marine factors. Located at the junction of subtropical monsoon climate zone and temperate continental monsoon climate zone, serving as the junction of China’s zero isotherm, Jiangsu was affected by alternating cold and warm air masses. Factors capable of changing the Jiangsu’s climate were complex and changeable, resulting in a large temperature change rate. In Figure 2B, the descending order of precipitations in the three regions was the same as the mean temperature, but the precipitation change rates were as follows: GuangDong > JiangSu > Liaoning. Here, the precipitation in Liaoning Province showed a significant downward trend, which was due to the law that the annual precipitation in Liaoning Province decreases from southeast to northwest at almost equal intervals, and the significant decrease of the precipitation mainly arose from dramatically reduced summer precipitation in southeast and winter precipitation in southern Liaoning. Figure 2C showed the variation trends of the NDVI in the three provinces. The NDVI of the three regions showed a highly consistent increase trend during the growing season. The NDVI change rate in Guangdong was notably higher than that in the other two provinces, and the NDVI of each of the three regions had a huge transition around 1998.
Joint Probability Distribution of Mean Temperature, Precipitation, and Normalized Difference Vegetation Index
The mean temperature and precipitation provide necessary heat and water conditions for vegetation growth. There are regional differences in the influence of internal hydrothermal conditions on NDVI-based growth in different temperature zones. Correlation analysis was conducted on Tavg, Pre, and NDVI during the growing season in Guangdong, Jiangsu, and Liaoning. Kendall rank correlation coefficients, Pearson correlation coefficients, and Spearman rank correlation coefficients were used to measure the correlation of two-dimensional variables. The calculation results are shown in Table 2.

TABLE 2. The Kendall, Spearman, and Pearson correlation between the mean temperature (Tavg), precipitation (Pre), and its corresponding normalized difference vegetation index (NDVI) during the growing season (April–October) in Guangdong, Jiangsu, and Liaoning provinces.
According to Table 2, the Tavg and the NDVI had a relatively obvious positive correlation during the growing season in the three regions, and all had passed the hypothesis test (p < 0.01). The correlation intensity was Liaoning > Jiangsu > Guangdong. There was a comparatively pronounced positive correlation between the Pre and the NDVI in Jiangsu and Liaoning, and the correlation in Liaoning was greater than that in Jiangsu. The monthly Pre and NDVI in Guangdong showed a relatively remarkable negative correlation, and both had passed the hypothesis test (p < 0.05). The correlation between the mean temperature and the precipitation decreased from north to south with the decrease of latitude, while the absolute value of a correlation coefficient corresponding to the precipitation was less than the value of the mean temperature in the same region, which indicated that the influence of the mean temperature on vegetation growth was notably higher than that of the precipitation in various temperature zones along the east coast of China.
As it could be seen from Tables 3 and 4, the optimal Copula functions for the Tavg-NDVI Copulas in Guangdong, Jiangsu, and Liaoning were BB1, Tawn, and BB1, respectively, and their corresponding three evaluation index values were all less than those of the other seven Copula functions. Similarly, the optimal Copula functions for the Pre-NDVI Copulas in the three provinces were Gaussian, Tawn, and Gaussian, respectively. It indicated that these Copula functions had the best fitting effect and were more suitable to describe the joint distribution characteristics of Tavg-NDVI and Pre-NDVI. Therefore, this paper chose BB1 Copula, Tawn Copula, and BB1 Copula as well as Gaussian Copula, Tawn Copula, Gaussian Copula functions to establish two-dimensional joint probability distribution models of the mean temperature, precipitation, and NDVI in the three regions, respectively.
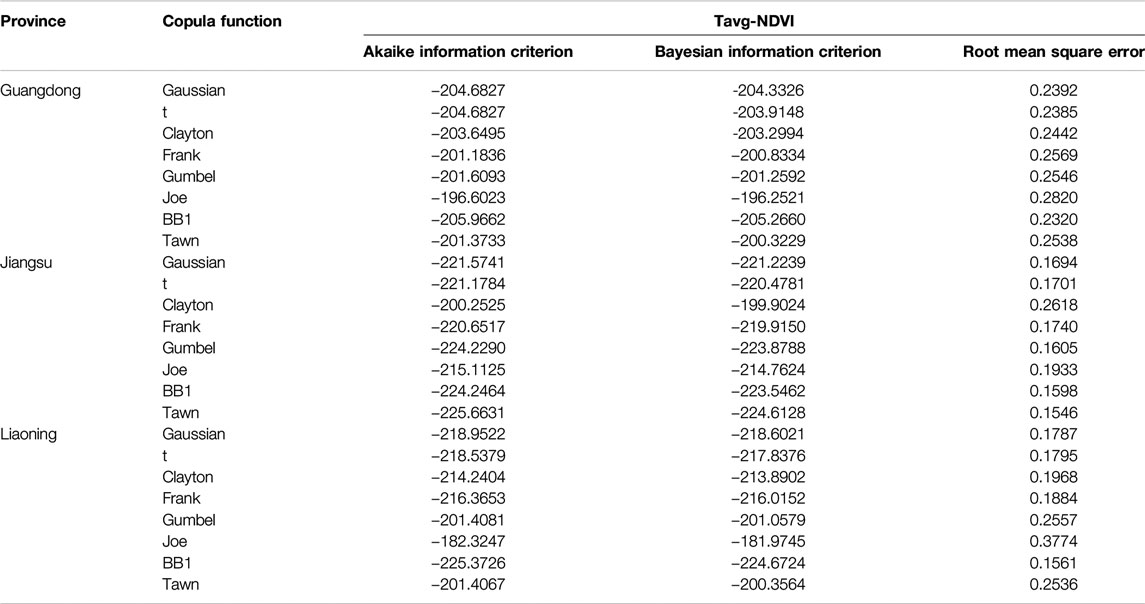
TABLE 3. Copula function cluster selection criteria for mean temperature-normalized difference vegetation index (NDVI) in Guangdong, Jiangsu, and Liaoning.
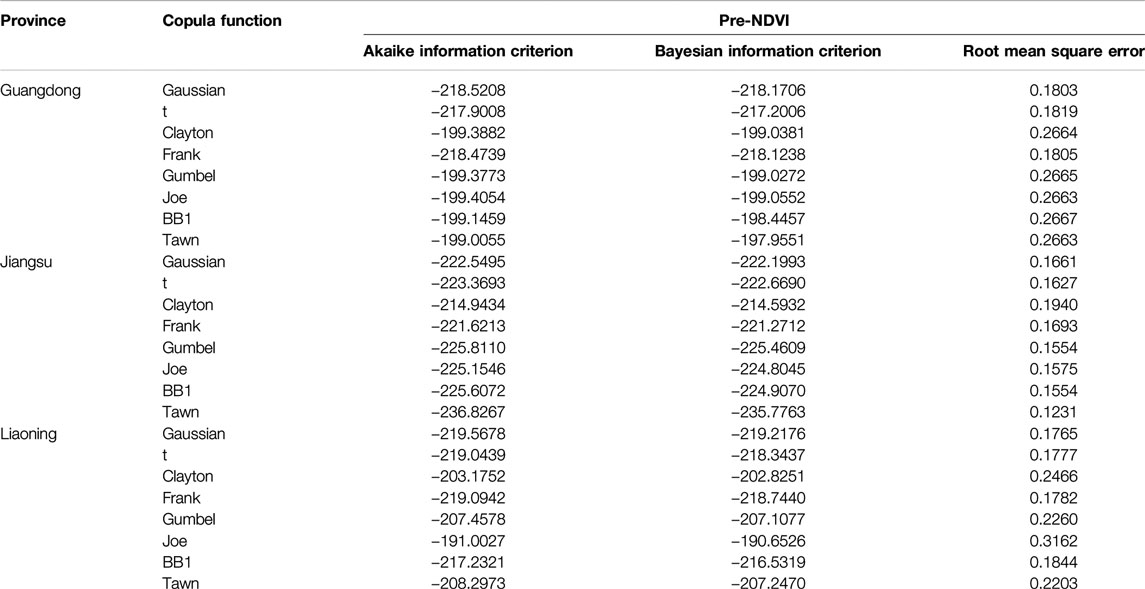
TABLE 4. Copula function cluster selection criteria for precipitation-normalized difference vegetation index (NDVI) in Guangdong, Jiangsu, and Liaoning.
Climate Response of Normalized Difference Vegetation Index to Mean Temperature and Precipitation
Figure 3 showed the joint probability distribution relationship between the monthly mean temperatures and the NDVI in the growing season from 1982 to 2016 in Guangdong (Figure 3A), Jiangsu (Figure 3B) and Liaoning (Figure 3C). The joint probability of the mean temperature and the NDVI at any point could be obtained from the figure. The joint probability distribution function could clearly reflect the correlation between the mean temperatures and the NDVI in different ranges. The most prominent feature in the figure was an asymmetric and inclined dependency structure of monthly scale data. Guangdong probability isoline had the smallest inclination, and Liaoning’s probability isoline had the largest inclination, indicating that the correlation between the mean temperature and the NDVI increased from south to north. The limit change of the tail intervals of the commonly used two-dimensional Copula distribution was very small, and the tail interval mainly presented a characteristic of approximately independent distribution or relatively intensive asymptotic correlation. The probability distribution function of the mean temperature and the NDVI in the figure showed the characteristics that the upper tail was higher than the lower tail. That is, the mean temperature was correlated with the upper tail on the NDVI sequence, and the lower tail was gradually independent, demonstrating that the minimum mean temperature had little influence on the NDVI, while the maximum mean temperature had significant influence on the NDVI. According to the isogram, the interval distribution of the mean temperature and the NDVI could be obtained when the joint probability is 0.1–0.9.
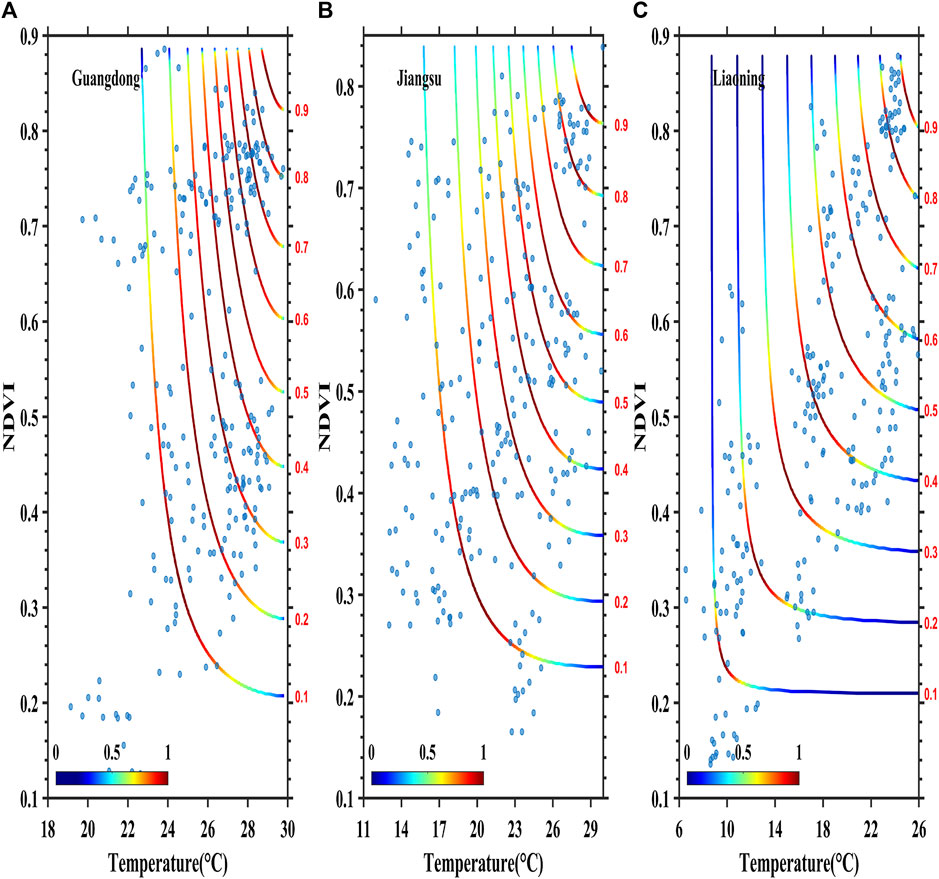
FIGURE 3. Analysis of joint copulas of mean temperature-normalized difference vegetation index (NDVI) in (A) Guangdong, (B) Jiangsu, and (C) Liaoning.
From the isogram, it could be seen that the greater the NDVI was when the mean temperature took a fixed value or the greater the mean temperature was when the NDVI was fixed, the greater the joint probability was. The joint probabilities of the mean temperatures and the NDVI in different intervals on the same isoline were also obviously different. The joint scenario occurrence probability of the mean temperature and the NDVI in the middle of the isoline was greater than that at either end of the isoline. It could be seen from Figure 3 that the joint probability of three scenarios of the minimum temperature and the minimum NDVI, the minimum temperature and the maximum NDVI, and the maximum temperature and the minimum NDVI was lower. However, the joint probability of the maximum temperature and the maximum NDVI was higher. When the monthly mean temperature in Guangdong was lower than 23°C, Jiangsu was lower than 17°C, and Liaoning is lower than 7°C, the probability of a lower NDVI was higher, which is not conducive to plant growth. However, when the mean temperature was between 27 and 30°C, 23 and 27°C, and 20 and 24°C, the probability of a larger NDVI (greater than 0.6) was higher and was greater than 0.7, which indicated that the vegetation in the three regions grew well.
Figure 4 showed isograms of the joint exceedance probabilities of mean temperature-NDVI in Guangdong, Jiangsu, and Liaoning. According to the joint exceedance probability graph, the joint exceedance probabilities when the mean temperature and NDVI were arbitrary values could be obtained. The figure showed different combinations of the mean temperatures and the NDVI which were both greater than or equal to a specific value when the joint exceedance probabilities are 0.1–0.9, respectively. The smaller the values of the mean temperature and the NDVI were, the greater the joint exceedance probability was and vice versa. This indicated that the occurrence probability that both the mean temperature and the NDVI exceeded a smaller value was greater than the occurrence probability that both exceeded a larger value.
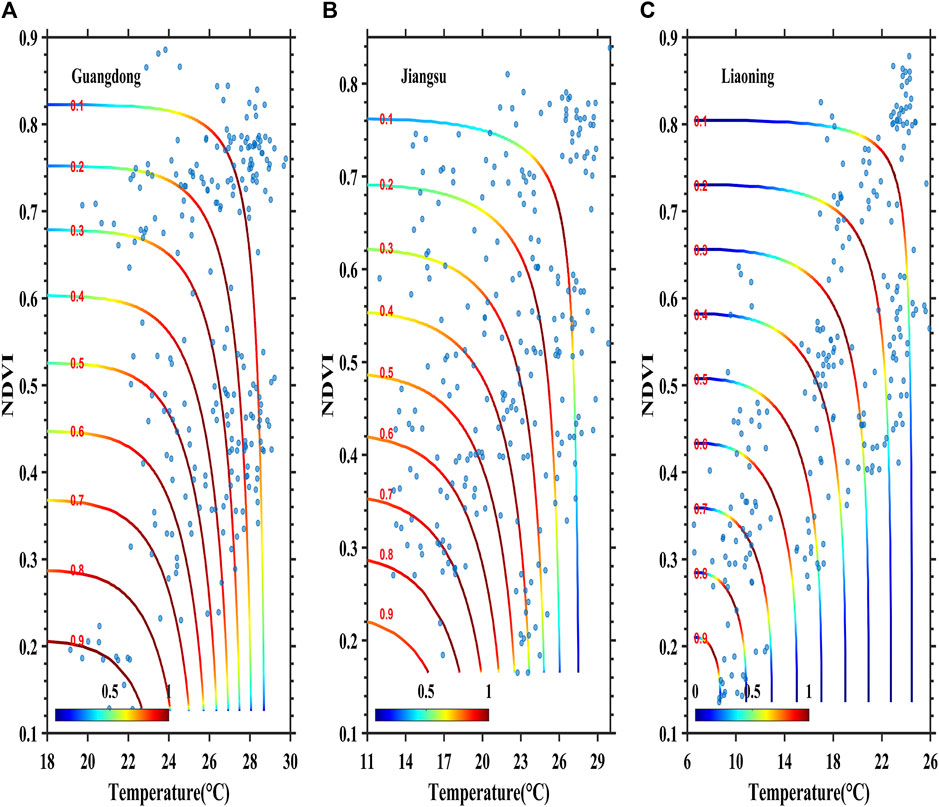
FIGURE 4. Analysis of survival copulas of mean temperature-normalized difference vegetation index (NDVI) in (A) Guangdong, (B) Jiangsu, and (C) Liaoning.
Figure 5 showed two-dimensional isolines for joint return periods of mean temperatures and NDVI in Guangdong, Jiangsu, and Liaoning. By using the joint return period diagram, the return period corresponding to the mean temperature or NDVI greater than or equal to a specific value could be calculated. Figure 5 reflected the combinations of mean temperatures or NDVI greater than or equal to a specific value when the return periods are 2, 5, 10, 25, and 50 years, respectively. The shorter the joint return period was, the larger the value range of the mean temperature and the NDVI was, which indicated that when the mean temperature was fixed, the probability of the NDVI having a shorter return period was higher. When the mean temperature was in a higher range like 25–30°C (Guangdong), 22–26°C (Jiangsu), and 17–22°C (Liaoning), the probability of the NDVI having the shorter return period is maximum. The values of the NDVI in the above temperature ranges were all greater than 0.5, stating that the occurrence frequency of excellent plant growth was the highest. The difference in heat conditions among the three regions led to a gradual decrease of the suitable growth temperature of plants from south to north.
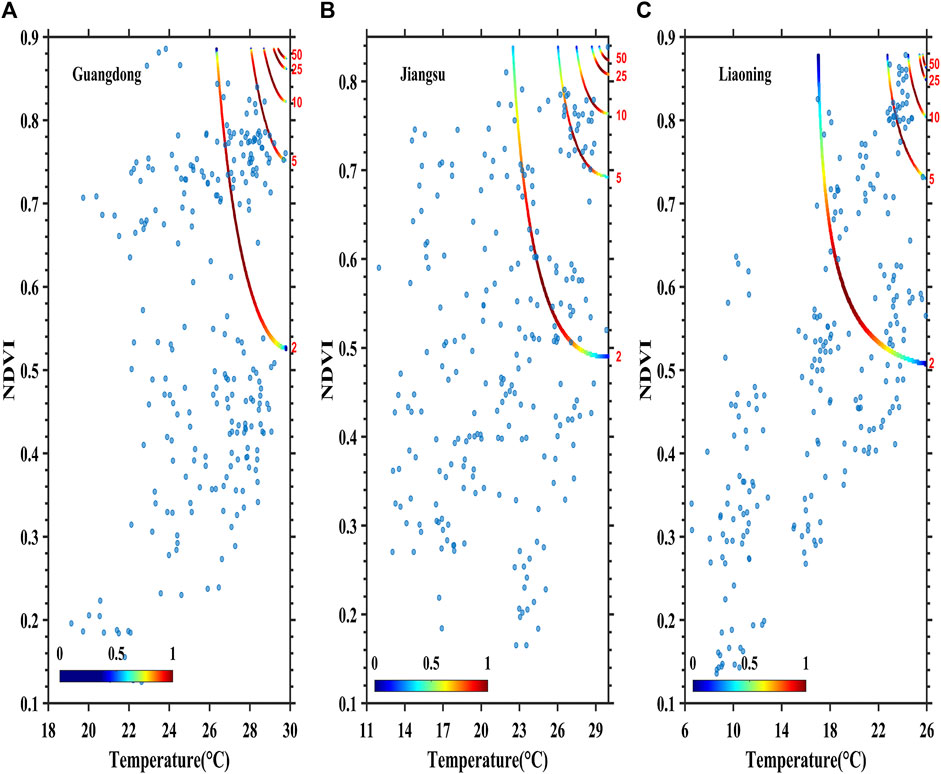
FIGURE 5. Joint copula return periods of mean temperature-normalized difference vegetation index (NDVI) in (A) Guangdong, (B) Jiangsu, and (C) Liaoning.
Figure 6 showed the co-occurrence return periods of the mean temperatures and NDVI in Guangdong, Jiangsu, and Liaoning. From the co-occurrence return period diagram, return periods where the mean temperature and NDVI were both greater than or equal to a specific value are known. Figure 6 demonstrated the combinations of the mean temperatures and NDVI which were both greater than or equal to a specific value when the return periods were 2, 5, 10, 25, and 50 years. For the case that the values of the mean temperature and the NDVI were fixed, their co-occurrence return period was obviously longer than the joint return period. For the co-occurrence return period, the longer the given return period was, the greater the values of the mean temperature and the NDVI were. Even when the values of the mean temperature and the NDVI were large enough, the co-occurrence return period exceeds 50 years. Accordingly, under the background of climate warming, the increase of the mean temperature in the historical period spurred the growth of vegetation in the three regions. However, with the further increase of the temperature in the future, it may not necessarily promote the growth of plants, or even the temperature exceeded a certain threshold, the probability of inhibiting the growth of plants was higher.
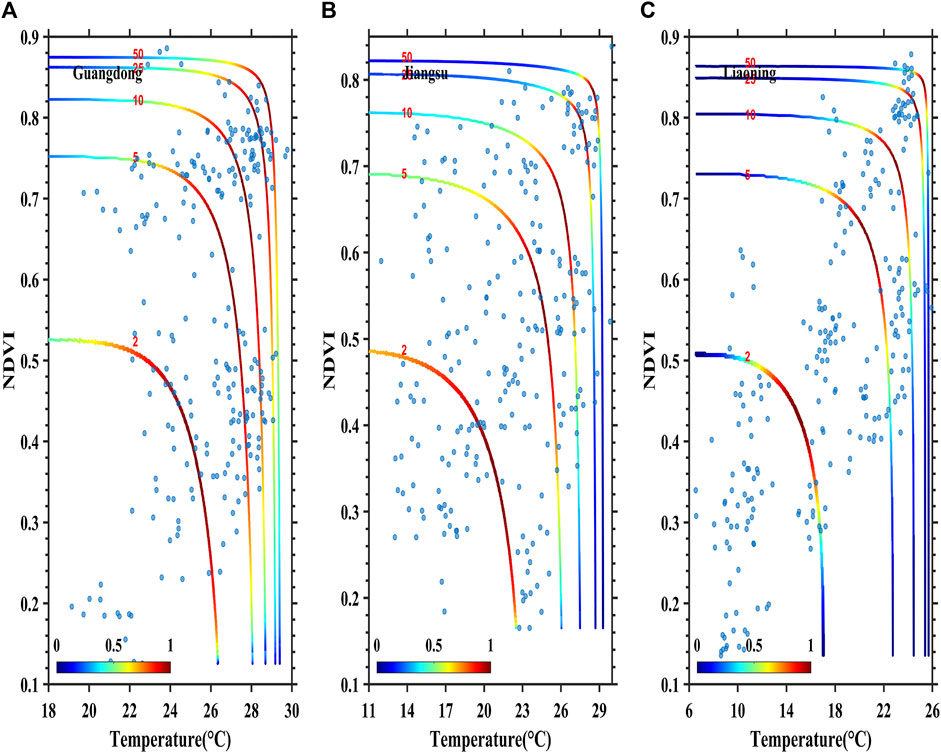
FIGURE 6. Survival copula return periods of mean temperature-normalized difference vegetation index (NDVI) in (A) Guangdong, (B) Jiangsu, and (C) Liaoning.
Figure 7 showed a dependency between monthly precipitations and NDVI in the growing season from 1982 to 2016 in Guangdong (Figure 7A), Jiangsu (Figure 7B), and Liaoning (Figure 7C), reflecting values of the precipitations and the NDVI when the joint probability was 0.1–0.9. The most prominent feature in the figure was an asymmetric and inclined dependency structure of monthly scale data. Guangdong’s probability isoline had the smallest inclination, and Liaoning’s probability isoline had the largest inclination, which reflected that the correlation between the precipitation and the NDVI gradually increases from south to north.
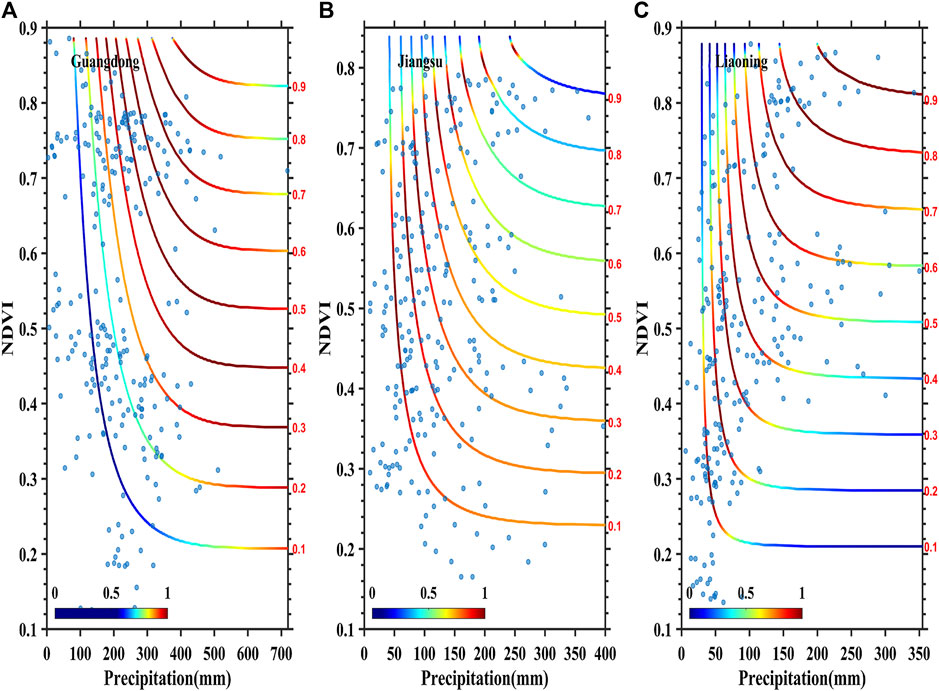
FIGURE 7. Joint copulas of precipitation-normalized difference vegetation index (NDVI) in (A) Guangdong, (B) Jiangsu, and (C) Liaoning.
The greater the NDVI was when the precipitation took a fixed value or the greater the precipitation was when the NDVI was fixed, the greater the joint probability was. The probability distribution function of the precipitation and the NDVI showed the characteristics that the upper tail was higher than the lower tail. That is, the precipitation was correlated with the upper tail on the NDVI sequence, and the lower tail was gradually independent, demonstrating that the minimum precipitation had little influence on the NDVI, while the maximum precipitation had significant influence on the NDVI. When the monthly precipitation was higher than a threshold: 200 mm (Guangdong), 110 mm (Jiangsu), and 60 mm (Liaoning), NDVI values in the three regions were all greater than 0.5, and each of the joint probabilities of the two was greater than 0.5, indicating that these precipitation intervals had a greater impact on the NDVI. When the monthly precipitations in Guangdong, Jiangsu, and Liaoning were in the ranges of 250–700, 160–400, and 110–350 mm, respectively, the probability of a higher NDVI (>0.6) in each region was more than 0.7. When the precipitations in the three regions were located in the above-mentioned intervals, the precipitations enhanced the plant growth, wherein on the probability isolines at 0.7, when the precipitations in the three regions were located in the intervals of 250–550, 150–170, and 110–280 mm, the occurrence number of well vegetation growth (NDVI> 0.6) was larger than that in other intervals.
Figure 8 showed isograms of the joint exceedance probabilities of precipitation-NDVI in Guangdong, Jiangsu, and Liaoning. It showed a variety of combinations of the precipitations and NDVI which were both greater than or equal to a specific value when the joint exceedance probabilities are 0.1–0.9, respectively. The smaller the values of the precipitation and the NDVI were, the greater the joint exceedance probability was and vice versa. This indicated that the occurrence probability that both the precipitation and the NDVI exceeded a smaller value was greater than the occurrence probability that both exceeded a larger value.
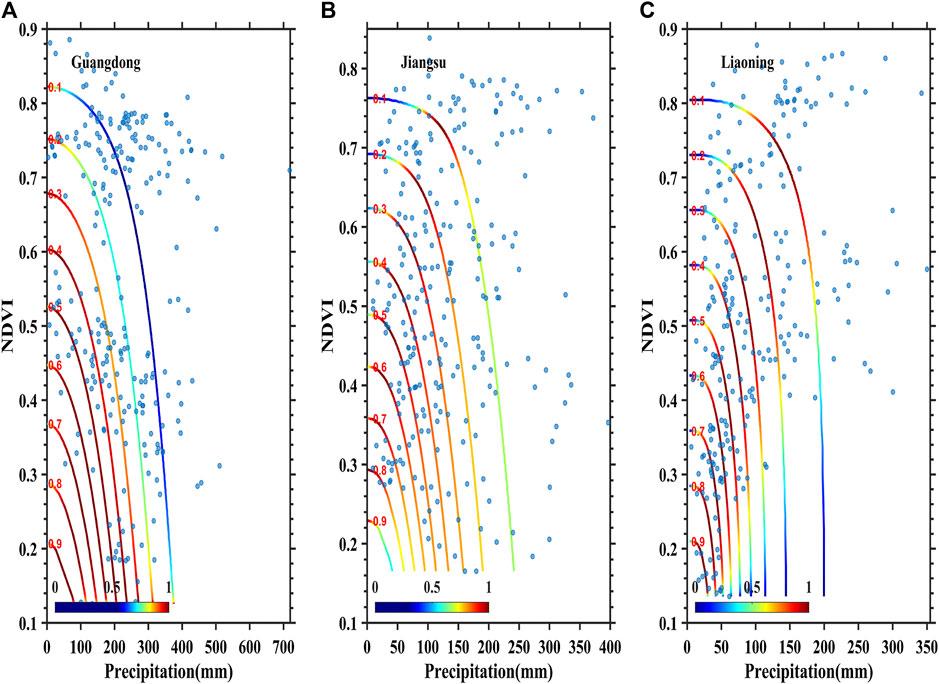
FIGURE 8. Survival copulas of precipitation-normalized difference vegetation index (NDVI) in Guangdong, Jiangsu, and Liaoning.
Figure 9 showed two-dimensional isolines for joint return periods of precipitations and NDVI in Guangdong, Jiangsu, and Liaoning. Figure 9 reflected the combinations of the precipitations or NDVI greater than or equal to a specific value when the return periods were 2, 5, 10, 25 and, 50 years, respectively. The shorter the joint return period was, the larger the value range of the precipitation and the NDVI was, which indicated that when the precipitation was fixed, the probability of the NDVI having a shorter return period was higher.
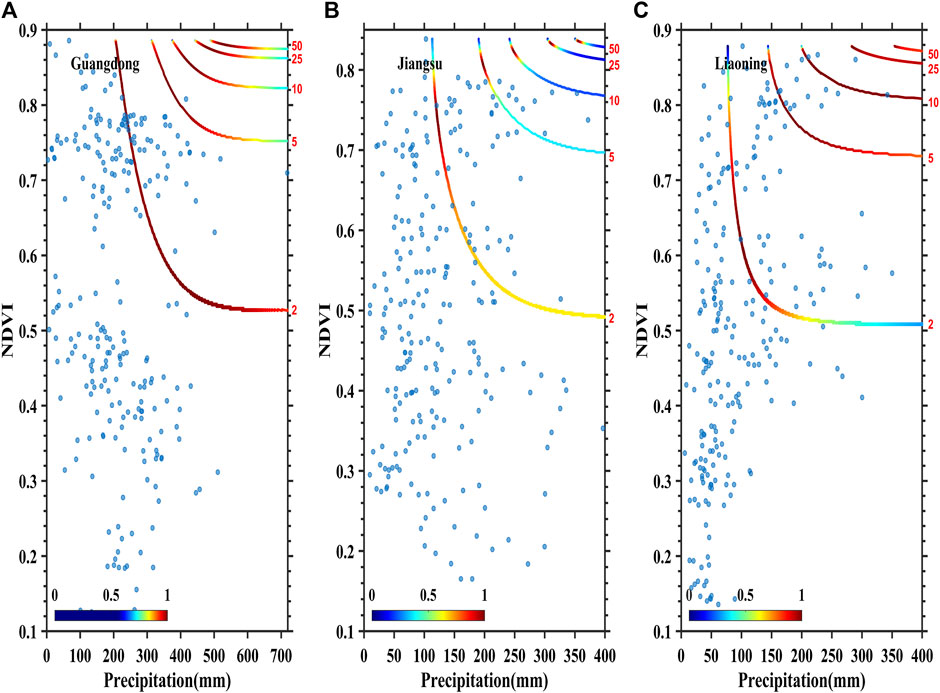
FIGURE 9. Joint copula return periods of precipitation-normalized difference vegetation index (NDVI) in (A) Guangdong, (B) Jiangsu, and (C) Liaoning.
Figure 10 showed the co-occurrence return periods of the precipitations and NDVI in Guangdong, Jiangsu, and Liaoning. Figure 10 demonstrated the combinations of the precipitations and NDVI which are both greater than or equal to a specific value when the return periods were 2, 5, 10, 25, and 50 years. Under the same combination, the co-occurrence return period of the precipitation and the NDVI was obviously longer than the joint return period. For the co-occurrence return period, the longer the given return period was, the greater the values of the precipitation and the NDVI were. Even when the values of the precipitation and the NDVI were large enough, the co-occurrence return period exceeded 50 years. Therefore, if the precipitation continued to increase, it may not necessarily promote the growth of plants. When the precipitation exceeded a certain threshold, it was more likely to inhibit the growth of the plants.
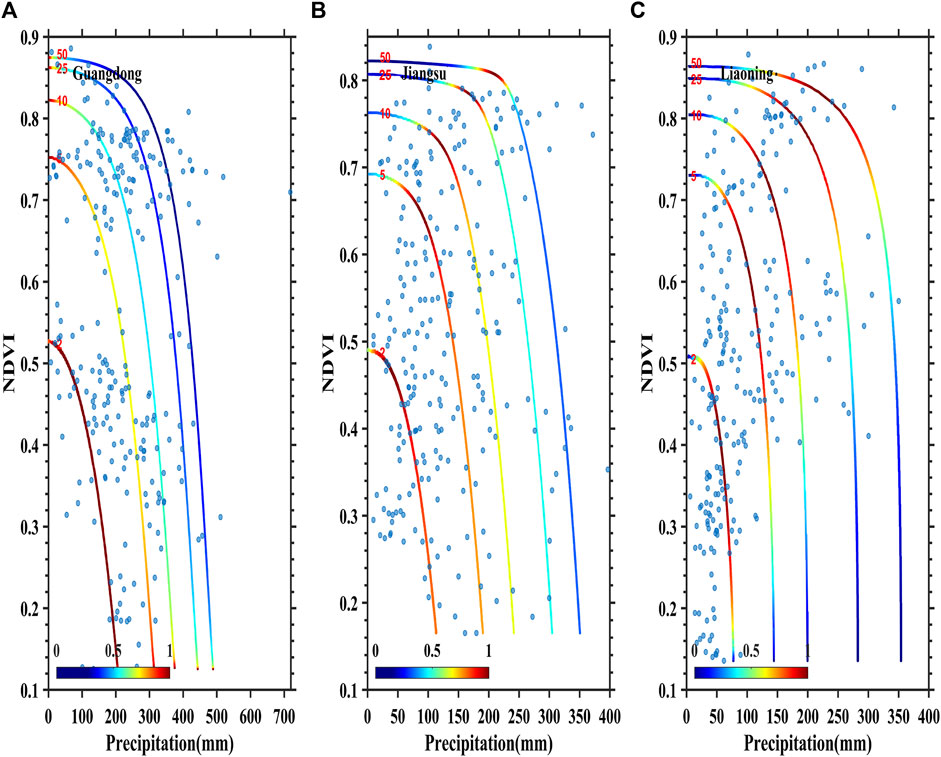
FIGURE 10. Survival copula return periods of precipitation-normalized difference vegetation index (NDVI) in (A) Guangdong, (B) Jiangsu, and (C) Liaoning.
Discussion
Dynamic Change of Normalized Difference Vegetation Index
The monthly NDVI in Guangdong, Jiangsu, and Liaoning showed an overall upward trend during the growing season from 1982 to 2016. This result was consistent with the research results of the NDVI change trends on different spatial scales such as global (Yang et al., 2019), Eurasia (Piao et al., 2011), China (Peng et al., 2011), and eastern China (Jiang et al., 2014). The change rates of the NDVI in the three regions showed a law of increasing from north to south. However, the NDVI experienced a huge jump around 1998, which may be related to the intensified warming and strong El Nino around 1998. Climate warming leads to an increase in the daily temperature range (Ma et al., 2019). Photosynthesis of plants increased with the rise of temperature in daytime, and respiration (consumption) of the plants decreased with the reduction of temperature at night, resulting in a higher net photosynthetic accumulation of the plants, which was conducive to the growth and development of vegetation and vice versa (Wen et al., 2018). Although the vegetation in Liaoning was generally on the rise, the rising rate was lower, which could be related to the gradual warming and drying of Liaoning. Guangdong and Jiangsu were relatively rich in water resources, and the evapotranspiration caused by temperature rise would take away excess water, which in turn promoted the growth of vegetation.
Response of Normalized Difference Vegetation Index to Climate Change
Compared with the correlation study of NDVI with mean temperature and precipitation on the annual scale, the response of the NDVI to the temperature and precipitation on the monthly scale could reveal the influence of hydrothermal changes on the NDVI more deeply (Pei et al., 2019; Guo et al., 2020). On the one hand, the annual-scale dependency between the NDVI and climate factors reflects the long-term change trend relationship between the two, which failed to “peel off” other factors, such as urbanization, land utilization/change, and solar radiation in the course of the year, which affect vegetation. On the other hand, the monthly scale time series removed seasonal signals, and to some extent, eliminated the interference of signals having seasonal variation characteristics like the temperature, precipitation, solar radiation and agricultural production, etc., on the research results. It was more scientific to explore the response mechanism of the NDVIs to the climate factors (Van Gelder et al., 2008). Therefore, this paper discussed the response characteristics of monthly scale NDVI to the temperature and precipitation.
Response of Normalized Difference Vegetation Index to Mean Temperature
The difference in latitudes among Guangdong, Jiangsu, and Liaoning caused unbalanced heat. The suitable growth temperature of plants in the three regions decreases from south to north. When the mean temperature was in an appropriate range, the sufficient heat and accelerated physiological activities of plants were bringing the plants on nicely, making the NDVI higher. When the mean temperature was in a lower range, insufficient heat would slow down the physiological activities of the plants, resulting in slower growth even stop and wither of the plants. When the temperature was in a higher range, evapotranspiration of trees was intensified by the increased temperature, which would lead to the excessive consumption of soil water and eventually affect the normal growth of vegetation (Kong et al., 2017; Zhang et al., 2019). It could be seen from Table 2 that there was a relatively obvious positive correlation between the mean temperatures and NDVI in the three regions; and the correlation intensity was Liaoning > Jiangsu > Guangdong; while the heat condition in the three regions was Liaoning < Jiangsu < Guangdong; and the demand of plant growth for heat: LiaoNing > JiangSu > Guangdong. The effect of the mean temperature on the plant growth in Liaoning was greater than that in either of Jiangsu and Guangdong, showing that the positive correlation between the mean temperature and the NDVI in Liaoning was higher than that in either of the other two regions.
Response of Normalized Difference Vegetation Index to Precipitation
Water conditions in Guangdong, Jiangsu, and Liaoning were also significantly different. The correlation coefficients in Table 2 reveal that monthly precipitation and NDVI in Jiangsu and Liaoning have obvious positive correlation, and the correlation in Liaoning was greater than that in Jiangsu; while there was an obvious negative correlation between the precipitation and the NDVI in Guangdong. Guangdong and Jiangsu were sufficient in water and higher in soil water content, and thus, generally avoids shortage of water during the plant growing season. Even if the precipitation was less, the inhibition effect on plant growth was weak, which was manifested in that the smaller precipitation and the NDVI were gradually independent of each other, and have a lower correlation. When the precipitation was excessive, the plant roots carried out oxygen-free respiration, which directly adversely affected the absorption efficiency of nutrients and water of vegetation, and inhibited the growth and development of vegetation. Meanwhile, the increased precipitation reduced light, bringing an adverse influence on the photosynthesis of vegetation, and stunting the growth of vegetation (Ye et al., 2016). Here, a negative correlation existed between the precipitations and the NDVI. Liaoning was relatively short in water resources and was lower in the soil water content, so that the precipitation increase was beneficial to the growth of vegetation.
Climate warming was asymmetric in diurnal variations, which had a significant impact on vegetation growth (Peng et al., 2013; Du et al., 2019). The physiological effects of day-and-night temperature on plants were different, and the responses of the plants to round-the-clock asymmetric temperature rise would also be different. Therefore, it is necessary to further study the effect of asymmetric circadian warming on vegetation and the impact of continuous precipitation events on the NDVI. In addition, the precipitation events also include precipitation intensity, precipitation days, precipitation frequency, etc. In order to have a deeper and clearer understanding of the response mechanism of the NDVI to precipitation changes, in-depth research on the NDVI and more precipitation events is needed.
Conclusion
This paper uses the Copula function theory to discuss the response characteristics of the NDVI in typical climate zones along the east coastal areas of China to monthly mean temperature and monthly precipitation. The main conclusions are as follows.
(1) The mean temperatures in Guangdong, Jiangsu, and Liaoning all showed a rising trend, with a rising rate of Jiangsu > Liaoning > Guangdong. The precipitations in Guangdong and Jiangsu showed an increasing trend, with an increasing rate of Guangzhou > Jiangsu; and the precipitation in Liaoning showed a significant downward trend. The NDVI of the three regions were all increased significantly in an ascending order of Guangdong > Jiangsu > Liaoning.
(2) The joint probability distribution functions of the monthly mean temperatures and the NDVI as well as the monthly mean precipitations and the NDVI in Guangdong, Jiangsu, and Liaoning all showed the characteristics that the upper tail was higher than the lower tail. That is, the temperature and precipitation were correlated with the upper tail of the NDVI, and the lower tail was gradually independent, demonstrating that the minimum temperature and precipitation had a little influence on the NDVI, while the maximum temperature and precipitation had a significant influence on the NDVI.
(3) The shorter the return period was, the wider the ranges of the climate factor and the NDVI were, showing that when the climate factor was constant, the probability of the NDVI having a shorter return period was higher. The greater the climate factor was, the longer the return period was, indicating that the probability of plant growth inhibition was higher when the climate factor exceeded a certain threshold.
(4) The hydrothermal combination conditions required for plant growth in different regions were significantly different. Plant growth had an optimal temperature interval and an optimal precipitation interval, and would be inhibited above or below these thresholds.
(5) The subsystem composed of vegetation and climate elements had the characteristics of complexity and nonlinearity. The Copula function is utilized to quantitatively explain the relationship between different hydrothermal conditions and the NDVI through the probabilities, so that its uncertainty was studied, and the return period was calculated.
Vegetation was affected by both climate change and human activities. De-seasonal changes may eliminate signals with seasonal characteristics such as temperature, precipitation, and regular agricultural production to some extent, but the impact of the human activities on the NDVI had not been separated and quantified. In addition, the low spatial resolution of NDVI data may also affect the response degree of climate elements. Further research will be devoted to the construction of high-resolution vegetation index data sets, and the attribution of regional vegetation cover changes would be further explored, concentrating on quantitative research of influencing factors of the vegetation cover changes. It was worth noting that the rate of global warming was uneven on the spatial scale and asymmetric in time. This asymmetrical diurnal warming trend would have a major impact on the growth of global vegetation. Therefore, further studies are necessary to determine the effects of asymmetric day-and-night warming on natural ecosystems.
Data Availability Statement
The meteorological datasets analyzed for this study can be found in the China Meteorological Administration (https://data.cma.cn/site/index.html). The GIMMS NDVI 3g.v1 (the latest updated version of the third generation Global Inventory Monitoring and Modeling System) datasets for this study can be found at https://ecocast.arc.nasa.gov/data/pub/gimms/3g.v1/ as nc4 files. The MODIS (Moderate Resolution Imaging Spectroradiometer) NDVI dataset for this study can be found at https://ladsweb.modaps.eosdis.nasa.gov/.
Author Contributions
GH led the conception and design of the paper. XZ and RZ led the literature review. GH, ZL, and JH led the description and analysis of the case studies. LZ provided funding acquisition for the article. WS and XL led the review and editing of the paper.
Funding
This research was supported by the National Key Research and Development Project under Grant 2018YFC1506900 (2018YFC1506904), under the “The Pearl River Talent Recruitment Program of Guangdong” (2019ZT08G669), in part by the National Science Foundation of China under Grant Nos. 41875027 and 4166144039, in part by the Key Laboratory of South China Sea Meteorological Disaster Prevention and Mitigation of Hainan Province (Grant Nos. SCSF201804 and 419QN330), in part by the Research Program for Key Laboratory of Meteorology and Ecological Environment of Hebei Province (Z201603Z), and in part by the Research Program for science and technology project of Hebei Province (18964201H).
Conflict of Interest
The authors declare that the research was conducted in the absence of any commercial or financial relationships that could be construed as a potential conflict of interest.
Acknowledgments
The authors gratefully thank the Nanjing Meteorological Bureau and Nanjing Institute of Environmental Science, Ministry of Environmental Protection, for providing the facilities during this research work and for supporting the related research.
References
Abdi, A., Hassanzadeh, Y., Talatahari, S., Fakheri-Fard, A., and Mirabbasi, R. (2017). Parameter estimation of copula functions using an optimization-based method. Theor. Appl. Climatol. 129, 21–32. doi:10.1007/s00704-016-1757-2
Chen, H., and Sun, J. (2015). Changes in drought characteristics over China using the standardized precipitation evapotranspiration index. J. Clim. 28, 5430–5447. doi:10.1175/jcli-d-14-00707.1
Clayton, D. G. (1978). A model for association in bivariate life tables and its application in epidemiological studies of familial tendency in chronic disease incidence. Biometrika 65, 141–151. doi:10.1093/biomet/65.1.141
Dodangeh, E., Shahedi, K., Shiau, J.-T., and Mirakbari, M. (2017). Spatial hydrological drought characteristics in Karkheh River basin, southwest Iran using copulas. J. Earth Syst. Sci. 126, 80. doi:10.1007/s12040-017-0863-6
Du, Z., Zhao, J., Pan, H., Wu, Z., and Zhang, H. (2019). Responses of vegetation activity to the daytime and nighttime warming in Northwest China. Environ. Monit. Assess. 191, 721. doi:10.1007/s10661-019-7855-8
Dusenge, M. E., Duarte, A. G., and Way, D. A. (2019). Plant carbon metabolism and climate change: elevated CO2 and temperature impacts on photosynthesis, photorespiration and respiration. New Phytol. 221, 32–49. doi:10.1111/nph.15283
Duveiller, G., Hooker, J., and Cescatti, A. (2018). The mark of vegetation change on Earth’s surface energy balance. Nat. Commun. 9, 679. doi:10.1038/s41467-017-02810-8
Fensholt, R., and Proud, S. R. (2012). Evaluation of Earth observation based global long term vegetation trends-comparing GIMMS and MODIS global NDVI time series. Remote Sens. Environ. 119, 131–147. doi:10.1016/j.rse.2011.12.015
Genest, C., and Favre, A.-C. (2007). Everything you always wanted to know about copula modeling but were afraid to ask. J. Hydrol. Eng. 12, 347–368. doi:10.1061/(asce)1084-0699(2007)12:4(347)
Genest, C., and Rivest, L.-P. (1993). Statistical inference procedures for bivariate archimedean copulas. J. Am. Stat. Assoc. 88, 1034–1043. doi:10.1080/01621459.1993.10476372
Guo, L., Zuo, L., Gao, J., Jiang, Y., Zhang, Y., Ma, S., et al. (2020). Revealing the fingerprint of climate change in interannual NDVI variability among biomes in inner Mongolia, China. Remote Sens. 12, 1332. doi:10.3390/rs12081332
He, G., Zhao, Y., Wang, J., Wang, Q., and Zhu, Y. (2018). Impact of large-scale vegetation restoration project on summer land surface temperature on the Loess Plateau, China. J. Arid Land 10, 892–904. doi:10.1007/s40333-018-0105-z
Holben, B. N. (1986). Characteristics of maximum-value composite images from temporal AVHRR data. Int. J. Remote Sens. 7, 1417–1434. doi:10.1080/01431168608948945
Huang, M., Piao, S., Zeng, Z., Peng, S., Ciais, P., Cheng, L., et al. (2016). Seasonal responses of terrestrial ecosystem water-use efficiency to climate change. Global Change Biol. 22, 2165–2177. doi:10.1111/gcb.13180
Huang, M., Xu, Y., Longo, M., Keller, M., Knox, R., Koven, C., et al. (2019). Assessing impacts of selective logging on water, energy, and carbon budgets and ecosystem dynamics in amazon forests using the functionally assembled terrestrial ecosystem simulator. Biogeosci. Discuss. 2019, 1–46. doi:10.5194/bg-2019-129
Huete, A. (2016). Vegetation’s responses to climate variability. Nature 531, 181–182. doi:10.1038/nature17301
Huryna, H., and Pokorný, J. (2016). The role of water and vegetation in the distribution of solar energy and local climate: a review. Folia Geobot. 51, 191–208. doi:10.1007/s12224-016-9261-0
Jiang, D., Zhang, H., Zhang, Y., and Wang, K. (2014). Interannual variability and correlation of vegetation cover and precipitation in Eastern China. Theor. Appl. Climatol. 118, 93–105. doi:10.1007/s00704-013-1054-2
Jin, Z., Liang, W., Yang, Y., Zhang, W., Yan, J., Chen, X., et al. (2017). Separating vegetation greening and climate change controls on evapotranspiration trend over the loess plateau. Sci. Rep. 7, 8191. doi:10.1038/s41598-017-08477-x
Kong, D., Zhang, Q., Singh, V. P., and Shi, P. (2017). Seasonal vegetation response to climate change in the Northern Hemisphere (1982-2013). Global Planet. Change 148, 1–8. doi:10.1016/j.gloplacha.2016.10.020
Kundu, A., Denis, D. M., Patel, N. R., and Dutta, D. (2018). "Long-term trend of vegetation in bundelkhand region (India): an assessment through SPOT-VGT NDVI datasets," in Climate change, extreme events and disaster risk reduction: towards sustainable development goals. Editors S. Mal, R. B. Singh, and C. Huggel (Cham, Switzerland: Springer International Publishing), 89–99.
Lee, T. (2018). Multisite stochastic simulation of daily precipitation from copula modeling with a gamma marginal distribution. Theor. Appl. Climatol. 132, 1089–1098. doi:10.1007/s00704-017-2147-0
Li, C., Singh, V. P., and Mishra, A. K. (2013). A bivariate mixed distribution with a heavy-tailed component and its application to single-site daily rainfall simulation. Water Resour. Res. 49, 767–789. doi:10.1002/wrcr.20063
Li, D., Gui, Y., Li, Y., and Xiong, L. (2018). A method for constructing asymmetric pair-copula and its application. Commun. Stat. Theor. Methods 47, 4202–4214. doi:10.1080/03610926.2017.1371755
Li, S., Liang, W., and Fu, B., Lü, Y., Fu, S., Wang, S., et al. (2016). Vegetation changes in recent large-scale ecological restoration projects and subsequent impact on water resources in China's Loess Plateau. Sci. Total Environ. 569-570, 1032–1039. doi:10.1016/j.scitotenv.2016.06.141
Li, Z., Wu, W., Liu, X., Fath, B. D., Sun, H., Liu, X., et al. (2017). Land use/cover change and regional climate change in an arid grassland ecosystem of Inner Mongolia, China. Ecol. Model. 353, 86–94. doi:10.1016/j.ecolmodel.2016.07.019
Liu, R. (2017). Compositing the minimum NDVI for MODIS data. IEEE Trans. Geosci. Remote Sens. 55, 1396–1406. doi:10.1109/tgrs.2016.2623746
Ma, L., Qin, F., Wang, H., Qin, Y., and Xia, H. (2019). Asymmetric seasonal daytime and nighttime warming and its effects on vegetation in the Loess Plateau. PloS One 14, e0218480. doi:10.1371/journal.pone.0218480
Papalexiou, S. M., and Serinaldi, F. (2020). Random fields simplified: preserving marginal distributions, correlations, and intermittency, with applications from rainfall to humidity. Water Resour. Res. 56, e2019WR026331. doi:10.1029/2019wr026331
Pei, Z., Fang, S., Yang, W., Wang, L., Wu, M., Zhang, Q., et al. (2019). The relationship between NDVI and climate factors at different monthly time scales: a case study of grasslands in inner Mongolia, China (1982–2015). Sustainability 11, 7243. doi:10.3390/su11247243
Peng, S., Chen, A., Xu, L., Cao, C., Fang, J., Myneni, R. B., et al. (2011). Recent change of vegetation growth trend in China. Environ. Res. Lett. 6, 044027. doi:10.1088/1748-9326/6/4/044027
Peng, S., Piao, S., Ciais, P., Myneni, R. B., Chen, A., Chevallier, F., et al. (2013). Asymmetric effects of daytime and night-time warming on Northern Hemisphere vegetation. Nature 501, 88–92. doi:10.1038/nature12434
Pho, K. H., Ly, S., Ly, S., and Lukusa, T. M. (2019). Comparison among Akaike information criterion, Bayesian information criterion and Vuong's test in model selection: a case study of violated speed regulation in Taiwan. J. Adv. Eng. Comput. 3, 293–303. doi:10.25073/jaec.201931.220
Piao, S., Wang, X., Ciais, P., Zhu, B., Wang, T., and Liu, J. (2011). Changes in satellite-derived vegetation growth trend in temperate and boreal Eurasia from 1982 to 2006. Global Change Biol. 17, 3228–3239. doi:10.1111/j.1365-2486.2011.02419.x
Quan, Q., Tian, D., Luo, Y., Zhang, F., Crowther, T. W., Zhu, K., et al. (2019). Water scaling of ecosystem carbon cycle feedback to climate warming. Sci. Adv. 5, eaav1131. doi:10.1126/sciadv.aav1131
Ramos-Cordoba, E., Salvador, P., and Matito, E. (2016). Separation of dynamic and nondynamic correlation. Phys. Chem. Chem. Phys. 18, 24015–24023. doi:10.1039/c6cp03072f
Sadegh, M., Moftakhari, H., Gupta, H. V., Ragno, E., Mazdiyasni, O., Sanders, B., et al. (2018). Multihazard scenarios for analysis of compound extreme events. Geophys. Res. Lett. 45, 5470–5480. doi:10.1029/2018gl077317
Sadegh, M., Ragno, E., and Aghakouchak, A. (2017). Multivariate copula analysis toolbox (MvCAT): describing dependence and underlying uncertainty using a bayesian framework. Water Resour. Res. 53, 5166–5183. doi:10.1002/2016wr020242
Salvadori, G., and De Michele, C. (2007). On the use of copulas in hydrology: theory and practice. J. Hydrol. Eng. 12, 369–380. doi:10.1061/(asce)1084-0699(2007)12:4(369)
Seidl, R., Thom, D., Kautz, M., Martin-Benito, D., Peltoniemi, M., Vacchiano, G., et al. (2017). Forest disturbances under climate change. Nat. Clim. Change 7, 395–402. doi:10.1038/nclimate3303
Seong, N. H., Jung, D., Kim, J., and Han, K. S. (2020). Evaluation of NDVI estimation considering atmospheric and BRDF correction through himawari-8/AHI. Asia-Pac. J. Atmos. Sci. 56, 265–274. doi:10.1007/s13143-019-00167-0
Shiau, J. T. (2006). Fitting drought duration and severity with two-dimensional copulas. Water Resour. Manag. 20, 795–815. doi:10.1007/s11269-005-9008-9
Singh, V. P., and Zhang, L. (2018). Copula–entropy theory for multivariate stochastic modeling in water engineering. Geosci. Lett. 5, 6. doi:10.1186/s40562-018-0105-z
Sippel, S., Reichstein, M., Ma, X., Mahecha, M. D., Lange, H., Flach, M., et al. (2018). Drought, heat, and the carbon cycle: a review. Curr. Clim. Change Rep. 4, 266–286. doi:10.1007/s40641-018-0103-4
Sraj, M., Bezak, N., and Brilly, M. (2015). Bivariate flood frequency analysis using the copula function: a case study of the Litija station on the Sava River. Hydrol. Process. 29, 225–238. doi:10.1002/hyp.10145
Van Gelder, P. H. A. J. M., Mai, C. V., Wang, W., Shams, G., Rajabalinejad, M., and Burgmeijer, M. (2008). Data management of extreme marine and coastal hydro-meteorological events. J. Hydraul. Res. 46, 191–210. doi:10.1080/00221686.2008.9521954
Wan, J. Z., Wang, C. J., Qu, H., Liu, R., and Zhang, Z. X. (2018). Vulnerability of forest vegetation to anthropogenic climate change in China. Sci. Total Environ. 621, 1633–1641. doi:10.1016/j.scitotenv.2017.10.065
Wen, Y., Liu, X., and Du, G. (2018). Nonuniform time-lag effects of asymmetric warming on net primary productivity across global terrestrial biomes. Earth Interact. 22, 1–26. doi:10.1175/ei-d-17-0032.1
Wen, Z., Wu, S., Chen, J., and Lü, M. (2017). NDVI indicated long-term interannual changes in vegetation activities and their responses to climatic and anthropogenic factors in the Three Gorges Reservoir Region, China. Sci. Total Environ. 574, 947–959. doi:10.1016/j.scitotenv.2016.09.049
Xu, Y., Yang, J., and Chen, Y. (2016). NDVI-based vegetation responses to climate change in an arid area of China. Theor. Appl. Climatol. 126, 213–222. doi:10.1007/s00704-015-1572-1
Yang, Y., Wang, S., Bai, X., Tan, Q., Li, Q., Wu, L., et al. (2019). Factors affecting long-term trends in global NDVI. Forests 10, 372. doi:10.3390/f10050372
Ye, J.-S., Reynolds, J. F., Maestre, F. T., and Li, F.-M. (2016). Hydrological and ecological responses of ecosystems to extreme precipitation regimes: a test of empirical-based hypotheses with an ecosystem model. Perspect. Plant Ecol. Evol. Syst. 22, 36–46. doi:10.1016/j.ppees.2016.08.001
Zandalinas, S. I., Mittler, R., Balfagón, D., Arbona, V., and Gómez-Cadenas, A. (2018). Plant adaptations to the combination of drought and high temperatures. Physiol. Plant. 162, 2–12. doi:10.1111/ppl.12540
Zewdie, W., Csaplovics, E., and Inostroza, L. (2017). Monitoring ecosystem dynamics in northwestern Ethiopia using NDVI and climate variables to assess long term trends in dryland vegetation variability. Appl. Geogr. 79, 167–178. doi:10.1016/j.apgeog.2016.12.019
Keywords: temperature, precipitation, normalized difference vegetation index, copula function, joint probability distribution
Citation: He G, Zhen X, Li Z, Shen W, Han J, Zhang L, Li X and Zhang R (2020) Influence of Variations of Hydrothermal Conditions on Normalized Difference Vegetation Index in Typical Temperature Zones Along the East Coast of China. Front. Earth Sci. 8:574101. doi: 10.3389/feart.2020.574101
Received: 18 June 2020; Accepted: 19 August 2020;
Published: 11 September 2020.
Edited by:
Lei Zhang, University of Colorado, Boulder, United StatesReviewed by:
Jie Feng, University of Oklahoma, United StatesHongli Wang, National Oceanic and Atmospheric Administration (NOAA), United States
Copyright © 2020 He, Li, Zhen, Shen, Han, Zhang, Li and Zhang. This is an open-access article distributed under the terms of the Creative Commons Attribution License (CC BY). The use, distribution or reproduction in other forums is permitted, provided the original author(s) and the copyright owner(s) are credited and that the original publication in this journal is cited, in accordance with accepted academic practice. No use, distribution or reproduction is permitted which does not comply with these terms.
*Correspondence: Zhongliang Li, ZG9jdG9ybGl6bEAxMjYuY29t
 Guangxin He1,2,3,4