
94% of researchers rate our articles as excellent or good
Learn more about the work of our research integrity team to safeguard the quality of each article we publish.
Find out more
TECHNOLOGY AND CODE article
Front. Earth Sci. , 09 October 2020
Sec. Solid Earth Geophysics
Volume 8 - 2020 | https://doi.org/10.3389/feart.2020.573396
This article is part of the Research Topic Geoscientific Visualization in Solid Earth Geophysics View all 9 articles
 D. Carbone1*
 L. Antoni-Micollier2
 G. Hammond3
 E. de Zeeuw - van Dalfsen4
 E. Rivalta5
 C. Bonadonna6
 A. Messina7J. Lautier-Gaud2
 K. Toland3M. Koymans4
 K. Anastasiou3S. Bramsiepe3
 F. Cannavò1D. Contrafatto1
 C. Frischknecht6
 F. Greco1
 G. Marocco8
 R. Middlemiss3
 V. Ménoret2
 A. Noack3
 L. Passarelli6
 D. Paul8
 A. Prasad3G. Siligato1P. Vermeulen2
Knowledge of the spatio-temporal changes in the characteristics and distribution of subsurface fluids is key to properly addressing important societal issues, including: sustainable management of energy resources (e.g., hydrocarbons and geothermal energy), management of water resources, and assessment of hazard (e.g., volcanic eruptions). Gravimetry is highly attractive because it can detect changes in subsurface mass, thus providing a window into processes that involve deep fluids. However, high cost and operating features associated with current instrumentation seriously limits the practical field use of this geophysical method. The NEWTON-g project proposes a radical change of paradigm for gravimetry through the development of a field-compatible measuring system (the gravity imager), able to real-time monitor the evolution of the subsurface mass changes. This system includes an array of low-costs microelectromechanical systems-based relative gravimeters, anchored on an absolute quantum gravimeter. It will provide imaging of gravity changes, associated with variations in subsurface fluid properties, with unparalleled spatio-temporal resolution. During the final ∼2 years of NEWTON-g, the gravity imager will be field tested in the summit of Mt. Etna volcano (Italy), where frequent gravity fluctuations, easy access to the active structures and the presence of a multiparameter monitoring system (including traditional gravimeters) ensure an excellent natural laboratory for testing the new tools. Insights from the gravity imager will be used to i) improve our knowledge of the cause-effect relationships between volcanic processes and gravity changes observable at the surface and ii) develop strategies to best incorporate the gravity data into hazards assessments and mitigation plans. A successful implementation of NEWTON-g will open new doors for geophysical exploration.
The dynamics of subsurface fluids, like water, hydrocarbons, and magma, is critically important for both resource management and risk reduction. For example, measurement of subsurface water level is important for developing usage plans and monitoring resource health; the ability to detect mass changes induced by the movement of magma batches is of utmost importance for risk management. Gravity measurements can indicate subsurface mass changes and can thus detect variations in the physical state or migration of subsurface fluids over time, even in the absence of other direct (e.g., sampling by drilling) or indirect (e.g., ground deformation) observations.
Applications of gravity monitoring to subsurface fluid characterization are diverse; they include tracking groundwater mass changes and assessing changes due to oil and gas production, CO2 sequestration, and geothermal resource characterization (e.g., Chapman et al., 2008; Gasperikova and Hoversten, 2008; Sugihara and Ishido, 2008; Kennedy et al., 2014; Hinderer et al., 2015a; Van Camp et al., 2016). Operational gravity monitoring also offers a particularly important benefit to the field of volcanology by affording a means of identifying subsurface processes that are otherwise inaccessible. For instance, both the intrusion of new magma and gas exsolution/bubble growth within an existing magma chamber induce a pressure/volume increase, leading to similar patterns of seismicity and ground deformation. Nevertheless, the two processes may lead to very different types of eruptive activity. The key factor to discriminate between these processes is density, which can be determined when gravity and deformation data are collected in tandem. Without this knowledge, the mechanism of unrest at a given volcano may not be known. Another question that may have to be addressed is the following: is magma driving changes observed at the surface, or are hydrothermally heated waters the cause? The answer to this question has vastly different implications for volcanic hazards assessment. Battaglia et al. (1999) used gravity and deformation data to determine that seismicity and surface uplift at Long Valley caldera in California were driven by accumulation of magma, and not water—information that was vital to the development of plans for monitoring and responding to future activity in the region. Under some circumstances, density (mass) changes may represent the only parameter that can be used to identify subsurface magmatic processes, for example, when rising magma fills pre-existing open space (networks of fractures), which would cause a gravity increase but may not be associated with any deformation or seismicity (e.g., Rymer et al., 1993; Bagnardi et al., 2014).
Given the unique insights into subsurface fluids provided by gravity, the technique has exceptional utility for characterizing the hazard potential at a given volcano. Incorporation of gravity data into hazards assessments and mitigation plans can provide critical short-term warning of impending changes in the state of activity.
Despite the above, gravimetry is currently underexploited. Indeed, while time-lapse measurements have been accomplished at a number of sites and provided high quality results, especially when different types of gravimeters were simultaneously employed (hybrid gravimetry; Hinderer et al., 2016), continuous gravity measurements have been rarely performed, owing to the fact that the available instruments are not well suited for continuous measurements under harsh field conditions. In addition, the high cost of available gravimeters limits deployment to, at most, a few sensors in a given area and the achievable spatial resolution is not sufficient to assess changes over broad areas that may be subject to resource development or magmatic activity.
The NEWTON-g project targets a technological breakthrough and proposes a change of paradigm by developing a new gravity measurement system, the gravity imager, that, once demonstrated, could be adopted by researchers and monitoring agencies in charge of studying subsurface fluid characteristics. The prototype of gravity imager will be field tested at Mt. Etna volcano and specific studies will be accomplished to optimize its performance and understand how the new information may be incorporated into early warning systems, hazard reporting and crisis management plans.
In the following sections we present:
‐ the background and broad objectives of NEWTON-g (The NEWTON-g Project).
‐ an insight into the new measurement system under development and plans for the field test at Mt. Etna volcano (The NEWTON-g Gravity Imager).
‐ the plans for utilization of NEWTON-g data to both increase the knowledge of volcano-related gravity change and define new risk mitigation strategies (Forward Modeling of Volcano Processes and Potential for Risk Mitigation).
‐ a discussion on the implications of achieving the objectives of the project (Summary and Conclusive Remarks).
The magnitude of measurable time-varying gravity changes due to volcanic activity is between a few and a few hundred µGal (1 µGal = 10−8 m s−2)—between one part in 106 and one part in 108 of the standard gravity on Earth (g = 9.8 m s−2). The high-precision gravimeters used to detect such small signals come in two varieties: relative and absolute (Figure 1). Relative gravimeters measure spatial differences in the gravity field between pairs of stations, or temporal differences at a single point with respect to the gravity value at an arbitrary starting time. Conversely, absolute gravimeters measure the actual value of the gravity acceleration at the observation point (Torge, 1989). Spring-based relative gravimeters are the most widely used for geophysical applications. They measure the change in the equilibrium position of a proof mass suspended from a spring, resulting from a change in the gravity field (Nabighian et al., 2005). Superconducting gravimeters (SGs; Hinderer et al., 2015b) offer an alternative to spring-based instruments, although they still provide relative measurements and can only be used for continuous measurements at a given site, since they are difficult to transport and setup. Instead of a mechanical spring, SGs exploit the magnetic levitation of a superconducting sphere in a field of superconducting persistent coils. SGs provide much better quality data than spring instruments (Carbone et al., 2019), but they have high power requirements and occupy a large physical footprint; therefore, they are not well suited for field deployments.
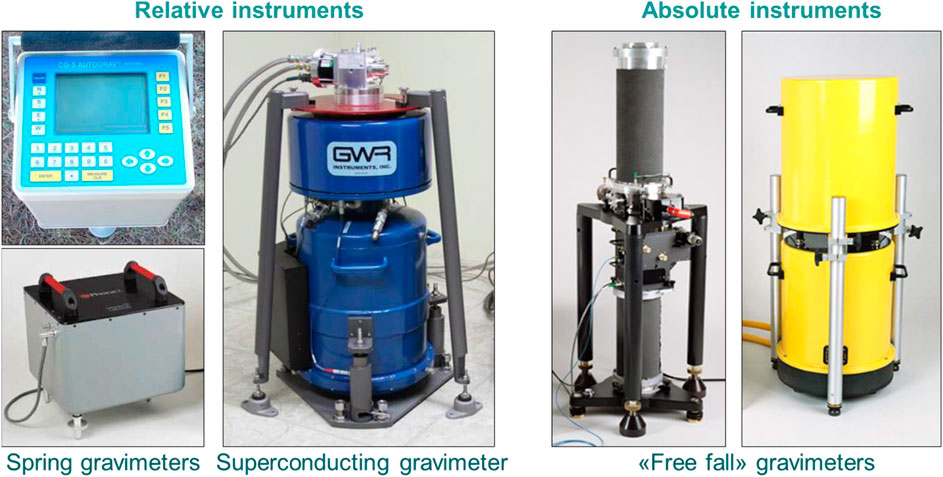
FIGURE 1. Some land gravimeters currently available on the market. On the left, relative gravimeters of the spring and superconducting type. On the right, free fall absolute gravimeters.
State of the art absolute gravimeters exploit the free-fall of macroscopic test masses. Transportable free-fall absolute gravimeters (FFAGs) employ a laser interferometer to precisely monitor the free-fall trajectory of the test mass. FFAGs are, in general, not well-suited for field use in harsh conditions, because of their large size and high power requirement. The only exception is the A-10 by Micro-g/LaCoste, which is optimized for fast data acquisition under field conditions, at the cost of worse accuracy and precision. No standard FFAG can record gravity data continuously for extended intervals (Van Camp et al., 2017). Recently, a new generation of absolute quantum gravimeters (AQGs) has been developed, which now shows to meet the state of the art in terms of measurement performances (Ménoret et al., 2018).
All of the gravimeters described above come at very high costs, ranging between about US$100,000 and US$500,000. High maintenance costs are also important considerations for SGs and FFAGs. No new methods for measuring gravity have been introduced for nearly five decades, so all existing gravimeters are based on older technologies and principles.
Given the current state of the art, it is clear that the development of new instruments represents a fundamental step that can move gravimetry from a niche field into a cornerstone resource for geophysical monitoring and research.
The NEWTON-g (new tools for terrain gravimetry) project (www.newton-g.eu) has received funding from the EC’s Horizon 2020 program, under the FETOPEN-2016/2017 call (Grant Agreement No 801221). It aims to overcome the limitations imposed by current instrumentation through the development of a field-compatible system for gravity measurements. In the framework of NEWTON-g, two complementary technologies will be adopted: microelectromechanical systems (MEMS) and laser-cooled atoms (quantum technology).
During the last ∼2 years of the project, the new measurement system will be field-tested at Mt. Etna volcano (Italy), where, due to persistent volcanic activity, measurable volcano-related gravity changes often develop, over different time scales. The volcano has also been well studied and is the site of a comprehensive existing monitoring infrastructure (www.ct.ingv.it/index.php/monitoraggio-e-sorveglianza/mappa-stazioni-ingv-oe), including some continuous relative gravity stations. Furthermore, the active crater zone of Mt. Etna can be reached by car by authorized personnel. This combination of factors provides a unique and attractive natural laboratory for testing and benchmarking the new gravity instruments.
Insights from the gravity imager will be used for volcanic hazards analysis, to demonstrate the importance of gravimetry to problems of societal relevance.
The main objective of the NEWTON-g project is to shift the paradigm of continuous gravimetry. Whereas only point measurements have been performed up to date, we aim at the development of a coherent array of gravity sensors, namely, a gravity imager. Similarly to a camera in optics, the gravity imager will simultaneously and continuously measure the gravity field at several points, thus allowing to follow the temporal changes due to geophysical processes with unparalleled spatio-temporal resolution.
The gravity imager consists of an array of MEMS-based relative gravimeters, serving as “pixels,” and a quantum gravimeter, serving as the absolute reference. The MEMS and cold atom approaches are complementary. MEMS technology allows the production of relative gravimeters much lighter and less expensive than currently available devices, thus allowing the deployment of extended arrays of continuously recording sensors, but with a lower sensitivity to gravity variations over time. A cold-atom gravimeter for use in harsh field conditions offers the possibility to continuously measure the absolute value of the gravity acceleration with a sensitivity and a stability at the µGal level, at a high rate, and over long time intervals (several years), but needs more power than MEMS devices and is more expensive. The joint exploitation of both technologies allows to attain the desired measurement sensitivity and spatio-temporal resolution.
If the AQG is installed at a site close to the summit active craters, where the strongest volcano-related gravity changes often develop, it will capture most of the meaningful anomalies, thus allowing to directly distinguish, in the time series produced by the MEMS devices, local and/or instrumental features from gravity changes of interest. Furthermore, if a peripheral gravity change occurs that is sensed by a cluster of MEMS gravimeters, but does not affect the quantum gravimeter (e.g., mass change due to an eccentric dike intrusion), the latter will be moved to the area where the change has been detected to perform absolute measurement and check, through comparison with the values acquired when the array was first installed, the characteristics of the eccentric anomaly. The quantum gravimeter will be then returned to its installation site, where the absolute continuous time series could be restarted without the need to apply any compensating corrections.
The NEWTON-g MEMS gravimeter exploits a novel technology that has been developed at the University of Glasgow (Middlemiss et al., 2016; Middlemiss et al., 2017). The device comprises a 240 µm thick layer of 〈100〉 crystal structure silicon, where a proof mass is suspended from four flexures (Figure 2). This layout allows for low resonant frequencies (<10 Hz) of the proof mass by creating a system that is known as a “geometrical anti-spring” (Middlemiss et al., 2016). The same concept has been previously utilized in the field of gravitational waves (Bertolini et al., 2004), to provide low frequency passive isolation from seismic noise, and as a novel technology to develop seismic sensors for applications in the oil and gas industry (Boom et al., 2017).
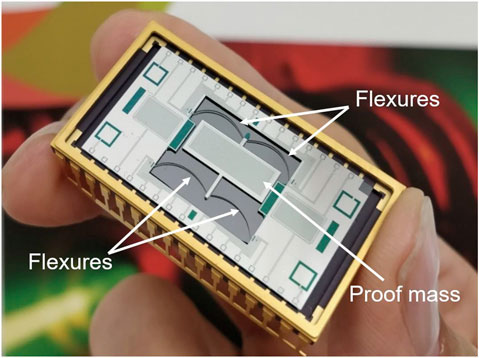
FIGURE 2. The microelectromechanical systems gravimeter silicon layer (32.8 mm × 18.3 mm) in its ceramic-lead hybrid package (40.6 mm × 23.1 mm).
The MEMS gravimeter works by measuring the displacement of the proof mass over time. The displacement of the proof mass can, in turn, be used to measure the acceleration experienced by the sensor, since a constant relationship exists between the displacement and acceleration of a mass on a spring, when measured below the resonant frequency of the oscillator. A capacitive sensing technique is utilized to measure the displacement (Figure 3). A set of interdigitated metal “drive” combs are patterned onto the Silicon proof-mass. A glass layer with a complementary set of “pick-up” combs is bonded to the Silicon layer with the spacers providing a gap of <30 µm between the two layers. Displacement of the proof mass results in a relative capacitive change between the drive and the pickup combs. A digital lock-in technique is employed to extract a direct current (DC) output proportional to the displacement of the proof mass.
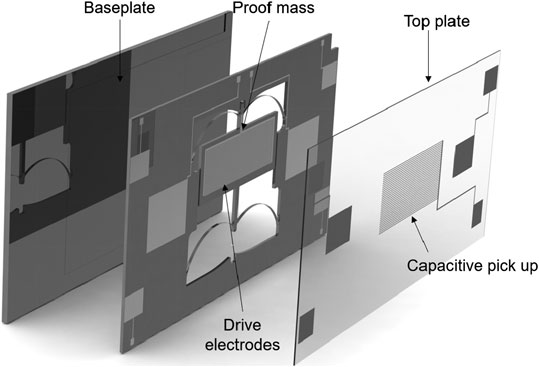
FIGURE 3. Schematic of microelectromechanical systems gravimeter showing the three-layer structure of the device.
The silicon layer is extremely temperature sensitive. An example of this is the change in Young’s modulus of the flexures due to temperature, and thus the possibility of a false signal that may be interpreted as a real signal as the proof mass moves. This means that temperature of the MEMS gravimeter has to be controlled to the order of 0.2 mK, to allow a sensitivity of 10 µGal (Prasad et al., 2018). To do so, a bespoke enclosure was designed to house the MEMS gravimeter. The MEMS device is firstly sealed within a lead-ceramic hybrid package; an off-the-shelf component ensures that a constant pressure is maintained around the MEMS gravimeter (mitigating spurious signals relating to buoyancy). The package also provides a layer of thermal shielding against external temperature variations. The package can be sealed with either noble gasses or with a vacuum to aid the thermal protection to the MEMS gravimeter.
This package is then installed into the first of two thermal enclosures (Figure 4). These enclosures are surrounded with polyisocyanurate, which has a thermal conductive property of 0.022 W/mK. This nested configuration provides a significant level of passive isolation from the outside world, but active control is still required to meet the thermal stability target of 0.2 mK. Active thermal control of the two enclosures is achieved with a Proportional-Integral Differential closed loop heater control system utilizing temperature sensors and heaters. The temperature sensors are in a 4-wire measurement configuration. This technique allows for the cancellation of resistance of the wires. The thermal enclosure then sits on a leveling platform, which itself sits on a circular aluminum base leveling platform (Figure 5).
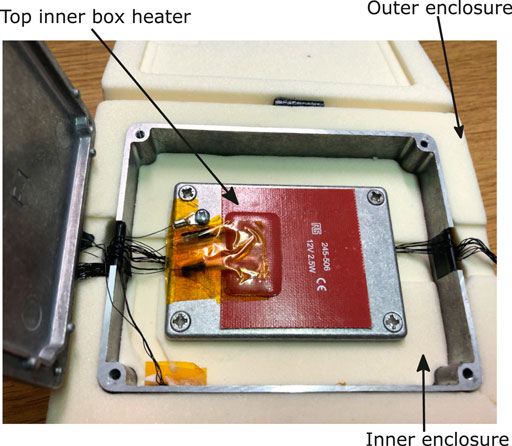
FIGURE 4. Nested layout of the thermal enclosure used in the microelectromechanical systems gravimeter. The outer and inner foam enclosures have dimensions of 140 mm × 110 mm and 110 mm × 85 mm, respectively. The outer and inner metal boxes have dimensions of 114 mm × 87 mm and 80 mm × 55 mm, respectively.
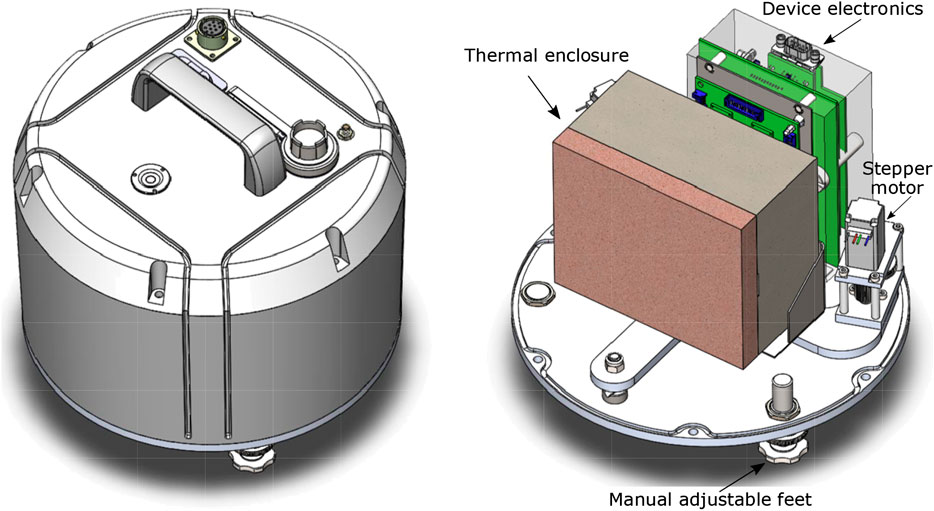
FIGURE 5. Three-dimensional rendering of the microelectromechanical systems gravimeter enclosure. The diameter and height (including the top handle) of the enclosure are, respectively, about 25 and 22 cm.
An embedded system with analogue signal conditioning electronics for the MEMS gravimeter was designed at the University of Glasgow. Its heart is a system-on-chip from the Zynq-family, hosting a Field Programmable Gate Array and a processor. The system includes electronics for signal conditioning for the MEMS displacement readout and electronics for temperature monitoring and control. The system operates autonomously and processes multiple data streams simultaneously.
The capacitance change caused by the displacement of the proof-mass is measured using a digital lock-in technique. Using a digital servo routine and dedicated analogue components, an amplitude stabilized pair of differential sinusoidal drive signals are generated from a digital reference signal at 40 kHz. These signals drive the capacitive combs on the proof-mass and are picked-up by the combs on the glass layer with a net induced current as an output. Any change in the displacement affects the capacitance between the two-layers, thereby causing the amplitude of the output current to change. A transimpedance amplifier, buffered with a junction field effect transistor (JFET), converts the current signal into a voltage which is then sampled at 1 MHz by an 18-bit analog-to-digital converter. The sampled signal is demodulated with the reference signal in the digital domain. This operation results in a DC component which is proportional to the amplitude of the reference signal and the MEMS displacement. The readout noise of the latest iteration of the electronics helps to achieve a displacement sensitivity of <50 pm and an acceleration sensitivity of <10 μGal for a 7.3 Hz device.
Besides the discussed capacitive and temperature readout and control, the embedded system also reads two commercial electrolytic tilt sensors, attached in an X-Y configuration to the mechanical enclosure’s base plate. This allows for tilt monitoring of the ground over time and for correcting the gravity measurements for apparent changes driven by tilt of the instrument (Riccardi et al., 2009). Furthermore, the tilt of the MEMS device can be compensated for by adjusting the level of the MEMS mounting bracket through stepper motors.
All of the device’s electronics can be powered through either a mains connected power supply or through a 12 V portable battery pack, such as in the field configuration designed for the applications under NEWTON-g (see Field Implementation at Mt. Etna). The power drawn from the MEMS device is about 5 W for nominal operation. The tilt adjustment operation, which requires energizing stepper-motors, draws a higher current which can lead to a peak power demand of 18–24 W for short durations (∼5 mins every day/few days).
Both the embedded system and the thermal enclosure, are housed within a 2-part moulded shell with communication ports at the top, which attaches to the circular aluminum base (Figure 5).
A portable system with the optical shadow-sensor based readout has previously shown a sensitivity of ∼8 µGal/rt (Hz) (Prasad et al., 2018). However, in the most recent iteration, the larger shadow-sensor readout has been replaced with a more compact capacitive displacement readout. The new system has already demonstrated a short-term sensitivity of 6–7 µGal/rt (Hz) (Prasad et al., 2020). The capacitive MEMS gravimeter has been specifically designed to meet the size, weight, and sensitivity requirements of NEWTON-g and will permit the deployment of the gravity imager on Mt Etna.
The AQG that is being developed by Muquans in the frame of NEWTON-g will be installed on the summit area of the Mt. Etna volcano, and used as a continuous absolute gravity reference for the gravity imager. The AQG is particularly relevant in this context because it is transportable, straightforward to install, and suitable for use in the field. Its targeted performances are a sensitivity of ∼50 µGal/√t, i.e., 1 µGal after ∼45 min of integration in quiet places and ∼150 µGal/√t (i.e., 1 µGal after ∼6 h of integration to account for the effect of the volcanic tremor), a long-term stability of 1 µGal with a station-to-station repeatability of 2 µGal and an accuracy better than 15 µGal, making it fully compatible with the scientific objectives of the project. To the best of our knowledge, it is the only technology able to provide continuous drift-free absolute measurement of g over periods of years.
The AQG relies on matter-wave interferometry with laser-cooled atoms (Bordé 1989; Kasevich and Chu, 1991; Kasevich and Chu, 1992). This technique has shown its capability to perform continuous absolute gravity measurements with performances at the level of 1 µGal in laboratory environments (Hu et al., 2013; Gillot et al., 2014). Moreover, several demonstrations have been made with mobile devices over the last few years (Farah et al., 2014; Freier et al., 2016; Bidel et al., 2018; Huang et al., 2019; Wu et al., 2019). Based on these results, Muquans has pushed the technology further and developed an instrument with industrial standards, capable of meeting the requirements of long-term field applications (Ménoret et al., 2018). Several technical innovations have made this possible, in particular in the design of the laser system, sensor head architecture and vibration compensation. In the frame of NEWTON-g, a novel outdoor version has been developed, able to operate in the demanding conditions of the summit area of Mt. Etna.
The basic principle of the AQG is similar to classical absolute free fall gravimeters (Niebauer et al., 1995): a vertical reference laser beam probes the acceleration experienced by a test mass in free-fall under vacuum. However, instead of using a mirror, as in free-falling corner cube gravimeters, the gravity measurement is performed with falling laser-cooled atoms. This technique is one of the ballistic freefall methods proclaimed by the Bureau International des Poids et Mesures as an official primary method for the measurement of gravity, and offers several advantages both in terms of absolute performance (the atoms are very fundamental objects whose properties are very well understood) and instrument operation (with no moving mechanical parts under vacuum, atomic instruments are well suited to continuous absolute measurements).
A gravity measurement with the AQG consists in a sequence of three steps, repeated at a rate of approximately 2 Hz (Figure 6). The measurement principle of the AQG has been described in detail in (Ménoret et al., 2018; main text and supplementary material). In the first step, the test mass is built-up by cooling down and trapping a cloud of Rubidium atoms with lasers inside an ultra-high vacuum chamber. At the end of this operation, the atoms have a temperature of 2 µK. Then, all laser beams are turned off so that the cloud of cold atoms experiences a perfect free-fall for approximately 10 cm. During the second step, the vertical acceleration undergone by the atoms as they fall is precisely characterized. This is done by illuminating the atoms with a series of three counter-propagating laser pulses. This measurement, based on stimulated Raman transitions, is described by quantum mechanics as a matter-wave interferometer, whose phase depends on acceleration. At the output of the interferometer, the acceleration information is encoded on the internal state of the atoms (Bordé, 1989). In the third step, the measurement readout is performed by collecting fluorescence from the atoms on a set of photodiodes, to measure the number of atoms in each internal state. Finally, the frequency of the interferometry laser is servo-locked on the measurement readout in order to track temporal variations of the absolute value of gravity, for example, due to tidal or geophysical effects.
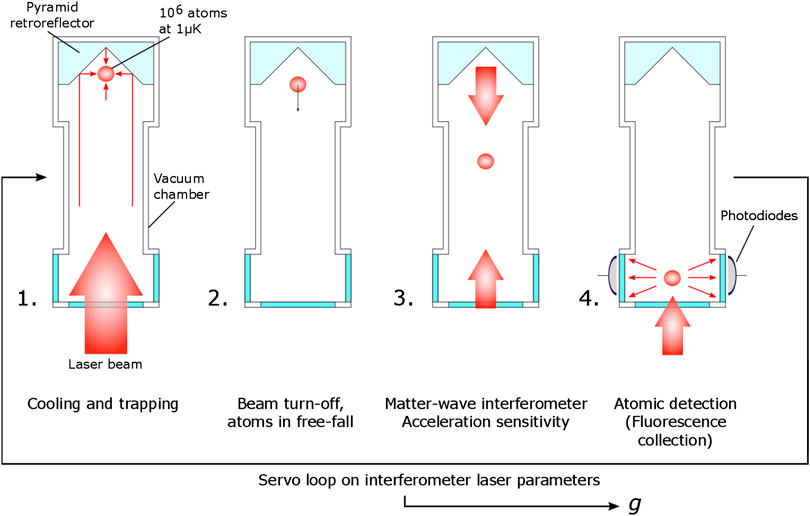
FIGURE 6. Illustration of a typical measurement sequence with the absolute quantum gravimeter. 1. Atoms are trapped and laser-cooled inside a hollow pyramidal reflector located at the top of the vacuum chamber. 2. Laser is turned off, and the atoms are in free-fall. 3. Raman laser pulses are used to measure the acceleration of the atoms with respect to the vacuum chamber. At the output of this matter-wave interferometer, the acceleration is encoded on the atomic populations of two quantum states. 4. Fluorescence detection is used to readout the number of atoms in each quantum state and derive the value of acceleration.
A first version of the AQG has been developed and successfully tested in controlled environments (Ménoret et al., 2018). It consists of two main elements: a module containing the laser and control systems, and a sensor head containing the vacuum chamber, where the gravity measurement is actually performed. These two modules are linked by a 5-m optical fiber and a set of cables. Building this laboratory instrument with industrial standards already required several technological innovations, which have been enhanced to allow field operation on Mt. Etna. First, frequency-doubled telecom lasers are employed to cool and manipulate the atoms (Ménoret et al., 2011; Lévèque et al., 2014; Theron et al., 2015; Caldani et al., 2019; Sabulsky et al., 2020). This means that the laser system is completely fibered, and intrinsically very compact and immune to external perturbations, while ensuring a high level of performance. Second, the atoms are trapped inside a hollow pyramidal reflector, which drastically simplifies the optical architecture and allows all the cooling, Raman and detection functions to be performed with a single laser beam, while up to 10 are necessary in more traditional configurations (Bodart et al., 2010). Third, we have implemented a real-time compensation of ground vibrations by using a classical accelerometer attached to the top of the sensor head (Merlet et al., 2009; Lautier et al., 2014; Ménoret et al., 2018). Finally, we have fitted the sensor head with two high-precision tiltmeters (precision better than 10 μrad) and a barometer (accuracy better than 1 hPa). When the AQG measures, tilt is continuously monitored, so that the gravity signal can be corrected for the effect of any deviation from verticality. Similarly, atmospheric pressure variations are recorded and their effect can be also removed from the gravity output (Merriam, 1992).
In the framework of NEWTON-g, the field version of the AQG, the AQG-B, will endure harsh environmental conditions (Carbone et al., 2017) which have been anticipated in the design phase of the device by adding several improvements to the laboratory version. We have reduced size, weight and power consumption, increased robustness to external temperature fluctuations and preserved a high degree of automation and simplicity for the end user, together with a low level of maintenance.
On the summit zone of Mt. Etna, measurement sites will be difficult to access. To meet this constraint, the AQG-B is designed for easy transportation and manipulation. The device is composed of four modules: the power supply unit, the laser system and its air-conditioning unit, and the sensor head where the gravity measurements are performed (Figure 7). The weight of each module has been kept below 40 kg, so that they can be conveniently manipulated by two people. The number of connectors has been reduced and optimized to enable easy installation and to avoid possible misconnections. Finally, the sensor head can be moved within a 15 m radius without powering off the device. These features allow for a fast installation, in particular because no optical alignment is needed. Furthermore, the user software of the AQG-B features a high level of automatization and therefore the device is highly autonomous in case of problems. If support is still necessary on sites that are not accessible during winter, the AQG-B can be accessed and controlled remotely.
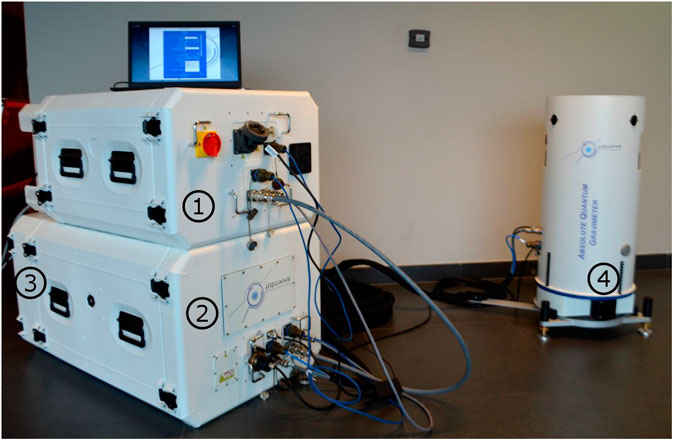
FIGURE 7. Field version of the AQG (AQG-B) in operation configuration. 1- Power supply unit. 2- Laser system. 3- Air-conditioning unit. This module can be separated from the laser system during transport. 4- Sensor head. Four cables and an optical fiber connect the sensor head to the rest of the system, with a maximum separation of 15 m.
Temperature measurements on Mt. Etna show that the AQG-B will endure strong temperature fluctuations. Indeed, the AQG-B is designed to provide a useful signal for the gravity imager over the range [0–40°C]. An air-conditioning module is attached to the back of the laser system, aimed at maintaining its internal temperature at 35°C. In the sensor head, heating mats are installed to keep the internal operating temperature constant, regardless of the external temperature. An insulating cover for the sensor head is available to increase insulation when the external temperature is low thereby reducing power consumption. Under these operating conditions, the total power consumption of the AQG-B is below 500 W, making it compatible with operation under battery power.
Gravimeters, in particular high-precision absolute devices such as the AQG, are highly sensitive to ground vibrations, which can strongly deteriorate their performance. The sensitivity of these sensors is such that the ambient micro-seismic noise is often more than hundred times bigger than the geophysical effects of interest, even in the most remote and unpopulated areas of the world. On an active volcano, where seismic activity may be significant, this effect is even more important. Ground vibrations are transmitted to the retro-reflecting mirror, which is the mechanical reference of the atomic interferometer. As a result, ground vibrations make the mirror shake, thus adding a strong high-frequency contribution to the signal of interest. It is therefore necessary to address this source of noise. Originally, quantum gravimeters were placed on mechanical isolation platforms used to filter out ground vibration noise (Hu et al., 2013; Farah et al., 2014; Freier et al., 2016). This method works well in the laboratory, but is not suited to field operation because of its complexity and sensitivity to parameters such as temperature fluctuations. Therefore, on our AQG-B a high-performance classical accelerometer is attached to the top of the vacuum flange that supports the pyramidal reflector. This mechanical structure is very rigid by design, so that the recorded signal is not distorted by resonances or deflections. This accelerometer has a useful bandwidth of [0.05–420 Hz]. It records the ground vibrations seen by the mirror during the free-fall, and the software calculates in real time their impact on the atomic interferometer. This effect is compensated by changing the phase of the Raman laser before the third pulse of the interferometer (Lautier et al., 2014; Ménoret et al., 2018). As a result, we have a means to pre-compensate for the influence of ground vibration, drop by drop (Figure 8).
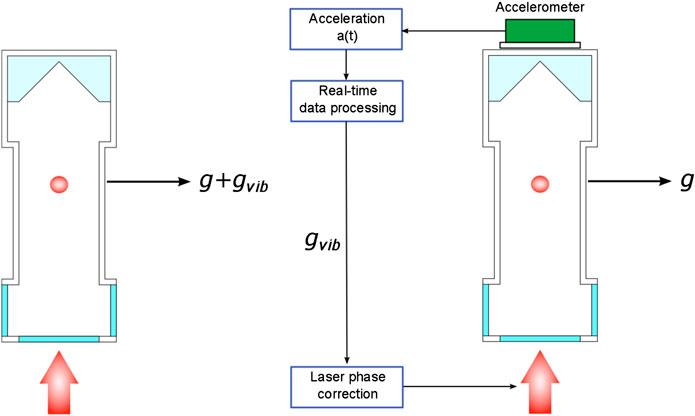
FIGURE 8. Real-time compensation of ground-vibrations on the absolute quantum gravimeter. Left: without classical accelerometer, ground vibrations would directly affect the gravity measurement. Right: A classical accelerometer is attached to the top of the sensor head. Its signal is processed in real-time in order to provide a feedback on the lasers, and remove vibrations from the gravity measurement.
Time series of absolute gravity measurements, acquired in the facilities of Muquans (Ménoret et al., 2018), show that the field AQG-B meets the specifications in terms of sensitivity and long-term stability in an urban environment.
The sensitivity and the stability of the AQG-B in the time domain is evaluated through the Allan deviation (Figure 9), allowing a representation of the stability evolution with the averaging time (Allan, 1966). The sensitivity obtained is 71 µGal/√t and the long-term stability is around 1 µGal. In other words, for an averaging time longer than a few hours, the stability of the measurement is at the level of 1 µGal or lower.
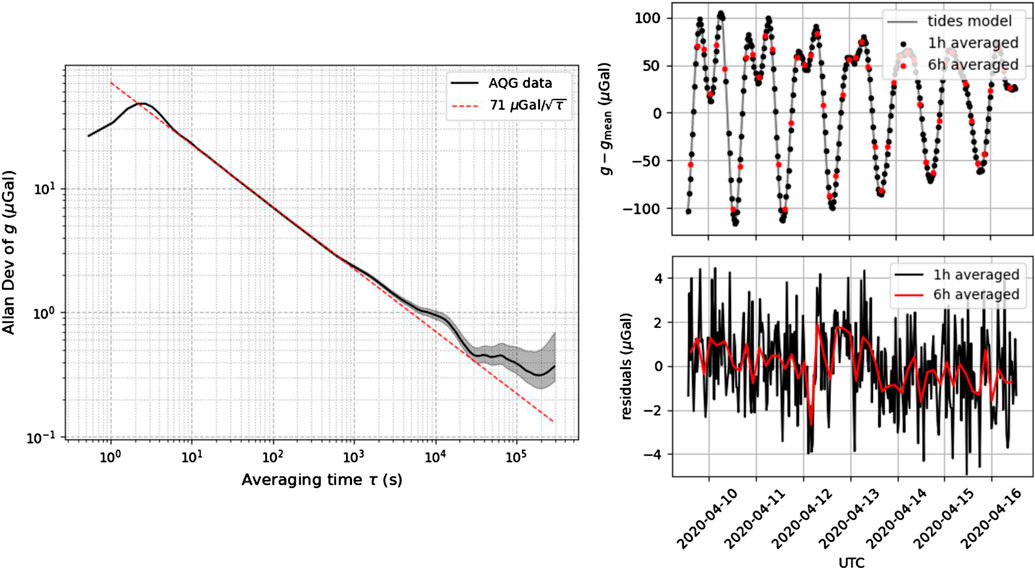
FIGURE 9. Results from a 1-week continuous gravity measurement in Talence, France, in April 2020. Left: Allan deviation of gravity residuals. Sensitivity is 71 µGal/√t and stability over averaging times longer than 104 s is below 1 µGal. Top right: raw measurements, averaged over 1 h (black dots), 6 h (red dots) and the local tide model (solid line). Bottom right: gravity residuals after correction for tidal effects and atmospheric pressure. Standard deviation for a 1 h (6 h) averaging time is 1.9 µGal (1.0 µGal).
To conclude, the development and implementation of several innovations makes the AQG-B suitable for the applications under NEWTON-g and for operation under the harsh environmental conditions at the summit of Mt. Etna.
To check its performance, the gravity imager will be deployed at the summit of Mt. Etna volcano (mostly at elevations between ∼2,000 and 3,000 m), during the final ∼2 years of the project. Mt. Etna provides an attractive, but challenging, option for benchmarking the new gravity instruments. Indeed, measurable gravity changes often develop, especially at sites close to the summit active craters, due to the underground fluid dynamics that sustains the persistent activity of the volcano (Gilbert and Lane, 2008). It will thus be possible to check the ability of the gravity imager to provide insights into the characteristics of gravity changes occurring over different time and space scales. Furthermore, the 30-year history of conventional gravity measurements at Mt. Etna (Carbone et al., 2017 and references therein) and the existing multi-parameter monitoring system of the volcano, including a mini-array of three SGs (Carbone et al., 2019), will provide context for the NEWTON-g deployment and will aid in the interpretation of the observed gravity signals. Nevertheless, harsh environmental conditions at the summit of Mt. Etna (snow and ice during winter, strong wind, lack of mains electricity, presence of corrosive gases) imply that care must be taken in designing the field infrastructures aimed to i) protect and power the gravity sensors and ii) acquire, store and transmit the data to the main collector host.
Most MEMS devices in the gravity imager will be installed at sites where no previous facility exists. Hence, a complete field infrastructure (MEMS station) has been designed, ensuring full protection and functionality of the MEMS gravimeters against severe field conditions (Figure 10). Besides robustness, another principle that drove the design of the field infrastructures for the MEMS devices is the use of low-cost, low-power and small-scale electronics components (Internet of Things fashion). It is indeed the same challenge faced in the development of the MEMS gravimeters themselves: to produce low-cost and low-power devices, relying on integrated microsystems.
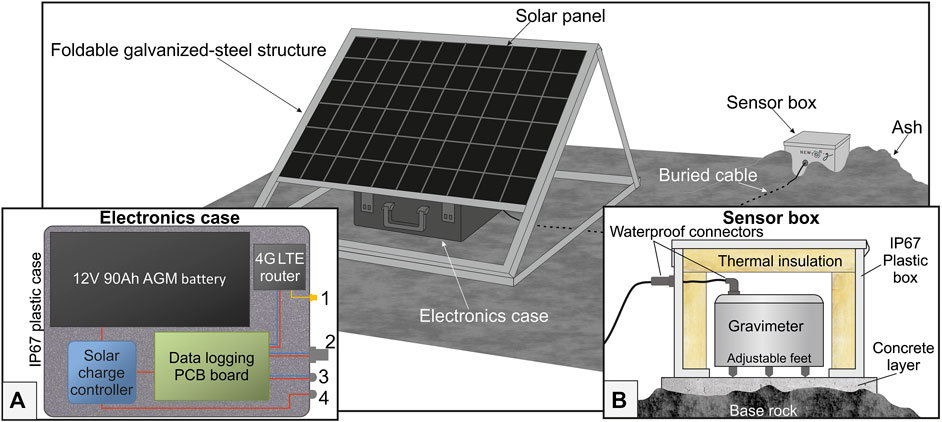
FIGURE 10. Scheme showing the configuration of the typical microelectromechanical systems station in the field. The main elements of the installation are: i) the foldable steel structure holding the solar panel; ii) the electronics case that contains the acquisition system, the router, the battery and the solar charge controller; iii) the sensor box, hosting the gravity sensor. Inset A: detail of the electronics case showing the devices it contains. Connectors on the right route signal (blue lines) and/or power (red lines) to or from: 1 - router antenna; 2 - gravimeter; 3 - soil moisture probes; 4 - solar panel. Inset B: cross-section across the sensor box. Where possible, the sensor box will be covered with ash, to improve overall thermal insulation.
Each MEMS station is powered through a 200 W photovoltaic panel, coupled with a 90Ah buffering accumulator. The solar panel is mounted on a foldable galvanized-steel structure, allowing to choose the tilt angle of the panel individually at each installation site, while also facilitating transport of the structure (and storage before installation). Its relatively heavy weight (about 70 kg) may pose a one-off challenge at locations where the installation site is not close to the road and must be reached on foot. Nevertheless, it makes the installation more able to withstand strong winds.
Data from the MEMS gravimeter and from complementary sensors measuring environmental parameters (ambient temperature and humidity, atmospheric pressure, soil moisture) are acquired through a Raspberry PI 3 Model B+. The latter is a low-power single-board computer which runs Raspbian OS (Linux), while self-written Python routines are used for data collection and logging. An ATmega328PB microcontroller is used for analog-to-digital conversion of the signal from voltage and current sensors and for handling the SDI-12 communication with the soil moisture probes. Data acquired by the ATmega microcontroller are sent to the Raspberry PI for final logging.
From each installation site on Mt. Etna, data are transmitted through the LTE cellular network to the remote collection host in Catania (Linux virtual machine). The latter manages data synchronization with all the remote MEMS stations. Cellular technology is preferred over other options (e.g., Wi-Fi network), since, provided that there is sufficient cellular coverage (as in most sites on the summit of Mt. Etna), it allows a bidirectional data transfer from/to any point in the array, without the burden of establishing a transmission infrastructure of point-to-point links.
Two waterproof (IP67 standard) cases are employed to house i) the electronics and battery and ii) the MEMS gravimeter (electronics case and sensor box, respectively, in Figure 10). The MEMS sensor will be installed directly on a concrete layer poured on the base rock, with the sensor box also anchored to the concrete layer, but decoupled from the gravimeter, to prevent transmission of vibrations of the housing to the sensor (Figure 10). Watertight, heavy-duty connectors and cable are used to route power and signals between the two cases. Particular care is taken to ensure that campaign measurements can be performed with the AQG-B at close distance from each installation site of the MEMS stations. At sites where this is not possible, an easily portable spring gravimeter will be used to connect to the reference site, i.e., the site where the AQG-B is quasi-permanently installed to perform continuous measurements.
Two possible sites on Mt. Etna were considered for the installation of the AQG-B: the Serra La Nave Astrophysical Observatory (SLN; southern slope of the volcano; 1,730 m elevation) and the Pizzi Deneri Volcanological Observatory (PDN; northern slope of Mt. Etna; 2,800 m elevation). At SLN mains electricity is available and the installation of the quantum gravimeter would not pose significant challenges. Nevertheless, this site is relatively far from the active summit craters of Mt. Etna (∼6.5 km), hence only minor gravity changes are expected to develop in response to most volcanic processes. Furthermore, a SG has acquired continuous data at this site since 2014 (iGrav#16; Carbone et al., 2019), implying that having the quantum gravimeter operating at this site would provide partially redundant information.
PDN is much closer to the summit of Mt. Etna (∼2.7 km) than SLN and measurable gravity changes are expected to occur at this site, due to volcano-driven mass redistribution in the shallow plumbing system of Mt. Etna (Carbone et al., 2015). Continuous gravity measurements were accomplished at PDN using spring gravimeters and provided important results (Carbone et al., 2003), thus proving the strategic position of this site from the point of view of volcano monitoring through gravimetry. Currently, no continuous gravity observations are carried out at PDN and installation of the AQG-B at this site would thus provide unique and valuable data. Nevertheless, mains electricity is not available at PDN, implying that an off-grid power supply system must be installed to allow continuous operation of the quantum gravimeter. The AQG-B runs on 220 V alternate current (AC) and requires about 500 W of power. Several off-grid power solutions have been considered to fulfill the power requirements of the quantum gravimeter, including wind generators, solar panels, fuel cells and a diesel generator.
Wind speed on Mt. Etna can be extreme and a wind turbine is not considered a good option, as it could easily get damaged. Solar panels are only effective during daylight hours of bright sunshine and may be ineffective due to clouds and ash cover. Moreover, in winter, snow and ice may completely cover the panels’ surface. Because solar power is unreliable on its own, it is not a good candidate for sole use. However, it can contribute to a combined power system. A hybrid solution with solar panels and methanol fuel cells would have a too high total cost and would be difficult to maintain, since about six 60-L methanol tanks would be needed to power the gravimeter for roughly 30 days (without solar energy).
The most reliable and affordable off-grid solution to power the quantum gravimeter at PDN is a hybrid system, including solar panels and a diesel generator. This system includes a lithium battery unit (a total of about 9 KWh at 48 V) to store the power generated by the two sources. Besides power sources and accumulators, the hybrid off-grid system is equipped with a solar charge controller and a central management unit. The former handles the current produced by the solar panels, making the flow available to the central management unit. The latter works as a grid manager, ensuring proper storage of the energy in the accumulators and a continuous power supply to the connected AC load (the AQG-B gravimeter). It also switches the powering/charging source between solar panels and diesel generator, depending on the solar power available at a certain time. The dimensioning of the various components of the hybrid off-grid system depends on the trade-off between the following factors: i) the need to minimize the average working time of the diesel generator, in order to reduce diesel consumption; ii) the available surface area for solar panels in the facilities of the PDN observatory, which constraints the number of photovoltaic modules one can install; iii) the need to supply continuous and uninterrupted power supply to the quantum gravimeter. The final configuration includes a maximum of 10 350 Wp solar panels and a 5 KVA diesel power generator.
From the collector host at the Istituto Nazionale di Geofisica e Vulcanologia (Sezione di Catania - Osservatorio Etneo), the data produced by the NEWTON-g gravity imager will be copied over to the ORFEUS Data Center (ODC), hosted at the Royal Netherlands Meteorological Institute (KNMI). The ODC is a FAIR‐aligned (i.e., allowing findability, accessibility, interoperability, and reusability of the data) and well-established repository for seismo-acoustic waveform data, operating since 1988. This archive will serve as a back-up and a tool to curate and distribute the gravity data. The data files stored at ODC will be modified to leverage seismological mSEED and StationXML standards, thus ensuring compatibility with the operational data center infrastructure. Seismological standards were proven to be robust and are compatible with existing software packages for data processing (e.g., Beyreuther et al., 2010; Heimann et al., 2017).
Data from the gravity imager will be restricted under an embargo until the project is completed (2022), after which the data will be publicly accessible and distributed through the ODC. Data will be made discoverable through a metadata catalog (Trani et al., 2017) and it will be possible to access them via Federation of Digital Seismograph Networks Application Programming Interface. These services allow the user to easily obtain the subset of data that match his requirements.
Within the European Plate Observing System, the ODC shares responsibility for the distribution of raw seismological waveform data. The intent is to make seismic data discoverable through the European Plate Observing System portal and interoperable with other geoscientific disciplines, including the field of volcanology This implies that by leveraging the operational services of ODC, the NEWTON-g gravity data will be automatically integrated with larger European research data infrastructures, making it findable and accessible to all communities.
As reported in the previous sections, in the framework of the field-test on Mt. Etna, the location of the installation site for the AQG-B is constrained by the requirements of the instrument, when it is utilized for continuous measurements over a long interval. Conversely, the positions of the MEMS “pixels” can be chosen more freely. The MEMS network configuration can thus be optimized, with the aim of improving the performance of the gravity imager, in terms of its ability to detect meaningful gravity changes during the deployment.
As the first step toward the definition of the optimal network configuration, the amplitudes, time scales and spatial extent of the gravity anomalies associated with volcanic processes were reviewed (Figure 11), mainly focusing on, but not limited to, results from Mt. Etna (e.g., Branca et al., 2003; Furuya et al., 2003a; Furuya et al., 2003b; Carbone et al., 2008; Carbone et al., 2015; Carbone and Poland, 2012). It is worth noting that gravity measurements are usually conducted at safe distances from hazardous processes, such as lava fountains, owing to the high risk of losing expensive instrumentation if a sudden eruptive event occurs. It is likely that higher amplitudes would be recorded at closer distances from the active structures, but this cannot be achieved with the currently available instruments.
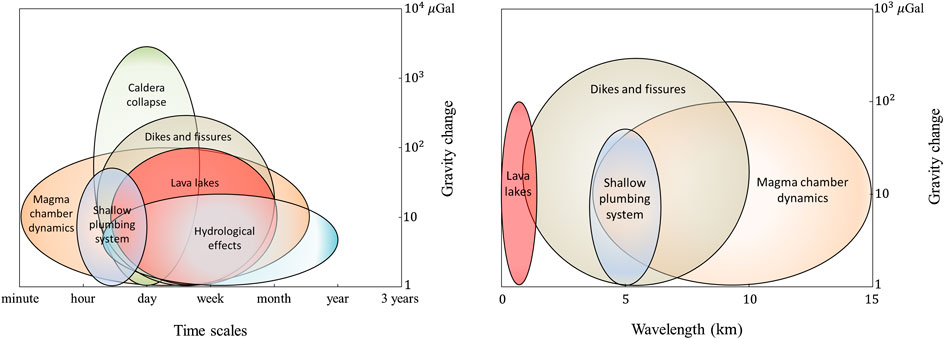
FIGURE 11. Time (left) and space (right) scales vs. amplitude of the gravity changes induced by volcanic processes. In the left panel, the characteristics of the gravity changes induced by hydrological processes are also reported, for the sake of comparison. Conversely, “caldera collapse” is not reported in the right panel, since the possible space scale of this particular process covers the whole range of the x-axis of the plot and beyond.
As a further step, using results of studies dealing with the inversion of gravity changes observed at Mt. Etna during the last ∼30 years (see Carbone et al., 2017 and reference therein), five volumes within and below the volcanic edifice were defined as the locations where mass changes producing measurable gravity change may most likely occur over the time scale of the deployment of the gravity imager (∼2 years). This is a strong assumption, as the volcano is prone to sudden changes of intrusive and eruptive patterns; nevertheless, making this assumption is necessary, in order to limit the area to be covered by the network. Three of the above locations are below the summit craters, at elevations of 1,500, 0 and −2,000 m, respectively. The other two locations are off-centered by ∼3 km to the south and north along the S and NE Rifts, respectively, and at elevations of 1,000 and 1,500 m, respectively. Figure 12 shows maps of gravity anomalies induced by mass sources in the above locations.
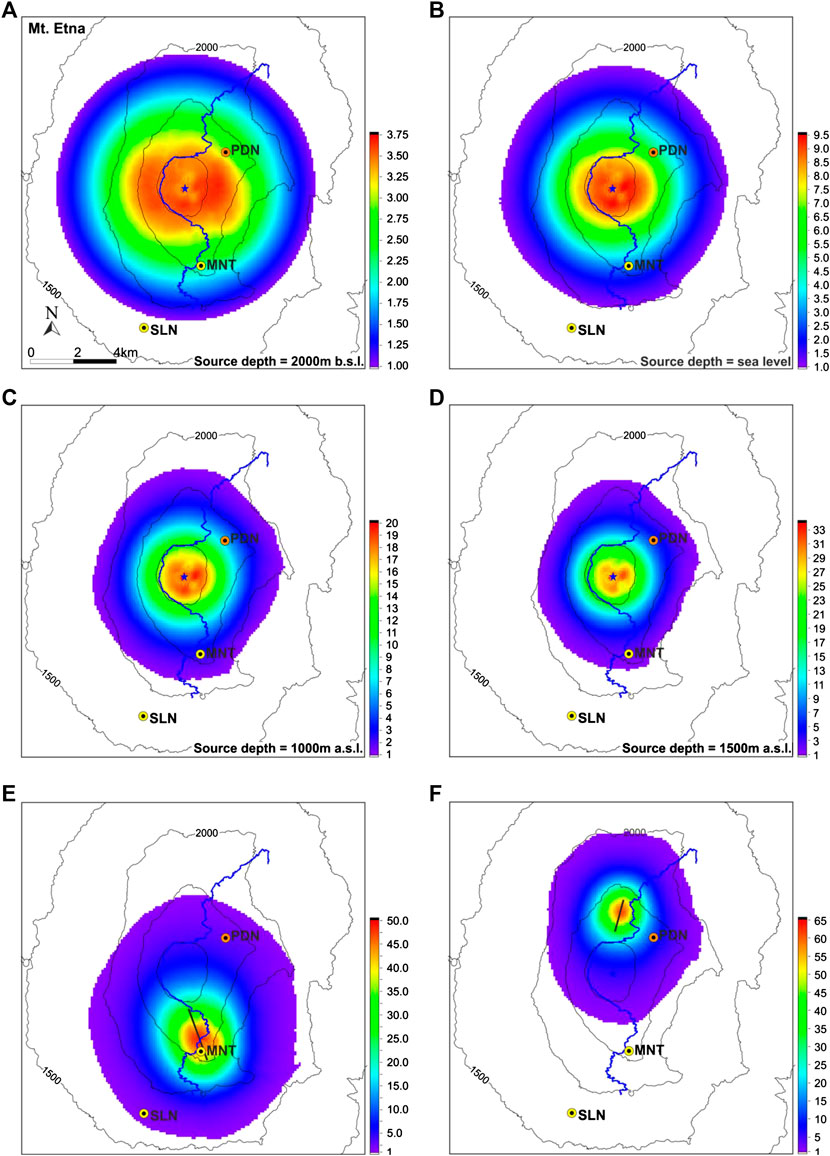
FIGURE 12. Maps of Mt. Etna showing gravity anomalies (in µGal) induced by different mass sources. (A–D) Gravity anomalies produced by a point source (mass change = 1.45 × 10¹⁰ kg, in all cases) beneath the summit craters at different depths: (A) 2 km b.s.l., (B) at sea level, (C) 1 km a.s.l., (D) 1.5 km a.s.l., and (E,F) Gravity effect (in µGal) due to elongated mass sources (dikes) below the south and north-east slopes of Etna. (E) Mass change of 2.5 × 10¹⁰ kg, source depth at 1,000 m above sea level (Budetta et al., 1999). (F) Mass change of 1.5 × 10¹⁰ kg, source depth at 1,500 m above sea level (Carbone et al., 2003). The maps also report positions of: the two higher gravity stations equipped with iGrav meters (SLN and MNT); the Pizzi Deneri Volcanological Observatory; the Summit road (blue track).
We have identified the characteristics of the network configuration that satisfy the above requirements by both i) deriving simple analytical solutions, to be used as references and ii) using a genetic algorithm as the nonlinear optimization method (Nikkhoo et al., 2020). The following assumptions and constraints are involved in the optimization procedure: 1) the assumed gravity changes are due exclusively to bulk mass changes (i.e., we assume that they are already corrected for deformation and hydrological effects); 2) the five potential sources of mass change (Figure 12) are approximated as point masses and may only become active one at a time; 3) the two SGs of Mt. Etna’s monitoring network at higher elevation (MNT and SLN stations) and the AQG-B (at PDN station) are considered as fixed points (Figures 12, 13) in the network optimization and resolutions of 1 and 5 µGal, respectively, are assumed; 4) up to 30 MEMS devices, with assumed resolution of 10 µGal, constitute the “optimizable” part of the network; 5) due to logistic issues, the MEMS stations are constrained to be within 200 m of the Summit and Forestale roads and they are not allowed to fall in the Valle del Bove area (Figure 13).
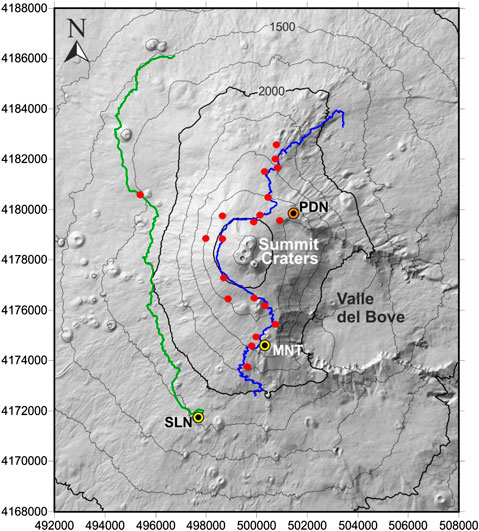
FIGURE 13. Sketch map of Mt. Etna showing one possible configuration of microelectromechanical systems (MEMS) stations (red dots) selected by the optimization procedure. The position of the two stations equipped with iGrav SGs at higher elevation (SLN and MNT) and the Pizzi Deneri Volcanological Observatory (PDN) is also indicated. The blue track marks the Summit road, while the green track indicates the westernmost part of the Forestale road. The position of both tracks is taken into account by the optimization procedure (see text for details).
The cost function of the optimization is defined as the weighted sum of the volumes of the uncertainty hyperellipsoids of the four unknown parameters of the five point masses, i.e., location coordinates and mass change. It is important to stress that the real (i.e., in the field) covariance among measurements from different MEMS stations, which is one of the inputs, is not yet available and this limits the accuracy of the outcome of the optimization procedure.
A preliminary run of the network optimization procedure resulted in the MEMS stations configuration shown in Figure 13. Further details on this method will be provided in a paper currently in preparation (Nikkhoo et al.). Here it is worth stressing that some of the sites selected by the algorithm could present characteristics, such as absence of firm base rock at close distance and poor or absent cellular coverage for data transmission, not well suited for the installation of a MEMS station. Hence, an approach must be followed where theoretical results from the optimization procedure and information from the field are iteratively combined, toward retrieving the final configuration of the MEMS pixel in the gravity imager.
The method that has been developed to optimize the configuration of the gravity imager can handle complex constraints imposed by field conditions and instrumental limits and, with appropriate modifications, it can be applied to optimize the configuration of gravity networks at any location.
Besides the high cost of current instrumentation and the difficulty in using it under harsh environmental conditions, another factor that has limited the application of continuous gravimetry to monitor and study active volcanoes is the lack of proper understanding of the cause-effect relationships linking underlying processes to fast-evolving gravity changes (time scales ranging between minutes and a few days). Indeed, even at volcanos where continuous gravity measurements are usually carried out, gravity data are not routinely considered in early warning systems and crisis management plans, despite their power to identify processes that might immediately precede eruptions or changes in eruption style (Carbone et al., 2017). For example, magma being quickly transported to the surface, large gas bubbles ascending in conduits, accumulation of foam layers in structural traps and mixing processes when a new magma enters an existing reservoir, which are typical processes anticipating eruptions, are expected to induce a measurable gravity signal that evolves, during the process, over relatively short time scales. Critically, recording such gravity changes may help quantifying a parameter, the mass flow rate, that is very much needed as input for hazard models, but impossible to obtain with enough confidence from other monitoring data.
In order to integrate high-rate gravity data into a better understanding of the volcano dynamics and to improve the accuracy of hazard models, we need to progress our process understanding and clarify how key magmatic processes translate into fast-evolving gravity changes observable at the surface.
To address this issue, a specific task of NEWTON-g is devoted to the development of forward modeling for a variety of scenarios, mainly focused on volcanic processes, but potentially applicable to, e.g., geothermal areas. Results (i.e., synthetic signals) from numerical and analytical models will be compared to real gravity signals, for testing and validation, and eventually applied to interpret the data produced by the NEWTON-g gravity imager, during its deployment at Mt. Etna. Strategies will be also developed for best incorporating gravity data into existing frameworks (e.g., early warning systems and data reporting to Civil Protection Authorities) for the detection and assessment of short-term (days-months) volcanic hazards.
We thus envisage that the results from NEWTON-g will serve as a reference to volcano observatories around the world, which might use the tools and methods developed by NEWTON-g for their own monitoring programs. Application to a very active and monitored volcano such as Mt. Etna will help to best test and benchmark the new tools, and will serve as guidance to less active and quiescent volcanoes/calderas whose activity and unrest are of more difficult interpretation (e.g., Battaglia et al., 1999; Acocella et al., 2015).
Modern geophysics actively pursue a quantitative and overall understanding of the processes active in the Earth’s interior, in order to address critical societal issues, such as georisk mitigation and resource management. Most geophysical phenomena underlying the dynamics of hydrological, volcanic, hydrothermal and petroleum systems involve underground mass transport and can induce changes in the gravity field measurable at the surface. Gravimetry is thus an important geophysical method, able to provide unique insight into natural phenomena that have strong societal implications.
Most currently available land gravimeters (Figure 1) allow to attain the precision and accuracy that is required to measure gravity changes driven by geophysical processes (amplitudes ranging between a few and a few hundreds of µGal). Nevertheless, these instruments are expensive (prices ranging between about 100 and 500 k$), which has often discouraged research institutes and monitoring centers from performing microgravity observation—especially continuous measurements that, ideally, would require the installation of an array of instruments. For example, Carbone et al. (2006, 2015) and Carbone and Poland (2012) demonstrated that meaningful gravity changes driven by volcanic processes may develop over short time-scales (minutes to a few days), thus requiring continuous observations at fixed installation sites and at relatively high rate (0.01–1 Hz). However, since the institutions in charge of monitoring and studying volcanoes cannot afford more than two to three gravimeters, it has never been possible to observe these fast-evolving gravity changes with enough space resolution and their interpretation has remained elusive. Similar issues limit the possible application of the gravity method for tracking rapid hydrological and hydrothermal processes (Gottsmann et al., 2007).
Besides being expensive, the available gravimeters intended for continuous observations are more suited for use under laboratory conditions, rather than in the field. Indeed, they are large, heavy, power-hungry and controlled by dedicated acquisition systems that include a laptop computer. Hence, they cannot be utilized at sites difficult to reach and where AC power and a large surface for the setup are not available (e.g., active zones of tall volcanoes, Antarctica). Under this scenario, the development of lighter, less expensive and less power-demanding devices will open new horizons for the application of terrain gravimetry (especially continuous measurements).
The MEMS gravimeter has a performance comparable to those of commercial relative gravimeters, but it is significantly smaller and has the potential to be much less expensive, since the fabrication process of mobile phone accelerometers can be exploited (Middlemiss et al., 2016). The low cost of the devices could democratize the gravimeter industry, currently dominated by large companies in the US, thus vastly increasing the number of potential applications, as proven by the interest already expressed by many subjects (e.g., defense, oil and gas and space sectors) in being end-users of these devices when they become commercially available. H2020 funding under NEWTON-g is actively pushing the MEMS devices along the Technology Readiness Level scale (Héder, 2017), from a laboratory demonstration to a working field prototype, thus making successful commercial development much more likely.
NEWTON-g is also fostering the development of the first AQG able to withstand harsh outdoor conditions. If successful, this development will be a game-changer for absolute gravimetry. Indeed, current FFAGs are, generally, not well-suited for use in the field, require expert operators and cannot record data continuously for extended intervals (Van Camp et al., 2017). The NEWTON-g cold-atom gravimeter can perform continuous measurements at a high rate (2 Hz) over a long time interval (several years), is lighter and more portable than most current absolute gravimeters and is relatively straightforward to install and operate. With this device it is possible to record continuously at the reference site, interrupt the acquisition to take time-lapse measurements across an array of other points, and then return to the reference station, where the absolute continuous time series could be restarted without the need to apply any compensating corrections.
The combination of the two above technologies into a symbiotic sensor network is the key aspect of NEWTON-g. The project will offer the possibility to validate an entirely new gravity imaging modality (with MEMS sensors making the pixels of the gravity imager, and the quantum gravimeter providing the absolute reference). The data produced by the gravity imager will therefore have the potential to spark a paradigm change in the way gravity measurements are carried out. The beneficiaries of such a shift will not be isolated to the research community–multi-national companies/government agencies in defense, mineral exploitation, hydrology and civil engineering are watching the outcome of this project with interest.
The deployment of the gravity imager in the harsh volcanic environment, during the field-test phase of NEWTON-g, will be a valuable validation of the new technologies, that will greatly increase the trust placed in it by potential commercial users, if the devices are proven to work properly. We envisage that the best of terrain gravimetry is yet to come!
The original contributions presented in the study are included in the article, further inquiries can be directed to the corresponding author.
DCa led the conception, design and writing of the paper. LM and JG supervised the development of the quantum gravimeter and participated in the preparation of the manuscript. GH led the development of the MEMS gravimeter and contributed to writing the manuscript. ED and MK participated in the preparation of the first draft of the manuscript. ER led the writing of Forward Modeling of Volcano Processes and Potential for Risk Mitigation. AM led the development of the “MEMS station” and wrote the first draft of Field Implementation at Mt. Etna. KT participated in the development of the MEMS gravimeter and led the writing of Development of a MEMS Gravimeter Under Newton-g. KA, SB, GM, RM, AN, DP, and AP participated in the development of the MEMS gravimeter and contributed to the editing of the manuscript. VM and PV participated in the development of the quantum gravimeter and contributed to the editing of the manuscript. FG, DCo, and GS contributed to the development of the field infrastructures and to the editing of the manuscript. CB, CF, FC, and LP contributed to the editing of the manuscript.
NEWTON-g project funded by the the EC’s Horizon 2020 programme, under the FETOPEN-2016/2017 call (Grant Agreement No 801221).
The authors declare that the research was conducted in the absence of any commercial or financial relationships that could be construed as a potential conflict of interest.
We are indebted to Michael P. Poland, who contributed to inspire the project and to turn a promising idea into a successful outcome.
Acocella, V., Di Lorenzo, R., Newhall, C., and Scandone, R. (2015). An overview of recent (1988 to 2014) caldera unrest: knowledge and perspectives. Rev. Geophys. 53, 896–955. doi:10.1002/2015RG000492
Allan, D. W. (1966). Statistics of atomic frequency standards, Proc. IEEE. 54 (2), 221–230. doi:10.1109/PROC.1966.4634
Bagnardi, M., Poland, M. P., Carbone, D., Baker, S., Battaglia, M., and Amelung, F. (2014). Gravity changes and deformation at Kīlauea Volcano, Hawaii, associated with summit eruptive activity, 2009–2012. J. Geophys. Res. 119 (9), 7288–7305. doi:10.1002/2014JB011506
Battaglia, M., Roberts, C., and Segall, P. (1999). Magma intrusion beneath Long Valley Caldera confirmed by temporal changes in gravity. Science 285 (5436), 2119–2122. doi:10.1126/science.285.5436.2119
Bertolini, A., Beverini, N., Cella, G., De Salvo, R., Fidecaro, F., Francesconi, M., et al. (2004). Geometric anti-spring vertical accelerometers for seismic monitoring. Nucl. Instrum. Meth. A 518 (1–2), 233–235. doi:10.1016/j.nima.2003.10.069
Beyreuther, M., Barsch, R., Krischer, L., Megies, T., Behr, Y., and Wassermann, J. (2010). ObsPy: a python toolbox for seismology. Seismol. Res. Lett. 81 (3), 530–533. doi:10.1785/gssrl.81.3.530
Bidel, Y., Zahzam, N., Blanchard, C., Bonnin, A., Cadoret, M., Bresson, A., et al. (2018). Absolute marine gravimetry with matter-wave interferometry. Nat. Commun. 9, 627. doi:10.1038/s41467-018-03040-2
Bodart, Q., Merlet, S., Malossi, N., Pereira Dos Santos, F., Bouyer, P., and Landragin, A. (2010). A cold atom pyramidal gravimeter with a single laser beam. Appl. Phys. Lett. 96, 134101. doi:10.1063/1.3373917
Boom, B. A., Bertolini, A., Hennes, E., Brookhuis, R. A., Wiegerink, R. J., van den Brand, J. F. J., et al. (2017). “Nano-G accelerometer using geometric anti-springs,” in Proceeding of the IEEE 30th international conference on micro electro mechanical systems (MEMS), Las Vegas, NV, January 22–26, 2017. (IEEE), 33–36.
Bordé, C. J. (1989). Atomic interferometry with internal state labelling. Phys. Lett. A 140, 10–12. doi:10.1016/0375-9601(89)90537-9
Branca, S., Carbone, D., and Greco, F. (2003). Intrusive mechanism of the 2002 NE-Rift eruption at Mt. Etna (Italy) inferred through continuous microgravity data and volcanological evidences. Geophys. Res. Lett. 30 (20). doi:10.1029/2003GL018250
Budetta, G., Carbone, D., and Greco, F. (1999). Subsurface mass redistribution at Mount Etna (Italy) during the 1995–96 explosive activity detected by microgravity studies. Geophys. J. Int. 138 (1), 77–88. doi:10.1046/j.1365-246x.1999
Caldani, R., Weng, K. X., Merlet, S., and Pereira Dos Santos, F. (2019). Simultaneous accurate determination of both gravity and its vertical gradient. Phys. Rev. A 99, 033601. doi:10.1103/PhysRevA.99.033601
Carbone, D., Budetta, G., Greco, F., and Rymer, H. (2003). Combined discrete and continuous gravity observations at Mount Etna. J. Volcanol. Geotherm. Res. 123 (1–2), 123–135. doi:10.1016/S0377-0273(03)00032-5
Carbone, D., Cannavò, F., Greco, F., Reineman, R., and Warburton, R. J. (2019). The benefits of using a network of superconducting gravimeters to monitor and study active volcanoes, J. Volcanol. Geotherm. Res. 124, 4035–4050. doi:10.1029/2018JB017204
Carbone, D., and Poland, M. P. (2012). Gravity fluctuations induced by magma convection at Kīlauea Volcano, Hawai’I. Geology 40 (9), 803–806. doi:10.1130/G33060.1
Carbone, D., Poland, M. P., Diament, M., and Greco, F. (2017). The added value of time-variable microgravimetry to the understanding of how volcanoes work. Earth Sci. Rev. 169, 146–179. doi:10.1016/j.earscirev.2017.04.014
Carbone, D., Zuccarello, L., Messina, A., Scollo, S., and Rymer, H. (2015). Balancing bulk gas accumulation and gas output before and during lava fountaining episodes at Mt. Etna. Sci. Rep. 5, 18049. doi:10.1038/srep18049
Carbone, D., Zuccarello, L., and Saccorotti, G. (2008). Geophysical indications of magma uprising at Mt. Etna during the December 2005 to January 2006 non-eruptive period. Geophys. Res. Lett. 35 (6). doi:10.1029/2008GL033212
Carbone, D., Zuccarello, L., Saccorotti, G., and Greco, F. (2006). Analysis of simultaneous gravity and tremor anomalies observed during the 2002–2003, Etna eruption. Earth Planet. Sci. Lett. 245 (3–4), 616–629. doi:10.1016/j.epsl.2006.03.055
Chapman, D. S., Sahm, E., and Gettings, P. (2008). Monitoring aquifer recharge using repeated high-precision gravity measurements: a pilot study in South Weber, Utah. Geophysics 73 (6), WA83–WA93. doi:10.1190/1.2992507
Farah, T., Guerlin, C., Landragin, A., Bouyer, P., Gaffet, S., Pereira Dos Santos, F., et al. (2014). Underground operation at best sensitivity of the mobile LNE-SYRTE cold atom gravimeter. Gyroscopy Navig. 5, 266–274. doi:10.1134/S2075108714040051
Freier, C., Hauth, M., Schkolnik, V., Leykauf, B., Schilling, M., Wziontek, M., et al. (2016). Mobile quantum gravity sensor with unprecedented stability. J. Phys. Conf. 723, 012050. doi:10.1088/1742-6596/723/1/012050
Furuya, M., Okubo, S., Kimata, F., Miyajima, R., Meilano, I., Sun, W., et al. (2003b). Mass budget of the magma flow in the 2000 volcano-seismic activity at Izu-islands, Japan. Earth Planets Space. 55, 375–385. doi:10.1186/BF0335177
Furuya, M., Okubo, S., Sun, W., Tanaka, Y., Oikawa, J., Watanabe, H., et al. (2003a). Spatiotemporal gravity changes at Miyakejima volcano: Japan: caldera collapse, explosive eruptions and magma movement. J. Geophys. Res. 108 (B4), 2219. doi:10.1029/2002JB001989
Gasperikova, E., and Hoversten, G. M. (2008). Gravity monitoring of CO2 movement during sequestration: model studies. Geophysics 73 (6), WA105–WA112. doi:10.1190/1.2985823
Gilbert, J. S., and Lane, S. J. (2008). “The consequences of fluid motion in volcanic conduits,” in Fluid motions in volcanic conduits: a source of seismic and acoustic signals. Editors S. J. Lane and J. S. Gilbert (London, UK: Geological Society, Special Publications), Vol. 307, 1–10.
Gillot, P., Francis, O., Landragin, A., Pereira Dos Santos, F., and Merlet, S. (2014). Stability comparison of two absolute gravimeters: optical versus atomic interferometers. Metrologia 51, L15. doi:10.1088/0026-1394/51/5/L15
Gottsmann, J., Carniel, R., Coppo, N., Wooller, L., Hautmann, S., and Rymer, H. (2007). Oscillations in hydrothermal systems as a source of periodic unrest at caldera volcanoes: multiparameter insights from Nisyros, Greece. Geophys. Res. Lett. 34, L07307. doi:10.1029/2007GL029594
Héder, M. (2017). From NASA to EU: the evolution of the TRL scale in public sector innovation. Innov. J. 22, 1–23.
Heimann, S., Kriegerowski, M., Isken, M., Cesca, S., Daout, S., Grigoli, F., et al. (2017). Pyrocko - an open-source seismology toolbox and library. V. 0.3. Potsdam, Germany: GFZ Data Services. doi:10.5880/GFZ.2.1.2017.001
Hinderer, J., Calvo, M., Abdelfettah, Y., Hector, B., Riccardi, U., Ferhat, G., et al. (2015a). Monitoring of a geothermal reservoir by hybrid gravimetry; feasibility study applied to the Soultz-sous-Forêts and Rittershoffen sites in the Rhine graben. Geotherm. Energy. 3, 16. doi:10.1186/s40517-015-0035-3
Hinderer, J., Crossley, D., and Warburton, R. J. (2015b). “3.04 - superconducting gravimetry,” in Treatise on geophysics. 2nd Edn, Editor G. Schubert (Oxford, UK: Elsevier), 59–115.
Hinderer, J., Hector, B., Mémin, A., and Calvo, M. (2016). “Hybrid gravimetry as a tool to monitor surface and underground mass changes,” in International symposium on earth and environmental sciences for future generations. Editors J. T. Freymueller and L. Sánchez International association of geodesy symposia. (Cham, Switzerland:Springer), Vol. 147.
Hu, Z., Sun, B., Duan, X., Zhou, M., Chen, L., Zhan, S., et al. (2013). Demonstration of an ultrahigh-sensitivity atom-interferometry absolute gravimeter, Phys. Rev. A 88, 043610. doi:10.1103/PhysRevA.88.043610
Huang, P., Tang, B., Chen, X., Zhong, J., Xiong, Z., Zhou, L., et al. (2019). Accuracy and stability evaluation of the 85Rb atom gravimeter WAG-H5-1 at the 2017 international comparison of absolute gravimeters. Metrologia 56 (4), 045012. doi:10.1088/1681-7575/ab2f01
Kasevich, M., and Chu, S. (1991). Atomic interferometry using stimulated Raman transitions. Phys. Rev. Lett. 67, 181–184. doi:10.1103/PhysRevLett.67.181
Kasevich, M., and Chu, S. (1992). Laser cooling below a photon recoil with three-level atoms. Phys. Rev. Lett. 69, 1741. doi:10.1103/PhysRevLett.69.1741
Kennedy, J., Ferré, T. P. A., Güntner, A., Abe, M., and Creutzfeldt, B. (2014). Direct measurement of subsurface mass change using the variable baseline gravity gradient method, Geophys. Res. Lett. 41 (8), 2827–2834. doi:10.1002/2014GL059673
Lautier, J., Volodimer, L., Hardin, T., Merlet, S., Lours, M., Pereira Dos Santos, F., et al. (2014). Hybridizing matter-wave and classical accelerometers. Appl. Phys. Lett. 105, 144102. doi:10.1063/1.4897358
Lévèque, T., Antoni-Micollier, L., Faure, B., and Berthon, J. (2014). A laser setup for rubidium cooling dedicated to space applications. Appl. Phys. B 116, 997–1004. doi:10.1007/s00340-014-5788-z
Ménoret, V., Geiger, R., Stern, G., Zahzam, N., Battelier, B., Bresson, A., et al. (2011). Dual-wavelength laser source for onboard atom interferometry. Opt. Lett. 36 (21), 4128–4130. doi:10.1364/OL.36.004128
Ménoret, V., Vermeulen, P., Le Moigne, N., Bonvalot, S., Bouyer, P., Landragin, A., et al. (2018). Gravity measurements below 10−9g with a transportable absolute quantum gravimeter. Sci. Rep. 8, 12300. doi:10.1038/s41598-018-30608-1
Merlet, S., Le Gouët, J., Bodart, Q., Clairon, A., Landragin, A., Pereira Dos Santos, F., et al. (2009). Operating an atom interferometer beyond its linear range. Metrologia 46, 265–274. doi:10.1088/0026-1394/46/1/011
Merriam, J. B. (1992). Atmospheric pressure and gravity. Geophys. J. Int. 109, 488–500. doi:10.1111/j.1365-246X.1992.tb00112.x
Middlemiss, R. P., Bramsiepe, S. G., Douglas, R., Hough, J., Paul, D. J., Rowan, S., et al. (2017). Field tests of a portable MEMS gravimeter. Sensors 17 (11), 2571. doi:10.3390/s17112571
Middlemiss, R. P., Samarelli, A., Paul, D. J., Hough, J., Rowan, S., and Hammond, G. D. (2016). Measurement of the Earth tides with a MEMS gravimeter. Nature 531 (7596), 614–617. doi:10.1038/nature17397
Nabighian, M. N., Ander, M. E., Grauch, V. J. S., Hansen, R. O., LaFehr, T. R., Li, Y., et al. (2005). Historical development of the gravity method in exploration. Geophysics 70 (6), 63ND–89ND. doi:10.1190/1.2133785
Niebauer, T. M., Sasagawa, G. S., Faller, J. E., Hilt, R., and Klopping, F. (1995). A new generation of absolute gravimeters. Metrologia 32, 159–180. doi:10.1088/0026-1394/32/3/004
Nikkhoo, M., Rivalta, E., Carbone, D., and Cannavò, F. (2020). “Analytical and numerical optimization of gravimetric networks: a case study from Mount Etna, Italy,” in EGU general assembly 2020, Online, May 4–8, 2020. (Munich, Germany: EGU General Assembly), EGU2020-4647.
Prasad, A., Bramsiepc, S. G., Middlemiss, R. P., Hough, J., Rowan, S., Hammond, G. D., et al. (2018). A portable MEMS gravimeter for the detection of the Earth tides. New Delhi, India: IEEE SENSORS, 1–3. doi:10.1109/ICSENS.2018.8589884
Prasad, A., Toland, K., Noack, A., Anastasiou, K., Middlemiss, R., Paul, D. J., et al. (2020). A high-sensitivity, low-drift MEMS relative gravimeter for multi-pixel imaging applications. Munich, Germany: EGU General Assembly.
Riccardi, U., Hinderer, J., Boy, J.-P., and Rogister, Y. (2009). Tilt effects on GWR superconducting gravimeters. J. Geodyn., 48 (3–5), 316–324. doi:10.1016/j.jog.2009.09.001
Rymer, H., Murray, J. B., Brown, G. C., Ferrucci, F., and McGuire, W. J. (1993). Mechanisms of magma eruption and emplacement at Mt. Etna between 1989 and 1992. Nature 361 (6411), 439–441. doi:10.1038/361439a0
Sabulsky, D. O., Junca, J., Lefèvre, G., Zou, X., Bertoldi, A., Battelier, B., et al. (2020). A fibered laser system for the MIGA large scale atom interferometer. Sci. Rep. 10, 3268. doi:10.1038/s41598-020-59971-8
Sugihara, M., and Ishido, T. (2008). Geothermal reservoir monitoring with a combination of absolute and relative gravimetry. Geophysics 73 (6), WA37–WA47. doi:10.1190/1.2991105
Theron, F., Carraz, O., Renon, G., Zahzam, N., Bidel, Y., Cadoret, M., et al. (2015). Narrow linewidth single laser source system for onboard atom interferometry. Appl. Phys. B 118, 1–5. doi:10.1007/s00340-014-5975-y
Trani, L., Koymans, M., Atkinson, M., Sleeman, R., and Filgueira, R. (2017). WFCatalog: a catalogue for seismological waveform data. Comput. Geosci. 106, 101–108. doi:10.1016/j.cageo.2017.06.008
Van Camp, M., de Viron, O., Pajot-Métivier, G., Casenave, F., Watlet, A., Dassargues, A., et al. (2016). Direct measurement of evapotranspiration from a forest using a superconducting gravimeter. Geophys. Res. Lett. 43, 10225–10231. doi:10.1002/2016GL070534
Van Camp, M., de Viron, O., Watlet, A., Meurers, B., Francis, O., and Caudron, C. (2017). Geophysics from terrestrial time-variable gravity measurements. Rev. Geophys. 55, 938–992. doi:10.1002/2017RG000566
Keywords: time gravity changes, gravimetry, gravimeter, volcano monitoring network, forward modelling of gravity anomalies
Citation: Carbone D, Antoni-Micollier L, Hammond G, de Zeeuw - van Dalfsen E, Rivalta E, Bonadonna C, Messina A, Lautier-Gaud J, Toland K, Koymans M, Anastasiou K, Bramsiepe S, Cannavò F, Contrafatto D, Frischknecht C, Greco F, Marocco G, Middlemiss R, Ménoret V, Noack A, Passarelli L, Paul D, Prasad A, Siligato G and Vermeulen P (2020) The NEWTON-g Gravity Imager: Toward New Paradigms for Terrain Gravimetry. Front. Earth Sci. 8:573396. doi: 10.3389/feart.2020.573396
Received: 16 June 2020; Accepted: 15 September 2020;
Published: 09 October 2020.
Edited by:
Pier Paolo Bruno, University of Naples Federico II, ItalyReviewed by:
Vojtech Pálinkáš, Research Institute of Geodesy, Topography and Cartography, CzechiaCopyright © 2020 Carbone, Antoni-Micollier, Hammond, De Zeeuw-van Dalfsen, Rivalta, Bonadonna, Messina, Lautier-Gaud, Toland, Koymans, Anastasiou, Bramsiepe, Cannavo', Contrafatto, Frischknecht, Greco, Marocco, Middlemiss, Ménoret, Noack, Passarelli, Paul, Prasad, Siligato and Vermeulen. This is an open-access article distributed under the terms of the Creative Commons Attribution License (CC BY). The use, distribution or reproduction in other forums is permitted, provided the original author(s) and the copyright owner(s) are credited and that the original publication in this journal is cited, in accordance with accepted academic practice. No use, distribution or reproduction is permitted which does not comply with these terms.
*Correspondence: D. Carbone, ZGFuaWVsZS5jYXJib25lQGluZ3YuaXQ=
Disclaimer: All claims expressed in this article are solely those of the authors and do not necessarily represent those of their affiliated organizations, or those of the publisher, the editors and the reviewers. Any product that may be evaluated in this article or claim that may be made by its manufacturer is not guaranteed or endorsed by the publisher.
Research integrity at Frontiers
Learn more about the work of our research integrity team to safeguard the quality of each article we publish.