- 1Departamento de Física de la Tierra y Astrofísica, Facultad de CC. Físicas, Universidad Complutense de Madrid, Madrid, Spain
- 2Instituto de Geociencias IGEO (CSIC, UCM), Madrid, Spain
- 3Instituto Andaluz de Geofisica, Universidad de Granada, Granada, Spain
- 4Departamento de Fisica Teorica y del Cosmos, Facultad de Ciencias, Universidad de Granada, Granada, Spain
Lithospheric tearing at slab edges is common in scenarios where retreating slabs face continental margins. Such tearing is often accommodated via subvertical STEP (Subduction-Transform Edge Propagator) faults that cut across the entire lithosphere and can result in sharp lateral thermal and rheological variations across the juxtaposed lithospheres. This setting favors the occurrence of continental delamination, i.e., the detachment between the crust and the lithospheric mantle. In order to evaluate this hypothesis, we have chosen a well-studied natural example recently imaged with unprecedented seismic resolution: the STEP fault under the central Betic orogen, at the northern edge of the Gibraltar Arc subduction system (westernmost Mediterranean Sea). The Gibraltar Arc subduction is the result of the fast westward roll-back of the Alboran slab and it is in its last evolutionary stage, where the oceanic lithosphere has been fully consumed and the continental lithosphere attached to it collides with the overriding plate. In this study we investigate by means of thermo-mechanical modeling the conditions for, and consequences of, delamination post-dating slab tearing in the central Betics. We consider a setup based on a STEP fault separating the orogenic Betic lithosphere and the adjacent thinned lithosphere of the overriding Alboran domain. Our model analysis indicates that delamination is very sensitive to the initial thermal and rheological conditions, transitioning from a stable to a very unstable and rapidly evolving regime. We find two clearly differentiated regimes according to the time at which the process becomes unstable: fast and slow delamination. Although the final state reached in both the fast and slow regimes is similar, the dynamic surface topography evolution is dramatically different. We suggest that given a weak enough Iberian lower crust the delaminating lithospheric mantle peels off the crust and adopts a geometry consistent with the imaged southward dipping Iberian lithosphere in the central Betics. The lack of spatial correspondence between the highest topography and the thickest crust, as well as the observed pattern of uplift/subsidence are properly reproduced by a model where relatively fast delamination (Reference Model) develops after slab tearing.
Introduction
A Subduction-Transform Edge Propagator fault (STEP fault, as termed by Govers and Wortel, 2005) is a subvertical fault that tears a subducted slab at its edges facilitating subduction continuation in narrowed arcs. Tearing at slab edges is a consequence of lateral changes in the rate of subduction rollback, which in turn can be the result of lateral variation of slab buoyancy. Govers and Wortel (2005) identified about a dozen of STEP faults, being prominent examples the north end of the Tonga trench, the south end of New Hebrides trench, south Lesser Antilles trench and the north end of the South Sandwich trench. In addition to these reported examples in oceanic domains, a large number of STEP faults have been identified in the Mediterranean region: both ends of the Hellenic and Calabria trenches, the south edge of the Vrancea trench (Carpathians), and both edges of the western Mediterranean subduction system (Gibraltar Arc) (see Govers and Wortel, 2005; Özbakır et al., 2020; and references therein).
STEP faults cut across the entire lithosphere and eventually lead to sharp lateral contrasts in the thermal and rheological structure of juxtaposed lithospheres. This contrast is expected to be particularly important in the Mediterranean region, where “land-locked” basins surrounded by orogenic belts show significant thinning due to back-arc extension related to slab rollback. Vertical slab tearing would then put into direct contact thinned continental/oceanic lithosphere and normal or even thickened orogenic continental lithosphere of very different densities. The buoyancy forces associated with this density contrast generate mantle flow that can trigger continental delamination (edge-delamination), as proposed for the Betics STEP (Mancilla et al., 2013; Mancilla et al., 2015a; Heit et al., 2017) and for the Tell-Rif STEP in NW Algeria (Hidas et al., 2019). This scenario of delamination developing after slab tearing is completely different from other studies (e.g., Duggen et al., 2005; Faccenda et al., 2009; Gogus et al., 2011; Ueda et al., 2012; Levander et al., 2014; Baratin et al., 2016) where delamination operates in conjunction with slab sinking.
The 2D modeling presented here is inspired on the best imaged example of STEP fault, namely the fault associated with slab tearing along the eastern and central Betics, in the southern Iberian margin (Figure 1). To that aim we use recently obtained seismic images of the crustal and lithospheric structure of the area for comparison purposes with numerical simulations. The goal of this study is to consider this natural example to investigate by means of thermo-mechanical modeling the first order conditions for, and consequences of, lithospheric delamination after slab tearing via STEP faults. Here we focus on the central Betics area, where topography evolution and the crustal and lithospheric structure point to the occurrence of ongoing delamination (Figure 1).
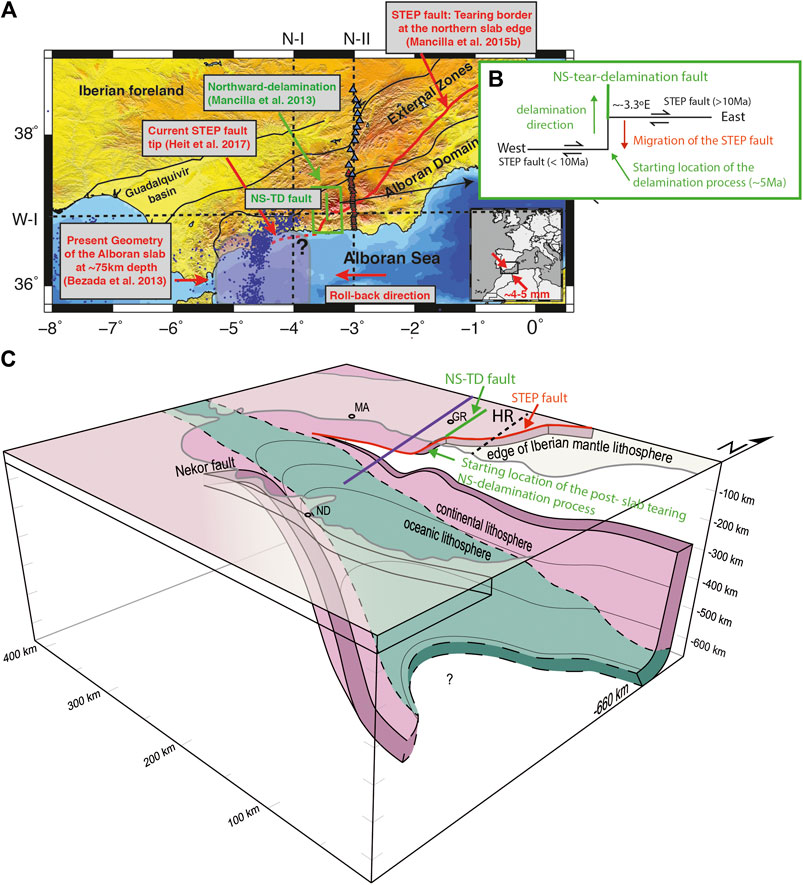
FIGURE 1. (A) Topography map with the boundary of the main tectonic units of the Betic domain and foreland. The continuous red line marks the edge of the Iberian crust, i.e., the tearing border produced by a Subduction-Transform Edge Propagator (STEP) fault imaged by the P-receiver functions (Mancilla et al., 2015a) and the red dashed line indicates the presumably current tip position of this STEP fault (Heit et al., 2017). The green square marks the area investigated by this paper as prone for a delamination processes directed toward the north, perpendicular to the STEP fault. The purple transparent area delimits the positive velocity anomaly at 75 km depth described in the tomography study of Bezada et al. (2013) associated with the oceanic Alboran slab. Red triangles are the location of the first leg of the Hire seismic profile (∼2 km inter-station distance, HIRE-I), blue triangles the second leg (∼10 km inter-station distance, HIRE-II). Black dashed lines mark the locations of the P-wave receiver functions profiles of Figure 2: N-I (Figure 2A); N-II (Figure 2B) and W-I (Figure 2C). The inset map shows the collision direction of the Iberia and Africa plates. (B) Sketch of the relationship between the NS-tear delamination fault (TD-fault, green line), that allows the northwards migration of the delamination process, and the STEP fault that facilitates the slab rollback motion toward the west of the western Mediterranean subduction system. (C) Sketch of the proposed geometry by Mancilla et al. (2015b), of the underthrusted Iberian and Maghrebian lithospheres and their relation with the subducted oceanic slab observed by tomographic studies (Spakman and Wortel, 2004; Bezada et al., 2013; Villaseñor et al., 2015). Purple line marks the location of the generic modeled cross section (MA, Malaga; GR, Granada; ND, Nador; HR, Hire seismic profile A).
Geodynamic Setting
The Betic-Rif orogenic belt, located in southern Iberian and northwestern African margins, represents the westernmost expression of the Alpine orogeny (Figure 1). It comprises the Gibraltar Arc and surrounds the extensional Alboran basin. This area is presently characterized by moderate seismicity and diffuse deformation, as a result of the slow convergence between Eurasia and Nubia (e.g., Negredo et al., 2002; Jiménez-Munt and Negredo, 2003; Cunha et al., 2012).
A number of tomographic studies have imaged a high-velocity body extending across the entire upper mantle beneath the Betics and Gibraltar Arc (e.g., Gutscher et al., 2002; Spakman and Wortel, 2004; Bezada et al., 2013; Palomeras et al., 2014; Villaseñor et al., 2015). This anomalous body has a slab-like geometry and most likely corresponds to subducted oceanic lithosphere, in the so-called western Mediterranean subduction system. This system is currently in its last evolutionary stage and does not seem to be presently active (e.g., Stich et al., 2006; Iribarren et al., 2007; Zitellini et al., 2009), although this remains the object of debate (see extensive revision by Gutscher et al., 2012). At the northern edge of this system a slab tearing process has been proposed (e.g., Faccenna et al., 2004; Duggen et al., 2004; Spakman and Wortel, 2004; Duggen et al., 2005; Govers and Wortel, 2005; García-Castellanos and Villaseñor, 2011; Mancilla et al., 2013; Chertova et al., 2014; Mancilla et al., 2015a; Mancilla et al., 2015b; Mancilla et al., 2018) and an associated vertical STEP fault has been imaged by P-wave Receiver Functions (RF) (Mancilla et al., 2015a; Mancilla et al., 2018). This tearing affects the eastern and central Betics (Figure 1), where it is shown as an abrupt change in lithospheric and crustal thickness across the STEP fault (Figures 2, 3), while the slab seems to be connected to the surface further to the west (e.g. Spakman and Wortel, 2004; García-Castellanos and Villaseñor, 2011; Bezada et al., 2013; Mancilla et al., 2013; Spakman et al., 2018; Jiménez-Munt et al., 2019; Molina-Aguilera et al., 2019) (Figure 1C).
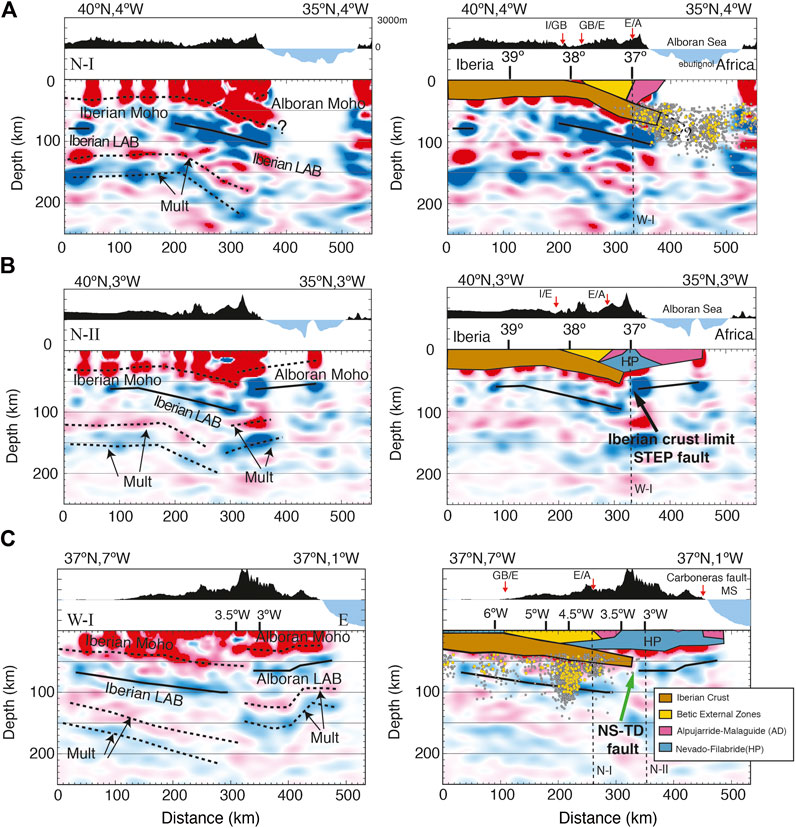
FIGURE 2. Common conversion point images build with P-wave Receiver Functions (left panels) and their interpretation sketches (right panels). (A,B) are NS-cross-sections (N-I and N-2 see Figure 1) is WE-cross-section (W-I). In the stacked images, red colors (positive amplitudes) in a seismic discontinuity mean velocity increase with depth. The dashed black lines mark the inferred conversion depth of the Ps converted phase at the crustal-mantle boundary (the Moho discontinuity) and its first multiple reverberated phases generated at this discontinuity. Multiples (abbreviated Mult), although not migrated to their correct geometrical position, are useful to confirm the trend of the Moho discontinuity. Continuous black lines draw the Lithosphere-Asthenosphere boundary (LAB). At the top of each panel, we display the topography along the profile. Red arrows mark the contact, at the surface, between the different units (I, Iberian Massif; E, External zones; A, Alboran domain; GB, Guadalquivir basin). Common conversion point images modified from Mancilla and Diaz (2015). We plot the intermediate seismicity (depths >40 km; gray dots) for the ISC catalog together with the higher precision relocations of some of them from Santos-Bueno et al. (2019) (yellow dots). Vertical thin dashed lines are the crossing points with the other profiles in the figure.
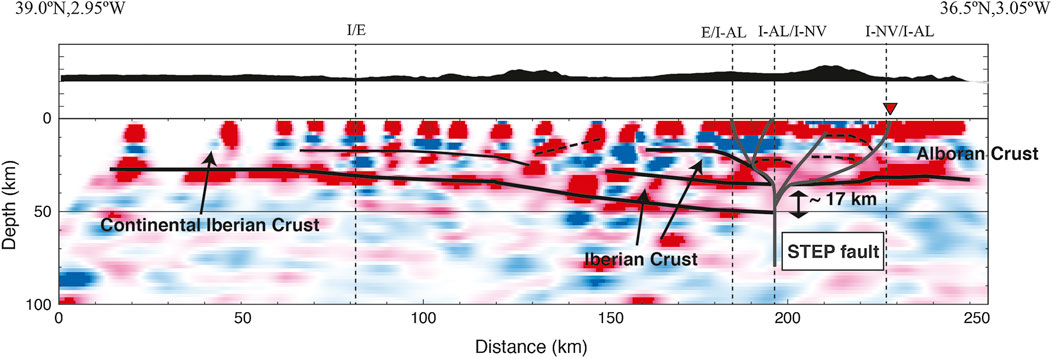
FIGURE 3. Migrated Common conversion point images using P-wave receiver functions of the high density profile HIRE (triangles in Figure 1A) probing the crustal structure in central Betics. We overlap the images with our interpretations along the section: The crust-mantle boundary (Iberian and Alboran Moho, thick black lines), intracrustal converters (thin and dashed black lines) and the Subduction-Transform Edge Propagator fault and its continuation toward the surface as positive flower structure (gray lines). This image is a modification of the one published in Mancilla et al. (2018). For the details about the image construction and receiver function calculation see the source paper.
Different mechanisms have been proposed to explain the complex tectonic evolution of the area since the Miocene, the most popular being slab retreat (Lonergan and White, 1997; Faccenna et al., 2004; Vergès and Fernàndez, 2012; Chertova et al., 2014; van Hinsbergen et al., 2014). On the other hand, models proposing continental delamination, understood as the separation between the crust and lithospheric mantle (as originally proposed by Bird, 1978; Bird, 1979) are gaining popularity, either proposed as delamination alone (e.g., Seber et al., 1996; Calvert et al., 2000; Fadil et al., 2006; Valera et al., 2008; Baratin et al., 2016) or related to slab tearing (e.g., Duggen et al., 2003; Duggen et al., 2004; Duggen et al., 2005; Martínez-Martínez et al., 2006; Booth-Rea et al., 2007; Mancilla et al., 2013; Mancilla et al., 2015a; Heit et al., 2017). A detailed comparison between these conceptual models and the inferences from our modeling will be carried out in the Discussion section.
Model Constraints From Present-Day Lithospheric Seismic Structure
The Betic-Rif belt is the result of the overthrusting of the Alboran domain onto the South Iberian and North Maghrebian passive continental paleomargins. The orogen was formed by the westward collision of the Alboran domain during the Miocene (e.g., Platt et al., 2003). A number of recent studies based on seismic receiver functions have mapped the geometry of this collision (Figures 2, 3) and the STEP fault trace along the south Iberian Peninsula or south Iberia (red line in Figure 1A) revealing an abrupt east-west change in the underthrusted Iberian lithosphere beneath the Alboran domain at longitudes ∼3.3°W (Mancilla et al., 2013; Mancilla et al., 2015a; Figure 2C). The location of this lateral change coincides with a migration toward the south of the STEP fault trace (Figure 1B). This change occurs in a very narrow area, suggesting that the underthrusting plate may be broken by a N-S directed tear fault, at a longitude about 3.3°W (green line in Figures 1, 2C). Since this fault enables the northwards progression of delamination in the central Betics, we term it “Tear-Delamination” fault (TD-fault).
East of the TD-fault, common conversion point images obtained from P-wave RF at a high density passive seismic profile (Figure 1 for location) reveal that the underthrusting lithosphere of the South Iberian paleomargin ends with a sharp Moho and lithospheric step of ∼17 and 40 km, respectively (Figure 3; Mancilla et al., 2018 for details). This abrupt ending is related to a near-vertical STEP fault tearing the slab and guiding its rollback motion toward the west (Mancilla et al., 2018).
On the other hand, west of the North-South TD (NS-TD) fault, the underthrusted Iberian lithosphere dips southwards (Figure 2A), with the dip angle increasing eastwards (see eastward deepening of seismic lithosphere-asthenosphere boundary in Figure 2C) so that it reaches depths close to the TD fault about 70 km deeper than under the Gibraltar Arc (Mancilla et al., 2013; Mancilla et al., 2015a). The southern location reached by the Iberian lithosphere west of the TD fault indicates a southward migration of the locus of the STEP fault (Figure 1B). This is supported by the localization of the intermediate seismicity (depths >40 km; gray and yellow dots, Figures 2A,C), which is interpreted as delineating the tip of the lateral slab tearing (Heit et al., 2017; Santos-Bueno et al., 2019), i.e., the currently active segment of the STEP fault.
Several lines of evidence suggest that northwards mantle delamination is likely occurring west of the TD fault (see Mancilla et al., 2013 for details). Among them, the fast mean uplift of 0.5 mm/yr during last <8 Ma (Azañón et al., 2015) that produces asymmetry in the topography between the western and eastern sides of Sierra Nevada mountains (different ∼500 m in the highest altitude), together with the lack of correspondence between highest topography and thickest crust root, indicates that the topography could be partly supported by asthenospheric upwelling related to continental delamination (Mancilla et al., 2013; Mancilla et al., 2015a). GPS velocities and seismic deformation pattern also support this idea (Mancilla et al., 2013). The delaminated lithospheric mantle would peel off the crust and adopt a geometry consistent with the imaged southward dipping Iberian lithosphere in the central Betics (Figure 2A).
In this study we examine possible lithospheric configurations in the collisional contact between Iberian and Alboran domains that allow edge-delamination at the western side of the TD fault in central Betics after the tearing process caused by the westward propagation of the STEP fault.
Methodology
Fundamental Equations and Model Setup
Here we use the finite element open source code ASPECT 2.1 (Kronbirchler et al., 2012; Bangerth et al., 2019) to solve the coupled equations of conservation of mass, momentum and energy (Eqs 1–3) for a 2D vertical section of an incompressible fluid. We adopt the Boussinesq approximation, and therefore we assume that the density is constant in all the equations except for the buoyancy term (right hand term in Eq. 2) of the momentum equation. In addition, as the reference temperature is assumed to be constant, the adiabatic and shear heating are neglected in the energy equation. Then the equations of mass, momentum and energy adopt the following form:
where, u is the velocity field, µ is the viscosity, ε(u) is the strain rate tensor, p is the pressure, ρ is the density, ρ0 is the reference density, g is the gravity acceleration, Cp is the specific heat, T is the temperature, k is the thermal conductivity, H is radiogenic heat production per unit mass. We neglect latent heat release due to phase transformation. We consider that the density satisfies the simple relationship ρ = ρ0 (1 − α (T − T0)), being α a small thermal expansion coefficient and ρ0 the reference density that is attained at a temperature T0. The Boussinesq approximation has great computational advantages as the algebraic systems of equations become much easier to solve. This is very useful particularly for a computationally demanding modeling as is the case of delamination incorporating a free surface on its top. This approximation is acceptable for the present modeling since we reproduce a relatively short-term evolution (<10 Myr) involving depths less than about 250 km, and therefore the range of variation of density with depth (pressure) is relatively small.
ASPECT has two particular advantages for modeling continental delamination: the adaptive mesh refinement (AMR) and the incorporation of a true free surface with stress-free boundary conditions on the top boundary (Rose et al., 2017). AMR allows for selective mesh refinement in areas of strong gradients in the material properties, while a coarser mesh can be used in areas with low velocities and/or smooth gradients of material properties. This feature allows robust modeling of high viscosity contrasts of >3–4 orders of magnitude on small length scales, as it is the case between the lower crust and upper lithospheric mantle. The free surface feature allows for self-consistent modeling of the surface dynamic response to mass redistribution during delamination. However, modeling free surfaces is a challenging problem (e.g., Kaus et al., 2010; Rose et al., 2017) and requires taking small time steps and the application of stabilization procedures to avoid instabilities in the free surface. We have performed a number of simulations to select the stabilization parameters giving a good compromise between stability and accuracy (see explanations in Bangerth et al., 2019). The modeled domain simulates a 2-D vertical section running N-S at a longitude of about 3.5°W (purple line in Figure 1C), with horizontal and vertical extents of 1,320 and 660 km, respectively (Figure 4). We checked that this size of the modeled domain is enough to prevent boundary effects. We will use the terms “Iberian” and “Alboran” to describe the simulations thereafter (Figure 4). Model parameters are compiled in Table 1. The initial setup simulates the initial contact of the thickened Iberian lithosphere under the central Betics and the thinned back-arc lithosphere of the Alboran Sea guided by the STEP fault. The model domain includes the upper and lower crusts, the lithospheric mantle and the asthenosphere, defined by different compositional fields. Although the parameters of the lithospheric mantle and asthenosphere are exactly the same (density differences just due to temperature variations), we have defined a specific body for the Betic lithospheric mantle to better track its evolution as it peels off the crust. We do not include in our modeling the deeper sinking slab since we assume that it was detached prior to delamination and therefore it has not any mechanical effect at shallower depths. The specific values of the initial thicknesses of the layers are based on a number of seismic receiver functions profiles reporting a 17 km step in the Moho depth between the Iberian and the Alboran crusts in the eastern Betics (Mancilla et al., 2015a; Mancilla et al., 2018). The geometric parameters (layer thicknesses) defining the crustal and lithospheric structure in the Iberian and Alboran domains are based on a number of geophysical modeling studies (e.g., Fullea et al., 2007; Fullea et al., 2010; Carballo et al., 2015; Mancilla and Diaz, 2015; Torné et al., 2015).
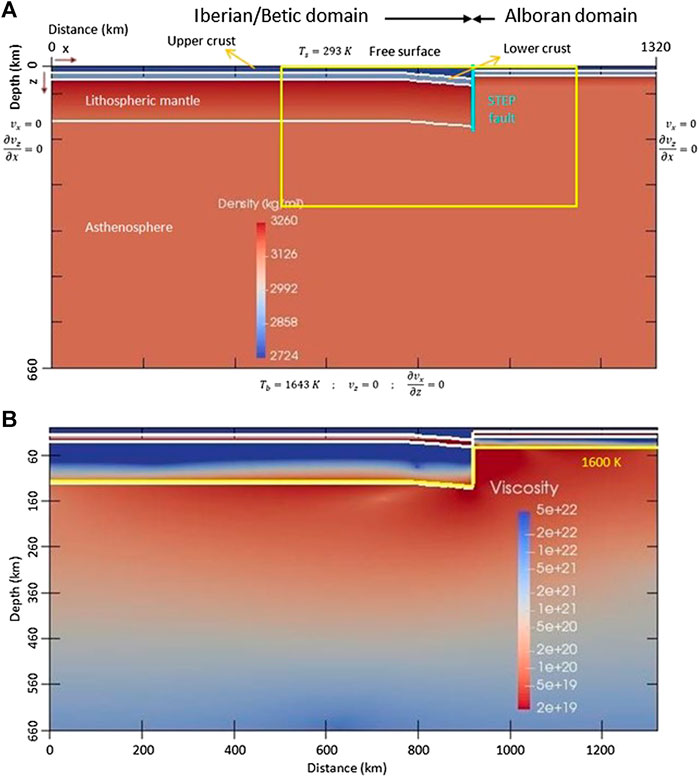
FIGURE 4. Model setup for the Reference Model with the (A) initial density distribution and boundary conditions. The contour of the Iberian mantle lithosphere is shown for better understanding the evolution of delamination, albeit having the same composition and parameters as the asthenosphere and Alboran lithospheric mantle. (B) Initial viscosity distribution (units Pa s) and 1,600 K isotherm to show the initial lithospheric thickness.
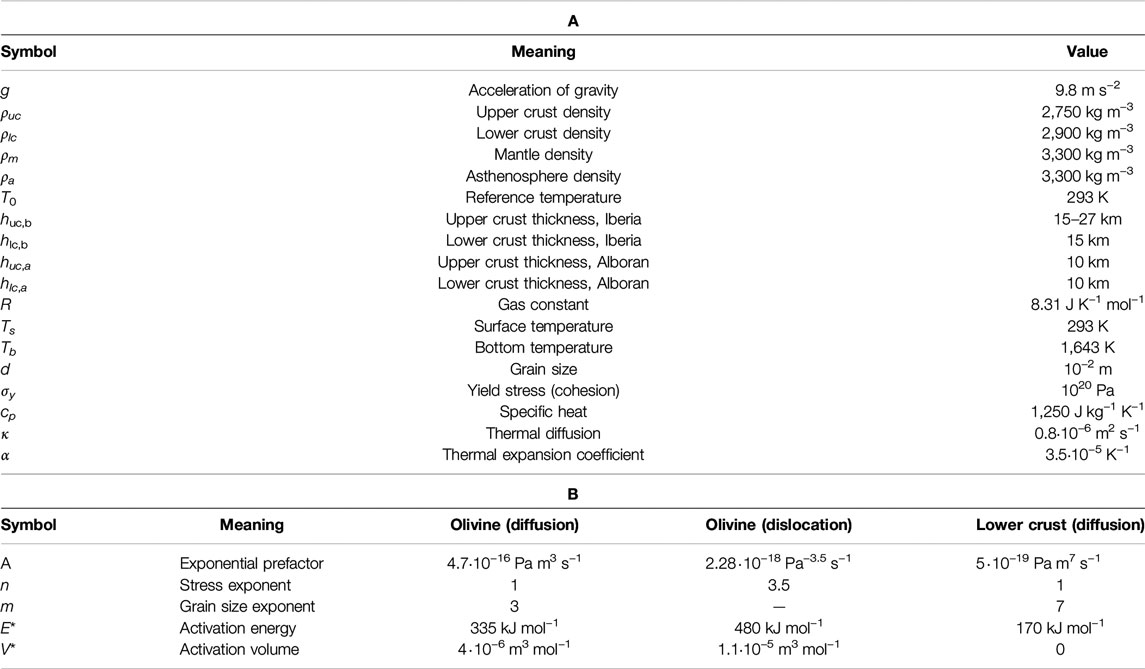
TABLE 1. (A) . (B) Parameters considered for a wet-olivine rheology (Hirth and Koldstedt 2003) and feldspar (Bürgmann and Dresen, 2008).
Previous studies on continental delamination introduce an increased reference density in the delaminating lithospheric mantle to force delamination initiation (e.g., Göğüs and Pysklywec 2008; Bajolet et al., 2012; Göğüs et al., 2016). Alternatively, a common assumption in delamination studies is that delamination develops in conjunction with, and in response to the negative buoyancy of a deep sinking slab (e.g., Duggen et al., 2003; Duggen et al., 2005; Faccenda et al., 2009; Göğüş et al., 2011; Ueda et al., 2012; Baratin et al., 2016). In contrast, in our post slab-tearing setup, slab pull does not act and the driving mechanism is the buoyancy forces arising from the lateral thermal contrast between the orogenic central Betic lithosphere and the thinned Alboran lithosphere. Slab detachment and related uplift occurring prior to delamination is attested by the pre-Messinian marine–continental transition in the Betic internal basins being presently at altitudes of about 1,000 m, with ages of marine to non-marine transition between 7.2 and 5.3 for the central Betics (Iribarren et al., 2009; see interpretation in terms of slab tearing by García-Castellanos and Villaseñor, 2011).
In this way we avoid additional forcing of the model setup to develop delamination. For the same reason, we do not introduce any asthenospheric channel or weak zone in the lithospheric mantle to enable asthenospheric upwelling and inflow into the lower crust, as it is commonly done in delamination models (e.g., Göğüs and Pysklywec, 2008; Valera et al., 2008; Valera et al., 2011; Bajolet et al., 2012; Göğüs et al., 2016; see revision in Göğüş and Ueda, 2018).
The initial temperature distribution is a conductive profile in the lithosphere, with a linear increase from 20°C at the surface to Tm = 1370°C at the base of the lithosphere. In the sub-lithospheric mantle we assume initial constant temperature of Tm (i.e., negligible adiabatic gradient). The temperature is kept at the initial values at the vertical and horizontal model boundaries. Mechanical boundary conditions are free slip at the lateral and bottom boundaries, and a true free-surface condition at the top boundary to account for topography evolution. We do not apply a lateral boundary condition accounting for Eurasia-Nubia convergence velocity because its north component (parallel to the modeled section) is very small (computed with MORVEL model by DeMets et al., 2011) and NW-SE Eurasia-Nubia convergence is most likely accommodated further to the south of the modeled generic section (e.g., Negredo et al., 2002; Cunha et al., 2012).
Rheological Setting
We adopt a visco-plastic rheology with a composite viscosity µcomp given by a combination of diffusion and creep dislocation viscous flow laws:
where µdisl and µdiff represent dislocation and diffusion viscosities. Both viscosities can be expressed in the same form but with different parameters (e.g., Hirth and Kohlstedt, 2003; Billen and Hirth, 2007; Rodríguez-González et al., 2012; Rodríguez-González et al., 2014):
where the index i denotes the creep mechanism (dislocation or diffusion). A is the pre-exponential factor, d is the grain size, m is the grain size exponent, n is the stress exponent,
The visco-plastic adopted approach takes into account both brittle (plastic) yielding and viscous deformation. Plasticity limits viscous stresses through a Von Mises yield criterion, with the yield stress fixed to the cohesion σy = C. When the viscous stress 2µ
Table 1 lists the rheological parameters used for the different creep mechanism and compositional fields.
Results
We have performed a large number of simulations (>50) testing the effects of varying the lithospheric structures at both sides of the STEP fault as well as the viscosity distribution. From this sensitivity study we have constrained the conditions controlling the occurrence or not of delamination, and the pace of delamination process when it occurs. Broadly speaking we can group our simulations into three clearly differentiated end-members attending to the pace of the delamination process and topographic evolution: i) Reference Model, ii) slow delamination, and iii) no delamination. The first end member (“Reference Model”), has been calibrated according to the structure and topography evolution of the delamination process proposed for the central Betics. We select a representative model for slowly evolving delamination in order to illustrate how delamination speed affects the surface response (topography and surface velocity). The main difference between the Reference Model and the slow model stands on a difference of 20 km for the thickness of the South Iberian lithospheric mantle. This difference will be shown to have a significant effect on the buoyancy forces triggering delamination. In the following we describe in detail two of the end member scenarios: Reference (Figures 4–7) and slow models (Figures 9–11).
Reference Model
The Reference Model assumes an initial LAB (Lithosphere-Asthenosphere Boundary) depth for the South Iberian margin of 120–132 km and reproduces a well-developed delamination process (Figures 5, 6). The initial setup assumes an initial LAB depth for the Alboran Sea of 45 km, representing moderate back-arc thinning (stretching factor about two, assuming an initial LAB depth of 90 km). The maximum and minimum viscosity cutoffs are 5 × 10²² and 2 × 10¹⁹ Pa·s, respectively. These values represent a moderate stiffness of the lithospheric mantle and weak lower crust and asthenosphere. Figure 5 shows the density and velocity field evolution as well as the topographic response; Figure 6 shows the viscosity distribution evolution, and Figure 7 shows the surface response along a simulation lasting 5.4 Ma. The lateral density contrast results in a negatively buoyant thick Iberian lithosphere. In contrast, the warm, low viscosity Alboran lithosphere creates a weak zone that channels asthenospheric upwelling and inflow along the base of the Iberian crust. Two clearly differentiated stages of evolution can be distinguished, as it is shown in the plot of maximum velocity vs. time (Figure 8). The first phase comprises the first ∼3 Ma and is characterized by upward and leftward mantle flow sourced from the Alboran domain, adjacent to the vertical step. This flow is further enhanced by the viscosity reduction due to the high temperature and strain rate. The pressure difference forces the upwelling mantle into the Iberian lower crust, with maximum horizontal velocities of 2 cm/yr (Figure 5A).
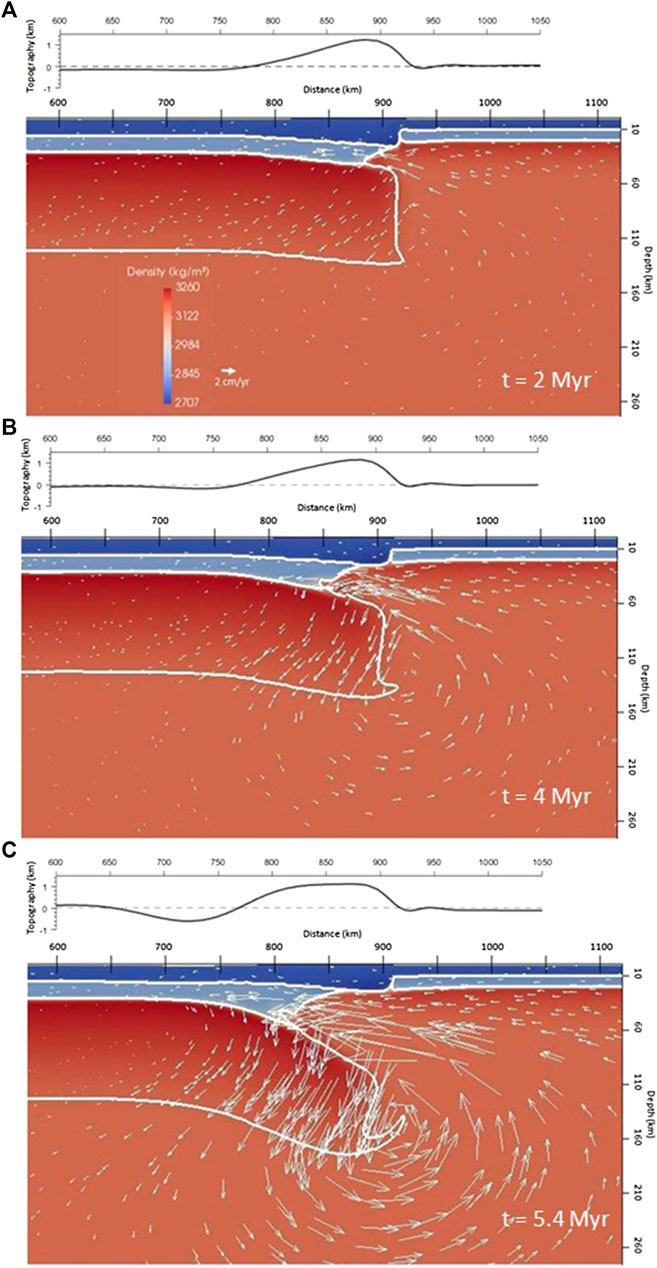
FIGURE 5. Distribution of density and velocity field and topographic response at different times (A) 2, (B) 4, and (C) 5.4 Myr of the Reference Model.
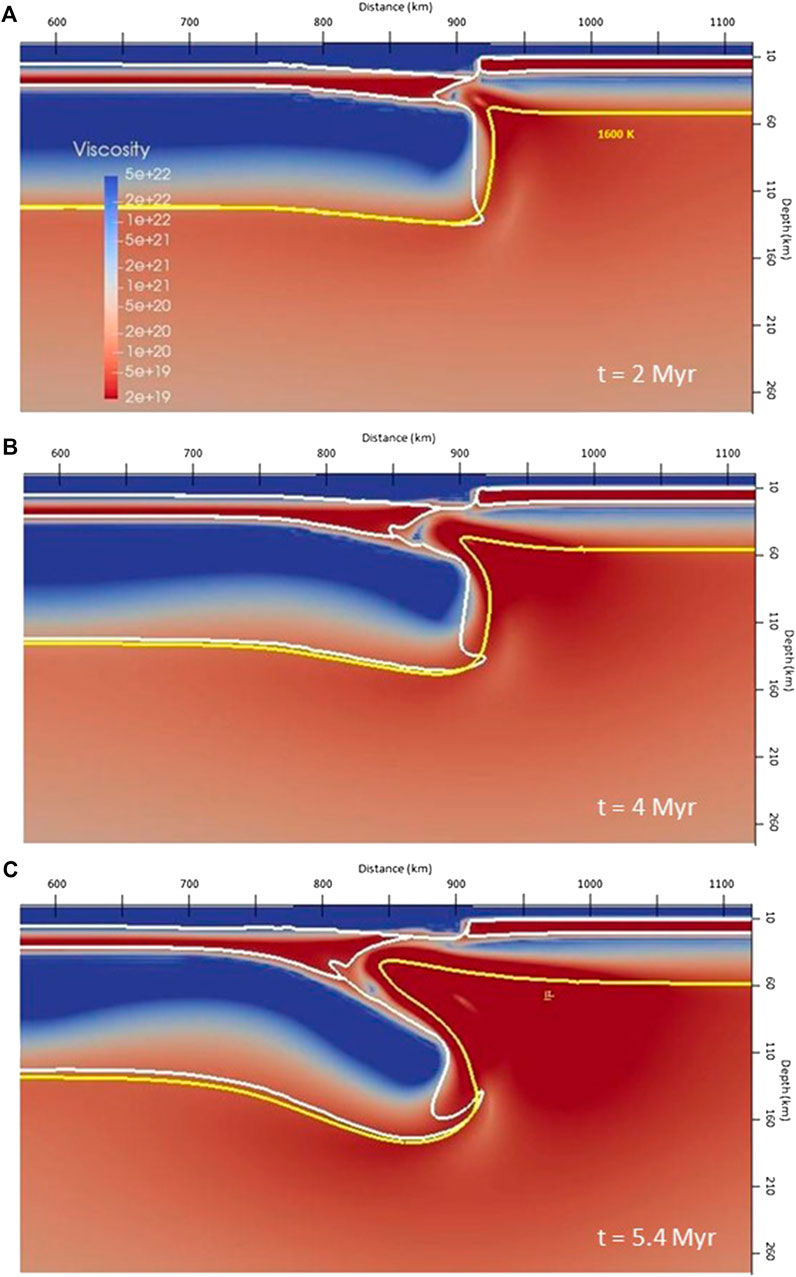
FIGURE 6. Distribution of viscosity (logarithmic scale plot; Pa s units) and location of the 1,600 K isotherm at different times (A) 2, (B) 4, and (C) 5.4 Myr of the Reference Model.
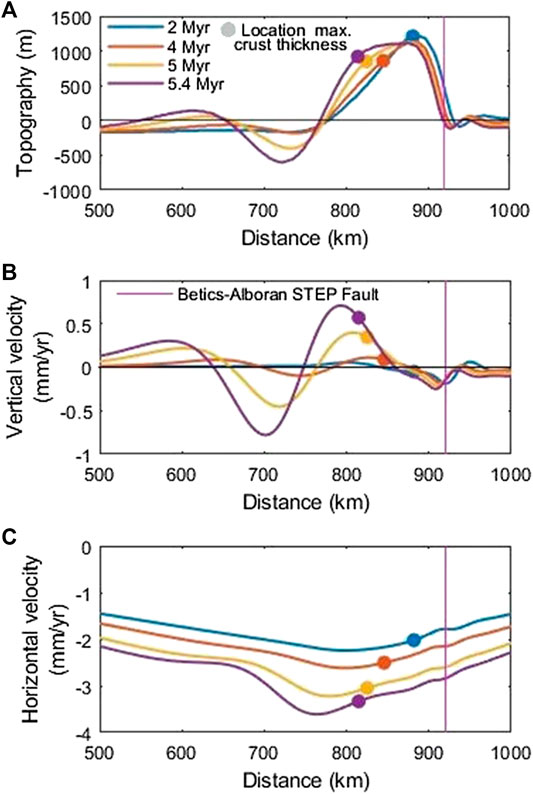
FIGURE 7. (A) Topography, (B) vertical velocity, and (C) horizontal velocity of the free surface at different time steps of the Reference Model. The location of the maximum crustal thickness at each time step is also marked (colored dots) to facilitate the interpretation.
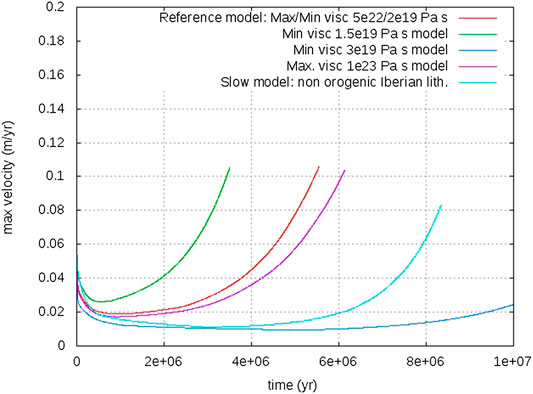
FIGURE 8. Sensitivity study showing the evolution of maximum velocities of different simulations. Acceleration of maximum velocities indicate the transition from stable to unstable delamination. Only the viscosity cutoffs are varied with respect to the Reference Model (red line), except for the “Slow Model,” which considers a 20 km thinner Iberian lithosphere and a minimum viscosity cutoff 1019 Pa·s.
The second phase is characterized by the acceleration of delamination (Figures 5B,C). The progression of the asthenospheric lateral intrusion generates crustal thickening in front of the delamination hinge, and crustal thinning behind it, removing completely the lower crust. As the area of the intruding mantle grows, the extent of unsupported (from above), negatively buoyant Iberian lithospheric mantle increases and starts sinking faster into the asthenosphere. This sinking continental slab pulls down the lower crust at the delamination hinge and the adjacent lithosphere, further accelerating the lateral spreading of delamination. The inflow velocity increases dramatically (Figures 5C and 8) and the system tends to become very unstable. As discussed in the analytical study by Bird (1979), two main competing effects determine whether the system is stable or unstable. First, the intruding asthenosphere cools down and develops a thermal boundary layer (high viscosity borders of the intruding mantle in Figure 6A), thus reducing the thickness of the low viscosity layer. Second, the sinking of the lithospheric mantle slab increases the thickness of this overlying weak layer. If “freezing” in the low viscosity layer dominates the system will be stable whereas if sinking and separation dominate the system will be very unstable.
At 5.4 Myr, the maximum crustal thickness (>50 km) has migrated about 106 km to the left since the beginning of the simulation. The descending lithospheric mantle slab peels away rapidly from the crust, and sinks into the mantle, in a similar fashion as a retreating slab subduction mechanism. The tip of the modeled Iberian lithospheric mantle slab reaches a depth of about 100 km, in line with the seismically mapped geometry of the Iberian dipping slab at longitudes 3.3°W (Mancilla et al., 2013; Figure 12).
Figure 7 shows the surface evolution of the Reference Model in terms of topography, and horizontal and vertical components of the velocity. The evolution of the model topography shows a characteristic migrating pattern of uplift/subsidence, following the direction of migration of delaminating lithospheric mantle and crustal thickening over the slab. During the first phase (represented by the t = 2 Myr line in Figure 7) the location of the maximum topography coincides with that of maximum crustal thickness. During the phase of enhanced asthenospheric inflow and slab sinking (represented by t = 4 and 5.4 Myr lines in Figure 7) the location of maximum crustal thickness is shifted by about 30 km. The region of high topography (>1 km) becomes wider and the maximum elevation values are maintained through the evolution time, so that a narrow high plain develops. Note that the crustal thickness above the zone of delamination is mostly <35 km, and therefore the high topography is sustained by the replacement of dense lithospheric mantle by warmer asthenosphere inflow. In contrast, a shallow basin is formed to the left of the delamination hinge (660 km < x < 770 km) as a consequence of the negatively buoyant sinking slab. Further to the right (770 km < x < 820 km), this downward pull is counteracted by isostatic uplift due to crustal thickening, which results in positive surface topography.
Surface uplift (positive vertical velocity in Figure 7B) occurs when crustal thickening and inflow of hot mantle dominate over the downward pull exerted by the sinking slab. The maximum uplift rate is ∼0.7 mm/yr at 5.4 Myr and its location is shifted about ∼20 km to the left from the location of maximum crustal thickening. The offset stems from the fact that maximum uplift rates correlate with the rate of crustal thickening rather than the crustal thickness itself. The leftward migration of high uplift rates is responsible for the progressive widening of the elevated area (Figure 7A). Similarly, the highest subsidence rate occurs to the left of the deepest point of the basin, consistently with it leftward migration, but without increasing its width.
This particular modeling setup generates a predominantly leftwards flow at shallow levels (Figure 5). As a consequence, the surface velocity is negative (left-directed; Figure 7C) with values increasing as delamination proceeds and a vigorous counterclockwise flow develops (Figure 5C). Maximum absolute values of ∼3.5 mm/yr at x = 770 are attained at 5.4 Myr. There is extension to the right of this point and compression to the left, with maximum contraction rates (highest lateral gradient of horizontal velocity) between 680 and 760 km, thus in the area of basin formation.
Sensitivity Study
We have conducted a series of simulations to test the effect of viscosity cutoffs on the evolution of delamination. The variation of maximum velocity for different simulations is shown in Figure 8. This figure is useful to identify the transition from stable to unstable regimes. During the first phase of the Reference Model, intrusion along the lower Iberian crust proceeds steadily, with migration of the delamination hinge of 2–3 cm/yr. The transition to the unstable regime occurs as slab sinking and separation become dominant. This transition is characterized by a rapid increase in the maximum velocity (simulations are stopped when maximum velocities exceed ∼10 cm/yr). When the minimum viscosity is reduced from 2 × 10¹⁹ Pa·s (Reference Model) to 1.5 × 10¹⁹ Pa·s delamination starts accelerating about 2 Myr before than for the Reference Model (green vs. red lines in Figure 8). When the minimum viscosity is increased to 3 × 10¹⁹ Pa·s, the delamination process does not take place (deep blue line in Figure 8). The transition to the unstable regime is only slightly delayed when the maximum viscosity is increased from 5 × 10²² Pa·s (Reference Model) to 1023 Pa·s (purple line in Figure 8). The stronger dependence on the minimum viscosity cutoff (reached at the lower crust and intruding asthenosphere) is consistent with the higher sensitivity of the slab sinking velocity to variations of lower crust viscosity (µLC−2/3) than to lithospheric mantle viscosity variations (µLM−1/3), found by Bird (1979). Additional simulations (not shown) were conducted by increasing the initial Alboran LAB depth from 45 to 50 km (keeping the same viscosity cutoffs as the Reference Model). Delamination does not occur in this case; the maximum velocity always decreases and cooling of the slowly intruding Alboran mantle hinders delamination and slab sinking. This is because the colder and stiffer Alboran lithospheric mantle resists flow around the upper corner of the Iberian lithospheric mantle and slows down the intrusion into the lower crust.
Baes et al. (2011) argued that the contrast resulting from STEP tearing may not be sharp. To investigate a more general case we have performed additional tests to evaluate the sensitivity to the width of the contrast. STEP faults dipping toward the continental margin, as considered in some simulations of the Baes et al. (2011) study and near the Plini-Strabo trenches (Özbakir et al., 2013), result in a reduction of buoyancy forces compared to the vertical STEP fault geometry, and do not lead to delamination (with the Reference model parameters). Vertical STEP faults maximize lateral density contrasts and are therefore the most favourable geometry for post-tearing delamination.
Slow Delamination Model
The second end member assumes a thinner Iberian lithosphere, with initial LAB depth for the South Iberian margin of 100–112 km, and predicts a slow evolution of delamination (Figures 9–11). If the viscosity cutoffs of the Reference Model are maintained, delamination simply does not develop, provided that the buoyancy forces are too weak to overcome viscous resistance. In the simulation shown in Figures 9 and 10 (and light blue line in Figure 8), the minimum viscosity is reduced from 2 × 10¹⁹ Pa·s (Reference Model) to 1019 Pa·s. This simulation is characterized by the slow development of delamination and therefore a longer evolution time, 8.2 Myr, is allowed to reach a final configuration similar to the final stage of the Reference Model (same depth of ∼100 km for the tip of the top of the slab in Figures 5C and 9B). Figure 9A shows the evolution at 5.4 Myr, the final time of the Reference Mode (Figure 5C), to enable a direct comparison of both end member models at the same times of evolution. Asthenosphere intrusion spreads into the Iberian lower crust at velocities <2 cm/yr during the first 6 Myr (Figure 9A and light blue line in Figure 8). As a consequence of this slower intrusion, the “chilled” viscous boundary of the intruding mantle is more developed than in the reference model (compare Figures 6 and 10). As described above, this “freezing” dominates over slab sinking and the delamination process is stable for a longer time. Maximum velocities only increase significantly during the last 2 Myr of evolution. At 8.2 Myr, the maximum crustal thickness is 45 km and its location has migrated 108 km to the left since the beginning of the simulation. In spite of the similar structure reached by both end member simulations albeit at different times, the surface response to delamination (Figure 11) is dramatically different, indicating the importance of dynamic topography in the faster Reference Model. No basin is created because the slower sinking of the delaminating lithospheric mantle makes conductive thermal equilibration with the surrounding mantle more effective and therefore the negative buoyancy of the sinking lithosphere is smaller. The maximum topography decreases with time by about 400 m, being always located in an area of relatively thin crust. The topographic subsidence indicates that the isostatic effect of crustal thinning predominates over the dynamic contribution from the slowly intruding warm mantle. Vertical velocities have small values (Figure 11B) as reflected by the slow evolution of the topography, except at the end of the simulation, when delamination accelerates. Similarly, the slow development of delamination results in very low (<0.8 mm/yr) horizontal velocities.
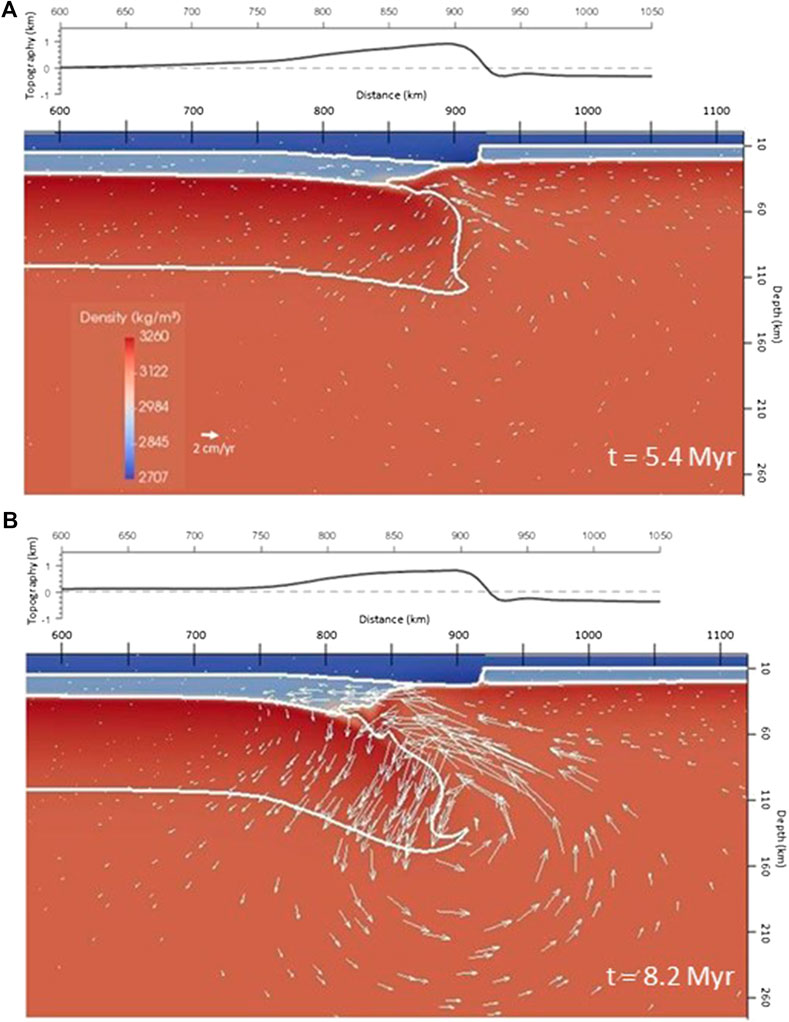
FIGURE 9. Distribution of density and velocity field and topographic response at different times (A) 5.4 Myr (for comparison purposes with the final time of the Reference Model), (B) 8.2 Myr of the “Slow Model.”
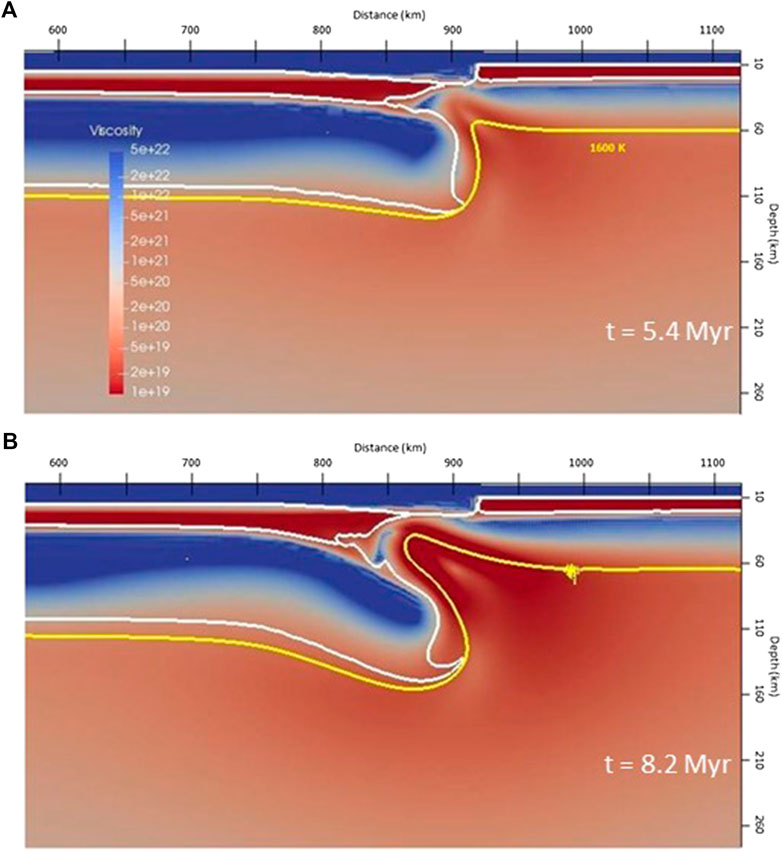
FIGURE 10. Distribution of viscosity (logarithmic scale plot; Pa s units) and location of the 1,600 K isotherm at different times (A) 5.4 Myr (for comparison purposes with the final time of the Reference Model), (B) 8.2 Myr of the “Slow Model.”
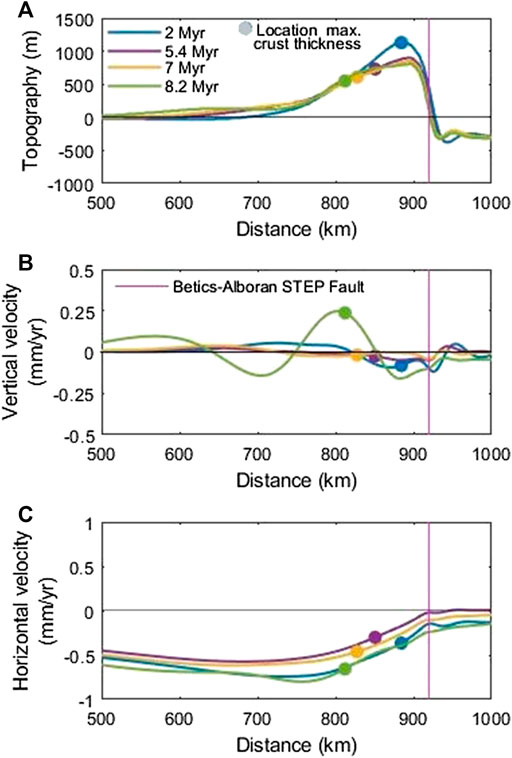
FIGURE 11. (A) Topography, (B) vertical velocity, and (C) horizontal velocity of the free surface at different time steps of the Slow Model. The location of the maximum crustal thickness at each time step is also marked (colored dots) to facilitate the interpretation.
Discussion
Here we have shown that, for some specific thermal and rheological conditions, the setup after slab tearing by means of a STEP fault is prone to generate continental delamination. This setup based on negatively buoyant lithosphere and adjacent weak material is present in a number of delamination models (e.g., Göğüs and Pysklywec, 2008; Valera et al., 2008; Valera et al., 2011; Bajolet et al., 2012; Valera et al., 2014; see Göğüs and Ueda, 2018 for a revision). In contrast to those earlier studies where delamination had to be enforced by imposing ad hoc initial conditions, here we explore the conditions under which delamination in the vicinity of STEP faults naturally occurs. In particular, we reproduce, without any external forcing, the formation of a “broad conduit” across the lithospheric mantle as originally described analytically by Bird (1979). We also demonstrate that under some particular thermal and rheological settings delamination evolves from a stable to a very unstable and fast evolving regime.
Inferences About Possible Delamination in the Central Betics
The predicted evolution of the Reference end member model is consistent with a number of observations for the central Betics. The final structure (Figures 5C and 6C) resembles the overall lithospheric structure mapped by RF studies in the area where ongoing delamination has been proposed (Figure 12), with a southwards dipping slab-like structure reaching a depth about 100 km about 100 km south of the area of maximum crustal thickness (Mancilla et al., 2013). The lack of isostatic correlation between the thickest crust and highest topography (Mancilla et al., 2013; Mancilla et al., 2015a; Mancilla et al., 2015b) is a dynamic feature properly reproduced by our modeling. Therefore, this model supports the hypothesis that the high topography in the central Betics is partly sustained by asthenospheric inflow during delamination. The evolving pattern of uplift/subsidence predicted by the Reference Model is consistent with the fact that the uplift in the western side of Sierra Nevada was accompanied by subsidence of the Granada Basin (except in its NE border), further to the northwest of Sierra Nevada, during the Late Pleistocene (Azañón et al., 2012; Azañón et al., 2015).
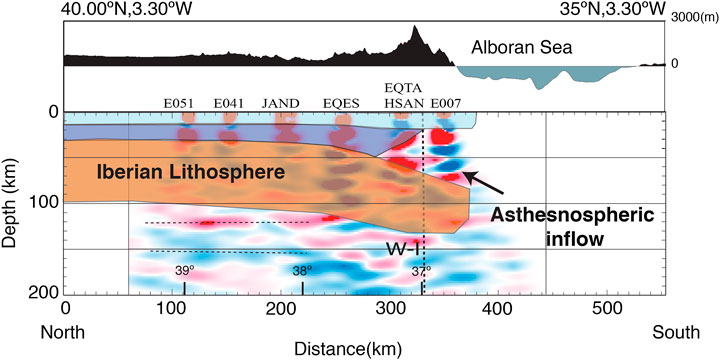
FIGURE 12. Comparison of the common conversion point migration image of P-receiver function built using only the closest stations to the profile (modified from Figure 9 of Mancilla et al., 2015a) with the simulated structure of the Iberian lithosphere for the Reference Model at 5.4 Myr. At the top, we display the topography along the profile.
Duggen et al. (2003) and Duggen et al. (2005) proposed that the westward rollback of the oceanic lithosphere also peeled away portions of the lithospheric mantle from beneath the Iberian and African margins, and that this westward delamination of the lithospheric mantle would be consistent with the volcanism (location and composition) and the margins uplift that closed the Miocene gateways between the Atlantic Ocean and the Mediterranean. Similarly, Martinez-Martinez et al. (2006) proposed that the westward migration of extensional loci was related to delamination and westward asthenospheric inflow under the southern Iberian margin. A number of RF studies show prominent steps not only in the LAB, but also in the Moho depth (Mancilla et al., 2013; Mancilla et al., 2015a; Mancilla et al., 2018); this fact contradicts the idea of a westward delamination of the lithospheric mantle beneath the margins, leaving an unperturbed crust. However, the observation of a large Moho step is not incompatible with the overall westward peeling of the lithospheric mantle beneath the Iberian margin accommodated by a westward propagating STEP fault, with this fault representing the vertical boundary of the mantle gap left by delamination (Baes et al., 2011). On the light of the present modeling we can add that this process most likely thinned the overlying crust at the back of the delamination hinge. The westward delamination proposed by Duggen et al. (2005) is compatible with our initial setup as long as the tearing migrated to a more southern location in the central Betics and then continued westwards. It could be then followed by the initiation of northward migrating delamination modeled in this study for the central Betics. Following our modeling, this post-tearing delamination would be favored by a margin lower crust thick enough to act as a mechanical weakness, enabling asthenospheric inflow and decoupling of the crust and lithospheric mantle. We suggest that these conditions were only met in the central Betics provided that the STEP fault, located further to the south compared to the eastern Betics (Figure 1), likely tore orogenic Betic lithosphere, with a thick and weak lower crust and a thick lithospheric mantle favoring its sinking into the asthenosphere.
Model Limitations
The geometry after slab tearing by means of a STEP fault is intrinsically three-dimensional and would therefore require a 3D modeling approach (e.g., Munch et al., 2020). Future efforts in the Betic-Rift system should move forward along this line to avoid limitations as for example the close location of generic modeled cross-section to the active tip of the STEP fault to the west and to the Tear-Delamination fault to the east (Figure 1). However, time evolving 3D delamination is a very challenging problem. A high resolution grid is required to account for sharp viscosity contrasts due to compositional variations and to high strain rates during asthenospheric inflow. Furthermore, the free surface boundary condition (required to quantify uplift/subsidence consistently) is computationally demanding as well, requiring small time steps to have a good accuracy. This could be avoided by using instantaneous 3D models (e.g., Negredo et al., 1999) albeit at the price of losing the transient characteristics of delamination, an essential component of this mechanism as illustrated in this work. Hence, inferences from instantaneous approaches, as in the delamination modeling for northern Morocco from Baratin et al. (2016), should be taken with caution.
No plastic weakening occurs during the simulations presented here as slab bending is quite low. However, plasticity should be accounted for in models of slab sinking across the entire upper mantle, where high bending stress associated with rollback of the lithospheric mantle slab can lead to breakoff (e.g., Ueda et al., 2012; Göğüs et al., 2016). This would be the case for past evolution of the Southeast Carpathians (Göğüs et al., 2016) or the Moroccan Atlas, where piecewise delamination of the continental lithosphere has been proposed (Bezada et al., 2014). Finally, it is worth stressing that this study is not intended to perform a detailed modeling of the recent evolution of the central Betics, given the mentioned limitations, but rather to show that first order characteristics like the pattern of uplift/subsidence and lithospheric structure are properly accounted for in this modeling of post-tearing northward delamination in the central Betics.
Conclusions
In this study we investigate the first order characteristics of continental edge delamination across STEP faults after slab tearing by means of geodynamic modeling. In doing so, we use as reference the STEP fault observed in the Betic orogeny taking advantage of the unprecedented resolution mapping of its lithospheric structure where edge delamination is proposed. The comparison with real observations is an essential component in a dynamic process very sensitive to relatively small variations in the thermal and rheological initial conditions.
The lateral contrast in lithospheric structure resulting from STEP faults provides necessary conditions for the development of continental delamination, namely: a strong density contrast between the orogenic and the back-arc lithospheres, a relatively thick and weak lower crust in the Iberian margin, and a thinned (warm and weak) back-arc lithosphere allowing for asthenospheric upwelling and inflow along the orogenic lower crust. The topographic response associated with delamination changes dramatically with the velocity of delamination. Fast delaminating models predict a progressive widening of the elevated area, due to the dynamic effect of asthenospheric inflow, and adjacent subsidence due to the downward pull of the sinking lithospheric mantle slab. In contrast, the maximum topography decreases with time and no basin is formed in slow delamination models. This topographic subsidence indicates that the isostatic effect of crustal thinning predominates over the dynamic effect of slowly intruding warm mantle. For other thermal and rheological setting delamination is not even triggered.
Predictions from the fast delamination end member model (Reference model) are consistent with a number of observations for the central Betics area where ongoing delamination has been proposed (e.g., Mancilla et al., 2013; Mancilla et al., 2015a; Heit et al., 2017); these features are the first order characteristics of the lithospheric structure, the offset between highest topography and thickest crust locations, and the observed topographic pattern of uplift in western Sierra Nevada, and subsidence in the Granada Basin. In summary, our results, bearing in mind the limitations imposed by the 2D assumption, are consistent with the hypothesis of present-day north-directed delamination in the central Betics.
Data Availability Statement
The datasets generated for this study are available on request to the corresponding author.
Conflict of Interest
The authors declare that the research was conducted in the absence of any commercial or financial relationships that could be construed as a potential conflict of interest.
Author Contributions
AN and CC perform the numerical modelling; FdLM is responsible of the P-wave receiver function analysis and its interpretation; JM and JF contributed significantly to the interpretation. All authors participated in the discussions and contributed to the manuscript.
Funding
The present research has been funded by projects Spanish Ministry of Science projects PGC2018-095154-B-I00 (AN) and PID2019-109608GB-I00 (FM and JM). JF is supported by an Atracción Talento senior fellowship (2018-T1/AMB/11493) funded by Comunidad Autonoma de Madrid (Spain). This work has been done using the facilities of the Laboratory of Geodynamic Modelling from Geo3BCN-CSIC. We thank the Computational Infrastructure for Geodynamics (geodynamics.org) which is funded by the National Science Foundation under award EAR-0949446 and EAR-1550901 for supporting the development of ASPECT.
Acknowledgments
We acknowledge constructive reviews by the two reviewers. Juliane Dannberg is kindly acknowledged for her support with ASPECT simulations. Figures were created with ParaView, Gnuplot, GMT, and Matlab environments.
References
Azañón, J. M., Galve, J. P., Pérez-Peña, J. V., Giaconia, F., Carvajal, R., Booth-Rea, G., et al. (2015). Relief and drainage evolution during the exhumation of the Sierra Nevada (SE Spain): is denudation keeping pace with uplift? Tectonophysics, 663, 19–32. doi:10.1016/j.tecto.2015.06.015
Azañón, J. M., Pérez-Peña, J. V., Giaconia, F., Booth-Rea, G., Martínez-Martínez, J. M., and Rodríguez-Peces, M. J. (2012). Active tectonics in the central and eastern Betic Cordillera through morphotectonic analysis: the case of Sierra Nevada and Sierra Alhamilla. J. Iber. Geol. 38 (1), 225–238. doi:10.5209/rev_jige.2012.v38.n1.39214
Bürgmann, R., and Dresen, G. (2008). Rheology of the lower crust and upper mantle: evidence from rock mechanics, geodesy, and field observations. Annu. Rev. Earth Planet Sci. 36, 531–567. doi:10.1146/annurev.earth.36.031207.124326
Baes, M., Govers, R., and Wortel, R. (2011). Subduction initiation along the inherited weakness zone at the edge of a slab: insights from numerical models. Geophys. J. Int. 184 (3), 991–1008. doi:10.1111/j.1365-246X.2010.04896.x
Bajolet, F., Galeano, J., Funiciello, F., Moroni, M., Negredo, A. M., and Faccenna, C. (2012). Continental delamination: insights from laboratory models. Geochem. Geophys. Geosyst. 13, Q02009. doi:10.1029/2011GC003896
Bangerth, W., Dannberg, J., Gassmoeller, R., and Heister, T. (2019). ASPECT, April 29. ASPECT v2.0.1. Zenodo. doi:10.5281/zenodo.2653531
Baratin, L. M., Mazzotti, S., Chéry, J., Vernant, P., Tahayt, A., and Mourabit, T. (2016). Incipient mantle delamination, active tectonics and crustal thickening in Northern Morocco: insights from gravity data and numerical modeling. Earth Planet Sci. Lett. 454, 113–120. doi:10.1016/j.epsl.2016.08.041
Bezada, M. J., Humphreys, E. D., Davila, J. M., Carbonell, R., Harnafi;, M., and Palomeras, I. (2014). Piecewise delamination of Moroccan lithosphere from beneath the Atlas mountains. Geochem. Geophys. Geosyst. 15, 975–985. doi:10.1002/2013GC005059
Bezada, M. J., Humphreys, E. D., Toomey, D. R., Harnafi, M., Davila, J. M., and Gallart, J. (2013). Evidence for slab rollback in westernmost Mediterranean from improved upper mantle imaging. Earth Planet Sci. Lett. 368, 51–60. doi:10.1016/j.epsl.2013.02.024
Billen, M., and Hirth, G. (2007). Rheologic controls on slab dynamics. Geochem. Geophys. Geosyst. 8, 1–24. doi:10.1029/2007gc001597
Bird, P. (1978). Initiation of intracontinental subduction in the Himalaya. J. Geophys. Res. Solid Earth. 83, 4975–4987. doi:10.1029/JB083iB10p04975
Bird, P. (1979). Continental delamination and the Colorado Plateau. J. Geophys. Res. Solid Earth. 84, 7561–7571. doi:10.1029/jb084ib13p07561
Booth-Rea, G., Ranero, C. R., Martínez-Martínez, J. M., and Grevemeyer, I. (2007). Crustal types and Tertiary tectonic evolution of the Alboran sea, western Mediterranean. Geochem. Geophys. Geosyst. 8, Q10005. doi:10.1029/2007gc001639
Calvert, A., Sandvol, E., Seber, D., Barazangi, M., Roecker, S., and Mourabit, T. (2000). Geodynamic evolution of the lithosphere and upper mantle beneath the Alboran region of the western Mediterranean: constraints from travel time tomography. J. Geophys. Res. Solid Earth. 105, 10871–10898. doi:10.1029/2000JB900024
Carballo, A., Fernàndez, M., Jiménez-Munt, I., Torne, M., Vergés, J., Melchiorre, M., et al. (2015). From the north-Iberian margin to the Alboran basin: a lithosphere geo-transect across the Iberian plate. Tectonophysics 663, 399–418. doi:10.1016/j.tecto.2015.07.009
Chertova, M. V., Spakman, W., Geenen, T., van den Berg, A. P., and van Hinsberger, D. J. J. (2014). Underpinning tectonic reconstructions of the western Mediterranean region with dynamic slab evolution from 3-D numerical modeling. J. Geophys. Res. Solid Earth. 119, 5876–5902. doi:10.1002/2014jb011150
Cunha, T. A., Matias, L. M., Terrinha, P., Negredo, A. M., Rosas, F., and Fernandes, R. M. (2012). Neotectonics of the SW Iberia margin, Gulf of Cadiz and Alboran Sea: a reassessment including recent structural, seismic and geodetic data. Geophys. J. Int. 188, 850–872. doi:10.1111/j.1365-246X.2011.05328.x
DeMets, C., Gordon, R. G., and Argus, D. F. (2011). Geologically current plate motions. Geophys. J. Int. 187, 538. doi:10.1111/j.1365-246X.2011.05186.x
Duggen, S., Hoernle, K., van den Bogaard, P., and Garbe-Schönberg, D. (2005). Post-collisional transition from subduction- to intraplate-type magmatism in the westernmost Mediterranean: evidence for continental-edge delamination of subcontinental lithosphere. J. Petrol. 46, 1155–1201. doi:10.1093/petrology/egi013
Duggen, S., Hoernle, K., van den Bogaard, P., and Harris, C. (2004). Magmatic evolution of the Alboran region: the role of subduction in forming the western Mediterranean and causing the Messinian salinity crisis. Earth Planet Sci. Lett. 218, 91–108. doi:10.1016/s0012-821x(03)00632-0
Duggen, S., Hoernle, K., van den Bogaard, P., Rüpke, L., and Morgan, J. P. (2003). Deep roots of the Messinian salinity crisis. Nature 422, 602–606. doi:10.1038/nature01553
Faccenda, M., Minelli, G., and Gerya, T. V. (2009). Coupled and decoupled regimes of continental collision: numerical modeling. Earth Planet Sci. Lett. 278, 337–349. doi:10.1016/j.epsl.2008.12.021
Faccenna, C., Piromallo, C., Crespo-Blanc, A., Jolivet, L., and Rossetti, F. (2004). Lateral slab deformation and the origin of the western Mediterranean arcs. Tectonics 23, TC1012. doi:10.1029/2002tc001488
Fadil, A., Vernant, P., McClusky, S., Reilinger, R., Gomez, F., and Ben Sari, D. (2006). Active tectonics of the western Mediterranean: geodetic evidence for rollback of a delaminated subcontinental lithospheric slab beneath the Rif Mountains, Morocco. Geology 34 (7), 529–532. doi:10.1130/G22291.1
Fullea, J., Fernández, M., Alfonso, J. C., Vergés, J., and Zeyen, H. (2010). The structure and evolution of the lithosphere-asthenosphere boundary beneath the Atlantic-Mediterranean transition region. Lithos 120, 74–95. doi:10.1016/j.lithos.2010.03.003
Fullea, J., Fernández, M., Vergés, J., and Zeyen, H. (2007). A rapid method to map the crustal and lithospheric thickness using elevation, geoid anomaly and thermal analysis. Application to the Gibraltar Arc System, Atlas Mountains and adjacent zones. Tectonophysics 430, 97–117. doi:10.1016/j.tecto.2006.11.003
Göğüs, O. H., and Pysklywec, R. N. (2008). Near-surface diagnostics of dripping or delaminating lithosphere. J. Geophys. Res. 113, 1–11. doi:10.1029/2007jb005123
Göğüş, O. H., Pysklywec, R. N., Corbi, F., and Faccenna, C. (2011). The surface tectonics of mantle lithosphere delamination following ocean lithosphere subduction: insights from physical-scaled analogue experiments. Geochem. Geophys. Geosyst. 12, Q05004. doi:10.1029/2010GC003430
Göğüs, O. H., Pysklywec, R. N., and Faccenna, C. (2016). Postcollisional lithospheric evolution of the Southeast Carpathians: comparison of geodynamical models and observations. Tectonics 35, 1205–1224. doi:10.1002/2015tc004096
Göğüş, O. H., and Ueda, K. (2018). Peeling back the lithosphere: controlling parameters, surface expressions and the future directions in delamination modeling. J. Geodyn. 117, 21–40. doi:10.1016/j.jog.2018.03.003
García-Castellanos, D., and Villaseñor, A. (2011). Messinian salinity crisis regulated by competing tectonics and erosion at the Gibraltar Arc. Nature 480, 359–363. doi:10.1038/nature10651
Govers, R., and Wortel, M. J. R. (2005). Lithosphere tearing at {STEP} faults: response to edges of subduction zones. Earth Planet Sci. Lett. 236, 505–523. doi:10.1016/j.epsl.2005.03.022
Gutscher, M. A., Dominguez, S., Westbrook, G. K., Le Roy, P., Rosas, F., and Duarte, J. C. (2012). The Gibraltar subduction: a decade of new geophysical data. Tectonophysics 574, 72–91. doi:10.1016/j.tecto.2012.08.038
Gutscher, M. A., Malod, J., Rehault, J.-P., Contrucci, I., Klingelhoefer, F., Mendes-Victor, L., et al. (2002). Evidence for active subduction beneath Gibraltar. Geology 30, 1071–1074. doi:10.1130/0091-7613
Heit, B., Mancilla, F., Yuan, X., Morales, J., Stich, D., and Martín, R. (2017). Tearing of the mantle lithosphere along the intermediate-depth seismicity zone beneath the Gibraltar Arc: the onset of lithospheric delamination. Geophys. Res. Lett. 44, 4027–4035. doi:10.1002/2017GL073358
Hidas, K., Garrido, C. J., Booth-Rea, G., Marchesi, C., Bodinier, J.-L., Dautria, J.-M., et al. (2019). Lithosphere tearing along STEP faults and synkinematic formation of lherzolite and wehrlite in the shallow subcontinental mantle. Solid Earth. 10, 1099–1021. doi:10.5194/se-10-1099-2019
Hirth, G., and Kohlstedt, D. (2003). Rheology of the upper mantle and the mantle wedge: a view from the experimentalists. Geophys. Monogr. Ser. 138, 83–105. doi:10.1029/138gm06
Iribarren, L., Verges, J., Camurri, F., Fullea, J., and Fernàndez, M. (2007). The structure of the Atlantic–Mediterranean transition zone from the Alboran Sea to the Horseshoe Abyssal Plain (Iberia–Africa plate boundary). Mar. Geol. 243, 97–119. doi:10.1016/j.margeo.2007.05.011
Iribarren, L., Vergés, J., and Fernàndez, M. (2009). Sediment supply from the Betic–Rif orogen to basins through Neogene. Tectonophysics 475, 68–84. doi:10.1016/j.tecto.2008.11.029
Jiménez-Munt, I., and Negredo, A. M. (2003). Neotectonic modelling of the western part of the Africa/Eurasia plate boundary: from the Mid-Atlantic ridge to Algeria. Earth Planet Sci. Lett. 205, 257–271. doi:10.1016/s0012-821x(02)01045-2
Jiménez-Munt, I., Torne, M., Fernàndez, M., Vergés, J., Kumar, A., and Carballo, A. (2019). Deep seated density anomalies across the Iberia-Africa plate boundary and its topographic response. J. Geophys. Res. Solid Earth. 124, 13310–13332. doi:10.1029/2019JB018445
Kaus, B. J. P., Mühlhaus, H., and May, D. A (2010). A stabilization algorithm for geodynamic numerical simulations with a free surface. Phys. Earth Planet. Inter. 181, 12–20. doi:10.1016/j.pepi.2010.04.007
Kronbichler, M., Heister, T., and Bangerth, W. (2012). High accuracy mantle convection simulation through modern numerical methods. Geophys. J. Int. 191, 12–29. doi:10.1111/j.1365-246x.2012.05609.x
Levander, A., Bezada, M., Niu, F., Humphreys, E. D., Palomeras, I., and Thurner, S. M. (2014). Subduction-driven recycling of continental margin lithosphere. Nature 515, 253–256. doi:10.1038/nature13878
Lonergan, L., and White, N. (1997). Origin of the Betic-Rif mountain belt. Tectonics 16, 504–522. doi:10.1029/96tc03937
Mancilla, F. d. L., Booth-Rea, G., Stich, D., Pérez-Peña, J. V., Morales, J., Azañón, J. M., et al. (2015b). Slab rupture and delamination under the Betics and Rif constrained from receiver functions. Tectonophysics 663, 225–237. doi:10.1016/j.tecto.2015.06.028
Mancilla, F. d. L., and Diaz, J. (2015). High resolution Moho topography map beneath Iberia and Northern Morocco from receiver function analysis. Tectonophysic 663, 203–211. doi:10.1016/j.tecto.2015.06.017
Mancilla, F. d. L., Heit, B., Morales, J., Yuan, X., Stich, D., Molina-Aguilera, A., et al. (2018). A STEP fault in Central Betics, associated with lateral lithospheric tearing at the northern edge of the Gibraltar Arc subduction system. Earth Planet Sci. Lett. 486, 32–40. doi:10.1016/j.epsl.2018.01.008
Mancilla, F. d. L., Stich, D., Berrocoso, M., Martín, R., Morales, J., Fernandez-Ros, A., et al. (2013). Delamination in the Betic range: deep structure, seismicity and GPS motion. Geology 41, 307–310. doi:10.1130/g33733.1
Mancilla, F. d. L., Stich, D., Morales, J., Martín, R., Diaz, J., Pazos, A., et al. (2015a). Crustal thickness and images of the lithospheric discontinuities in the Gibraltar Arc and surrounding areas. Geophys. J. Int. 203, 1804–1820. doi:10.1093/gji/ggv390
Martínez-Martínez, J. M., Booth-Rea, G., Azañón, J. M., and Torcal, F. (2006). Active transfer fault zone linking a segmented extensional system (Betics, southern Spain): insight into heterogeneous extension driven by edge delamination. Tectonophysics 422, 159–173. doi:10.1016/j.tecto.2006.06.001
Molina-Aguilera, A., Mancilla, F. d. L., Morales, J., Stich, D., Yuan, X., and Heit, B. (2019). Connection between the Jurassic oceanic lithosphere of the Gulf of Cádiz and the Alboran slab imaged by Sp receiver functions. Geology 47, 227–230. doi:10.1130/g45654.1
Munch, J., Gerya, T., and Ueda, K. (2020). Oceanic crust recycling controlled by weakening at slab edges. Nat. Commun. 11, 2009. doi:10.1038/s41467-020-15750-7
Negredo, A. M., Bird, P., Sanz de Galdeano, C., and Buforn, E. (2002). Neotectonic modeling of the Ibero-Maghrebian región. J. Geophys. Res. Solid Earth. 107, B11. doi:10.1029/2001jb000743
Negredo, A. M., Sabadini, R., Bianco, G., and Fernández, M. (1999). Three-dimensional modelling of crustal motions caused by subduction and continental convergence in the central Mediterranean. Geophys. J. Int. 136, 261–274. doi:10.1046/j.1365-246x.1999.00726.x
Özbakır, A. D., Govers, R., and Fichtner, A. (2020). The Kefalonia transform fault: a step fault in the making. Tectonophysics 787, 228471. doi:10.1016/j.tecto.2020.22847
Özbakır, A. D., Şengör, A. M. C., Wortel, M. J. R., and Govers, R. (2013). The Pliny–Strabo trench region: a large shear zone resulting from slab tearing. Earth Planet Sci. Lett. 375, 188–195. doi:10.1016/j.epsl.2013.05.025
Palomeras, I., Thurner, S., Levander, A., Liu, K., Villasenor, A., and Carbonell, R. (2014). Finite-frequency Rayleigh wave tomography of the western Mediterranean: mapping its lithospheric structure. Geochem. Geophys. Geosyst. 15, 140–160. doi:10.1002/2013gc004861
Platt, J. P., Allerton, S., Kirker, A., Mandeville, C., Mayfield, A., and Platzman, E. S. (2003). The ultimate arc: differential displacement, oroclinal bending, and vertical axis rotation in the external Betic-Rif arc. Tectonics 22, 1017. doi:10.1029/2001tc001321
Rodríguez-González, J., Billen, M. I., and Negredo, A. M. (2014). Steady-state subduction and trench-parallel flow induced by overriding plate structure. Earth Planet Sci. Lett. 401, 227–235. doi:10.1016/j.epsl.2014.06.013
Rodríguez-González, J., Negredo, A. M., and Billen, M. I. (2012). The role of the overriding plate thermal state on slab dip variability and on the occurrence of flat subduction. Geophys. Geochem. Geosyst. 13, Q01002. doi:10.1029:/2011GC003859
Rose, I., Buffet, B., and Heister, T. (2017). Stability and accuracy of free surface time integrations in viscous flows. Phys. Earth Planet. Int. 262, 90–100. doi:10.1016/j.pepi.2016.11.007
Santos-Bueno, N., Fernández-García, C., Stich, D., Mancilla, F. d. L., Martín, R., and Molina-Aguilera, A. (2019). Focal mechanisms for subcrustal earthquakes beneath the Gibraltar Arc. Geophys. Res. Lett. 46, 2534–2543. doi:10.1029/2018GL081587
Seber, D., Barazangi, M., Ibenbrahin, A., and Demnati, A. (1996). Geophysical evidence for lithospheric delamination beneath the Alboran Sea and the Rif-Betic mountains. Nature 379, 785–790. doi:10.1038/379785a0
Spakman, W., Chertova, M. V., van den Berg, A., and van Hinsbergen, D. J. J. (2018). Puzzling features of western Mediterranean tectonics explained by slab dragging. Nat. Geosci. 11, 211–216. doi:10.1038/s41561-018-0066-z
Spakman, W., and Wortel, R. (2004). “A tomographic view on western Mediterranean geodynamics. The TRANSMED atlas,” in The Mediterranean region from crust to mantle, Berlin Heidelberg: Springer, 31–52. doi:10.1007/978-3-642-18919-72
Stich, D., Serpelloni, E., Mancilla, F., and Morales, J. (2006). Kinematics of the Iberia-Maghreb plate contact from seismic moment tensors and GPS observations. Tectonophysics 426, 295–317. doi:10.1016/j.tecto.2006.08.004
Thieulot, C. (2011). FANTOM: two- and three-dimensional numerical modelling of creeping flows for the solution of geological problems. Phys. Earth Planet. Inter. 188, 47–68. doi:10.1016/j.pepi.2011.06.011
Torne, M., Fernàndez, M., Vergés, J., Ayala, C., Salas, M.‐C., Jimenez‐Munt, I., et al. (2015). Crustal and mantle lithosphere structure from potential field and thermal analysis. Tectonophysics, 663, 419–433. doi:10.1016/j.tecto.2015.06.003
Ueda, K., Gerya, T. V., and Burg, J.-P. (2012). Delamination in collisional orogens: thermomechanical modelling. J. Geophys. Res. 117, B08202, doi:10.1029/2012JB009144
Valera, J. L., Negredo, A. M., Billen, M. I., and Jiménez-Munt, I. (2014). Lateral migration of a foundering high-density root: insights from numerical modeling applied to the southern Sierra Nevada. Lithos 198, 77–88. doi:10.1016/j.lithos.2013.08.021
Valera, J. L., Negredo, A. M., and Jiménez-Munt, I. (2011). Deep and near-surface consequences of root removal by asymmetric continental delamination. Tectonophysics 502, 257–265. doi:10.1016/j.tecto.2010.04.002
Valera, J. L., Negredo, A. M., and Villaseñor, A. (2008). Asymmetric delamination and convective removal numerical modeling: comparison with evolutionary models for the Alboran Sea region. Pure Appl. Geophys. 165, 1683–1706. doi:10.1007/s00024-008-0395-8
van Hinsbergen, D. J. J., Vissers, R. L. M., and Spakman, W. (2014). Origin and consequences of western Mediterranean subduction, rollback and slab segmentation. Tectonics 33, 393–419. doi:10.1002/2013tc003349
Vergés, J., and Fernández, M. (2012). Tethys-Atlantic interaction along the Iberia-Africa plate boundary: the Betic-Rif orogenic system. Tectonophysics 579, 144–172. doi:10.1016/j.tecto.2012.08.032
Villaseñor, A., Chevrot, S., Harnafi, M., Gallart, G., Pazos, A., and Serrano, I. (2015). Subduction and volcanism in the Iberia-North Africa collision zone from tomographic images of the upper mantle. Tectonophysics 663, 238–249. doi:10.1016/j.tecto.2015.08.042
Keywords: subduction-transform edge propagator fault, slab tearing, continental delamination, topography evolution, Gibraltar Arc subduction system
Citation: Negredo AM, Mancilla FdL, Clemente C, Morales J and Fullea J (2020) Geodynamic Modeling of Edge-Delamination Driven by Subduction-Transform Edge Propagator Faults: The Westernmost Mediterranean Margin (Central Betic Orogen) Case Study. Front. Earth Sci. 8:533392. doi: 10.3389/feart.2020.533392
Received: 07 February 2020; Accepted: 08 September 2020;
Published: 06 October 2020.
Edited by:
Vlad Constantin Manea, National Autonomous University of Mexico, MexicoReviewed by:
Oguz Gogus, Istanbul Technical University, TurkeyRob Govers, Utrecht University, Netherlands
Copyright © 2020 Negredo, Mancilla, Clemente, Morales and Fullea. This is an open-access article distributed under the terms of the Creative Commons Attribution License (CC BY). The use, distribution or reproduction in other forums is permitted, provided the original author(s) and the copyright owner(s) are credited and that the original publication in this journal is cited, in accordance with accepted academic practice. No use, distribution or reproduction is permitted which does not comply with these terms.
*Correspondence: A. M. Negredo, YW5lZ3JlZG9AZmlzLnVjbS5lcw==
 A. M. Negredo
 F. d. L. Mancilla
 C. Clemente1
 J. Morales
 J. Fullea