- 1State Key Laboratory of Hydrology-Water Resources and Hydraulic Engineering, Hohai University, Nanjing, China
- 2College of Water Conservancy and Hydropower Engineering, Hohai University, Nanjing, China
- 3College of Agricultural Engineering, Hohai University, Nanjing, China
- 4Department of Engineering, University of Cambridge, Cambridge, United Kingdom
Urban stormwater runoff is often considered as one of the most significant contributors to water pollution. Particulates are commonly regarded as the primary form of pollutant transport in the urban environment, but the contribution from the dissolved pollutants can also be significant. This study aims to investigate the dissolved pollutant transport process over urban catchments, especially the effects of buildings and spatial distribution of pollutants. The concept of “exchange layer” has been adopted and an equation has been proposed to describe the release process of dissolved pollutant from the exchange layer to the runoff water. A horizontal two-dimensional water flow and pollutant transport model has been developed for predicting dissolved pollutant runoff based on the shallow water assumptions and the advection-diffusion equation. A series of laboratory experiments have been conducted to verify the proposed model. It has been demonstrated that both the rainfall runoff and the pollutant runoff can be predicted accurately. Buildings slow down the runoff and pollutant transport processes, especially when buildings are staggered. The non-uniform distribution of pollutants over the catchment greatly influences the pollutant transport process over the catchment. This work provides insight into the effects of buildings and initial pollutant distribution on the dissolved pollutant transport phenomenon, which can help better design the pollution mitigation strategies.
Introduction
Urban stormwater runoff has been widely recognized as an important source for water quality degradation (Brezonik and Stadelmann, 2002; Shaw et al., 2006; Brett and Gavin, 2010; Revitt et al., 2014). Ongoing urbanization and thus the increased urban ground area are likely to exacerbate the problem (Wang et al., 2013; Naves et al., 2017). In this context, an appropriate pollutant transport model for predicting the runoff processes over contaminated grounds will be valuable for understanding the urban pollutant transport process and mitigating water pollution.
Many researchers have focused on the pollutant transport over simple impervious surfaces, such as road and roof surfaces (Metcalf and Eddy Inc, 1971; Sartor et al., 1974; Kim et al., 2005; Egodawatta et al., 2007, 2009; Muthusamy et al., 2018), and have established and improved the first-order decay model. Metcalf and Eddy Inc (1971) proposed the exponential wash-off equation, which assumes that the rate of pollutant transport from an impervious surface is directly proportional to the runoff rate and the availability of pollutants. Sartor et al. (1974) verified the exponential equation through rainfall simulation experiments. Egodawatta et al. (2007, 2009) applied such a model to pollutant transport on road and the roof surfaces. They suggested that a rainfall event only had the capacity (depending on rainfall intensity) to transport a fraction of pollutants available on the surface. Hence, an additional term referred to as the “capacity factor” is recommended to the exponential equation. Recently, Muthusamy et al. (2018) noted that the capacity factor and the wash-off coefficient were interdependent and further improved the exponential equation. Until now, current urban water quality models are generally based on the above exponential equation (e.g., SWMM, STORM, etc.). This simple exponential relationship neglect spatial heterogeneity of the catchment. The efficacy of this empirical relationship relies heavily on the extensive calibration of the wash-off coefficients, which limits their predictive capacity. Only few studies have been conducted to establish physically-based models of the pollutant transport in urban landscapes. Shaw et al. (2006) developed a saltation-type wash-off model in which particles are repeatedly ejected from the impervious surface by raindrop impacts and are transported laterally by the overland flow, while settling back to the surface. Massoudieh et al. (2008) proposed a wash-off model with the assumption that detachment and reattachment of pollutants are considered as rate-limited processes and the detachment rate varies with the flow velocity according to a power law. Hong et al. (2016) and Hong Y. et al. (2017) presented a two-dimensional pollutant transport model by combining the Hairsine-Rose (H-R) model and the FullSWOF (Full Shallow-Water equations for Overland Flow) model. In the above studies, particulate pollutants (solids) were often chosen as the targeted pollutants or the surrogate of other pollutants, based on the assumption that most of the pollutants are adsorbed on the surface of the solids (Herngren et al., 2005; Miguntanna et al., 2013). In practice, stormwater-borne pollutants should be divided into the dissolved and the particulate phases (Sheng et al., 2008; Hong Y. et al., 2017). Liu et al. (2013) noted that using solids as a surrogate to estimate other pollutant species is inappropriate. Goonetilleke et al. (2005) indicated that some pollutant moved in the dissolved form, which was more bio-available and was therefore more likely to cause water pollution. Pollutants such as nitrogen, bacteria, and heavy metals can be dissolved in water and pose serious water pollution issues, such as eutrophication and pandemics. Hence, the common management strategy that targets the particulate pollutants in urban stormwater management often has only limited efficiency (Goonetilleke et al., 2005). An accurate pollutant transport model can accurately predict the pollutant transport process, which is crucial for the design of pollution mitigation strategies such as rainwater collection and treatment plants.
Previous studies about the dissolved pollutant (solute) transport have mainly focused on the pollutant transport on soil slopes. The mixing layer theory and the exchange theory are the two predominant theories used to describe the mechanism of the solute transport from soil ground into overland flow (Ahuja et al., 1981; Ahuja and Lehman, 1983; Gao et al., 2004, 2005; Walter et al., 2007; Yang et al., 2016). They all have suggested that a “thin layer” (mixing layer or exchange layer) near the soil surface controls the solute transfer between the soil and overland flow. Only few studies (Xiao et al., 2016, 2017) investigated the dissolved pollutant transport over impervious surfaces. To bridge the gap in our understanding of the dissolved pollutant transport, Xiao et al. (2016, 2017) conducted a series of experiments and proposed a mathematical model to describe the transport of dissolved pollutants. However, these studies were conducted on a one-dimensional case and no studies have been reported to take into account the effect of buildings in urban catchments. Buildings’ geometry and layout are very complex. Some studies (Cea et al., 2010; Liang et al., 2015) proved that buildings and their layouts can greatly affect the rainfall runoff process, which directly affects the pollutant transport process. Hence, it is essential to consider the layout of buildings when investigating the dissolved pollutant transport over urban catchments.
In addition, many previous studies assumed that the pollutants were uniformly distributed on the ground surface (Sartor et al., 1974; Kim et al., 2005; Egodawatta et al., 2007, 2009; Xiao et al., 2017; Muthusamy et al., 2018). Some researchers (Pan et al., 2017; Hong N. et al., 2017) have suggested that a practical urban catchment was much more complicated with large spatial variations in the degree of ground contamination. Naves et al. (2017) indicated that the total load of pollutant on a road surface was not uniform but was influenced by wind and rainfall characteristics, traffic conditions, catchment characteristics, and human activities. To the knowledge of the authors, there has been insufficient research about the influence of pollutant distribution on the pollutant transport process.
The objective of this study is to investigate the dissolved pollutant transport process over urban catchments, especially the effects of buildings and non-uniform pollutant distribution. To do this, a two-dimensional dissolved pollutant transport model has been developed to simulate the stormwater runoff in built-up areas, combining the shallow water equations, the advection-diffusion equation and an equation to describe the release process of dissolved pollutant from impervious surface to the runoff water. A series of laboratory experiments have been conducted using artificial rainfall simulators and idealized urban catchments. Observed experimental data were used to validate the newly-developed mathematical model. Finally, the model is applied to investigate the sensitivity of the results to the initial non-uniform distribution of pollutants.
Mathematical Model
Shallow Water Equations
The fully-dynamic non-linear shallow water equations (SWEs) are widely used to predict the rainfall-runoff processes (Liang et al., 2015). For a rainfall event on an impermeable urban catchment, the horizontal extent of the surface runoff is much greater than the water depth. Hence, the depth-averaged modeling approach is appropriate for this phenomenon. When neglecting the viscosity and wind effect, the standard SWEs can be expressed as:
where η is the water surface elevation; t is the time; U and V are the two components of the velocity in the x and y directions, respectively; I is the rainfall intensity; H is the water depth; g is the gravitational acceleration; n is the Manning’s roughness coefficient.
The above SWEs can be numerically solved by a highly efficient Total Variation Diminishing (TVD) MacCormack scheme. This scheme consists of a predictor step, a corrector step and a TVD modification step. It is of second order accuracy in both time and space. This numerical scheme is not herein repeated, as details can be found in Liang et al. (2006, 2007b). Liang et al. (2015) verified this scheme in idealized catchments containing buildings. In flood inundation modeling, four building representation methods are commonly used to represent the unsteady and three-dimensional flow through urban landscapes: building resistance (BR), building block (BB), building hole (BH), and building porosity (BP). In the BR method, a large resistance coefficient is imposed to cells that fall within building footprints (Liang et al., 2007a). In the BB method, the bed elevation is raised according to the heights of buildings (Cea et al., 2010). In the BH method, the buildings are represented as holes in the numerical mesh, and free-slip wall boundary conditions are enforced at building walls (Cea et al., 2010). In the BP method, spatially distributed parameters, including porosity and drag coefficient, are introduced to model the effects of buildings on flood water movement without resolving their exact geometries (Schubert and Sanders, 2012). By comparing these four methods of representing buildings, the BH method was found to perform best in balancing the numerical accuracy and stability (Cea et al., 2010; Schubert and Sanders, 2012). The BH method is adopted to account for the effect of buildings in this study.
Pollutant Transport Equation
In this study, we focus on the dissolved pollutant transport process, which is governed by the advection-diffusion equation. The governing equation can be written as:
where, C is the depth-averaged pollutant concentration; Dxx, Dxy, Dyx and Dyy constitute the dispersion-diffusion tensor for depth-averaged mixing, whose principal direction coincides with the flow direction. qC represents the source term, which is used to introduce the pollutant distributed on the ground into the simulation.
Liang et al. (2010) proved that the advection-diffusion equation can also be solved by the TVD MacCormack scheme. In this scheme, a second-order accurate central scheme is used in the diffusion stage, and a five-point TVD modification is imposed on the standard MacCormack scheme in the advection stage. Liang et al. (2010) examined this model’s performance in both idealized and real-life situations, and suggested that this model has sufficiently high efficiency and accuracy for solving the pollutant transport problems in natural aquatic environments. The detailed theory and treatment with regard to this numerical scheme can be found in Liang et al. (2010). In this study, the values of Dxx, Dxy, Dyx, and Dyy are calculated according to Liang et al. (2010).
In modeling the pollutant runoff process, a key issue is the determination of the function of the source term qC, which describes how pollutants initially located on the ground surface are dissolved into the water column. When studying the dissolved pollutant transport on soil slopes, most researchers (Ahuja et al., 1981; Ahuja and Lehman, 1983; Gao et al., 2004, 2005; Walter et al., 2007; Yang et al., 2016) have suggested that a “thin layer” (mixing layer or exchange layer) near the soil surface controls the pollutant transfer between the soil ground and overland flow. In this study, we also adopt the concept of “exchange layer” and assume that the exchange layer controls the release process of dissolved pollutant into overland flow. According to previous studies (Sartor et al., 1974; Egodawatta et al., 2007, 2009; Xiao et al., 2017; Muthusamy et al., 2018), the amount of pollutant remaining on the surface should taper off during a rainfall event, indicating an exponential function. Therefore, we put forward the following expression for qC:
where α and β are the two empirical parameters; I is the rainfall intensity. According to the law of mass conservation, all the pollutant in a grid cell should be released into the water column given a sufficiently long time, regardless of rainfall intensity.
where PD is the pollutant load density equal to the initial amount of pollutant per unit horizontal area. Substituting Eq. (5) into Eq. (6) and integrating Eq. (6), we obtain:
Combining Eqs. (5) and (7), we can obtain the final expression for qC:
where α is the comprehensive coefficient with a unit of m–1.
Experimental Setup
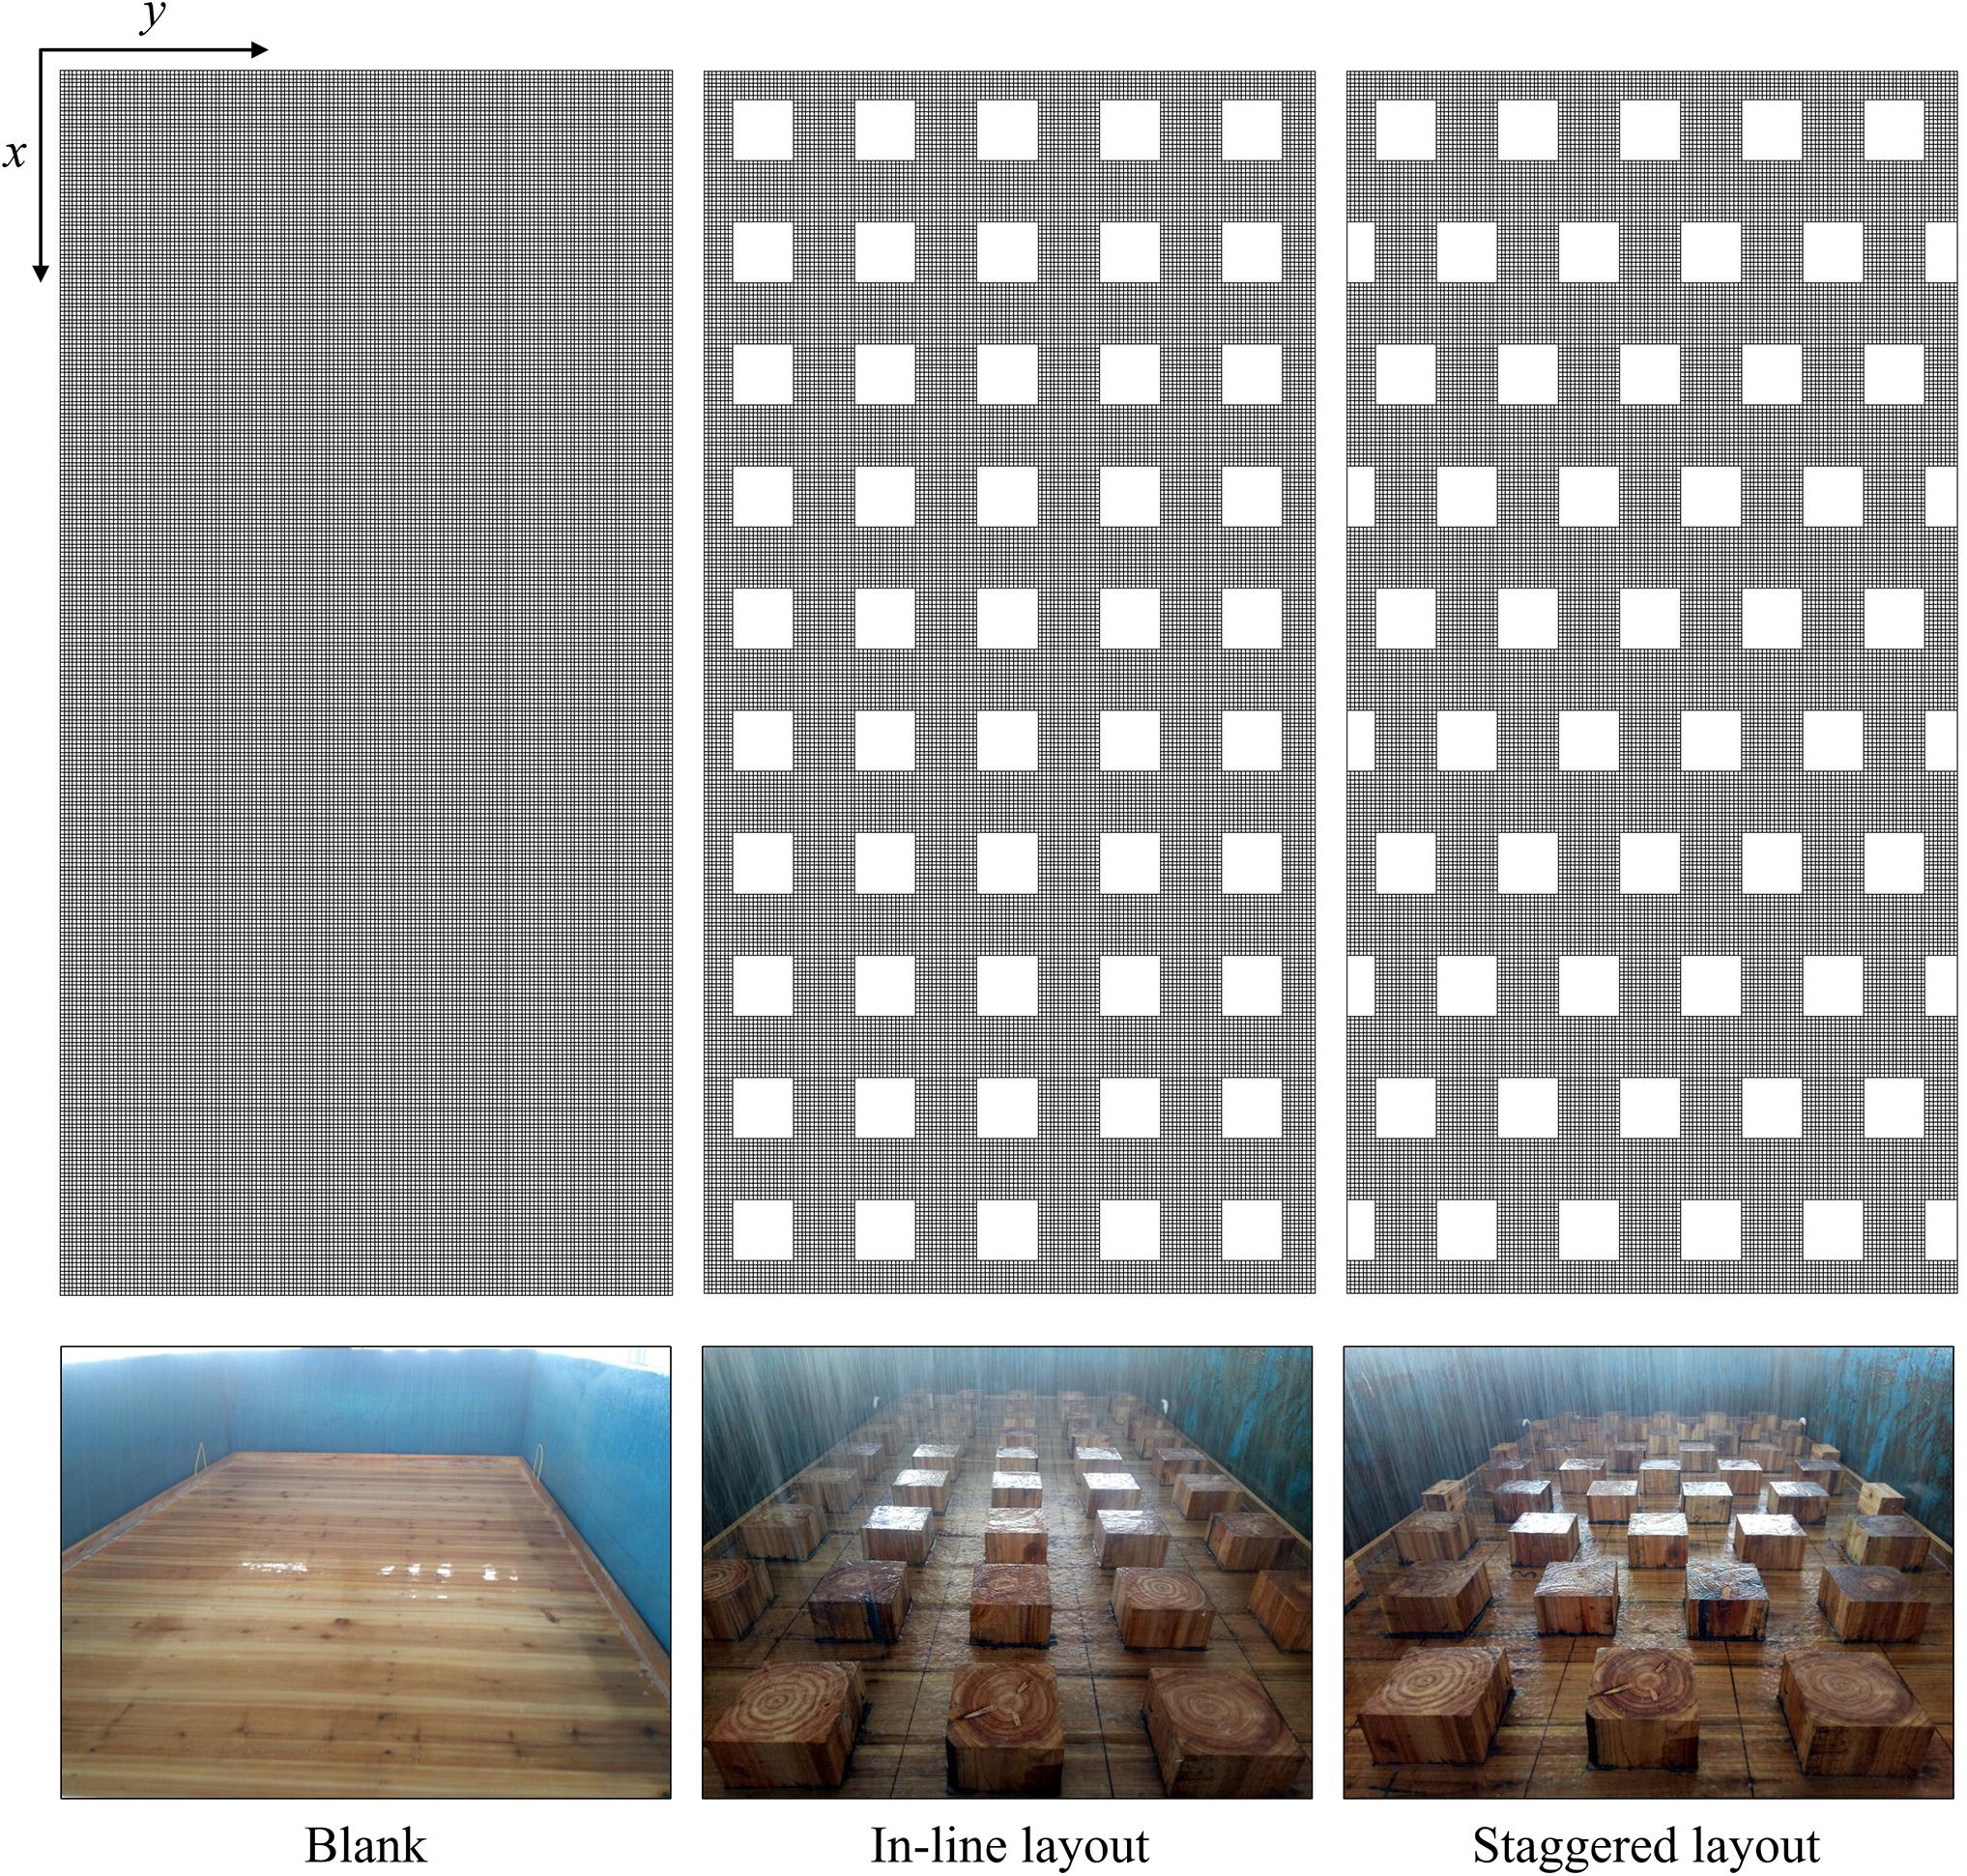
A series of laboratory experiments have been conducted in a rainfall-simulation hall to validate the presented model. Only constant rainfall events were considered in this research, with rainfall uniformity of over 90%. The rainfall uniformity is defined as the ratio of the minimum rainfall intensity to the maximum rainfall intensity over the whole catchment. Hence, a rainfall uniformity of 90% means that the minimum rainfall intensity measured at any point is 90% of the maximum rainfall intensity over the catchment. Water nozzles are located 17 m above the model catchment, so that raindrops can reach their final velocity like natural rainfall events. Wooden boards of 2.96 m in length, 1.48 m in width and 0.02 m in thickness are used to simulate the impervious catchments. Three short walls with the height of 4 cm are fixed on three sides of the catchment so that runoff water can only leave the catchment from the downstream outlet. In a real urban area, the configurations of buildings are very complex and vary from place to place. It is unrealistic to test all the configurations of the buildings in this paper, and the main aim of the laboratory experiments is to verify the mathematical model in this study. Hence, following to Liang et al. (2015), only two layouts of buildings (in-line arrangement and staggered arrangement) and one plain catchment without buildings (used as a reference) were constructed in this study, as shown in Figure 1. The buildings occupy 25 % of the catchment area, which is within the range of typical urban regions. To ensure the uniformity of the pollutant distribution in the experiments, each wooden board is divided into 50 (5 × 10) small squares and one building is fixed in each square with glue. In China’s cities, cubical buildings are very common. Hence, cubical model buildings 0.148 m long, 0.148 m wide, and 0.10 m high are fabricated using the same wooden material. To ensure that the properties of the buildings and impervious catchments are the same, all the surfaces were treated in the same way. Similar to previous studies (Deng et al., 2005; Xiao et al., 2017; Zhang et al., 2018), table salt (NaCl) has been chosen as the dissolved pollutant tracer due to its wide availability and ease of use. In the BH method, buildings are excluded from the computational domain, whereas, the rainwater falling on top of the buildings is compensated by increasing the imposed rainfall intensity over the computational domain. Similarly, salt was spread uniformly on the catchments, except on the top of buildings. The total amount of salt apllied in each experiment is 125 g.
In this study, the catchment is considered to be of a uniform slope with an angle of 1° to the horizontal. For the convenience of collecting runoff samples, the catchment is placed in a steel flume (3 × 1.5 × 0.5 m). The slope of the flume can be adjusted via a hydraulic system. Four constant rainfall intensities are tested in the experiment. The selection of the rainfall intensity is mainly based on the optimal operation range of the rainfall simulators, rather than the climate of a particular region. When scaling the experiment up, then the used rainfall intensities correspond to heavy downpours in tropic regions. Each rainfall event lasts for 1680 s. Runoff was collected at the downstream outlet of the catchment and monitored by continually measuring the water volumes at short intervals. Salt concentration was determined using a calibrated conductivity meter (Bante 950). The conductivity meter used had a built-in temperature compensation circuit so that all concentration values were referenced to a standard temperature. The detailed information about rainfall-simulation system, pollutant spreading, sample collection and data recording can be found in Xiao et al. (2017) and Zhang et al. (2018).
Numerical Modeling
The Finite difference method (FDM) is applied to solve the set of equations given in section “Mathematical Model.” Specifically, as mentioned before, the TVD MacCormack scheme is used to solve both the SWEs and the advection-diffusion equation. The full implementation details of the core numerical scheme can be found in Liang et al.(2006, 2007b), as well as the key numerical treatments regarding wetting/drying, adaptive time stepping, etc. In the actual calculations, the SWEs and the advection-diffusion equation are calculated separately. The SWEs are calculated first and then the computed results (i.e., the variation of H, U, and V with time at every grid point) are used as known data for solving the advection-diffusion equation. Identical numerical mesh is used in the SWEs and the advection-diffusion equation for the same catchment. To suit the rectangular shapes of model catchment and buildings, structured rectangular grid is used in this study. The grid sensitivity analysis is performed for staggered layout of buildings, because the flow pattern is more complex than in other layouts. Three types of mesh with different grid sizes are tested, which are referred to as GS1 (the grid size is 0.0098667 m), GS2 (the grid size is 0.0049333 m), and GS3 (the grid size is 0.0032889 m). Computed results indicate that mesh refinement produces no significant change in the results, while the computational cost increases significantly. Therefore, GS1 is chosen as the numerical mesh to use in the parametric studies. The same grid size is used in all catchments, as shown in Figure 1. Each catchment is discretized into 301 evenly distributed grid points in the x direction and 151 evenly distributed grid points in the y direction. The time step is restricted by the well-known Courant-Friedrich-Lewy condition. With a time step of 0.02 s, we estimate that the maximum Courant number is around 0.5. At the outlet boundary, the flow undergoes a free fall after running out of the domain; at the other three boundaries, the solid wall condition is specified.
Results
Water Runoff Process
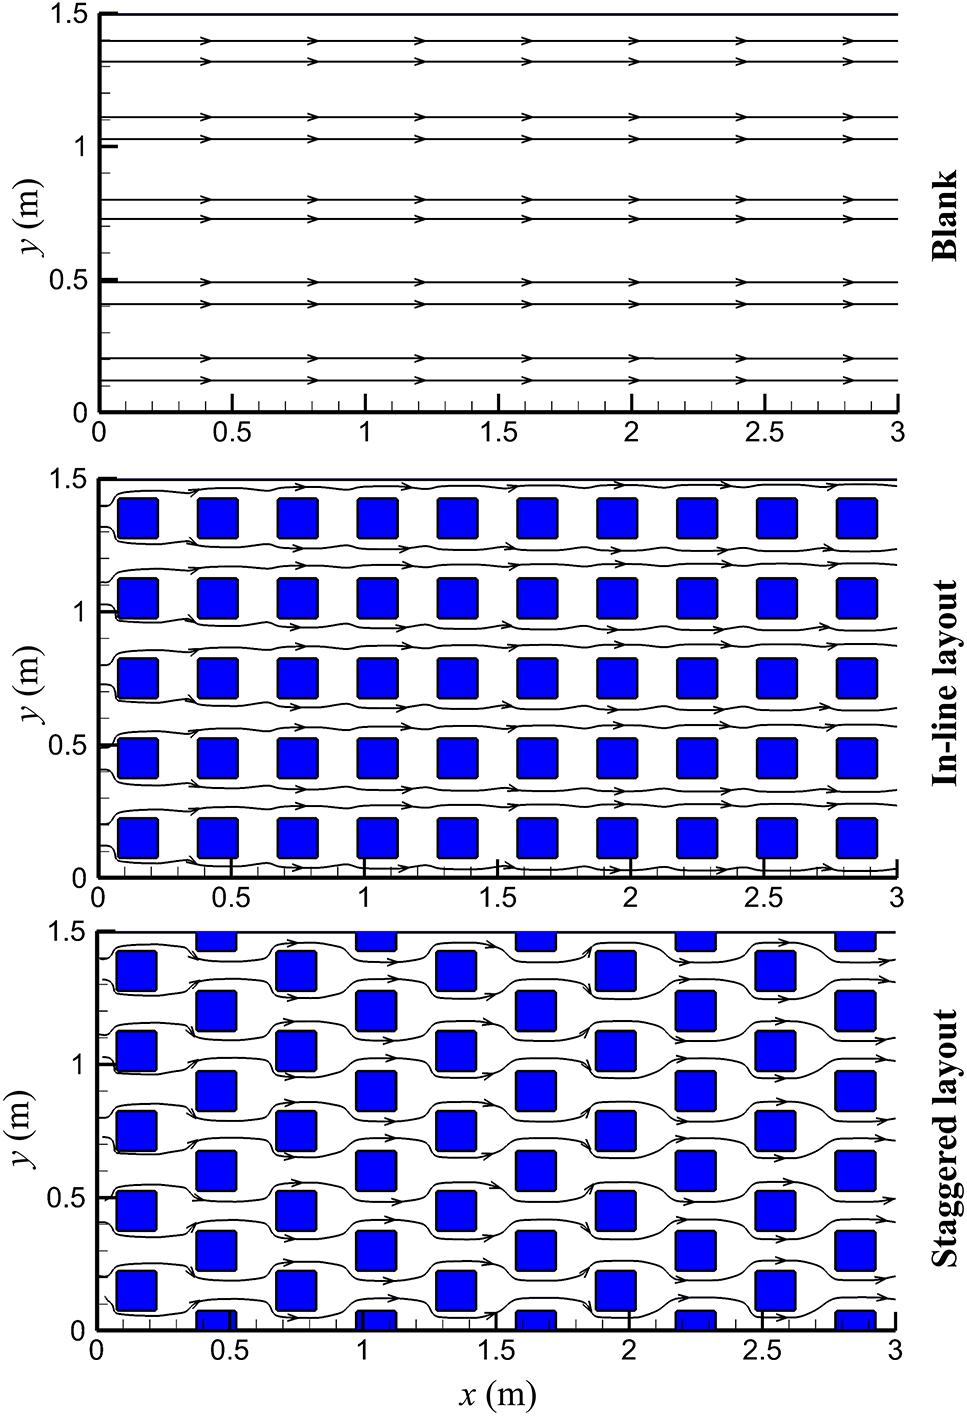
A large quantity of experimental data can be obtained in a relatively short period of time with the use of the rainfall simulator over small idealized catchments, which are then used to validate the computational model. The Nash-Sutcliffe efficiency (NSE) (Nash and Sutcliffe, 1970) has often been adopted to evaluate the model performance (Yang et al., 2016; Bonhomme and Petrucci, 2017). In this study, the estimation of Manning’s parameter (n) is achieved by maximizing the Nash-Sutcliffe efficiency (NSE) of the prediction, with an adjustment interval of 0.005 s/m1/3. Figure 2 shows all the water runoff processes under various conditions, including both measured and computed results. The values of Manning roughness coefficient n has been determined to be 0.045 s/m1/3 for the blank board and 0.050 s/m1/3 for other two boards. The difference of n between different catchments may be related to the roughness height due to the existence of wooden blocks. In Figure 2, the runoff process between 500 s and 1500 s is omitted to improve the visualization of the rising and falling limbs of the curves. It shows that: (1) the SWEs are capable of predicting the rainfall runoff processes over catchments with and without buildings; (2) for each catchment, the runoff rate increases at first and then reaches equilibrium, which is equal to the rate of the rainfall input, followed by a sharp fall when the rainfall stops; (3) buildings can slow down the runoff concentration, and the staggered layout of buildings is more effective in increasing the time of concentration; (4) in the falling limb of the runoff process, buildings can delay the runoff decline and the staggered layout of buildings extends the time of decline more than the in-line layout. These observations can be attributed to: (a) buildings can frequently change the direction of the runoff flow and thus increase the length of the flow path, as shown in Figure 3, and (b) the presence of buildings increases the flow resistance. Figure 4 presents the snapshots of the water depth and velocity distributions over the three considered catchments. At time t = 180 s, all the catchments have attained a steady state. It is evident that buildings in general can reduce the flow velocity and increase the water depth, especially on the upstream side of the buildings. Similar results were found in previous studies (Cea et al., 2010; Liang et al., 2015). The overland flow can only remain laminar in the early stage of the rainfall or when the runoff almost reduces to zero after the rainfall stops. Under the impact of raindrops and surface roughness, turbulence is triggered very quickly soon after the start of the rainfall.
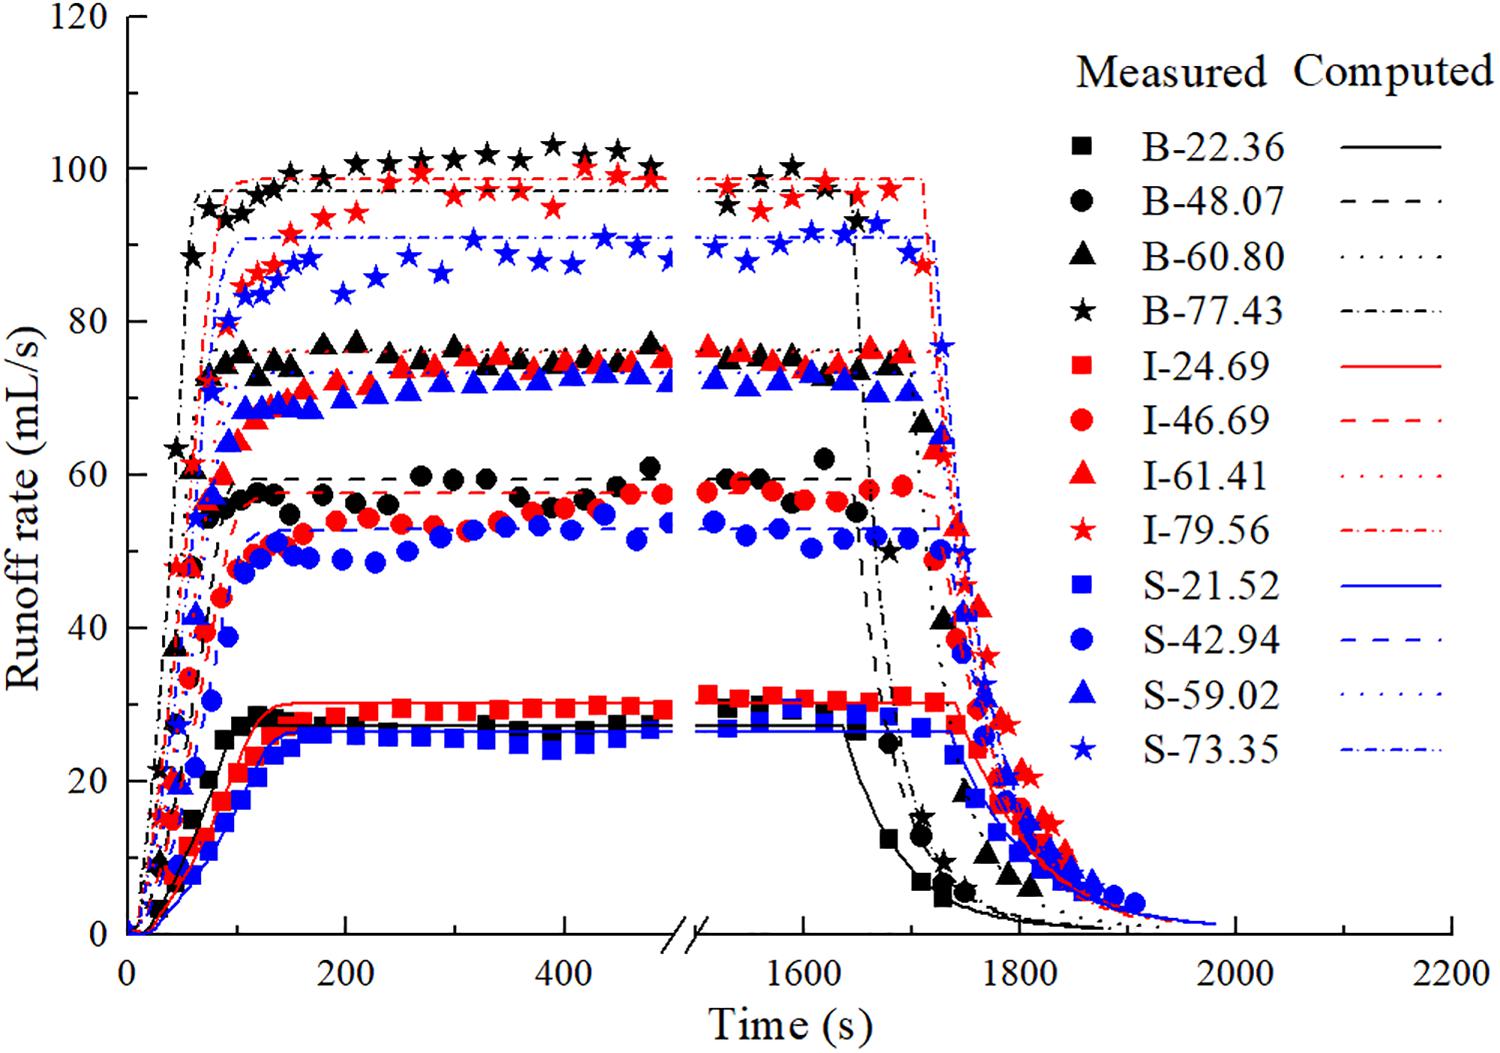
Figure 2. Close-up of the measured and computed runoff rates. In the figure legend, B-22.36 refers to blank board (without building blocks) subject to 22.36 mm/h rainfall. Similar conventions are applicable to other notations, with letter “I” referring to the in-line layout and “S” referring to the staggered layout.
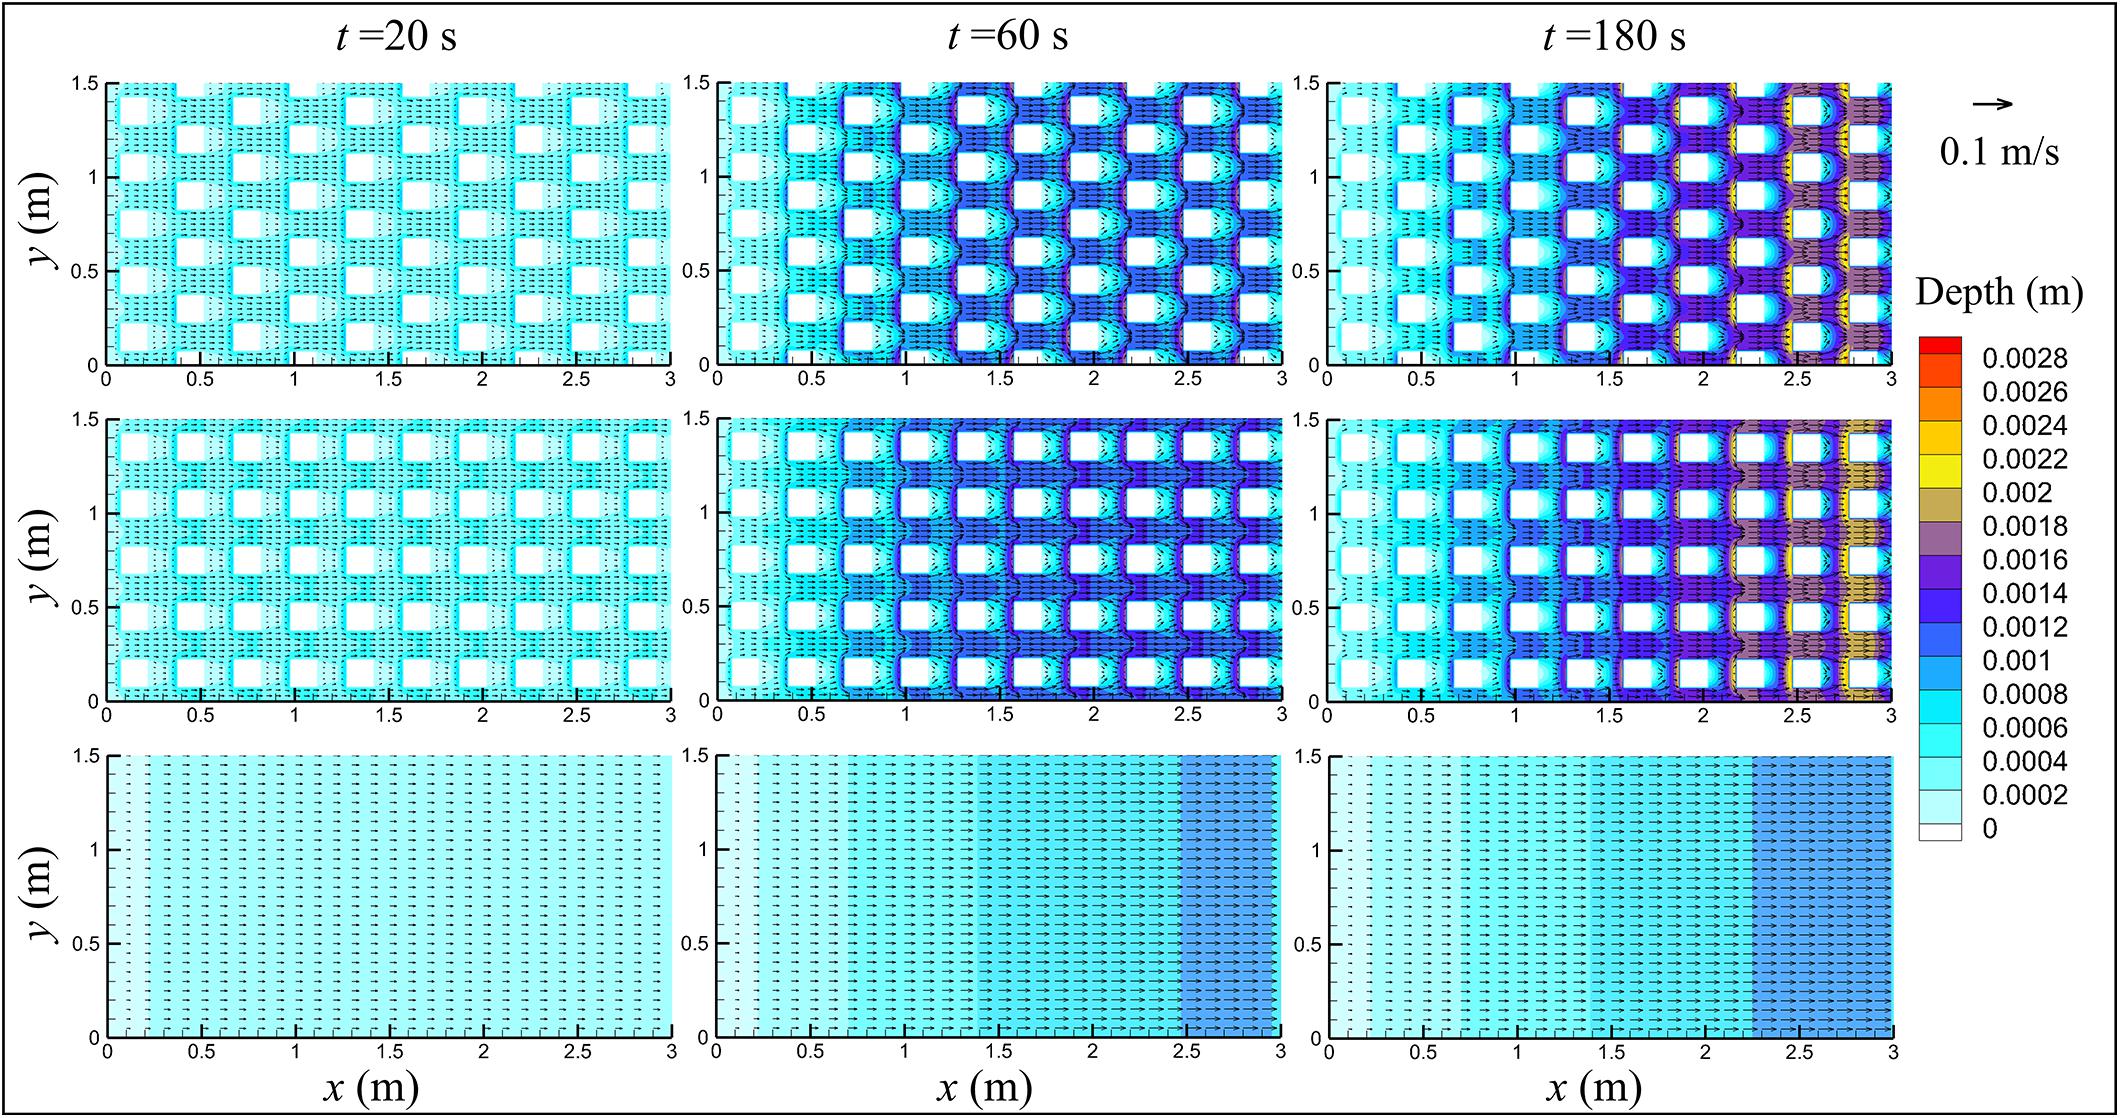
Figure 4. Snapshots of the water depth and velocity distributions in three cases (B-48.07; I-46.69; S-42.94).
Runoff of Uniformly-Distributed Pollutant
In the pollutant transport model presented in this study, only one parameter (α) needs to be determined according to the experimental data. As before, the value of α for each experiment is obtained by maximizing the Nash-Sutcliffe efficiency (NSE) of the prediction. The obtained values for different building layouts are listed in Table 1. The measured and predicted pollutant concentrations, under different conditions, are shown in Figure 5. The pollutant concentration decreases with time and finally approaches zero, which is satisfactorily predicted by the presented transport model. In addition, the pollutant concentration is affected by the rainfall intensity and the layout of buildings. The concentration increases as the rainfall intensity decreases.
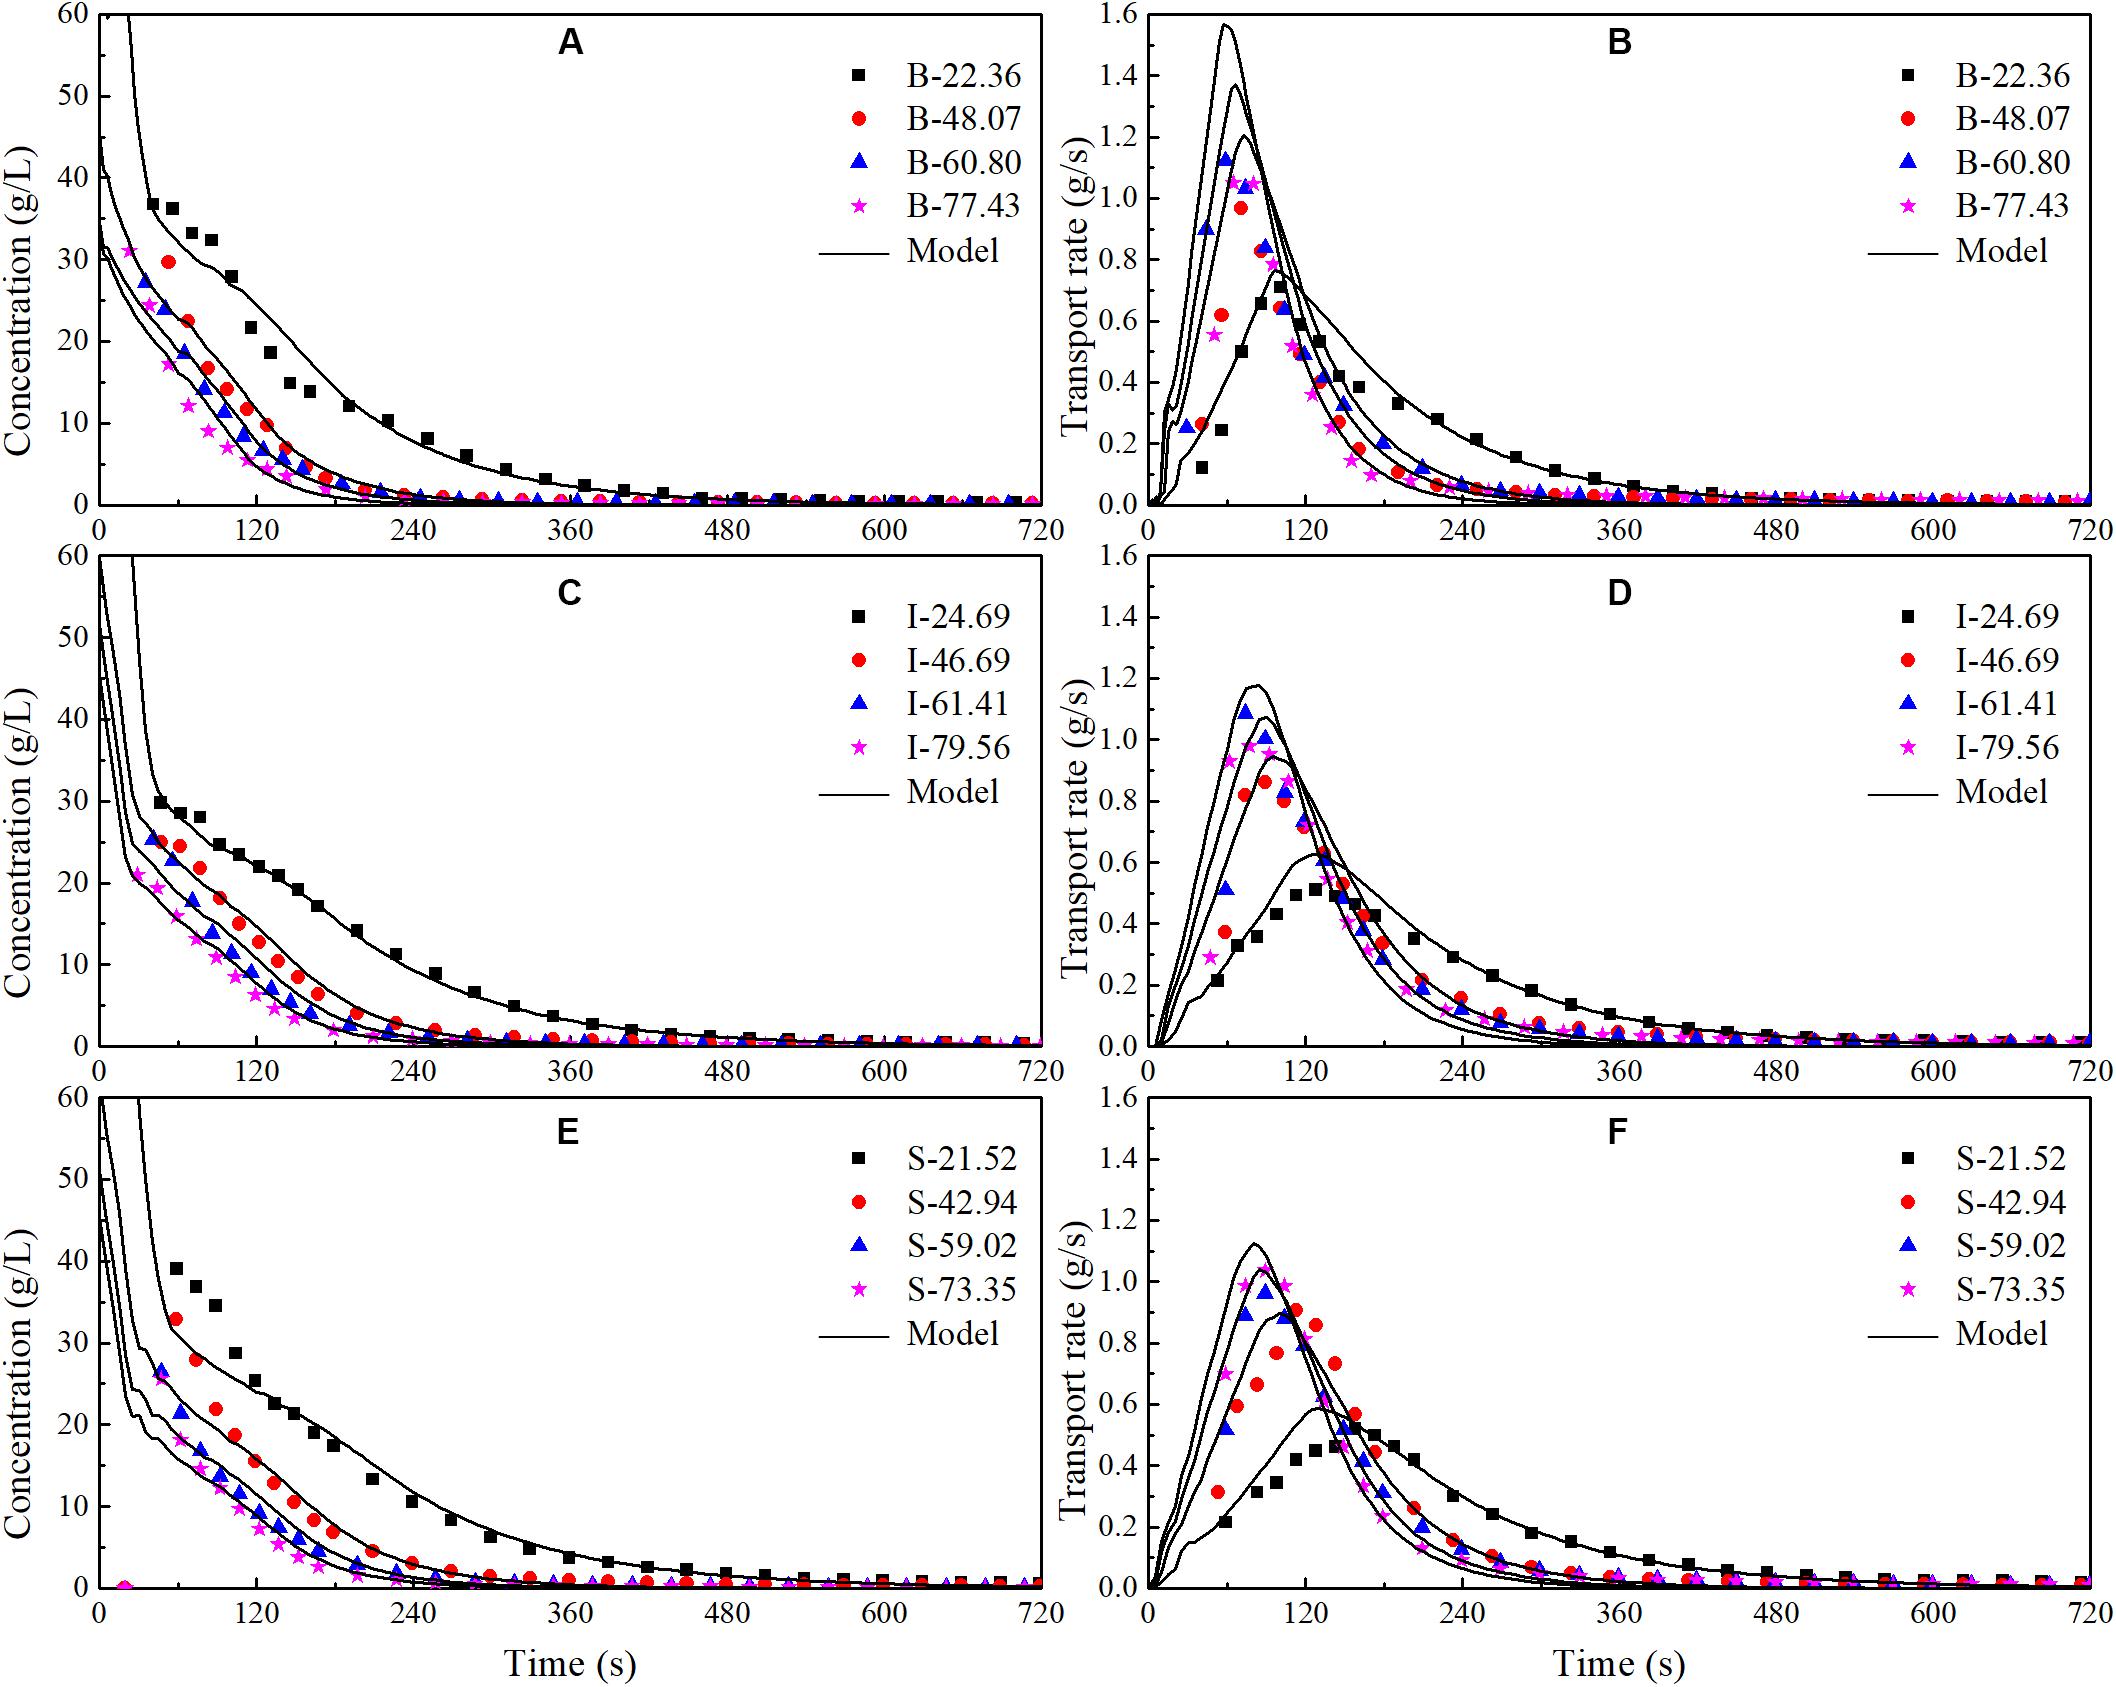
Figure 5. Measured and computed pollutant concentrations and transport rates. (A) Concentrations on blank board. (B) Transport rates on blank board. (C) Concentrations with in-line layout. (D) Transport rates with in-line layout. (E) Concentrations with staggered layout. (F) Transport rates with staggered layout.
Pollutant transport rate directly reflects the pollutant transport process. Figure 5 shows the measured and predicted pollutant transport rates under different conditions. It is evident that the pollutant transport rate in all conditions show a similar single-peak variation, consisting of a rising limb at the beginning and a falling limb later on. In each case, the pollutant transport rate increases from zero to a maximum and then decreases to zero. The maximum pollutant transport rate in each condition is related to the rainfall intensity and the layout of buildings. The larger the maximum pollutant transport rate, the shorter the time required for the maximum transport rate to occur after the start of rainfall. Figure 5 indicates that the present model over-predicts the pollutant transport rate, especially with regard to the maximum value. It is mainly because, (a) the release process of dissolved pollutant is described by an empirical relationship rather than by an accurate process-based equation; (b) a small fraction of pollutant on the surface cannot be collected in the experiment because of splashing, small leakage, etc; (c) the measured pollutant transport rate at any time is the average of the pollutant transport rate over the sampling interval of 10 s, which tends to underestimate the maximum value. Overall, the measured pollutant transport rates are in good agreement with those predicted by the presented numerical model.
Figure 5 suggests that the differences in the concentration decay among the different building layouts are insignificant. This may be attributed to the small size of the experimental catchments. It is still can be seen that the existence of buildings slows down the pollutant transport rate, especially in the staggered layout case. This is because the buildings slow down the runoff process which drives the pollutant transport. The influence of buildings and their layout on the pollutant transport process can be generally quantified by the values of α and αI, as shown in Table 1. The value of αI is an indicator of the change in the pollutant release rate. The results show that for the same rain event the values of α and αI do not change significantly. This is mainly because the buildings do not play a significant role on the pollutant release from the impervious ground into runoff water. They only control the runoff process. Figure 6 presents the snapshots of the pollutant concentration distributions in the three model catchments. It is evident that buildings do have a significant impact on the pollutant concentration upstream and downstream of buildings, especially in the initial runoff stage. For the same building layout, the value of α increases with the decreasing rainfall intensity, while the opposite is the case for αI. It implies that the rainfall intensity is an important factor that controls the pollutant transport process.
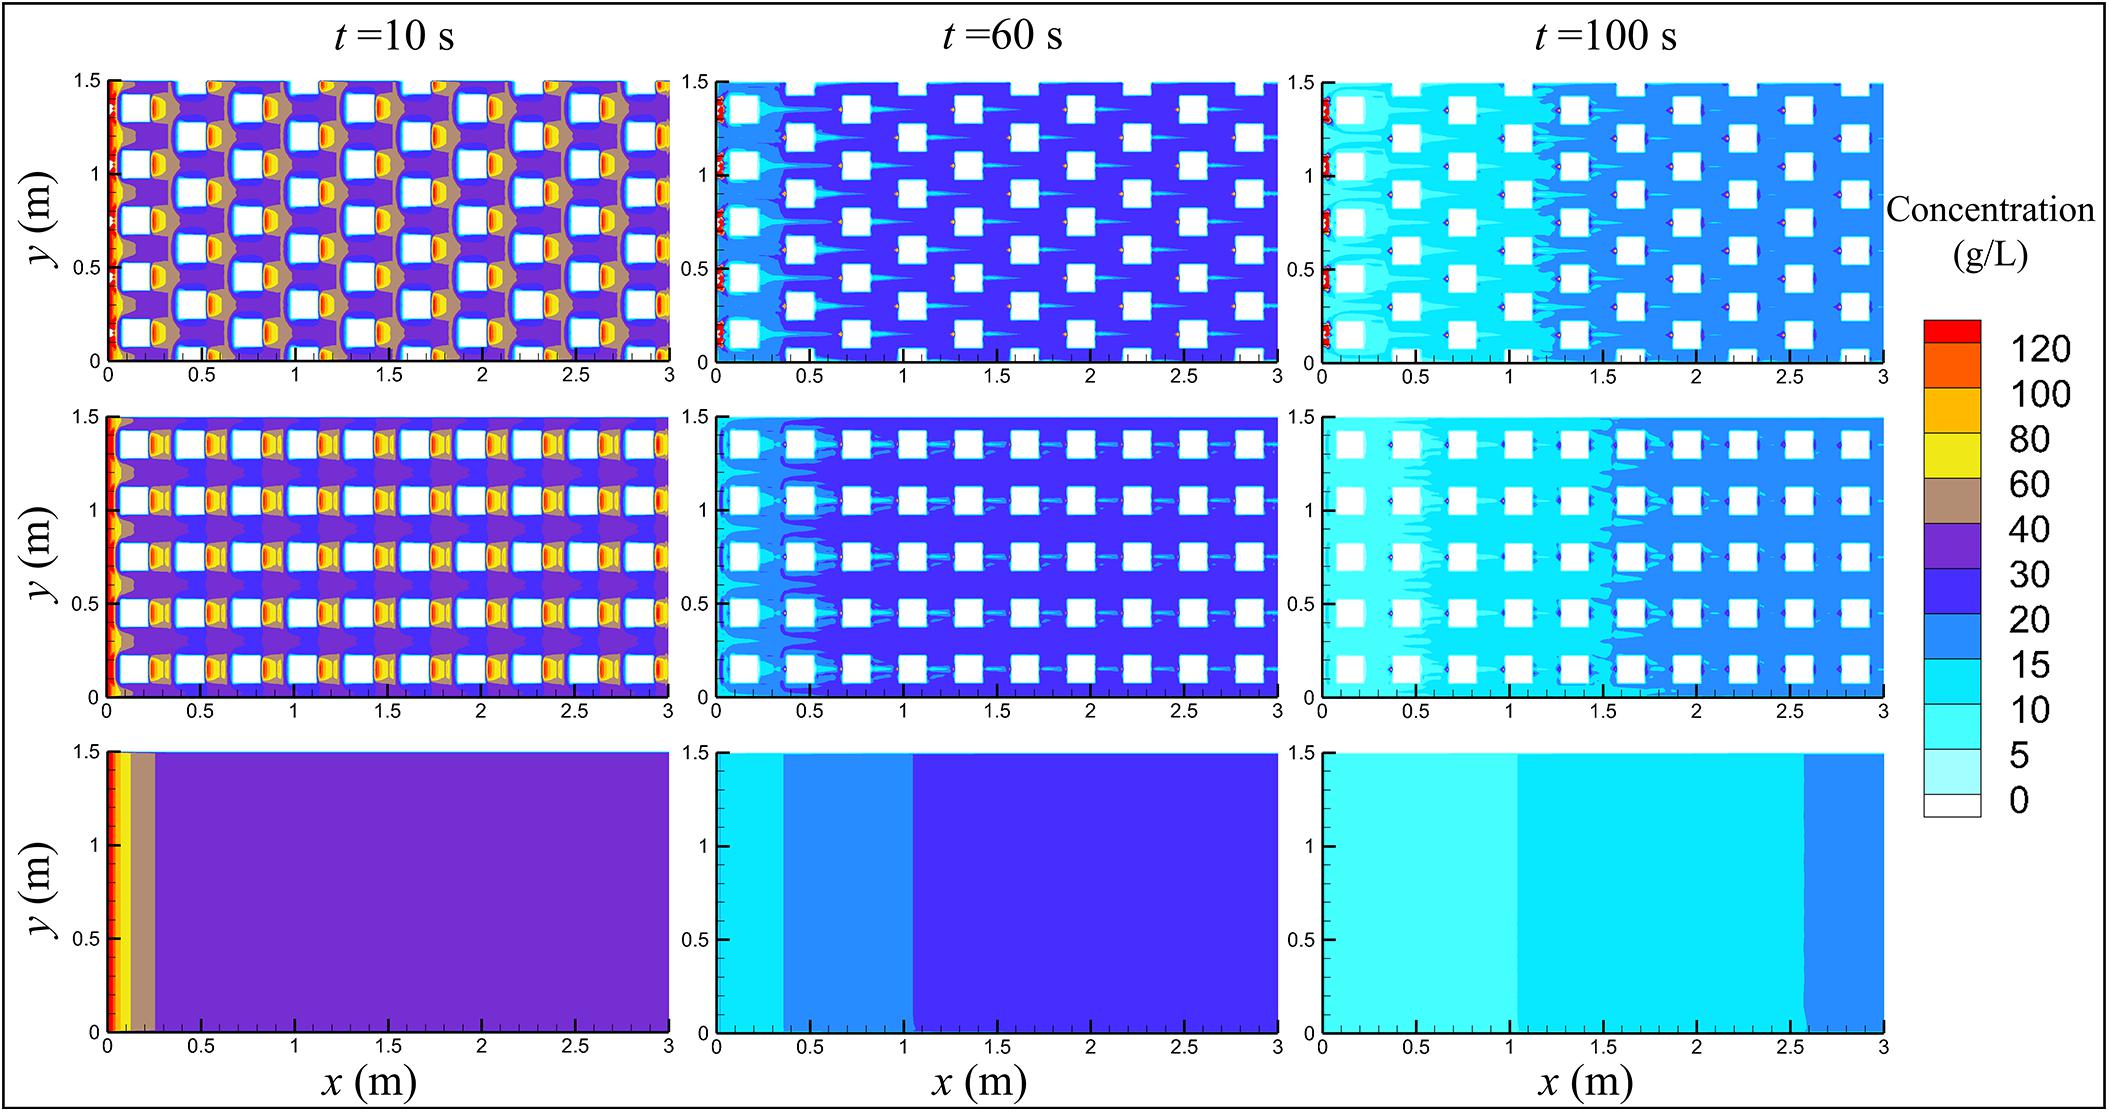
Figure 6. Snapshots of the pollutant concentration distributions in three cases (B-48.07; I-46.69; S-42.94).
Runoff of Non-uniformly Distributed Pollutants
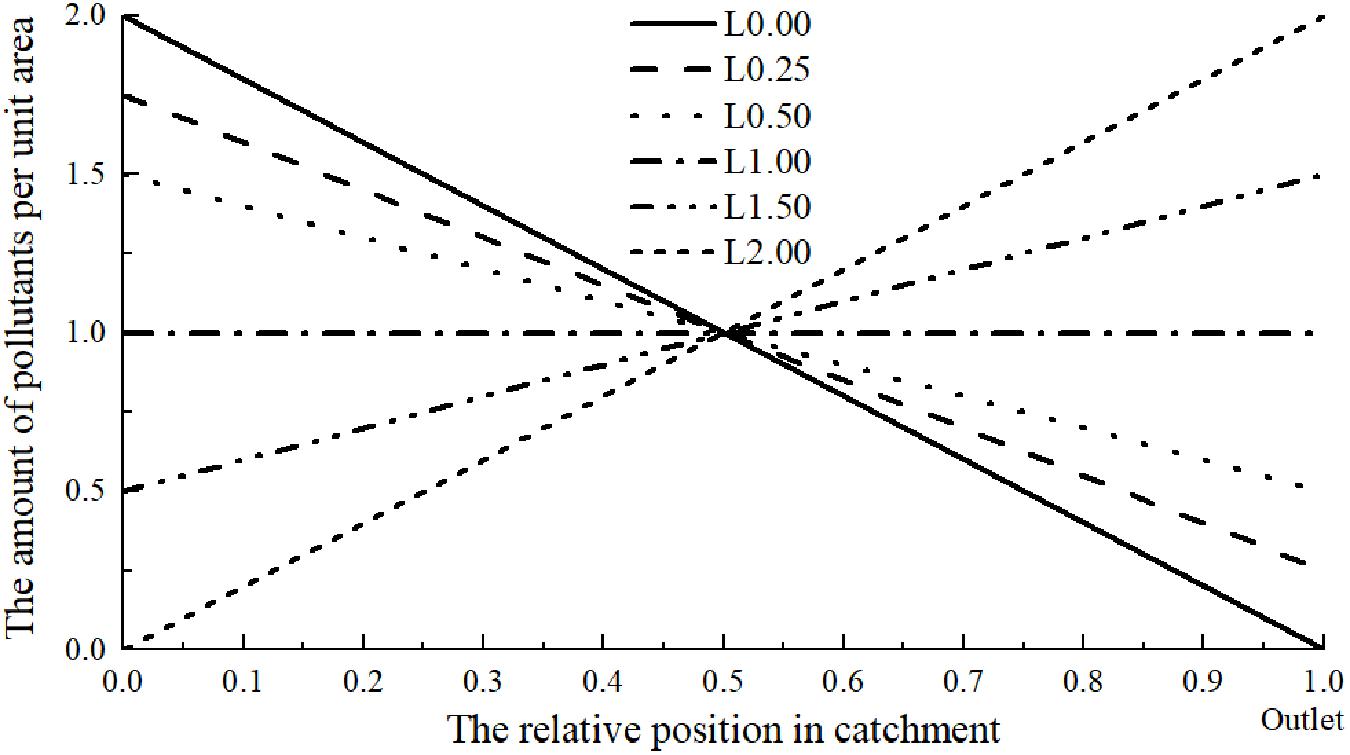
In this section, we mainly study the influence of pollutant distribution on pollutant transport process using the developed transport model. Previous researchers (Sartor et al., 1974; Kim et al., 2005; Egodawatta et al., 2007, 2009; Xiao et al., 2017; Muthusamy et al., 2018) have assumed that the pollutants were distributed uniformly over the catchment. In fact, uniform distribution is a very special case of linear distributions. Hence, we put forward some general linear distributions as sketched in Figure 7 to study their influence on pollutant transport. In each distribution, the total amount of pollutant applied is 125 g. For convenience, the average amount of pollutant per unit area over the whole catchment is assumed to be 1 (i.e., L1.00). In Figure 7, L1.50 refers to the amount of pollutant per unit area at the catchment outlet as 1.50. As the initial pollutant distribution is linear L1.50 leads to the amount of pollutant per unit area of 0.5 at the upstream end of the catchment. Similar notations apply to other cases. The rainfall intensity, slope, layout of buildings and calibration parameters remain the same for all pollutant distributions. According to the numerical model established in this study, the amount of pollutants has no impacts on the values of parameters (n and α).
Figure 8 presents the computed variations of the pollutant concentration and pollutant transport rate at outlet in different conditions. It shows that, (a) the pollutant distribution has a major impact on the variation of the pollutant concentration at the catchment outlet, especially during the initial runoff process; (b) the amount of pollutants per unit area at outlet directly influences the initial pollutant transport; (c) the pollutant concentration at outlet can increase with time under some initial pollutant distributions; (d) all these concentration variation curves approximately cross at the same point, approximately at the time of concentration. It may be because the waterdrops moves from the farthest point to the catchment outlet at the time of concentration, and thereafter the whole catchment contributes to the pollutant discharge at the outlet. Prior to this instant, the larger amount of pollutants per unit area at outlet leads to a greater concentration at the outlet. After this instant, the opposite trend is observed. As for the pollutant transport rates in different conditions, they all show similar single-peak shapes, although there are differences in the maximum transport rate and the time when it occurs. It should be noted that the maximum transport rates in different conditions are about the same. Similar to the concentration curves, all these transport rate curves cross at the same point, approximately at the time of concentration. At this instant, both the concentration and the runoff rate are the same for the same catchment, regardless of the initial pollutant distribution.
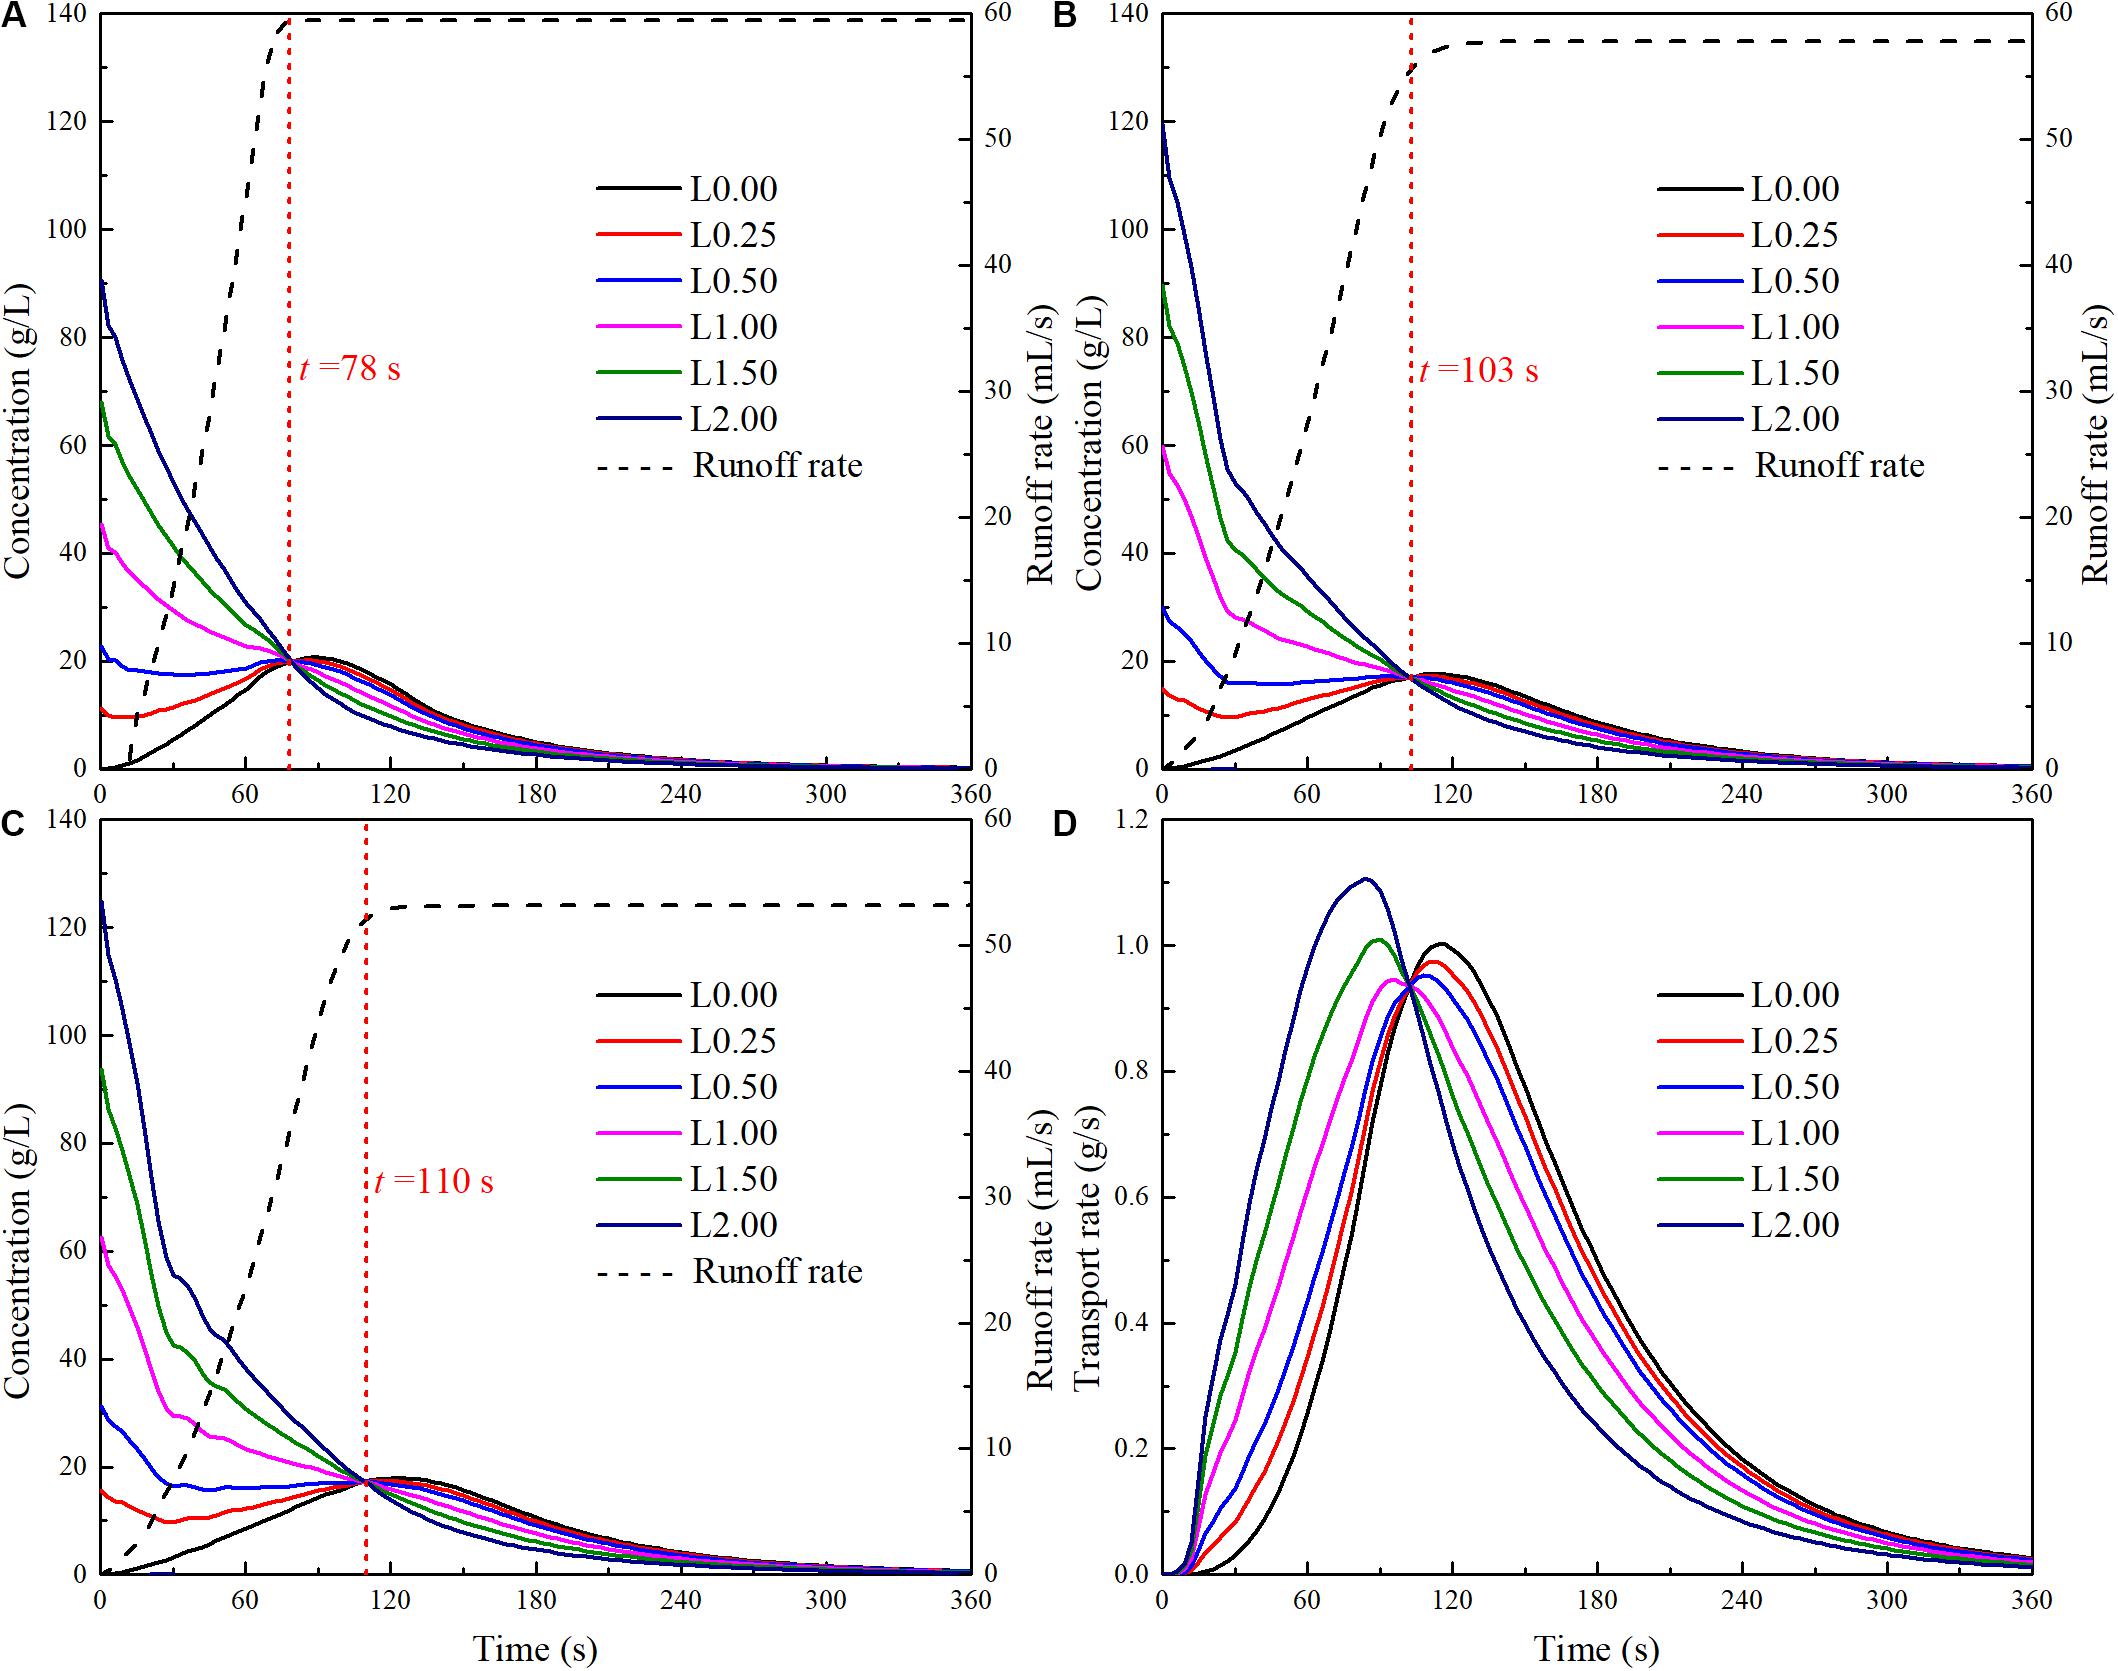
Figure 8. Pollutant concentrations and transport rates corresponding to different initial pollutant distributions. (A) Concentration in case B-48.07. (B) Concentration in case I-46.69. (C) Concentration in case S-42.94. (D) Transport rate in case I-46.69.
To provide a better understanding of the influence of the initial pollutant distribution on pollutant transport process, the evolutions of the average concentrations at different sections are presented in Figure 9. It is evident that different initial distributions give different concentration profiles. The initial concentration distribution shows resemblance to the subsequent pollutant distribution. When the amount of pollutants per unit area at outlet is lower than the catchment-averaged value (such as L0.00 and L0.50), the downstream concentration may increase at first due to the contribution of pollutant from the upstream area. Later on, the concentrations decrease with time. For other cases, the concentration over the whole catchment decreases simultaneously throughout the rainfall event. In general, as time goes on, the concentration non-uniformity over the catchment becomes smaller and smaller, and the pollutant concentration tends to linearly increase in the direction of the flow.
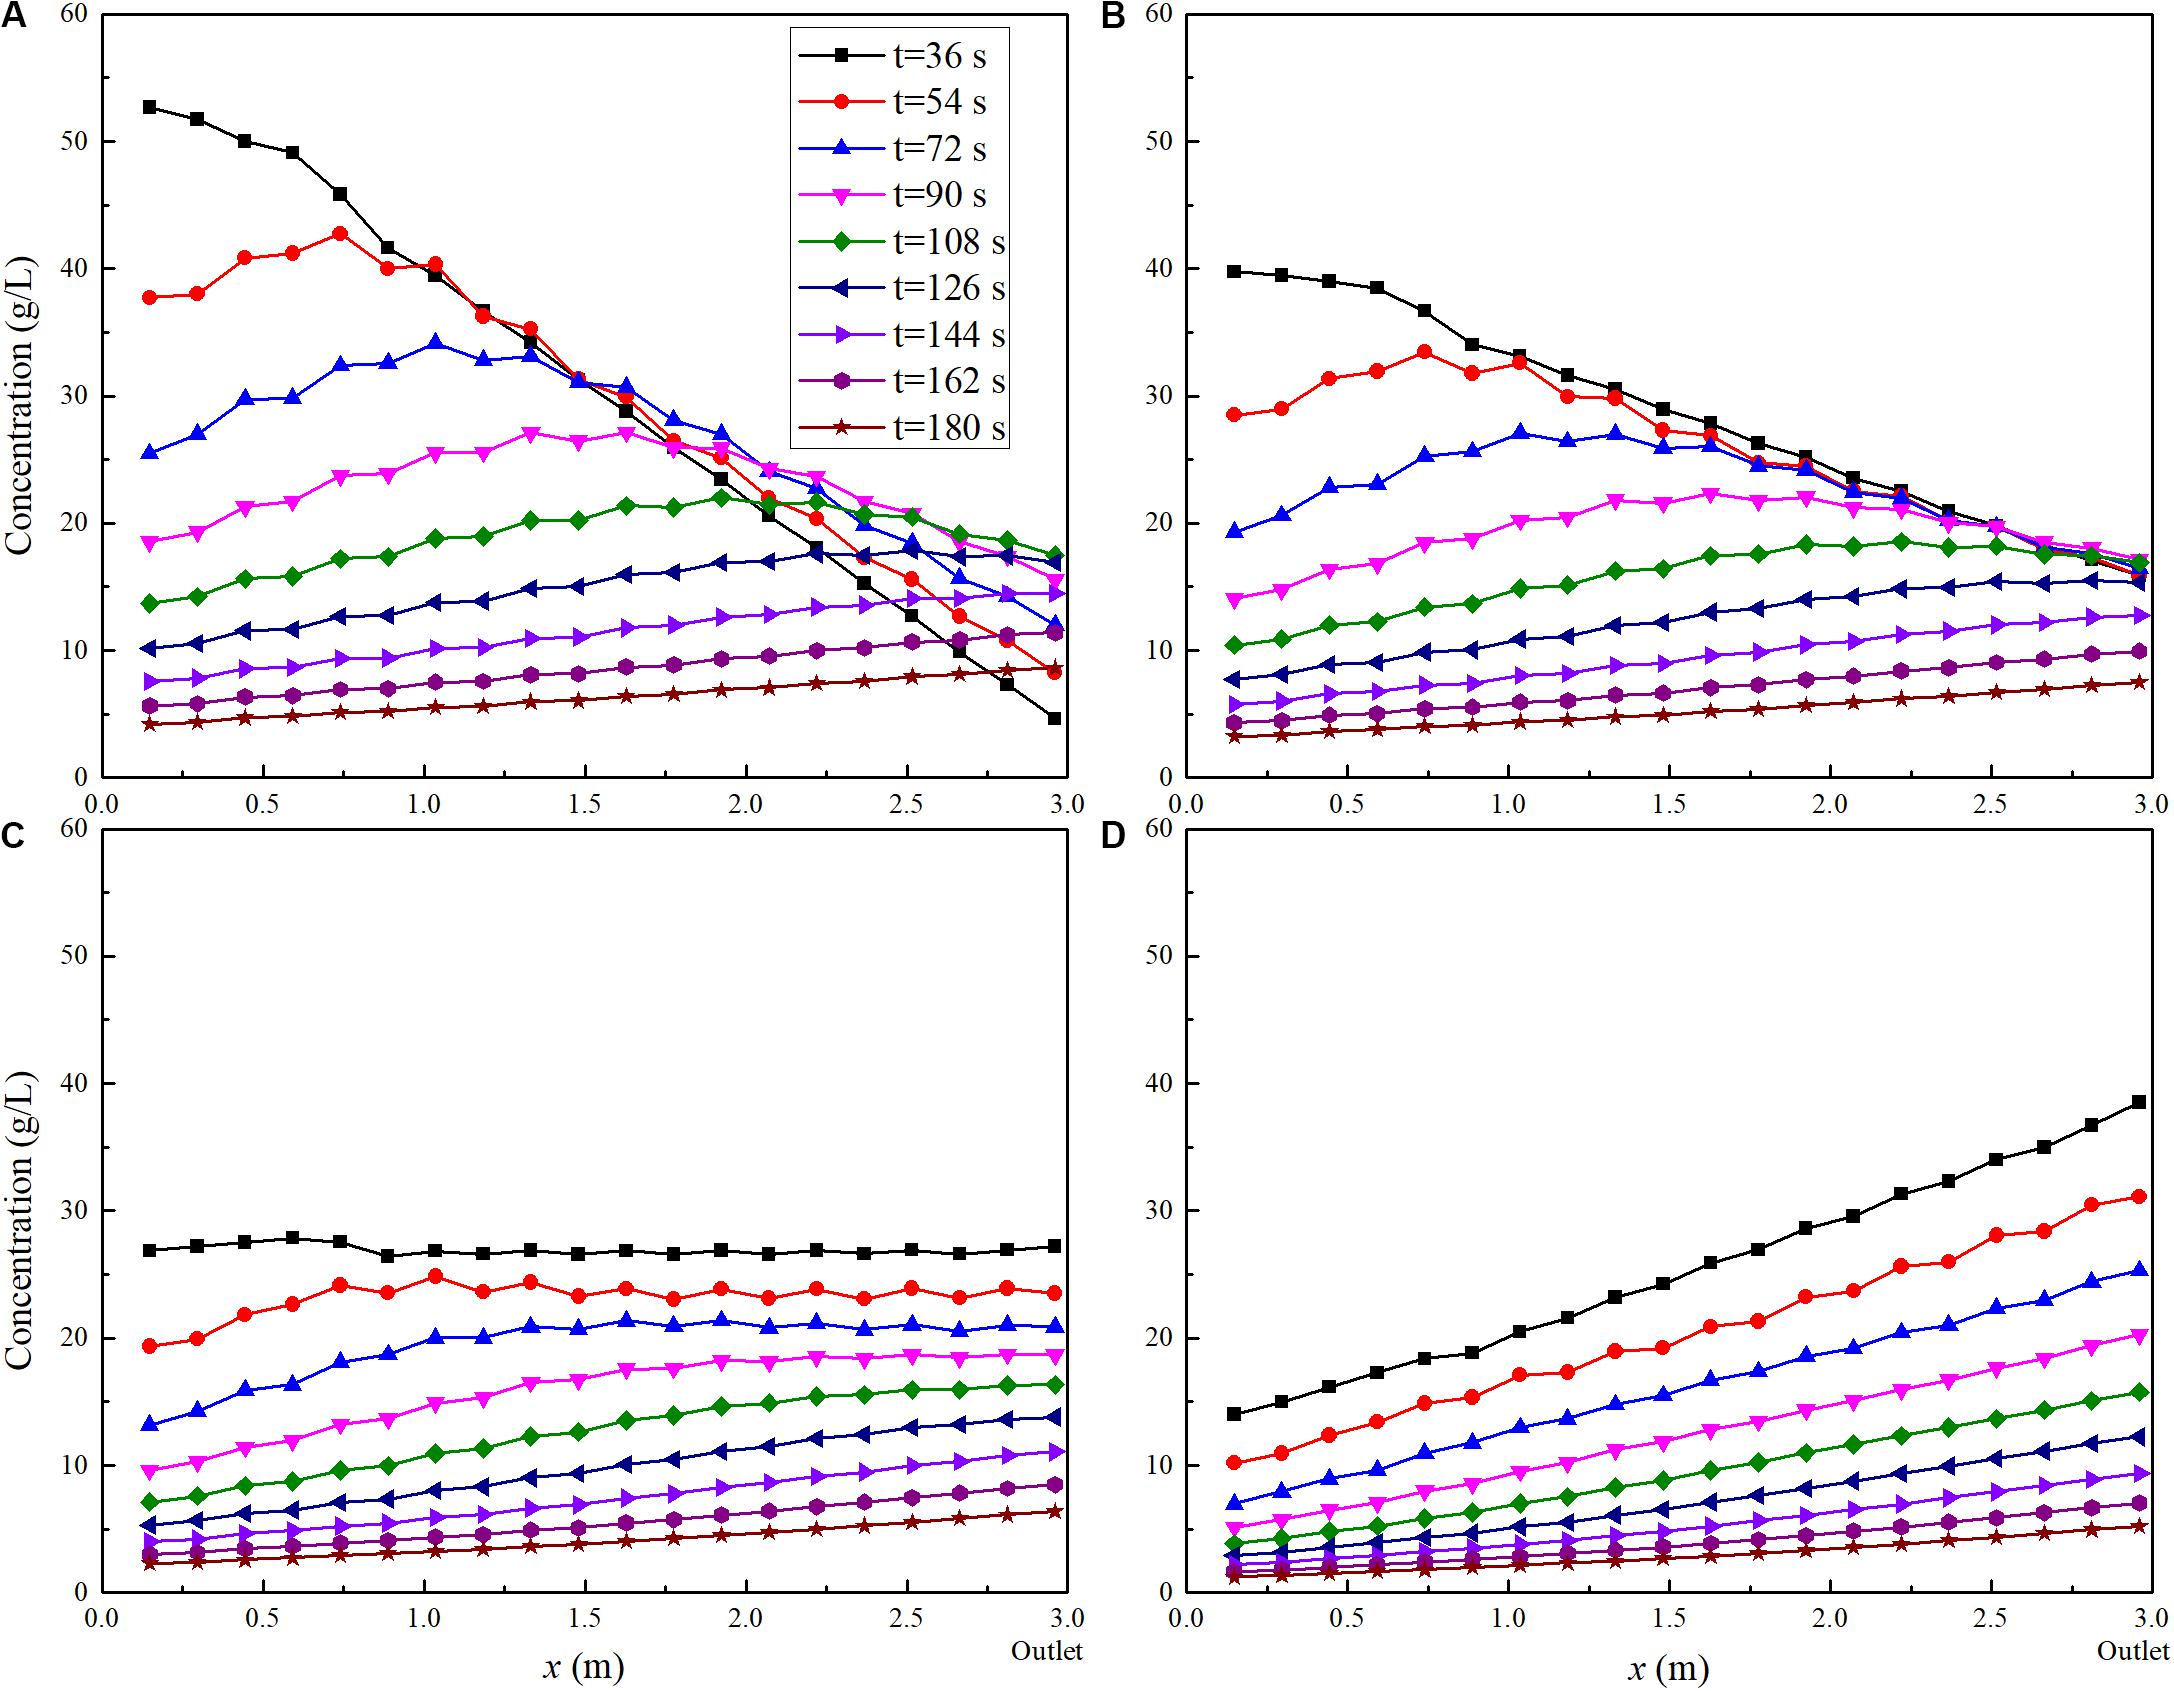
Figure 9. Computed pollutant concentration along the catchment with different initial pollutant distributions (I-46.69). (A) L0.00. (B) L0.50. (C) L1.00. (D) L1.50.
Discussion
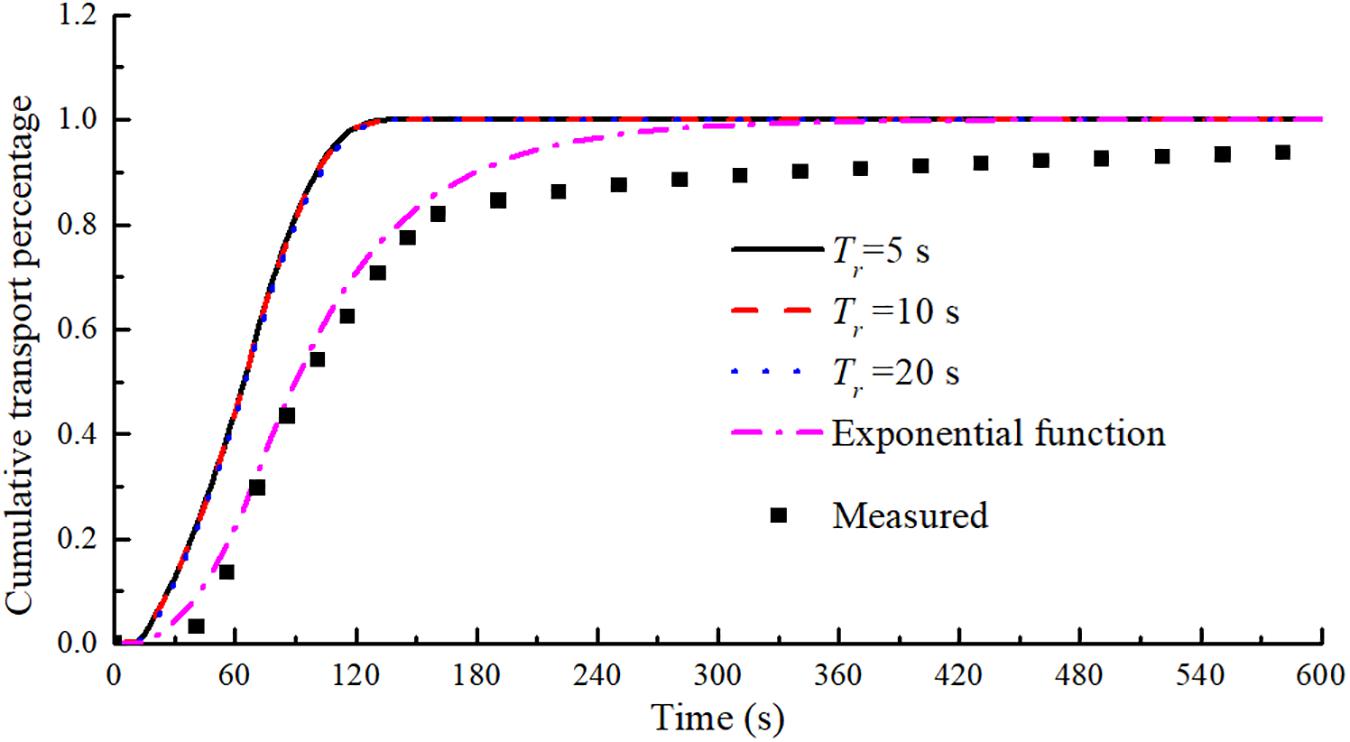
As in previous studies (Deng et al., 2005; Xiao et al., 2017; Zhang et al., 2018), sodium chloride (table salt) has been chosen as the dissolved pollutant tracer in this study. Therefore, in this study, we assume that the table salt dissolves over a short period of time Tr. Taking B-48.07 as an example, Figure 10 shows the comparisons of the computed results with different values of Tr and the resulted predicted by the present model described in section “Mathematical Model” (labeled as the exponential function in Figure 10). Figure 10 suggests that the vast majority of table salt can be transported out of the catchment very quickly if the assumption that table salt gets dissolved instantly into water is valid. However, this assumption lead to large disagreement with the experimental results. In contrast, the present model, which assumes that the dissolved pollutant releases gradually into the runoff water, obtains a satisfactory prediction of the pollutant transport process. A question arises as to what controls the dissolved pollutant release from the impervious surface into runoff water.
Deng et al. (2005) have suggested the existence of an active surface layer at the soil surface that controls the pollutant transfer from soil water to runoff water. Coincidentally, Gao et al. (2004, 2005) and Walter et al. (2007) have proposed the idea of “exchange layer” near the soil surface, assuming that chemicals in the soil slowly diffuse into the exchange layer. Similar to the previous studies (Gao et al., 2004, 2005; Deng et al., 2005; Walter et al., 2007), we adopt the concept of the “exchange layer” and assume that a thin water layer exists on the impervious surface and controls the pollutant transfer between the thin water layer immediately above the catchment surface and overland flow. The thin water layer can form before the overland flow occurs. In practice, the surface runoff will not occur as the first drop of rain falls on the catchment. The movement of the small amount of water at the beginning of the rainfall is heavily influenced by the surface tension and the vertical boundary-layer structure of the flow, which are not fully accounted for in the present depth-averaged numerical model. It can be found from the experimental results in Figure 2 that a short period of time is needed before the overland flow occurs. Even after the overland flow occurs, due to the rough bed surface and viscosity of water, a thin viscous water layer with a low velocity will be formed underneath the overland flow, as shown in Figure 11B. In studying the movement of suspended sediments in a turbulent boundary layer, Chang et al. (2015) suggested that sediment particles are released from the viscous sublayer, which is 0.00095 m thick. In the SWEs, the viscous sublayer is neglected. Only the depth-averaged velocity is used in the calculations, which corresponds to uniform transport of pollutant over the depth as shown in Figure 11A. Once the pollutant enters the runoff water, it is transported out of the catchment quickly. Hence, as shown in Figure 10, large amounts of the dissolved pollutant can be transported out of the catchment at the time of concentration. This is based on the assumption that the pollutant can be dissolved instantly into water and the rainwater falling on the most-upstream part of the catchment arrives at the catchment outlet at the time of concentration. Normally, the table salt saturation concentration is about 360 g/L at 20 degrees Celsius. The total amount of table salt used in this study for each rainfall event is 125 g. It only needs 347.2 mL of water to dissolve all these table salts. This volume of water corresponds to a water depth of 0.000079 m, assuming that water evenly spreads over the catchment. This tiny water depth is generally smaller than the thickness of viscous sublayer. Therefore, the amount of rainwater in the thin viscous sublayer is sufficient to dissolve all the pollutants in the catchment. In the viscous sublayer, the flow is much slower than that in the upper runoff flow. Therefore, more time will be needed to transport the dissolved pollutant contained restricted in the viscous sublayer out of the catchment, as shown in Figure 11B. In other words, there is a thin water layer with lower velocities, underlying the runoff flow, that control the dissolved pollutant transfer between catchment ground and upper runoff flow. The concept of the “exchange layer” is our assumption for the convenience of modeling the complicated dissolution process and the three-dimensional turbulent mixing phenomenon by a simplified and efficient method. However, our study shows that such simplified approaches are able to obtain a general agreement between modeling and measurements. Hence, we claim that our approaches are satisfactory, at least in the context of engineering applications.
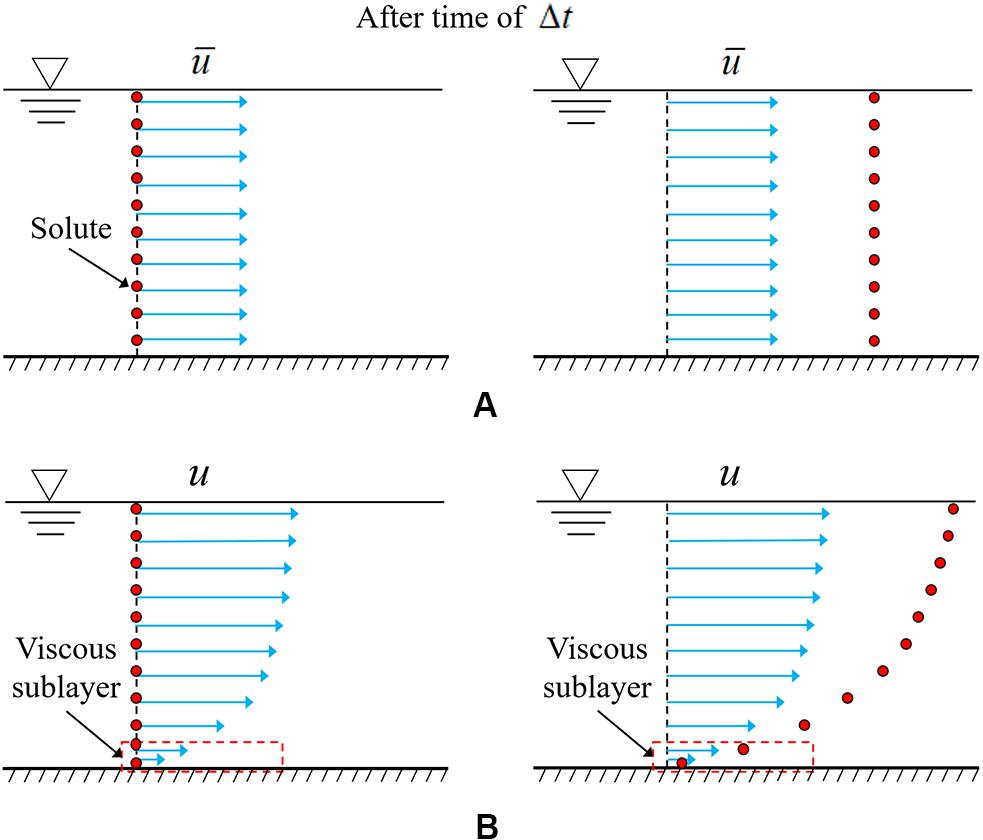
Figure 11. Schematic diagram showing dissolved pollutant transport. (A) Ignoring velocity non-uniformity over depth. (B) With actual velocity distribution.
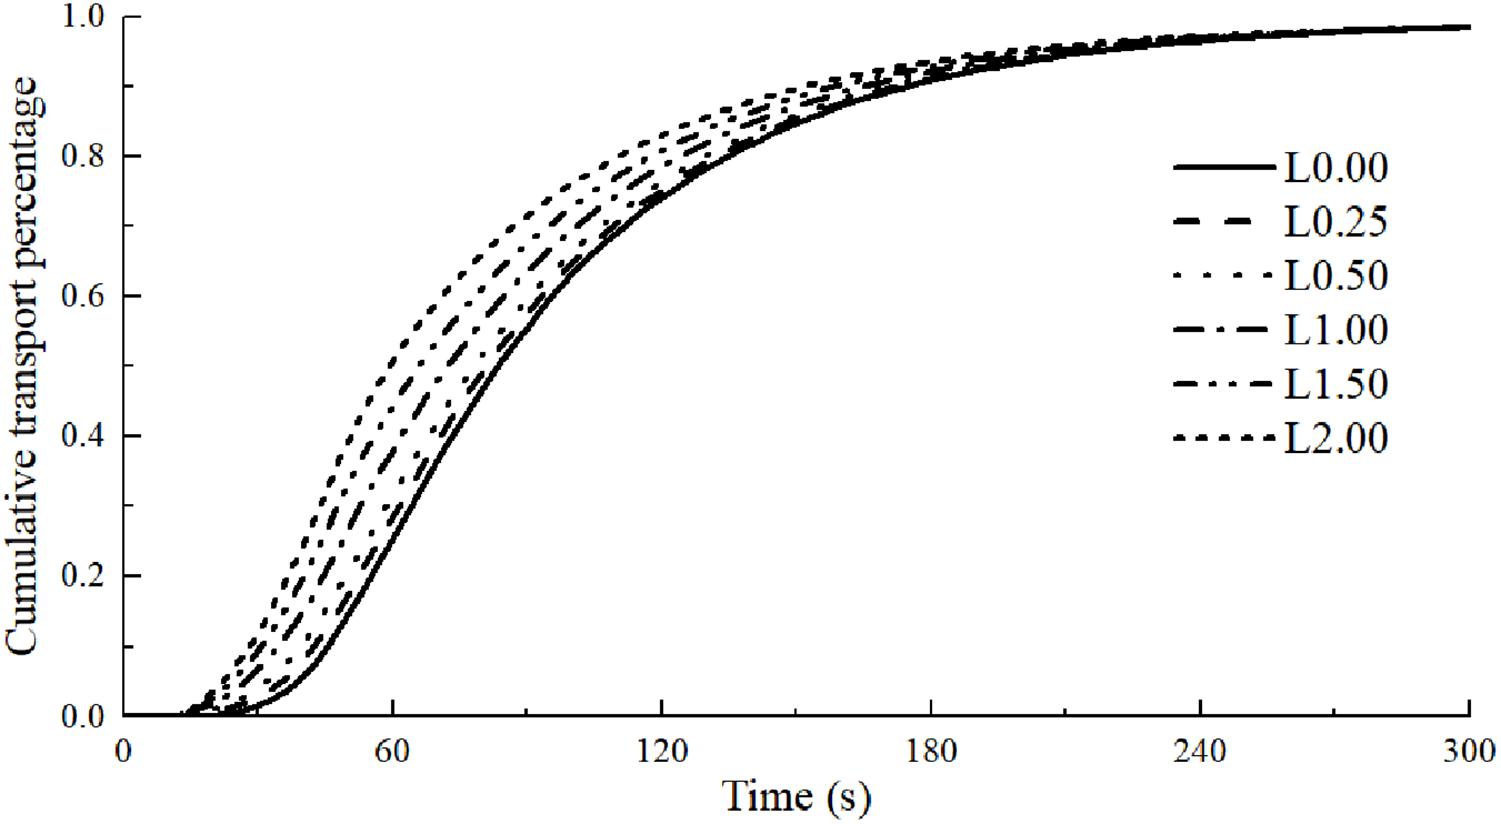
As mentioned before, the pollutant distribution has a significantly impact on the pollutant discharge at the outlet, especially at the initial runoff stage. Xiao et al. (2017) noted that the initial transport process is crucial for dissolved pollutants as a significant proportion of them are transported during the initial stage. The initial part of the runoff water is associated with the first flush, which involves disproportionately high concentration of pollutants during the initial runoff hydrograph and can causes rapid degradation of water quality. Therefore, many efficient stormwater treatment measures mainly target the initial runoff water. Zhang et al. (2010) suggested that the initial rooftop runoff and the initial road runoff should be collected and treated separately before being discharged to the environment or being utilized. Figure 12 illustrates the cumulative pollutant transported over a blank board corresponding to different initial pollutant distributions. It shows that the initial pollutant distribution can significantly influence the cumulative pollutant transport process. For instance, around 50.90% of the total pollutants is transported out of the catchment within 60 s with the pollutant distribution of L2.00. However, only half of that is transported with the pollutant distribution of L0.00. Therefore, pollutant distribution should be considered when designing stormwater pollution mitigation strategies.
In this study, sodium chloride (table salt) is chosen as a dissolved pollutant tracer, which is an easily soluble material. In practice, different chemicals may have different physical and chemical properties. Some chemicals may not dissolve quickly in water and thus the dissolved and particulate forms will coexist. This phenomenon has not been considered in this study, but a fraction coefficient may be introduced, according to which the dissolved and particulate materials can be studied separately. In practical applications, catchments involve complex terrains, infiltration and non-uniform rainfalls. To accurately reproduce the behavior of real catchments, distributed hydrological and environmental models should be established, which divide the whole catchments into small areas of uniform properties. Our findings in this paper are based on experiments and analyses with regard to simple idealized urban catchments. However, our results can be used to refine the fundamental assumptions concerning the hydrological and environmental response of each small area. Future research needs to be carried out to take into account the stormwater networks, the distribution of surface imperviousness and rainfall uncertainty. Continued research in this area can help improve the design of urban stormwater management and pollution mitigation strategies.
Conclusion
In this study, the dissolved pollutant transport process over idealized urban catchments has been investigated. A two-dimensional transport model has been developed based on the shallow water equations and the depth-averaged advection-diffusion equation, with an assumption of “exchange layer” that controls the pollutant release from the ground surface to runoff water. A series of laboratory experiments have been conducted to validate the presented model, which includes two building layouts. The effects of buildings and initial pollutant distribution are particularly investigated. The following can be concluded:
(1) The existence of buildings slows down the pollutant transport process, especially when the buildings are staggered. Such an effect is consistent with the findings related to the overflow processes.
(2) Overall, the water and dissolved pollutant runoff phenomena can be correctly predicted by the numerical model proposed in this study.
(3) The initial pollutant distribution has a significant influence on the concentration and the pollutant transport rate, especially at the initial runoff stage. The pollutant concentration at the outlet can either increase or decrease with time, depending on the initial distribution.
(4) For a constant rainfall event over the same catchment, the pollutant concentration and transport rate at the time of concentration appear to be insensitive to the initial pollutant distribution.
A real urban area is more complicated, with sewage networks, spatially and temporally varying ground features and rainfall intensity. We will carry out further experiments and computations with variable rainfall intensities.
Data Availability Statement
All datasets generated for this study are included in the article/supplementary material.
Author Contributions
TZ, YX, DL, and HT contributed to the conception and design of the study. TZ wrote the first draft of the manuscript and led the data analysis and interpreted the results with YX and SY. TZ and BL designed and conducted the experiments. All authors contributed to manuscript revision, read and approved it for publication.
Funding
This work was financially supported by the National Key Research and Development Program of China (Grant No. 2016YFC0402605), the Fundamental Research Funds for the Central Universities (Grant No. 2018B42714), the 111 Project (Grant No. B17015) and the Royal Academy of Engineering UK-China Urban Flooding Research Impact Program (Grant No. UUFRIP\ 100051).
Conflict of Interest
The authors declare that the research was conducted in the absence of any commercial or financial relationships that could be construed as a potential conflict of interest.
Acknowledgments
We wish to thank the Prof. Bidya Sagar Pani (Indian Institute of Technology) for providing valuable suggestions and language help.
References
Ahuja, L. R., and Lehman, O. R. (1983). The extent and nature of rainfall-soil interaction in the release of soluble chemicals to runoff. J. Environ. Qual. 12, 34–40. doi: 10.2134/jeq1983.00472425001200010005x
Ahuja, L. R., Sharpley, A. N., Yamamoto, M., and Menzel, R. G. (1981). The depth of rainfall-runoff-soil interaction as determined by 32P. Water Re. Res. 17, 969–974. doi: 10.1029/WR017i004p00969
Bonhomme, C., and Petrucci, G. (2017). Should we trust build-up/wash-off water quality models at the scale of urban catchments? Water Res. 108, 422–431. doi: 10.1016/j.watres.2016.11.027
Brett, D., and Gavin, B. (2010). Comparison of heavy metal loads in stormwater runoff from major and minor urban roads using pollutant yield rating curves. Environ. Pollut. 158, 2541–2545. doi: 10.1016/j.envpol.2010.05.021
Brezonik, P. L., and Stadelmann, T. H. (2002). Analysis and predictive models of stormwater runoff volumes, loads, and pollutant concentrations from watersheds in the Twin Cities metropolitan area. Minnesota, USA. Water Res. 36, 1743–1757. doi: 10.1016/s0043-1354(01)00375-x
Cea, L., Garrido, M., and Puertas, J. (2010). Experimental validation of two-dimensional depth-averaged models for forecasting rainfall–runoff from precipitation data in urban areas. J. Hydrol. 382, 88–102. doi: 10.1016/j.jhydrol.2009.12.020
Chang, Y. S., Hwang, J. H., and Park, Y. G. (2015). Numerical simulation of sediment particles released at the edge of the viscous sublayer in steady and oscillating turbulent boundary layers. J. Hydro Environ. Res. 9, 36–48. doi: 10.1016/j.jher.2013.07.002
Deng, Z., de Lima, J. L. M. P., and Singh, V. P. (2005). Transport rate-based model for overland flow and solute transport: parameter estimation and process simulation. J. Hydrol. 315, 220–235. doi: 10.1016/j.jhydrol.2005.03.042
Egodawatta, P., Thomas, E., and Goonetilleke, A. (2007). Mathematical interpretation of pollutant wash-off from urban road surfaces using simulated rainfall. Water Res. 41, 3025–3031. doi: 10.1016/j.watres.2007.03.037
Egodawatta, P., Thomas, E., and Goonetilleke, A. (2009). Understanding the physical processes of pollutant build-up and wash-off on roof surfaces. Sci. Total Environ. 407, 1834–1841. doi: 10.1016/j.scitotenv.2008.12.027
Gao, B., Walter, M. T., Steenhuis, T. S., Hogarth, W. L., and Parlange, J. Y. (2004). Rainfall induced chemical transport from soil to runoff: theory and experiments. J. Hydrol. 295, 291–304. doi: 10.1016/j.jhydrol.2004.03.026
Gao, B., Walter, M. T., Steenhuis, T. S., Parlangea, J. Y., Richardsa, B. K., Hogarthb, W. L., et al. (2005). Investigating raindrop effects on transport of sediment and non-sorbed chemicals from soil to surface runoff. J. Hydrol. 308, 313–320. doi: 10.1016/j.jhydrol.2004.11.007
Goonetilleke, A., Thomas, E., Ginn, S., and Gilbert, D. (2005). Understanding the role of land use in urban stormwater quality management. J. Environ. Manag. 74, 31–42. doi: 10.1016/j.jenvman.2004.08.006
Herngren, L., Goonetilleke, A., and Ayoko, G. A. (2005). Understanding heavy metal and suspended solids relationships in urban stormwater using simulated rainfall. J. Environ. Manag. 76, 149–158. doi: 10.1016/j.jenvman.2005.01.013
Hong, N., Zhu, P., and Liu, A. (2017). Modelling heavy metals build-up on urban road surfaces for effective stormwater reuse strategy implementation. Environ. Pollut. 231, 821–828. doi: 10.1016/j.envpol.2017.08.056
Hong, Y., Bonhomme, C., Van den Bout, B., Jetten, V., and Chebbo, G. (2017). Integrating atmospheric deposition, soil erosion and sewer transport models to assess the transfer of traffic-related pollutants in urban areas. Environ. Model. Softw. 96, 158–171. doi: 10.1016/j.envsoft.2017.06.047
Hong, Y., Bonhomme, C., Le, M. H., and Chebbo, G. (2016). A new approach of monitoring and physically-based modelling to investigate urban wash-off process on a road catchment near Paris. Water Res. 102, 96–108. doi: 10.1016/j.watres.2016.06.027
Kim, L.-H., Kayhanian, M., Zoh, K.-D., and Stenstrom, M. K. (2005). Modeling of highway stormwater runoff. Sci. Total Environ. 348, 1–18. doi: 10.1016/j.scitotenv.2004.12.063
Liang, D., Falconer, R. A., and Lin, B. (2006). Comparison between TVD-MacCormack and ADI-type solvers of the shallow water equations. Adva. Water Resour. 29, 1833–1845. doi: 10.1016/j.advwatres.2006.01.005
Liang, D., Falconer, R. A., and Lin, B. (2007a). Coupling surface and subsurface flows in a depth averaged flood wave model. J. Hydrol. 337, 147–158. doi: 10.1016/j.jhydrol.2007.01.045
Liang, D., Lin, B., and Falconer, R. A. (2007b). Simulation of rapidly varying flow using an efficient TVD–MacCormack scheme. Int. J. Numer. Methods Fluids 53, 811–826. doi: 10.1002/fld.1305
Liang, D., Özgen, I., Hinkelmann, R., Xiao, Y., and Chen, J. M. (2015). Shallow water simulation of overland flows in idealised catchments. Environ. Earth Sci. 74, 7307–7318. doi: 10.1007/s12665-015-4744-5
Liang, D., Wang, X., Falconer, R. A., and Bockelmann-Evans, B. N. (2010). Solving the depth-integrated solute transport equation with a TVD-MacCormack scheme. Environ. Model. Softw. 25, 1619–1629. doi: 10.1016/j.envsoft.2010.06.008
Liu, A., Egodawatta, P., Gua, Y., and Goonetilleke, A. (2013). Influence of rainfall and catchment characteristics on urban stormwater quality. Sci. Total Environ. 444, 255–262. doi: 10.1016/j.scitotenv.2012.11.053
Massoudieh, A., Abrishamchi, A., and Kayhanian, M. (2008). Mathematical modeling of first flush in highway storm runoff using genetic algorithm. Sci. Total Environ. 398, 107–121. doi: 10.1016/j.scitotenv.2008.02.050
Metcalf and Eddy Inc (1971). Storm Water Management Model, Final Report, Vol. 1. Washington, D.C: Environmental Protection Agency.
Miguntanna, N. P., Liu, A., Egodawatta, P., and Goonetilleke, A. (2013). Characterising nutrients wash-off for effective urban stormwater treatment design. J. Environ. Manag. 120, 61–67. doi: 10.1016/j.jenvman.2013.02.027
Muthusamy, M., Tait, S., Schellart, A., Beg, M. N. A., Carvalho, R. F., and de Lima, J. L. M. P. (2018). Improving understanding of the underlying physical process of sediment wash-off from urban road surfaces. J. Hydrol. 557, 426–433. doi: 10.1016/j.jhydrol.2017.11.047
Nash, J. E., and Sutcliffe, J. V. (1970). River flow forecasting through conceptual models part I — A discussion of principles. J. Hydrol. 10, 282–290. doi: 10.1016/0022-1694(70)90255-6
Naves, J., Jikia, Z., Anta, J., Puertas, J., Suárez, J., and Regueiro-Picallo, M. (2017). Experimental study of pollutant washoff on a full-scale street section physical model. Water Sci. Technol. 45, 2821–2829. doi: 10.2166/wst.2017.345
Pan, H., Lu, X., and Lei, K. (2017). A comprehensive analysis of heavy metals in urban road dust of Xi’an, China: contamination, source apportionment and spatial distribution. Sci. Total Environ. 609, 1361–1369. doi: 10.1016/j.scitotenv.2017.08.004
Revitt, D. M., Lian, L., Coulon, F., and Fairley, M. (2014). The sources, impact and management of car park runoff pollution: a review. J. Environ. Manag. 146, 552–567. doi: 10.1016/j.jenvman.2014.05.041
Sartor, J. D., Boyd, G. B., and Agardy, F. J. (1974). Water pollution aspects of street surface contaminants. J Water Pollut. Control Federat. 46, 458–467. doi: 10.1002/etc.3089
Schubert, J. E., and Sanders, B. F. (2012). Building treatments for urban flood inundation models and implications for predictive skill and modeling efficiency. Adv. Water Resour. 41, 49–64. doi: 10.1016/j.advwatres.2012.02.012
Shaw, S. B., Walter, M. T., and Steenhuis, T. S. (2006). A physical model of particulate wash-off from rough impervious surfaces. J. Hydrol. 327, 618–626. doi: 10.1016/j.jhydrol.2006.01.024
Sheng, Y., Ying, G., and Sansalone, J. (2008). Differentiation of transport for particulate and dissolved water chemistry load indices in rainfall–runoff from urban source area watersheds. J. Hydrol. 361, 144–158. doi: 10.1016/j.jhydrol.2008.07.039
Walter, M. T., Gao, B., and Parlange, J. Y. (2007). Modeling soil solute release into runoff with infiltration. J. Hydrol. 347, 430–437. doi: 10.1016/j.jhydrol.2007.09.033
Wang, S. M., He, Q., Ai, H. N., Wang, Z. T., and Zhang, Q. Q. (2013). Pollutant concentrations and pollution loads in stormwater runoff from different land uses in Chongqing. J. Environ. Sci. 25, 502–510. doi: 10.1016/S1001-0742(11)61032-2
Xiao, Y., Zhang, T., Liang, D., and Chen, J. M. (2016). Experimental study of water and dissolved pollutant runoffs on impervious surfaces. J. Hydrodyn. 28, 162–165. doi: 10.1016/S1001-6058(16)60617-0
Xiao, Y., Zhang, T., Wang, L., Liang, D., and Xu, X. (2017). Analytical and experimental study on dissolved pollutant wash-off over impervious surfaces. Hydrol. Process. 31, 4520–4529. doi: 10.1002/hyp.11372
Yang, T., Wang, Q., Wu, L., Zhang, P., Zhao, G., and Liu, Y. (2016). A mathematical model for the transfer of soil solutes to runoff under water scouring. Sci. Total Environ. 56, 332–341. doi: 10.1016/j.scitotenv.2016.06.094
Zhang, M., Chen, H., Wang, J., and Pan, G. (2010). Rainwater utilization and storm pollution control based on urban runoff characterization. J. Environ. Sci. 22, 40–46. doi: 10.1016/S1001-0742(09)60072-3
Keywords: dissolved pollutant, stormwater, rainfall-runoff, pollutant transport, diffused pollution, urban
Citation: Zhang T, Xiao Y, Liang D, Tang H, Yuan S and Luan B (2020) Rainfall Runoff and Dissolved Pollutant Transport Processes Over Idealized Urban Catchments. Front. Earth Sci. 8:305. doi: 10.3389/feart.2020.00305
Received: 19 September 2019; Accepted: 29 June 2020;
Published: 16 July 2020.
Edited by:
Jingming Hou, Xi’an University of Technology, ChinaReviewed by:
Juan Pablo Rodríguez Sánchez, University of Los Andes, ColombiaNeil McIntyre, The University of Queensland, Australia
Copyright © 2020 Zhang, Xiao, Liang, Tang, Yuan and Luan. This is an open-access article distributed under the terms of the Creative Commons Attribution License (CC BY). The use, distribution or reproduction in other forums is permitted, provided the original author(s) and the copyright owner(s) are credited and that the original publication in this journal is cited, in accordance with accepted academic practice. No use, distribution or reproduction is permitted which does not comply with these terms.
*Correspondence: Yang Xiao, c2VkaW1lbnRfbGFiQGhodS5lZHUuY24=
 Taotao Zhang
 Yang Xiao1,2*
 Dongfang Liang