 Xueyuan Tang1*
 Jingxue Guo1Yinke Dou2Yuzhong Zhang1,2Siyuan Cheng1,3
 Kun Luo1,3Lejiang Yu1
 Xiangbin Cui1Lin Li1Shengkai Zhang4
 Bo Sun1
- 1Polar Research Institute of China, Shanghai, China
- 2College of Electrical and Power Engineering, Taiyuan University of Technology, Taiyuan, China
- 3College of Geo-Exploration Science and Technology, Jilin University, Changchun, China
- 4Chinese Antarctic Center of Surveying and Mapping, School of Geodesy and Geomatics, Wuhan University, Wuhan, China
The glacio-meteorological characteristics of Princess Elizabeth Land in East Antarctica are poorly known due to a lack of measurement. This is problematic given the importance of this area for understanding ice sheet dynamics and climate change. We present a comprehensive approach (including field surveys, reanalysis data, remote sensing, and ice flow models) to investigate the glaciological and meteorological conditions in the vicinity of the new Chinese Taishan Station (73.864°S, 76.974°E) in Princess Elizabeth Land. We collected the datasets of satellite-derived ice surface velocities, surface mass balance, and wind field; mapped the ice thickness and internal layers around the Taishan Station site; and constructed profiles of the surface snow temperature and snow density. Also, we used a transient 1-D thermodynamical model to simulate the age of ice and the basal temperature with surface meteorological data and subglacial topography as boundary conditions. These investigations showed that Taishan Station is subject to a relatively high wind velocity, low temperatures (about −36°C), and simple ice flow. The well-behaved internal layer stratigraphy implies that the ice flow of Taishan Station has been relatively stable, possibly for a long time. The fact that the internal layers are conformal with bed topography—there is a relatively old basal age from ice modeling—and that the site lies over a bed depression filled with ice 1,900 m thick, suggests that Taishan Station may be a good location for obtaining undisturbed old ice at depth. The combination of glacio-meteorological parameters suggests that Taishan Station is a potential drill site for the Chinese Antarctic Research Expedition and an ideal logistical support location for proposed scientific field activities in the East Antarctic ice sheet (e.g., Dome A, Grove Mountains, and Princess Elizabeth Land).
Introduction
The Antarctic ice sheet has been losing ice mass to glacier dynamic thinning in recent decades, and the mass losses in 2012–2016 were likely greater than those from 2002 to 2011 (Meredith et al., 2019). Surface and subglacial processes transport mass and energy underneath continental ice sheets and influence ice sheet structure. Changes in surface and basal conditions are responsible for a wide range of dynamic ice sheet behaviors (Cuffey and Paterson, 2010). However, the extent to which the mass loses is affected by the dynamic processes on the surface and under the ice sheet remains uncertain.
Princess Elizabeth Land (64.93°–90°S, 73.58°–87.72°E) is located in East Antarctica with an area of about 4.37 km × 105 km and an overall fan shape extending outwards from the South Pole. It is bounded in the west by the Amery ice shelf, in the southwest by the Lambert glacier, in the east by Wilhelm II Land, and in the south by Dome A. The Lambert basin-Amery ice shelf is one of the largest glacial drainage systems in Antarctica (Figure 1), and the impact of Princess Elizabeth Land in this system is clearly significant. However, at present, little is known about the local and large-scale surface glaciological conditions and meteorological parameters (Li et al., 2009), especially subglacial topography and dynamics in this region (Fretwell et al., 2013; Tang et al., 2016).
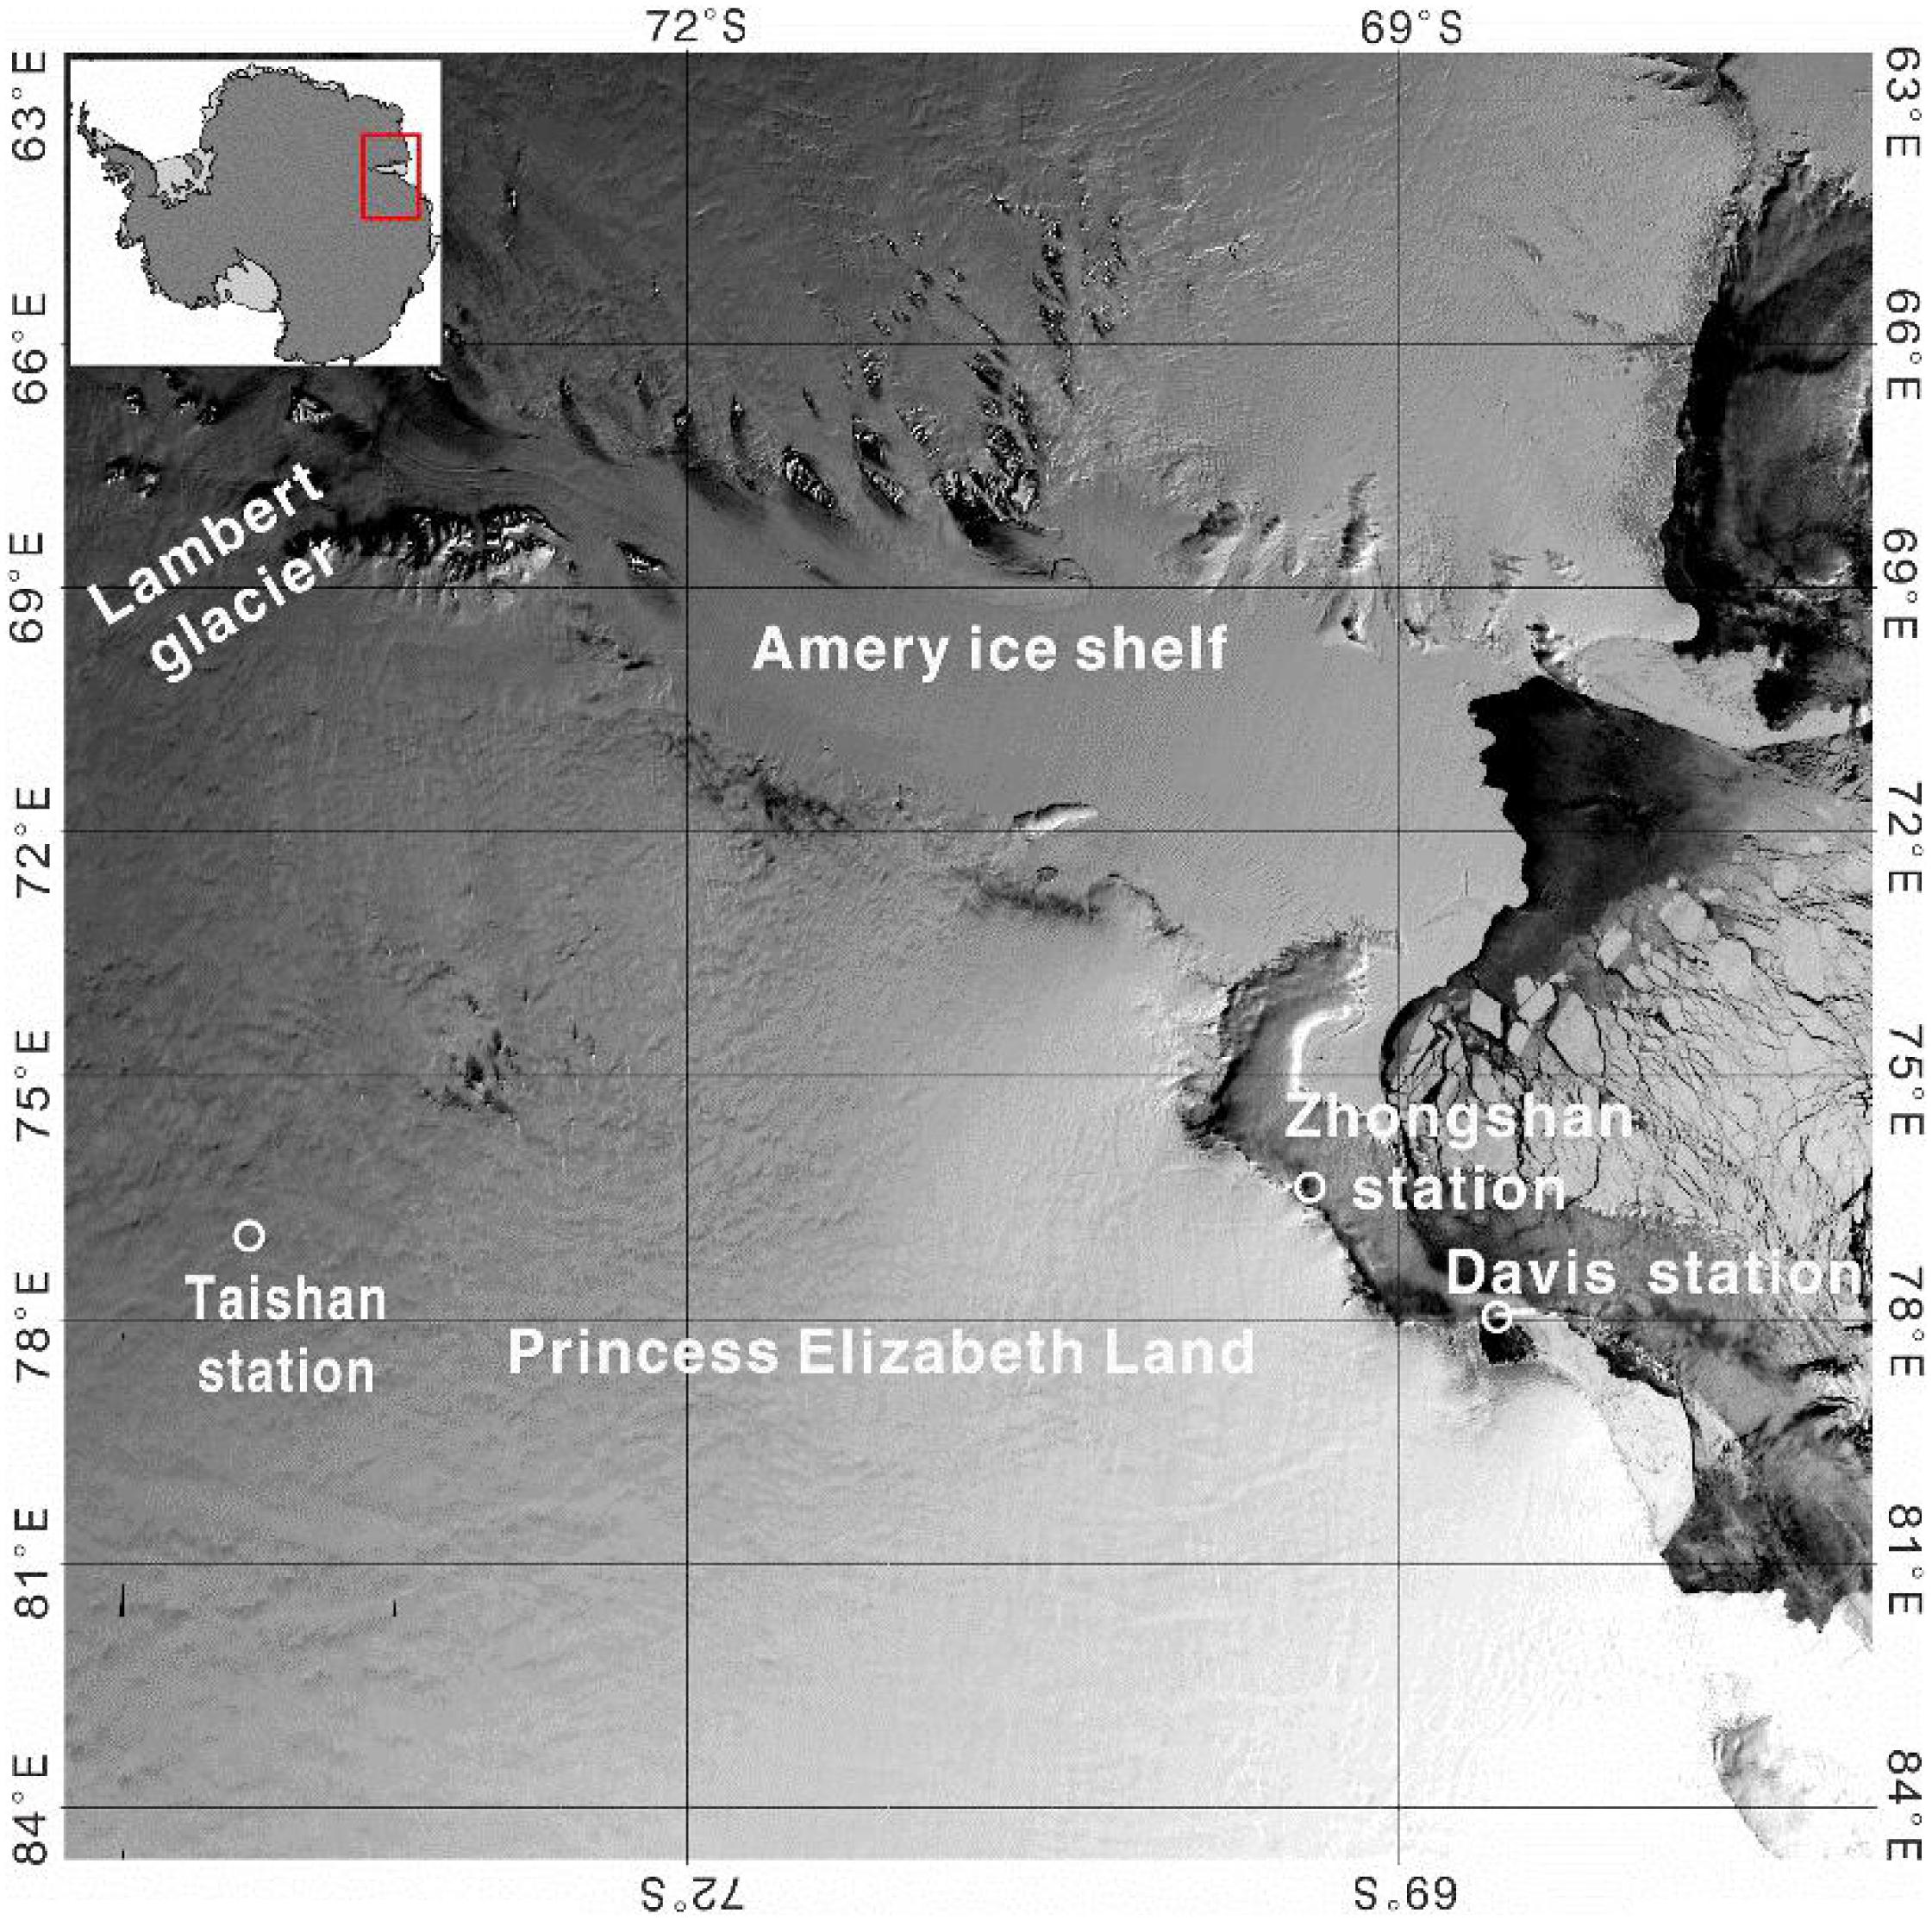
Figure 1. The Moderate Resolution Imaging Spectroradiometer (MODIS) image of the new Chinese Taishan Station (73°51′50″S, 76°58′28″E), including the drainage system of the Lambert glacier–Amery ice shelf, Princess Elizabeth Land, the Chinese Zhongshan Station, and the Australian Davis Station.
The Chinese Taishan Station (Figures 1, 2) was established during the 30th Chinese Antarctic Research Expedition (CHINARE 30) in the middle of Princess Elizabeth Land in East Antarctica in 2013/2014. The station is about 522 km from Zhongshan Station and 715 km from Kunlun Station at Dome A (Tang et al., 2016). As the Chinese component of the ITASE (International Trans-Antarctic Scientific Expedition), Princess Elizabeth Land was first investigated by the CHINARE in the 1996/1997 austral summer (Qin et al., 2000). The CHINARE transect goes from Zhongshan Station to Kunlun Station at Dome A, the summit of the East Antarctic ice sheet, with a distance of ∼1,250 km (Figure 3). Taishan Station is located at the transect. Along the transect, some glaciological and meteorological parameters have been collected, e.g., shallow snow stratigraphy, snow accumulation rate (Ren et al., 2001), ice velocity (Zhang et al., 2008), surface mass balance (Ding et al., 2015), shallow ice cores (Li et al., 2013; Ding et al., 2015), chemical elements, and particles (Li et al., 2009, 2014). By summarizing these published data, we can obtain a better understanding of the basic characteristics of environmental information. Zhang et al. (2008) showed that the ice of Taishan Station flows downward into the Amery ice shelf along the altitude gradient with a surface speed of ∼20 m year–1. Ding et al. (2011) measured the surface snow temperature at Taishan Station. Ma et al. (2010) measured the annual average wind speed (∼8 m s–1) near the station site. Tang et al. (2016) mapped a radar profile of the internal layer, and suggested that the ice sheet under Taishan Station may have undergone a complex deposition process. Wu et al. (2017) found that the intensity of optical turbulence in the near-surface atmosphere of Taishan Station has obvious diurnal variation characteristics, which are stronger at night than during the day, and the minimum values appear around sunrise and sunset. However, in addition to the few parameters mentioned above, due to the lack of systematic research around the site, we have little knowledge of the glaciological and meteorological characteristics in the area of Taishan Station.
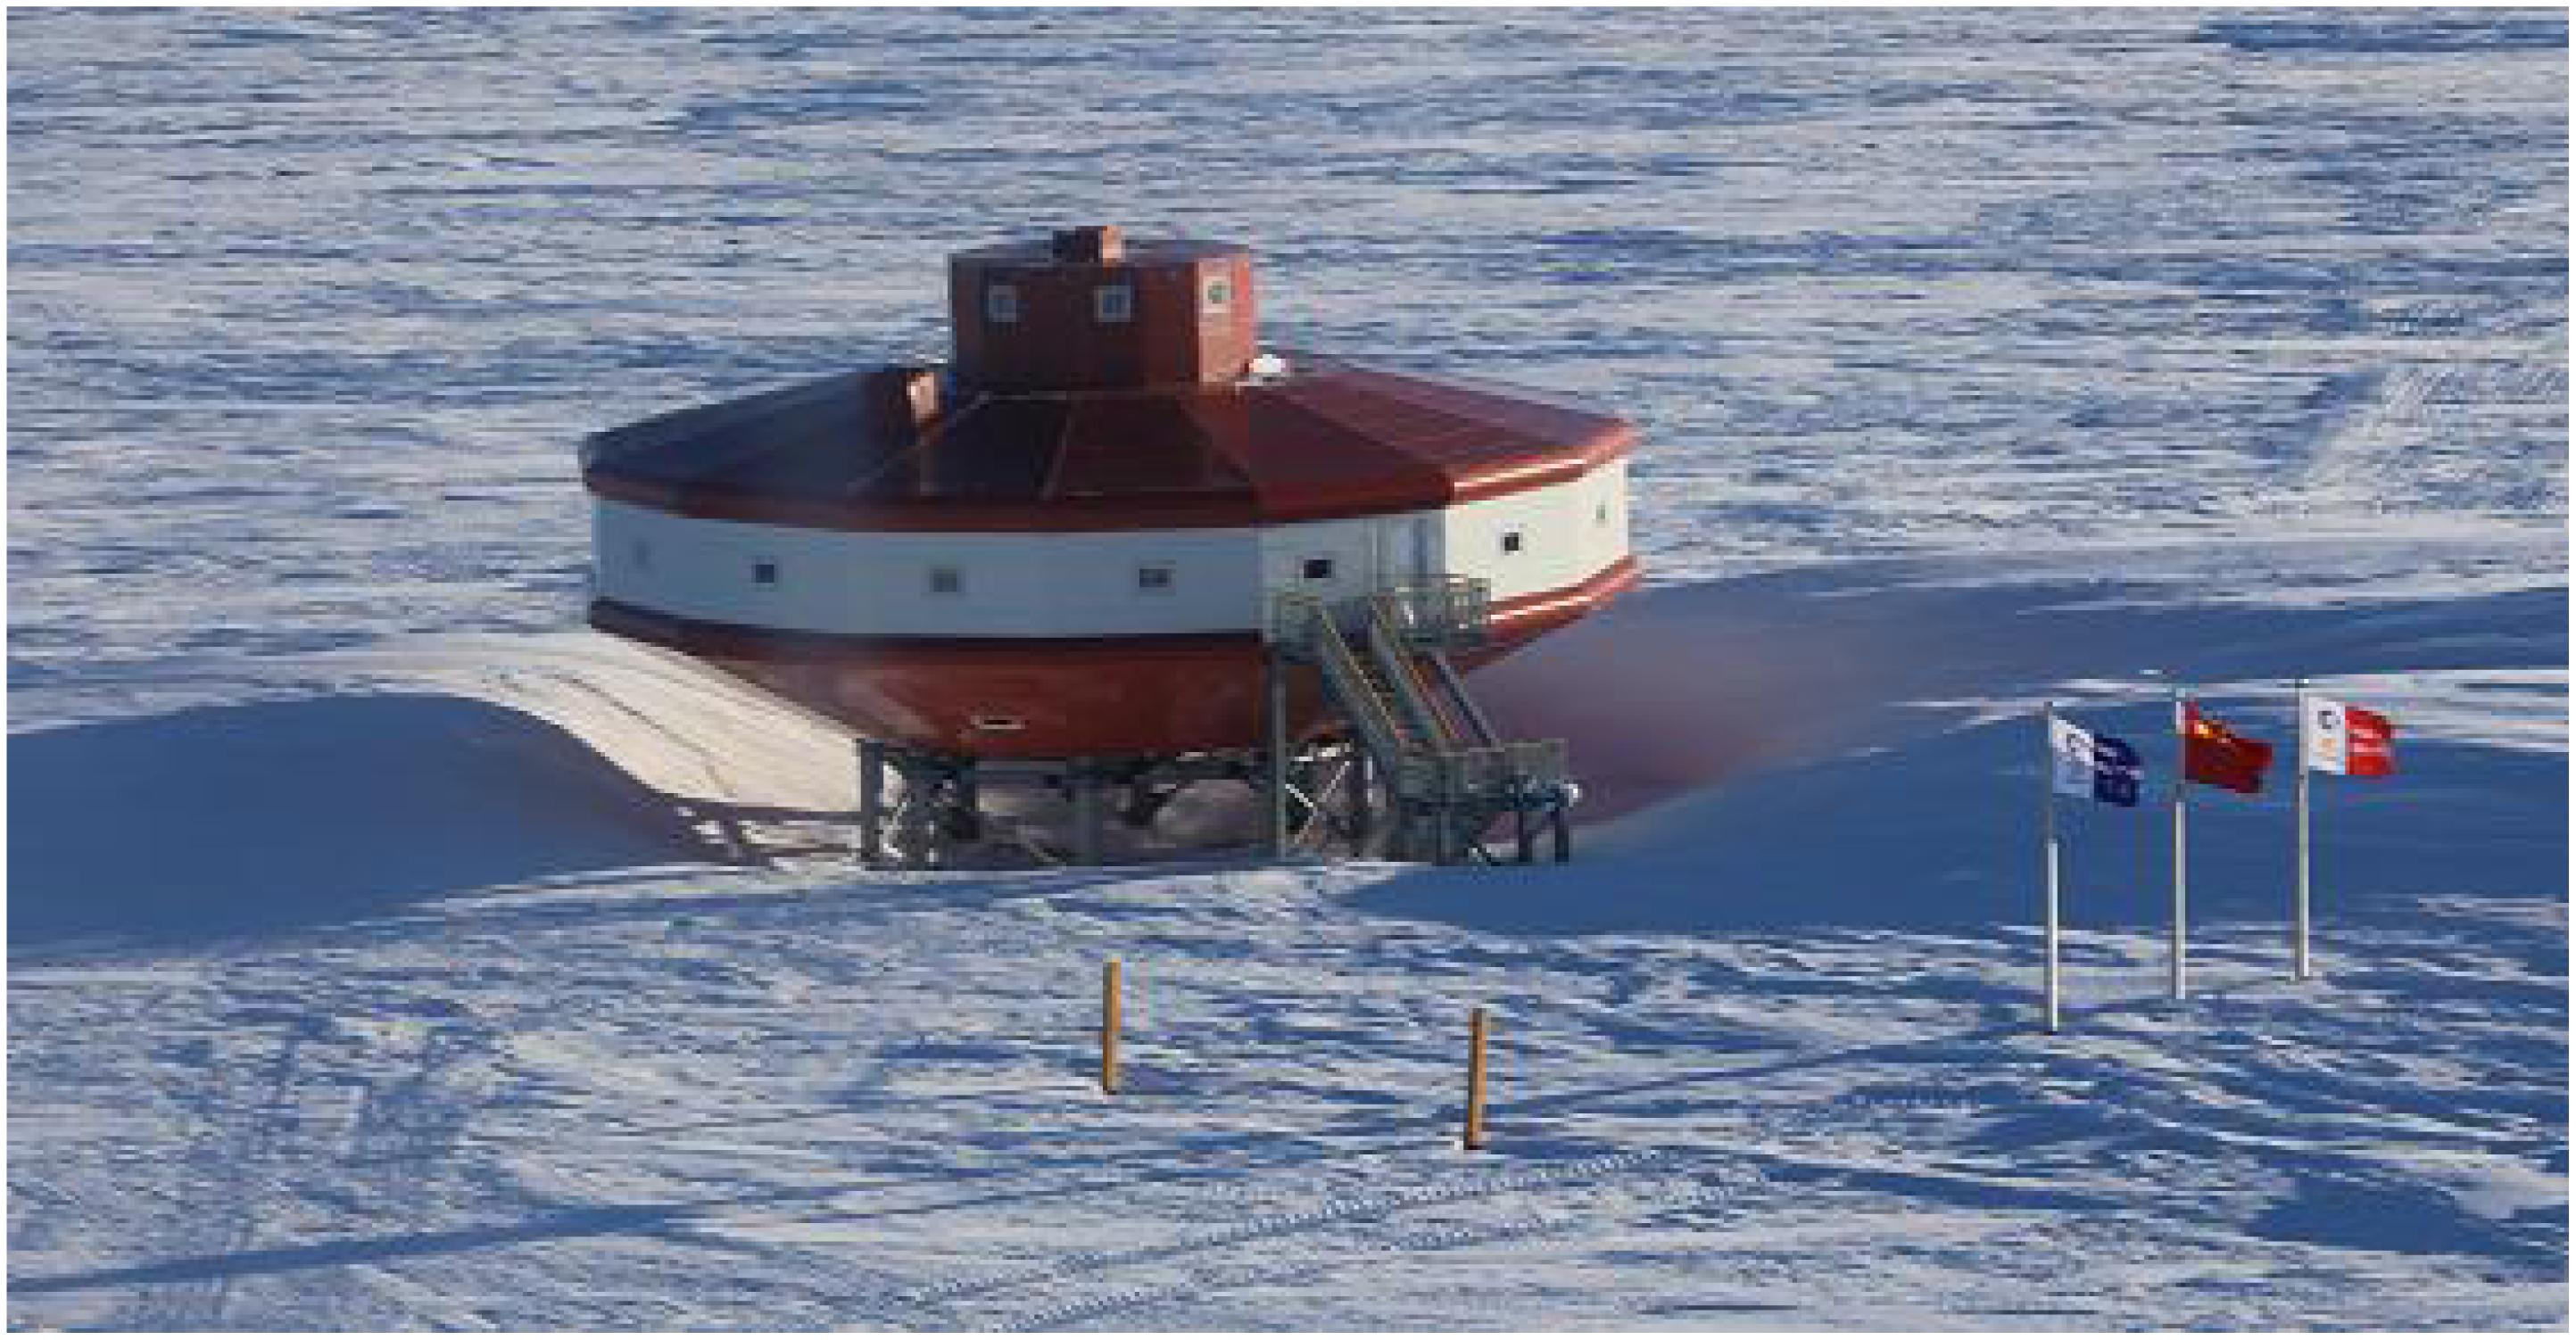
Figure 2. Aerial view of the Taishan Station site, January 2013.
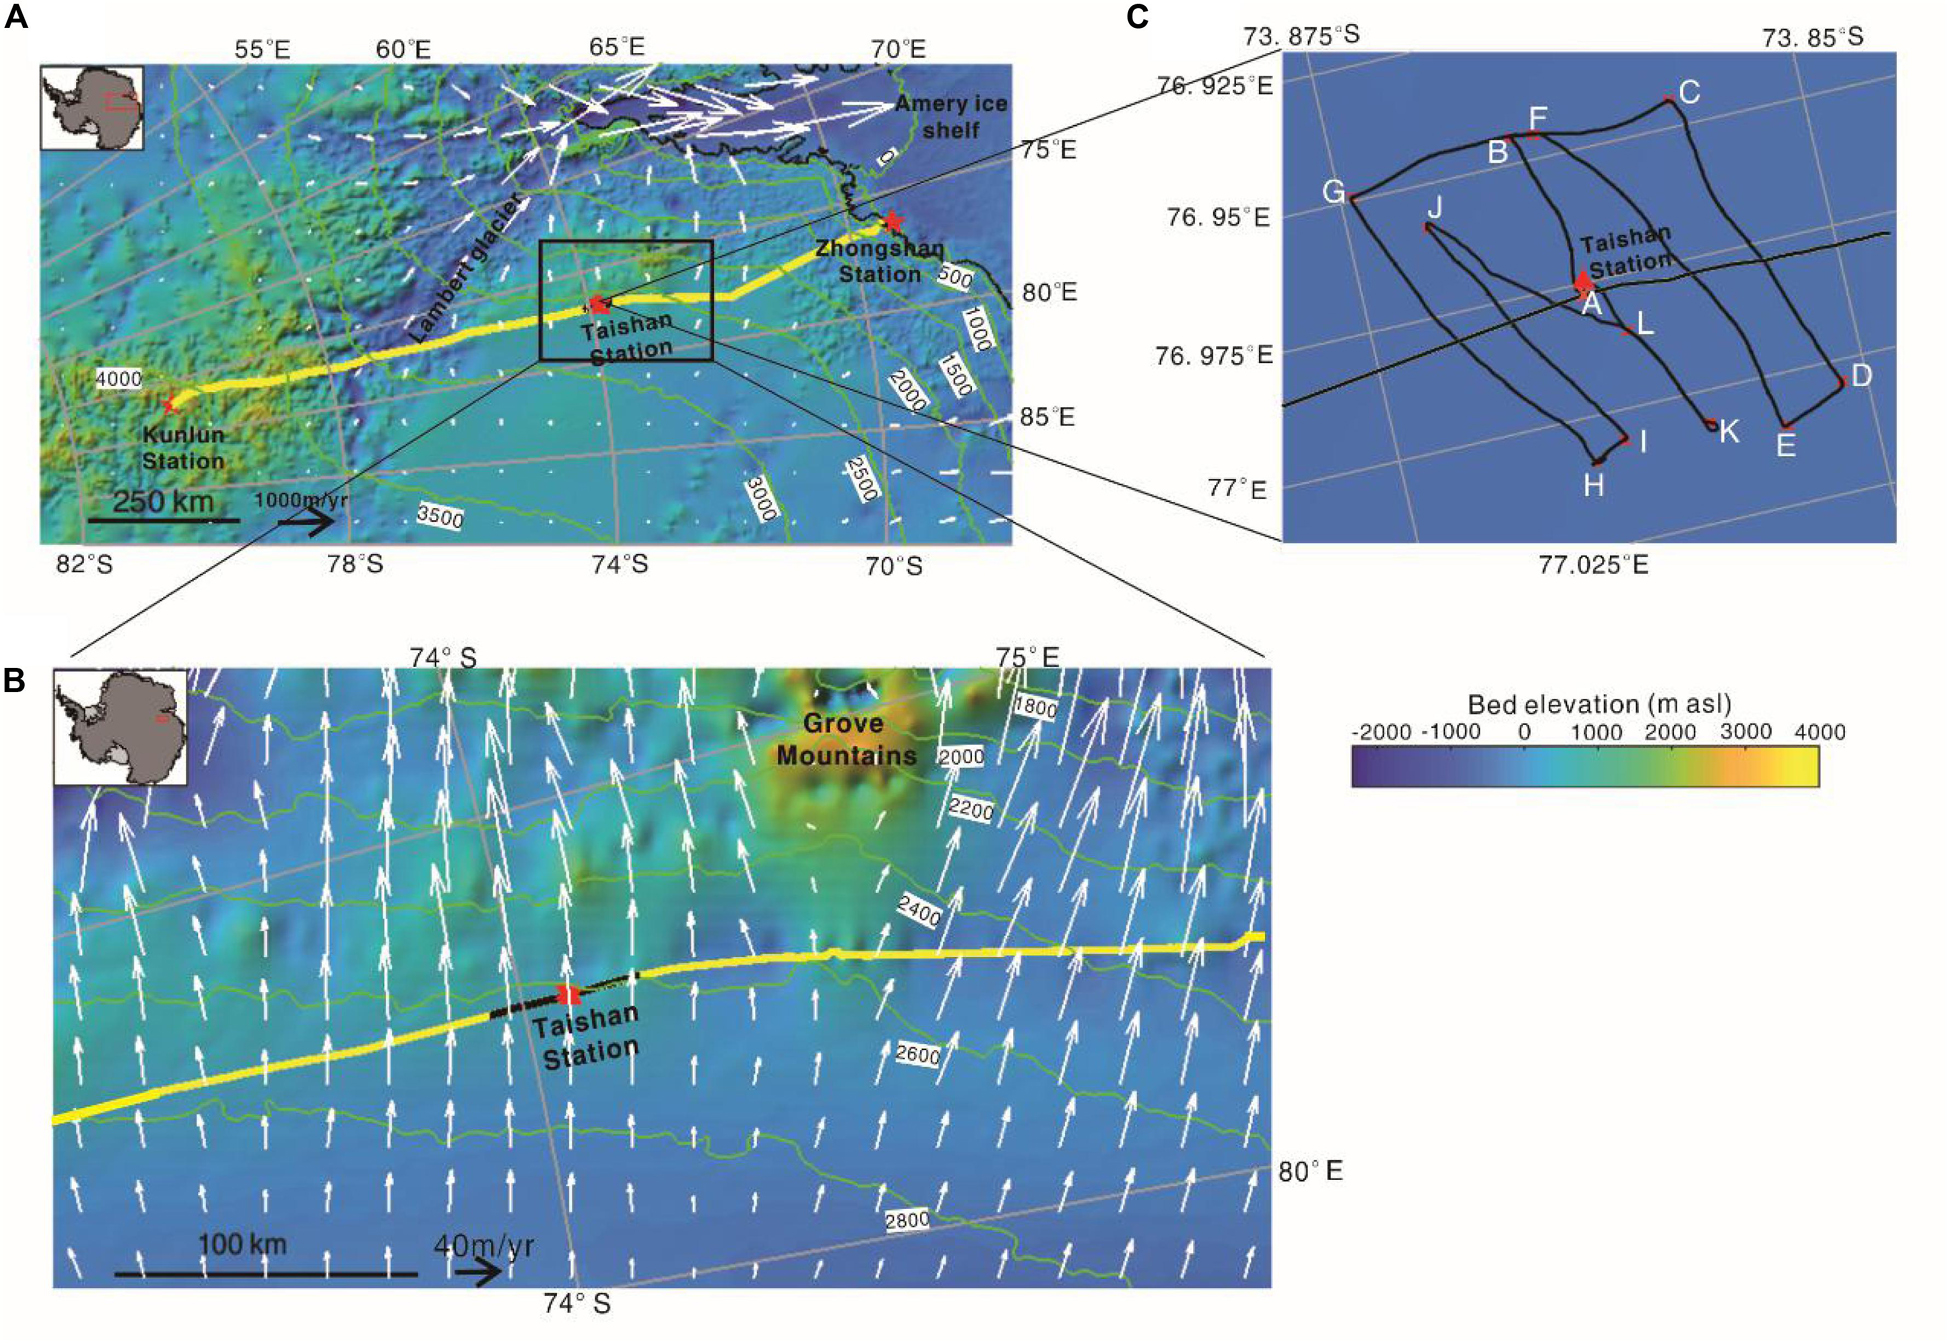
Figure 3. (A) Area map showing the transect routes from Zhongshan to Dome A, East Antarctica. (B) Location of Taishan Station (the red triangle) and orientation of the radar line (black) around the Taishan Station site. (C) Radar profiles in a 2 km × 2 km square area centered on the Taishan Station. The yellow line denotes the radar line from Zhongshan Station to Dome A. Bed elevation (background image), surface elevation (green line), and grounding line (black line) are from Bedmap2 (Fretwell et al., 2013; Tang et al., 2016; Greene et al., 2017). The white arrows represent the vector of the surface ice velocity which was derived from the interferometric synthetic aperture radar (InSAR) data (Rignot et al., 2011; Shepherd et al., 2018).
Here, we collect and analyze the data from field observations by CHINARE and present the glaciological and meteorological results obtained at Taishan Station. The glacio-meteorological parameters allow us to establish the fundamental environment characteristics at the site.
Surface Mass Balance and Ice Flow
Surface mass balance is usually used to represent snow accumulation on the Antarctic ice sheet. Along the transect from Zhongshan to Dome A, CHINARE have installed a series of stakes, which were used to measure the surface mass balance during the expeditions in 1999, 2005, 2008, 2011, and 2013. Ding et al. (2011, 2015) discussed the temporal trend of the surface mass balance based on the morphological, geographical, and meteorological conditions of the CHINARE transect. Their studies showed that the average surface mass balance values in 1999–2013 in a section with a length of 300 km covering the Taishan Station site was 65.5 kg m–2 a–1, and wind-driven processes had a great impact on surface mass balance.
Here, the regional surface ice velocity data are collected in the satellite-derived MEaSUREs database from the National Snow and Ice Data Center (NSIDC; Rignot et al., 2011; Shepherd et al., 2018). The ice flow of Princess Elizabeth Land and Dome A of the East Antarctic ice sheet moves toward the Lambert glacier and finally enters the Amery ice shelf (Figure 3A). The ice flow directions along a radar line across the Taishan Station site are approximately perpendicular to the ice surface elevation contours (Figure 3B), and the ice velocities are 12.5–18 m year–1. The average ice flow speed near Taishan Station is 16 m year–1 (Figure 3C).
Radar Surveys
Previous radar measurements along Zhongshan Station to Dome A were performed in 2004/2005 using an ice penetrating radar system with a center frequency of 60 MHz (Cui et al., 2010; Tang et al., 2011), which produced detailed maps of the ice thickness and bed topography along the traverse (close to the Taishan Station site) (Figure 3C). Subsequent radar measurements were made in 2012/2013 on an ice-penetrating radar (IPR) traverse from Zhongshan Station (69.449°S, 76.311°E) to Dome A covering Taishan Station (Figure 3A). The main technical parameters of deep IPR are given in Table 1. The ice-penetrating radar was designed as a linear frequency modulated pulse system by the Institute of Electronics of the Chinese Academy of Sciences with a center frequency of 150 MHz and a bandwidth of 100 MHz. For deep ice measurements over 3,000 m, the radar operates with long 8 μs chirped pulses, a pulse repetition frequency (PRF) of 8 kHz, and a peak transmitting power of 500 W. The data acquisition system digitizes the received signal at a sampling frequency of 500 MHz and simultaneously acquires the GPS signal. Two logarithmic period antennas were mounted 2 m above the ice surface on the specialized versatile mobile observation cabin. The spacing between the antennas was 20–30 dB. The specialized cabin was carried by a snow vehicle at a speed of 12–15 km h–1 (Tang et al., 2016; Liu et al., 2018). To evaluate the subglacial internal stratigraphy at Taishan Station, we selected a radar profile of about 50 km on the cross section near Taishan Station, which is from (73.7228°S, 76.9671°E) to (74.1683°S, 77.0075°E) (Figure 3B). We also selected four radar profiles (G–H, B–K, C–D, and C–G) in a 2 km × 2 km square area centered around Taishan Station (Figure 3C).
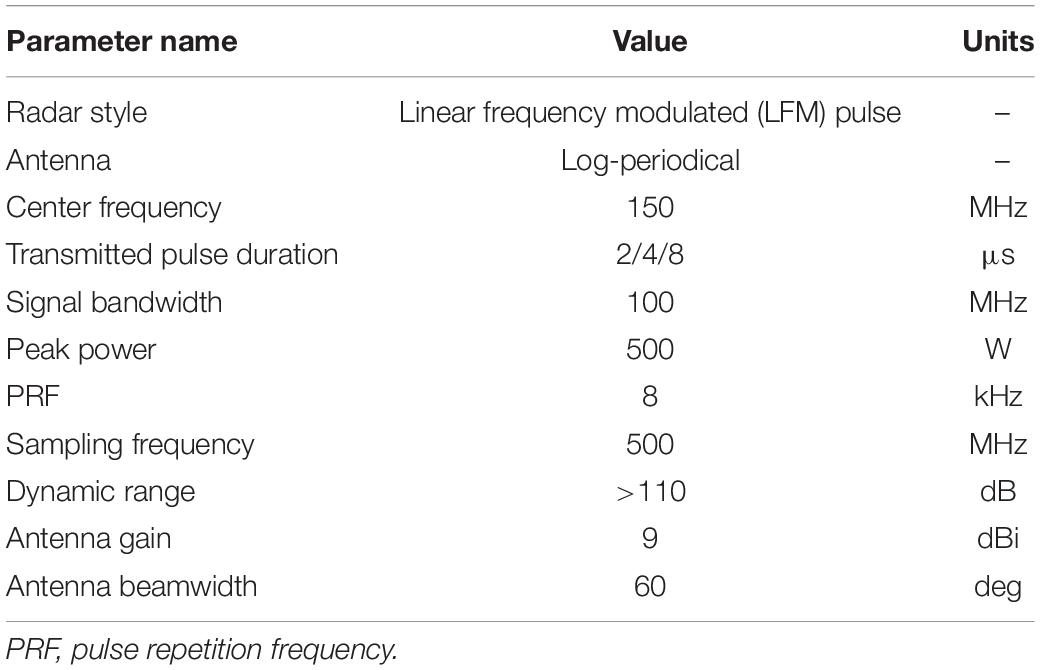
Table 1. The parameters of the ice-penetrating radar.
For radar data processing, we first removed 2,000 sampling points of the raw data, which is the blind area caused by the receiver-blanking switch in order to avoid data receiver saturation. Then, the processes, including eliminating redundant traces, coherently stacking 150 traces, pulse compression, and mean filtering, were conducted. Finally, the conversion of time to depth was used to estimate the ice thickness by the electromagnetic wave speed of 0.168 m ns–1 within the ice sheet (Zhang et al., 2006).
Ice Thickness and Bed Topography
High-resolution ice radar profiles can effectively evaluate the subglacial topography, ice thickness, and internal structure of ice sheets (Figures 4, 5). Those profiles allowed us to establish the fundamental glaciological characteristics of the ice surface and bedrock in the vicinity of Taishan Station (Figures 4A, 5A). Figure 4A shows a profile through Taishan Station. The profile reveals that the ice surface is flat, with an elevation of 2,620 m a.s.l. at Taishan Station. In the first 25 km, the bed elevation difference of the undulating subglacial topography is about 300 m, and the ice thickness is between 1,400–1,700 m. Within 25–50 km, the bed elevation is between 600 and 900 m a.s.l., and the average ice thickness is 1,900 m (Figure 5B). Along the radar profile, the ice-surface speed is about 15 m year–1 (Figure 5C), which is in good agreement with the previous estimation from stake observations (Zhang et al., 2008). The average ice thickness of the echo free zone is about 400 m, where echo free zone is a layer in the lowest hundreds of meters above bedrock more or less free of radar echoes. Around the station site, the variation of the ice thickness along the profiles is between 1,860 and 1,953 m, and the bed topography varies from 664 to 773 m a.s.l. and is about 750 m a.s.l. at the Taishan Station site, revealing a subglacial mountainous landscape. Compared with the previous study of the ice thickness and bed elevation, Tang et al. (2016) used a ground-based radar dataset over this area from 2004/2005 to 2012/2013 and GPS measurements to establish a two-dimensional map of ice thickness and bed topography. However, due to the poor denoising of the radar data, the radar profiles only show part of the subglacial bedrock and fail to identify the internal layer around Taishan Station. Therefore, they can only obtain a low-resolution map of the ice thickness by interpolation.
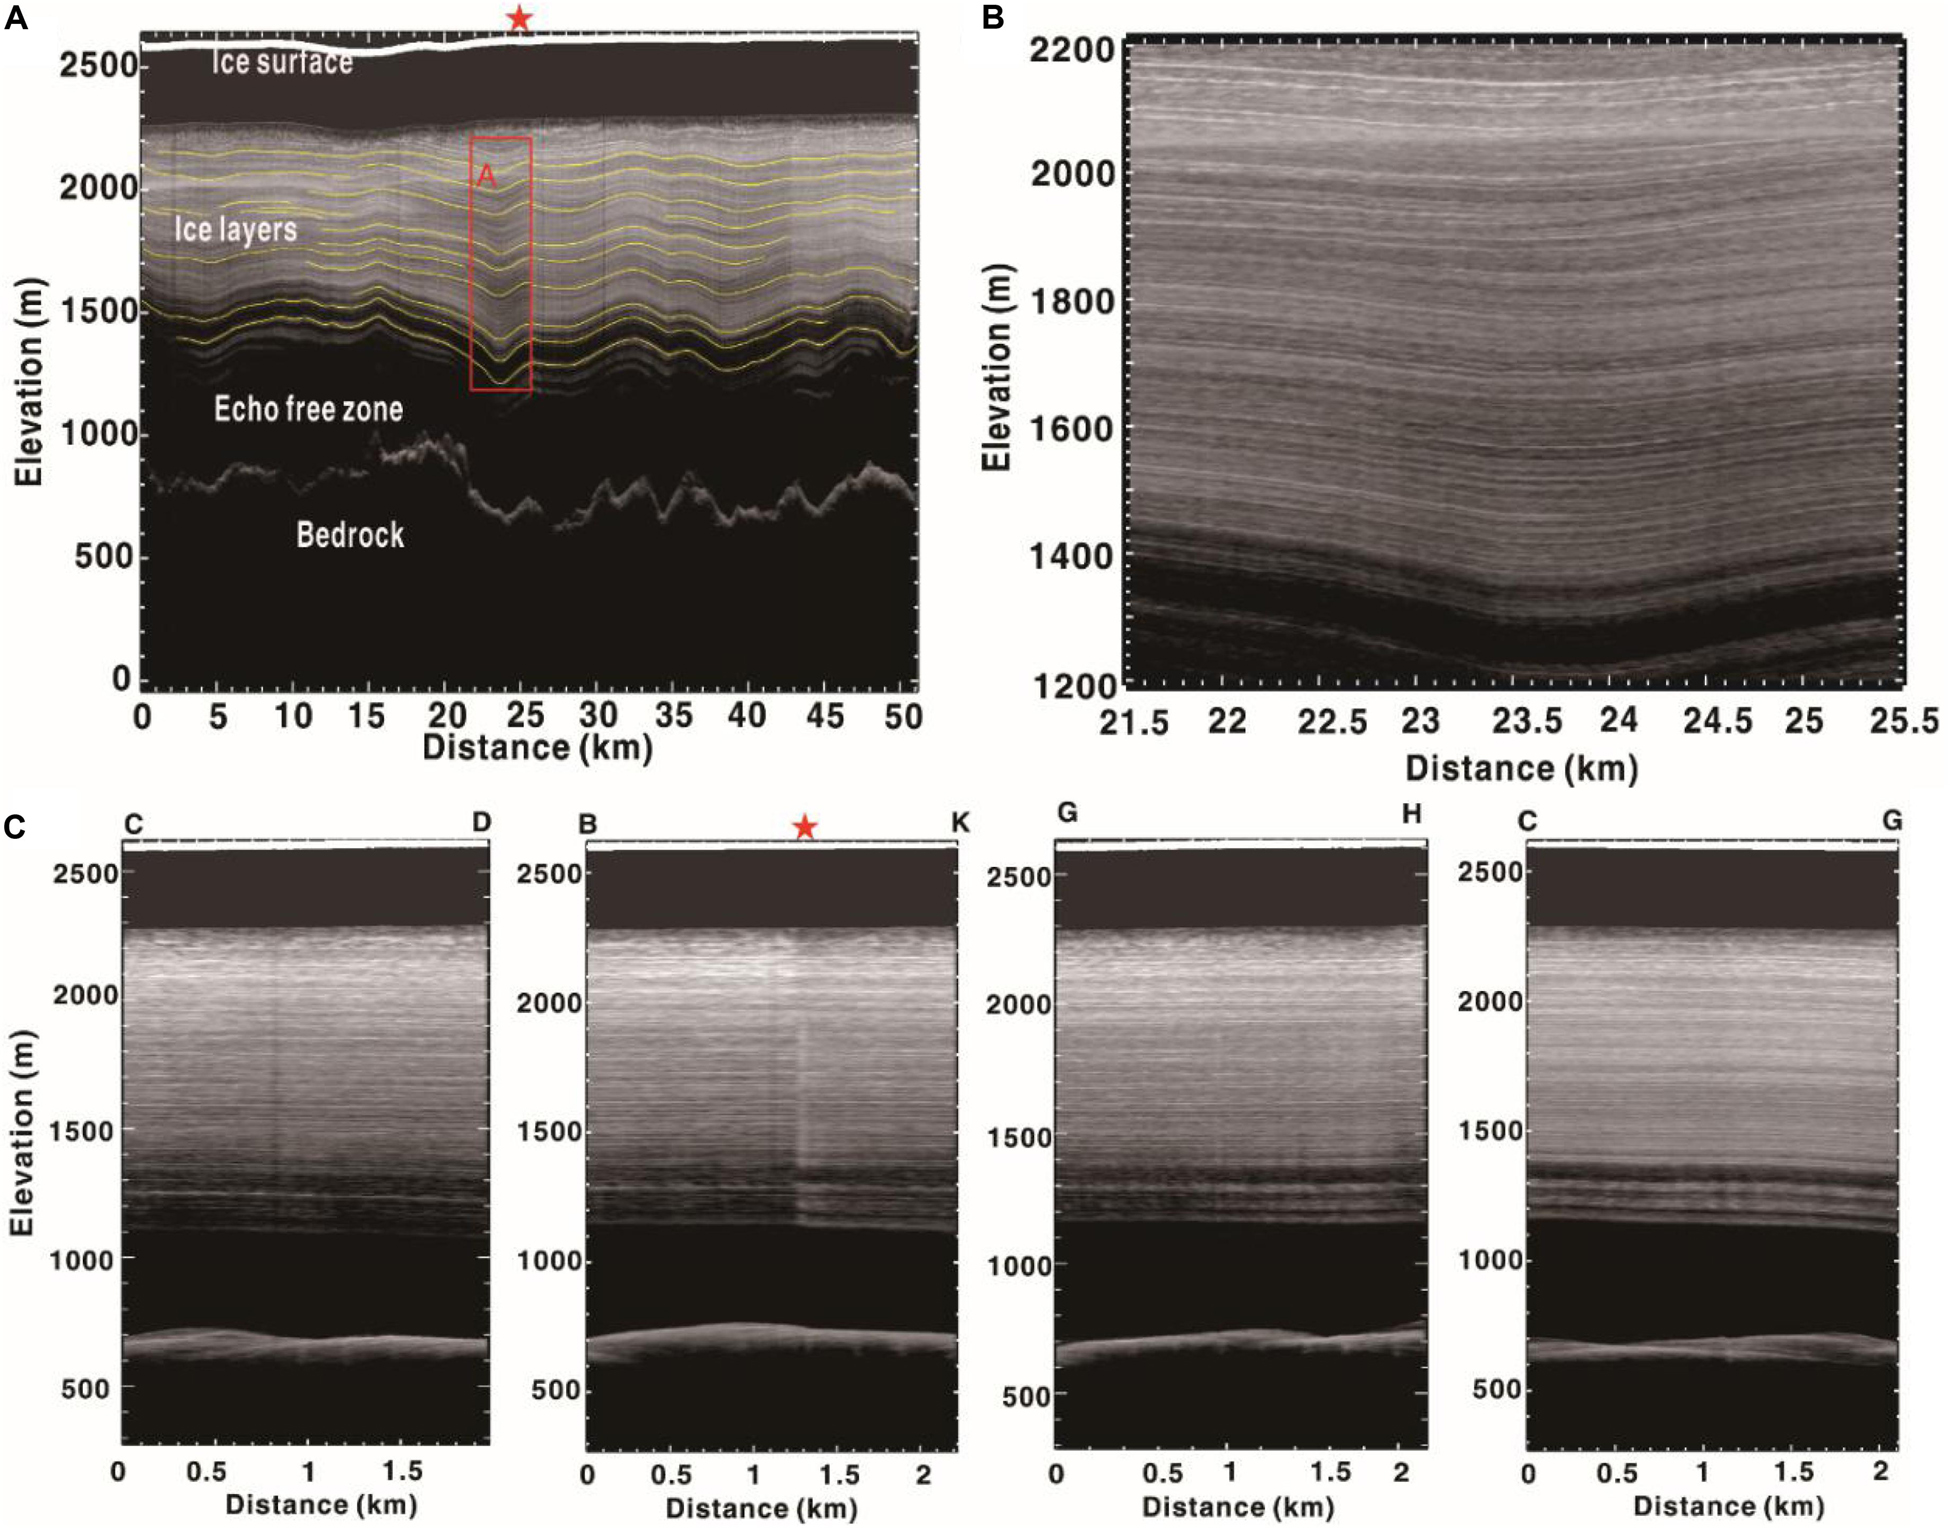
Figure 4. Radargrams of ice-penetrating radar from CHINARE (Chinese Antarctic Research Expedition) 29. The red star marks the position of Taishan Station. (A) Profile of high resolution (150 MHz) corresponding to the black line though Taishan Station in Figure 3B. (B) Radar profile of the selected red rectangles in (A). (C) Radar profiles around Taishan Station (corresponding to Figure 3C).
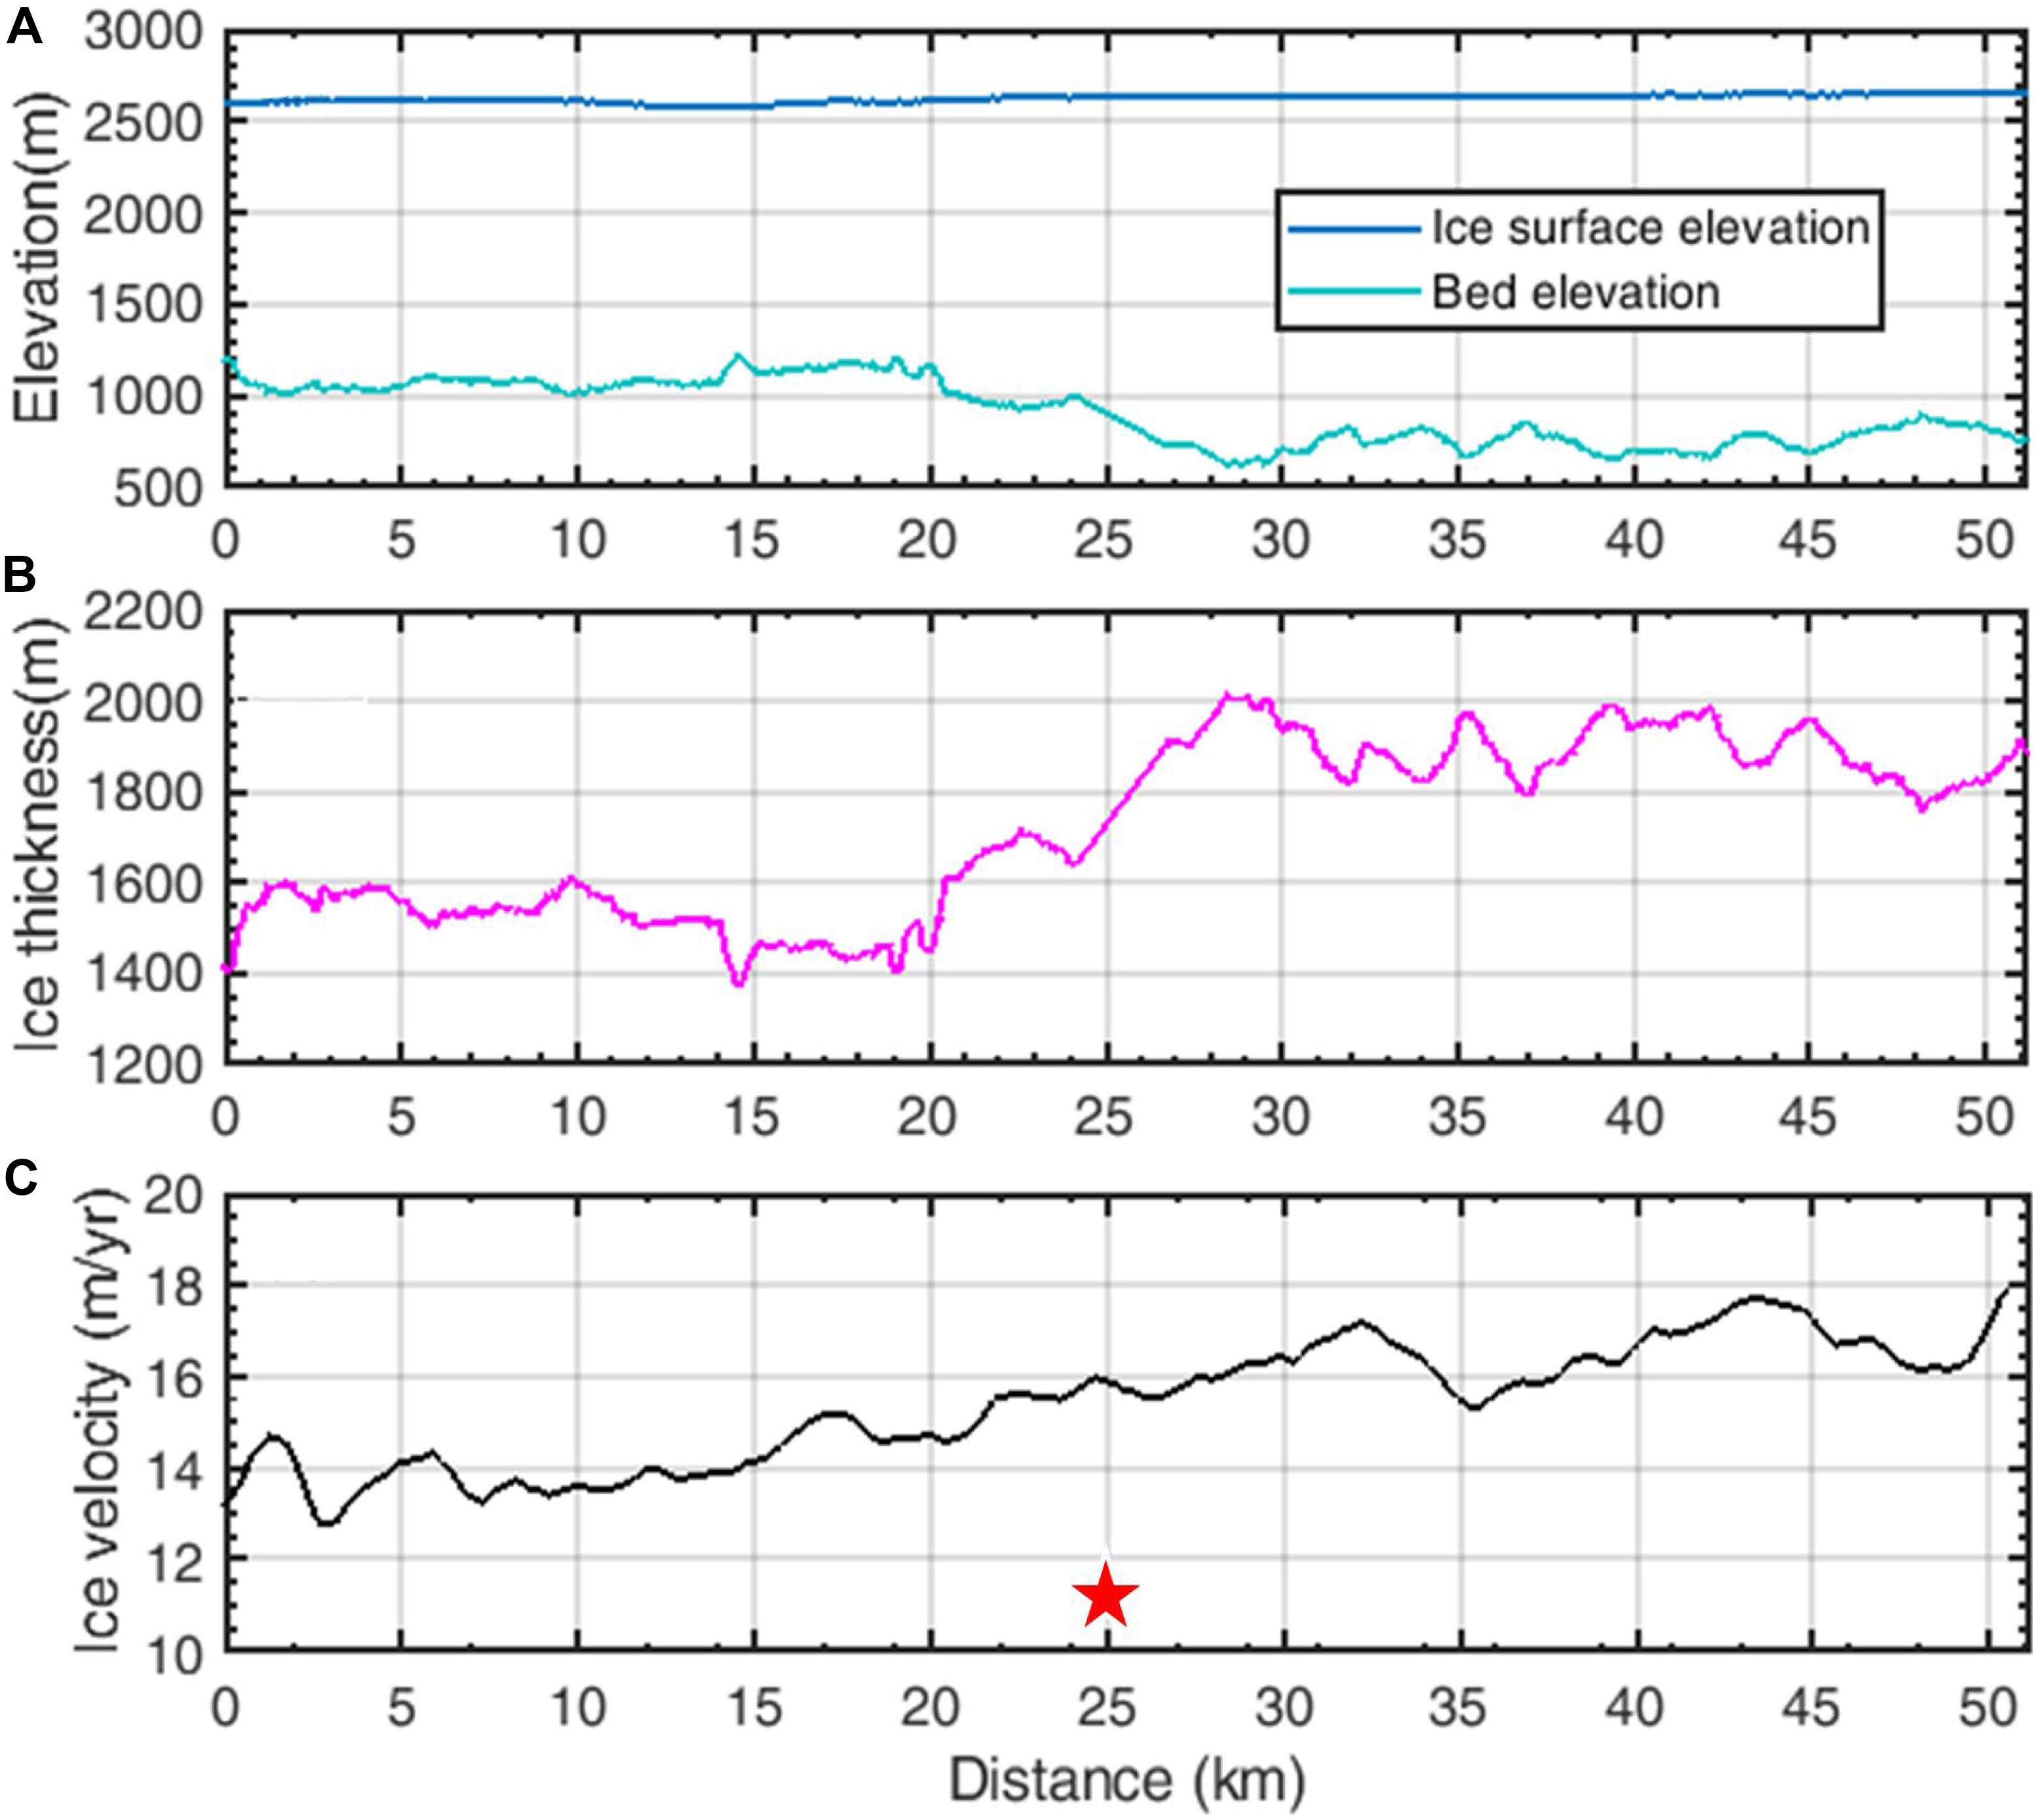
Figure 5. (A) Surface and subglacial topography elevation, (B) ice thickness, and (C) ice velocity, from Rignot et al. (2011). The radar profile is shown in Figure 4A. The red star marks the position of Taishan Station.
Internal Layers
Internal layers recorded in radar images can provide additional local information about bed, surface and internal reflections, and inform ice-flow modeling (Cavitte et al., 2016). The profile reveals that the ice surface is flat (Figure 5A), and the ice deformation pattern of the internal layer changes with the subglacial bed topography. As the internal layer is closer to the surface, the amplitude of the undulation gradually decreases. Excluding the blind zone data that is cut off near the ice surface, we can pick up about 60% of the visible isochronic layers. Figure 4B shows a bright isochronous layer with a minimum thickness interval of 5 m between adjacent layers. It can be seen from the four profiles in Figure 4C that the topography near Taishan Station is flat and the internal layering structure is intact. The ice thickness is 1,900 m, and the thickness of the visible isochronous layers is about 1,150 m. The bright layers of the radar profile are important for future ice core age estimation.
Modeling the Age–Depth Relationship and Ice Temperature
The dynamics process of the ice flow below Taishan Station is unknown. To determine the temperature–depth profile and the age distribution, we use different flux shape functions to simulate the ice flow. In principle, it is assumed that the mass balance of ice flow is given based on the incompressibility condition. The flux shape function depends on a non-dimensional vertical coordinate and is the combination of one sliding term and one deformation term (Parrenin et al., 2007). It can be expressed in the following form:
where ωD(ξ) is the deformation term, is the normalized vertical coordinate (oriented toward the ice surface, ξ = 0 denotes the bedrock), B is bedrock elevation, H is the ice thickness elevation, z is the vertical coordinate of the ice particle, and n is the exponent of Glen Law.
Assuming the basal ice is not melting, the flux shape function approximately represents the vertical compression, which describes the ratio of the layer thickness to its initial thickness at the surface (Parrenin et al., 2007). We can calculate the age of the ice by integrating along the particle trajectories of the vertical compression. The age at ξ (at depth z) is given by
where a(x) is the accumulation.
In the following text, we use three flux shape functions to estimate the temperature-depth and age-depth relationship. The three functions are described as (1) the exponent of the value n = 3 in Glen’s flow where the ice fabric was induced by isothermal internal deformation under the shallow-ice approximation, i.e., no sliding ω(ξ) = ωD(ξ) (s = 0, n = 3) (Glen, 1952); (2) the plug flow, i.e., all sliding ω(ξ) = ξ (Parrenin et al., 2007); and (3) the non-linear rheology of ice (Raymond–Reeh model), i.e., a parabolic profile for the plug flux shape function ω (n = 3), where shear stresses are negligible (Raymond, 1983; Reeh, 1988). The melting point of ice decreases linearly as a function of the depth (Huybrechts and Payne, 1996).
The input data for the models were the accumulation rates, surface temperature, and geothermal heat flux in the region of Taishan Station. The temperature string data shows that the annual mean temperature is −35.5°C. The average accumulation rate is 53 kg m–2 a–1 (13 cm depth of snow), and the average snow density is 389 kg m–3, as determined from the measurements of the stake arrays estimating the surface mass balance along the traverse route from Zhongshan to Dome A (Ding et al., 2011). For solid ice, the density is 917 kg m–3 (Cuffey and Paterson, 2010). Then, present day accumulation rates are estimated as about 58 mm ice equivalents every year. The largest uncertainty in calculating the temperature profiles is the value of the geothermal heat flux (G). No direct measurements for G exist in this area, and from the studies by Van Liefferinge and Pattyn (2013), we consider the values for G to be 50, 55, or 60 mW m–2. From the radar profiles, the ice thickness of the site at Taishan Station is shown to be 1,870 m.
The age–depth, and temperature–depth relationships derived from the model results with the input data are shown in Figure 6. The result of the ice flow modeling makes it possible to estimate the age and temperature of the ice in the bottom part of Taishan Station, where no age markers are yet available. All three age–depth profiles from the three flux shape functions closely agree about the basal age of the ice: approximately 50–150 kyr (kiloyear). Note that the “Raymond–Reeh” model is valid for the ice-divide region, where longitudinal stress gradients cannot be ignored (Raymond, 1983), and Taishan Station is clearly not located in a region of ice divide. Thus, in the age–depth profile of this model, at the same depth, the age may be overestimated. The temperature profiles (Figure 6) predict that the basal ice may reach the melting point (Raymon–Neeh model), or the basal ice freezing point (Plug flow model). While no basal melting corresponding to the bright reflector was found in radar profiles and because the region of Taishan Station is not an ice divide, the one-dimensional assumption of the Raymon–Neeh model is probably invalid in this region. For the temperature profile, it should be noted that below the threshold of zero melting, a slight decrease in the geothermal flux has no impact on the basal melting.
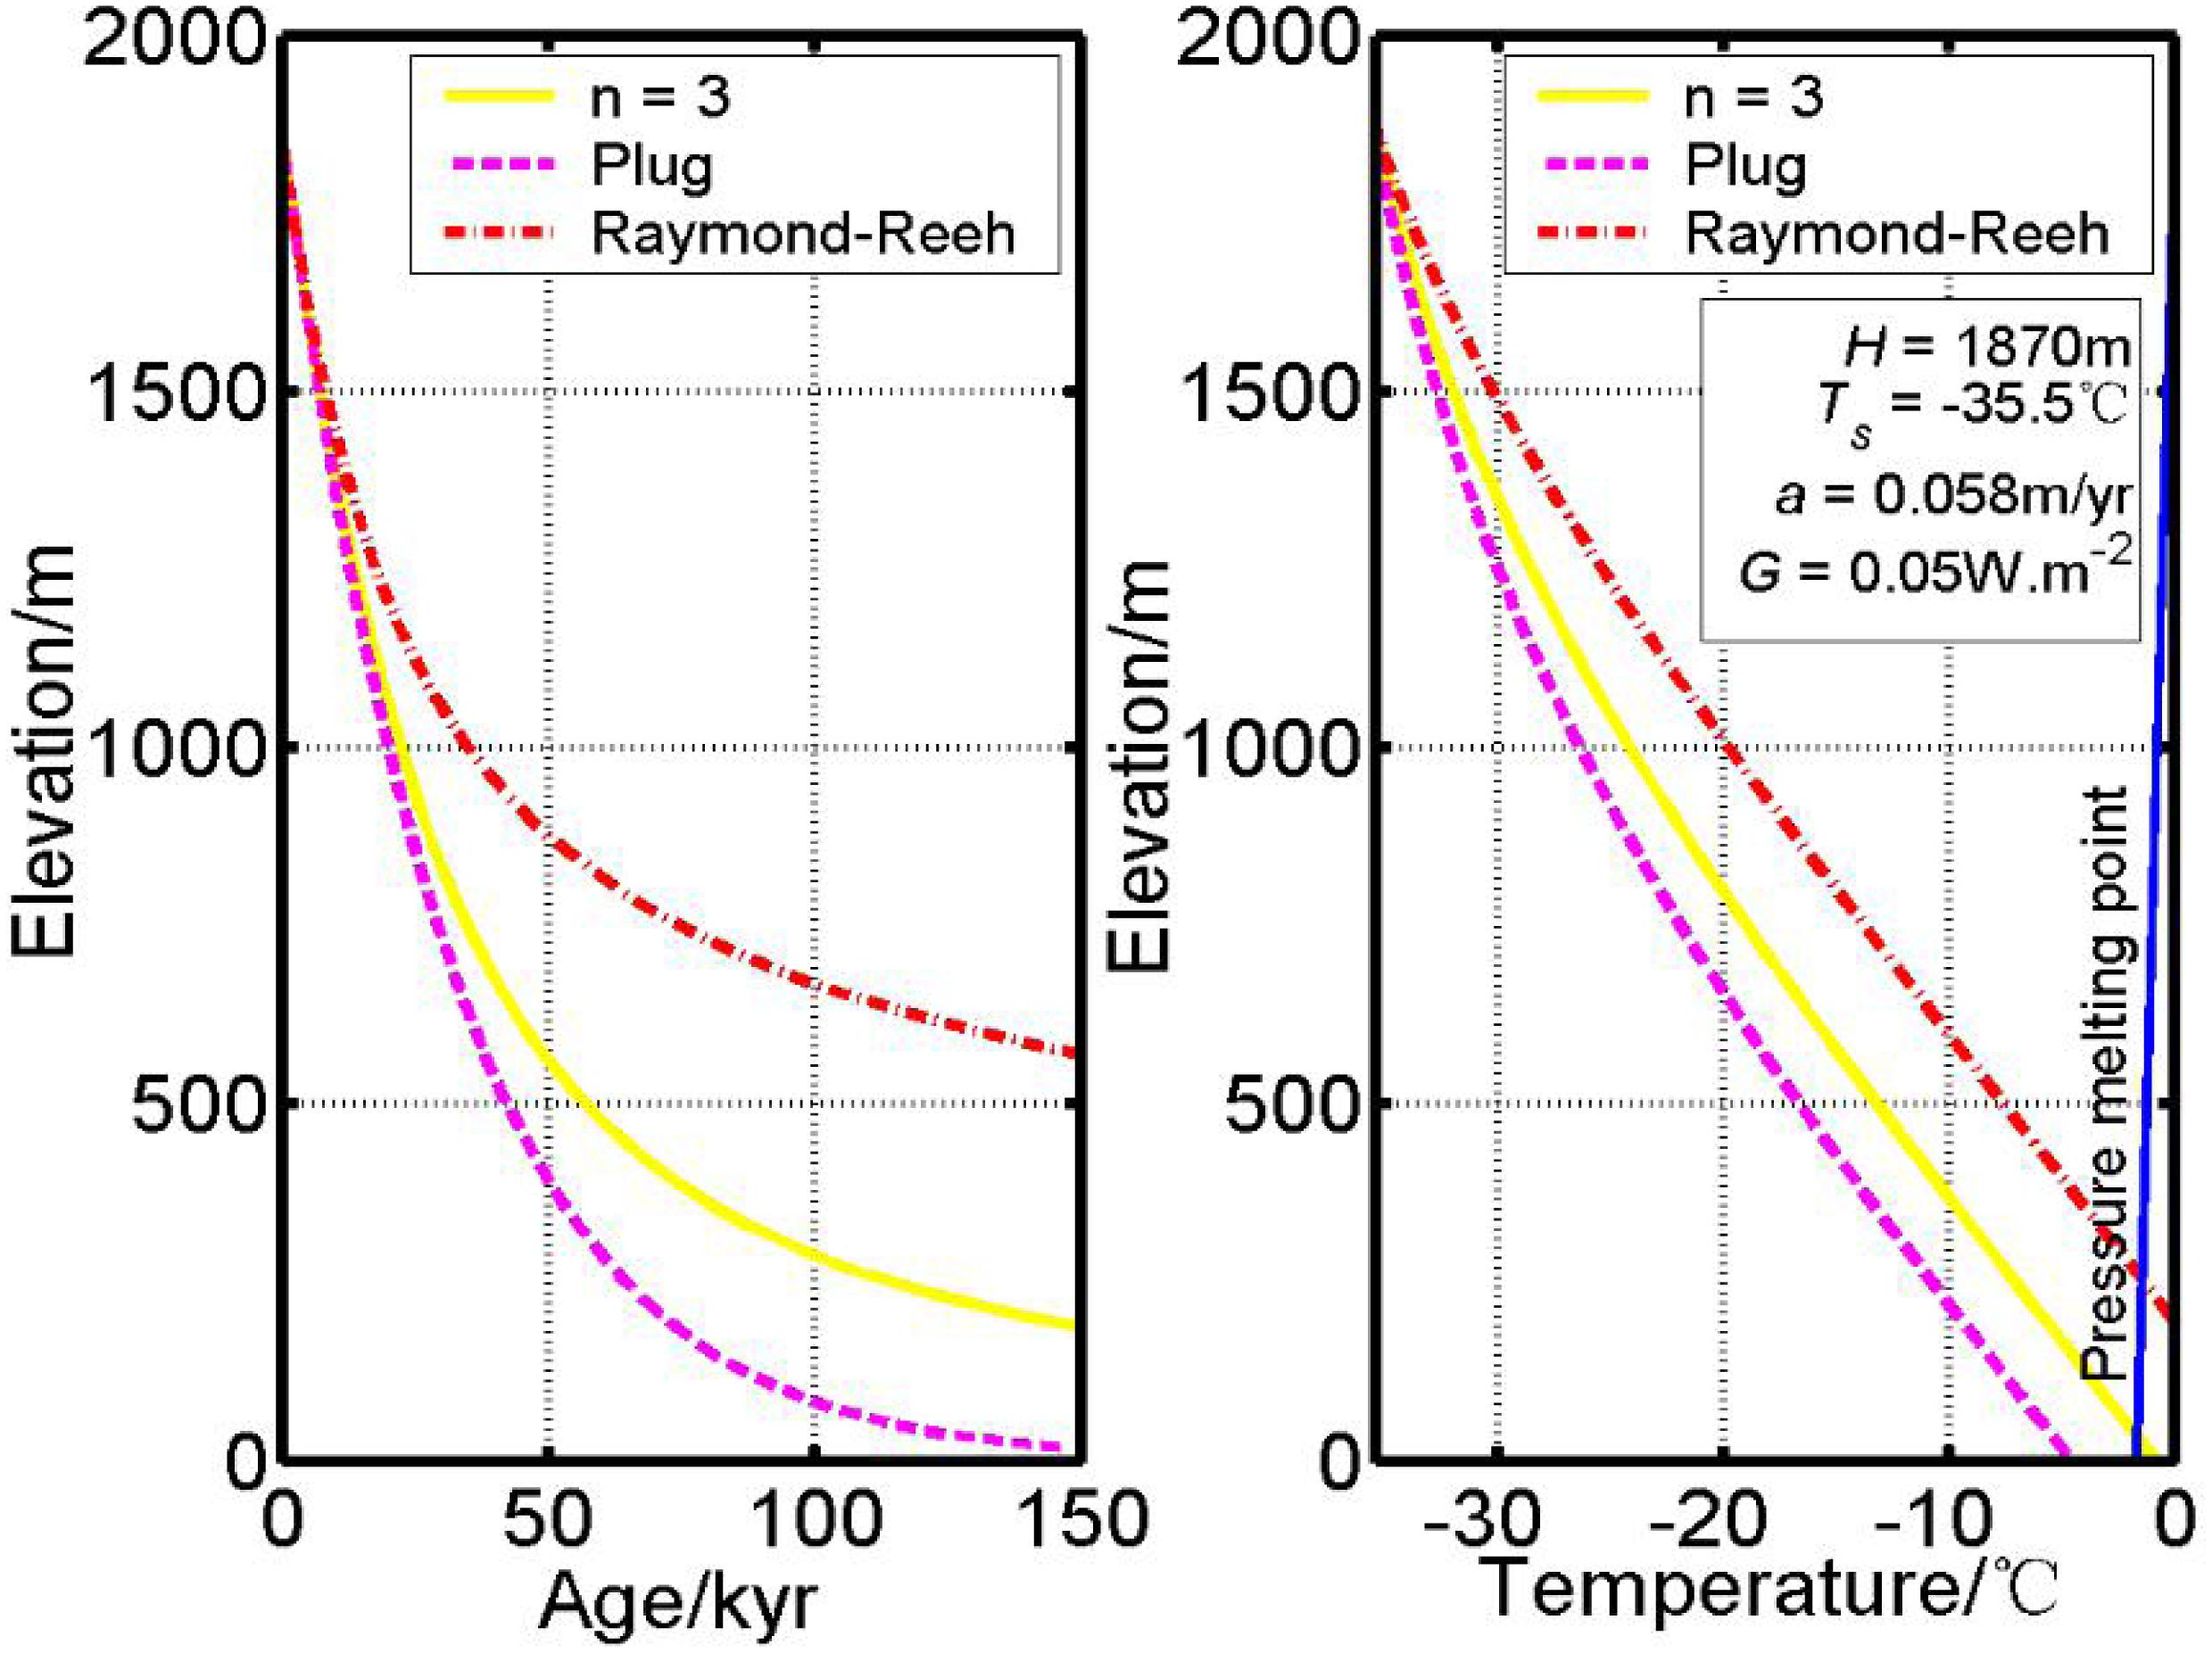
Figure 6. Profiles of age depth and temperature depth at Taishan Station calculated for the input parameters of the ice thickness H, surface temperature Ts, and accumulation a, and geothermal heat flux values G of 50 mW m–2 from modeling using three flux shape functions in the ice model.
Snow Temperature
Accurate and reliable near-surface ice temperature is an important factor in numerical models for assessing the mass balance and energy balance of polar ice sheets. Because the ice flow of Taishan Station is relatively stable and preserves the complete layered structure, to analyze its vertical variation along the temperature profile is of great value.
A 10 m temperature chain was installed at a site with initial coordinates of (73°51′50″S, 76°58′28″E) at Taishan Station (Figure 2) during CHINARE 32nd on January 31, 2016. The string of temperature sensors was used to monitor the temperature change in the shallow near-surface snow layer. Figure 7 shows the daily average snow temperatures at six typical depths (0.1, 2, 4, 6, 8, and 10 m) from February 2016 to January 2017 at Taishan Station. The daily average temperature was chosen as the average of four representative times (2:00, 8:00, 14:00, and 20:00).
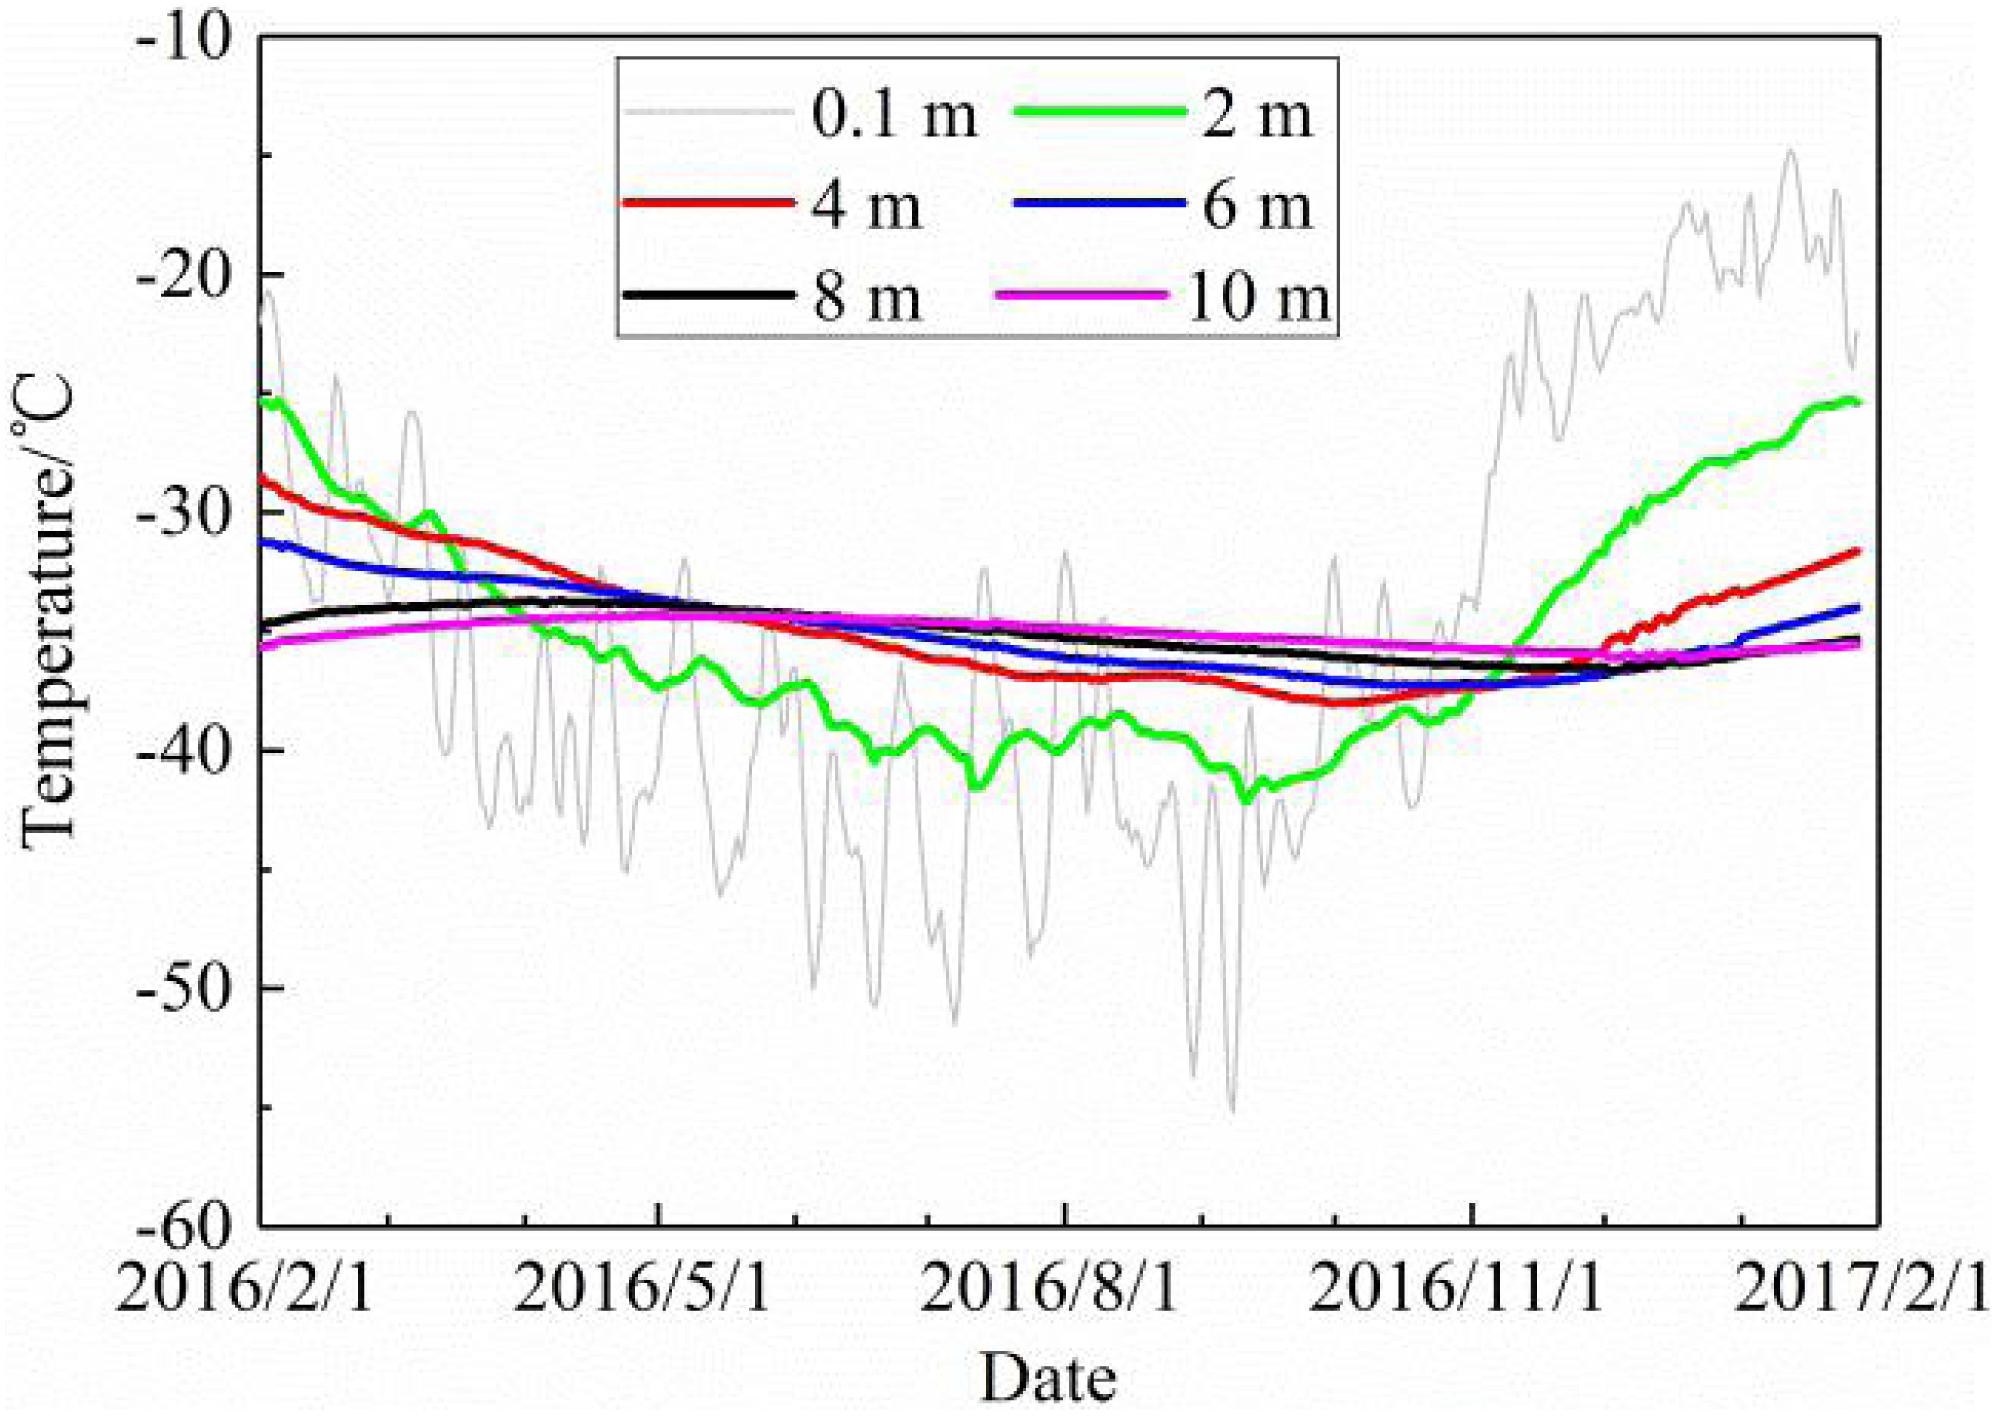
Figure 7. Daily average snow temperatures at different depths at Taishan Station from February 2016 to January 2017.
Figure 7 shows that the high frequency change from the surface to the snow layer gradually disappears when heat is conducted in the snow layer. The amplitude of snow layer temperature fluctuation from the surface decreases with depth, and the phase of snow layer temperature fluctuation from the surface lags with depth.
The snow temperature at a depth of 0.1 m from the surface is greatly affected by changes in the surface temperature, and the high frequency of the surface temperature wave decreases sharply from the surface downwards. At the depth of 2 m, the snow temperature has clear seasonal fluctuations, and the daily temperature variation is weak. The seasonal fluctuations of snow temperature at depths of 4, 6, and 8 m decrease gradually and the seasonal fluctuation of snow temperature at the depth of 10 m basically disappears. From a phase point of view, the temperature at the surface reached the lowest value on September 8, 2016, and the date that the temperature at various depths from the surface downwards reached the lowest value lagged behind slightly. The temperature at the depth of 10 m reached the lowest value on December 19, 2016, 101 days behind from the date at the surface.
The snow temperature at the depth of 10 m is an important indicator in glaciology. It is commonly accepted that the snow temperature at the depth of 10 m is equivalent to the mean annual air temperature at the surface in the dry-snow zone (Chen et al., 2010). It can be seen from Figure 7 that the snow temperature at the depth of 10 m is almost constant—it is maintained at the −35.5°C baseline. The value is close to the annual average snow temperature at the depth of 10 m at LT790 (−36.1°C) which is 46 km away from Taishan Station (Ding et al., 2010).
Snow Density Profiles
The surface temperature of the Antarctic ice sheet is extremely low, and the surface of the ice sheet does not melt, even in summer. It is named as the dry-snow zone in glaciology. The Taishan Station is a cold-type densification zone (Qin, 1987). We drilled a 10 m snow core at Taishan Station during the 2012/2013 CHINARE field season. The snow density at each depth was calculated by the length and weight data. The result is shown in Figure 8, and the fitting curve of the snow density data is also shown. The fitting curve of the snow density data was constructed by referring to the densification model (Cuffey and Paterson, 2010):
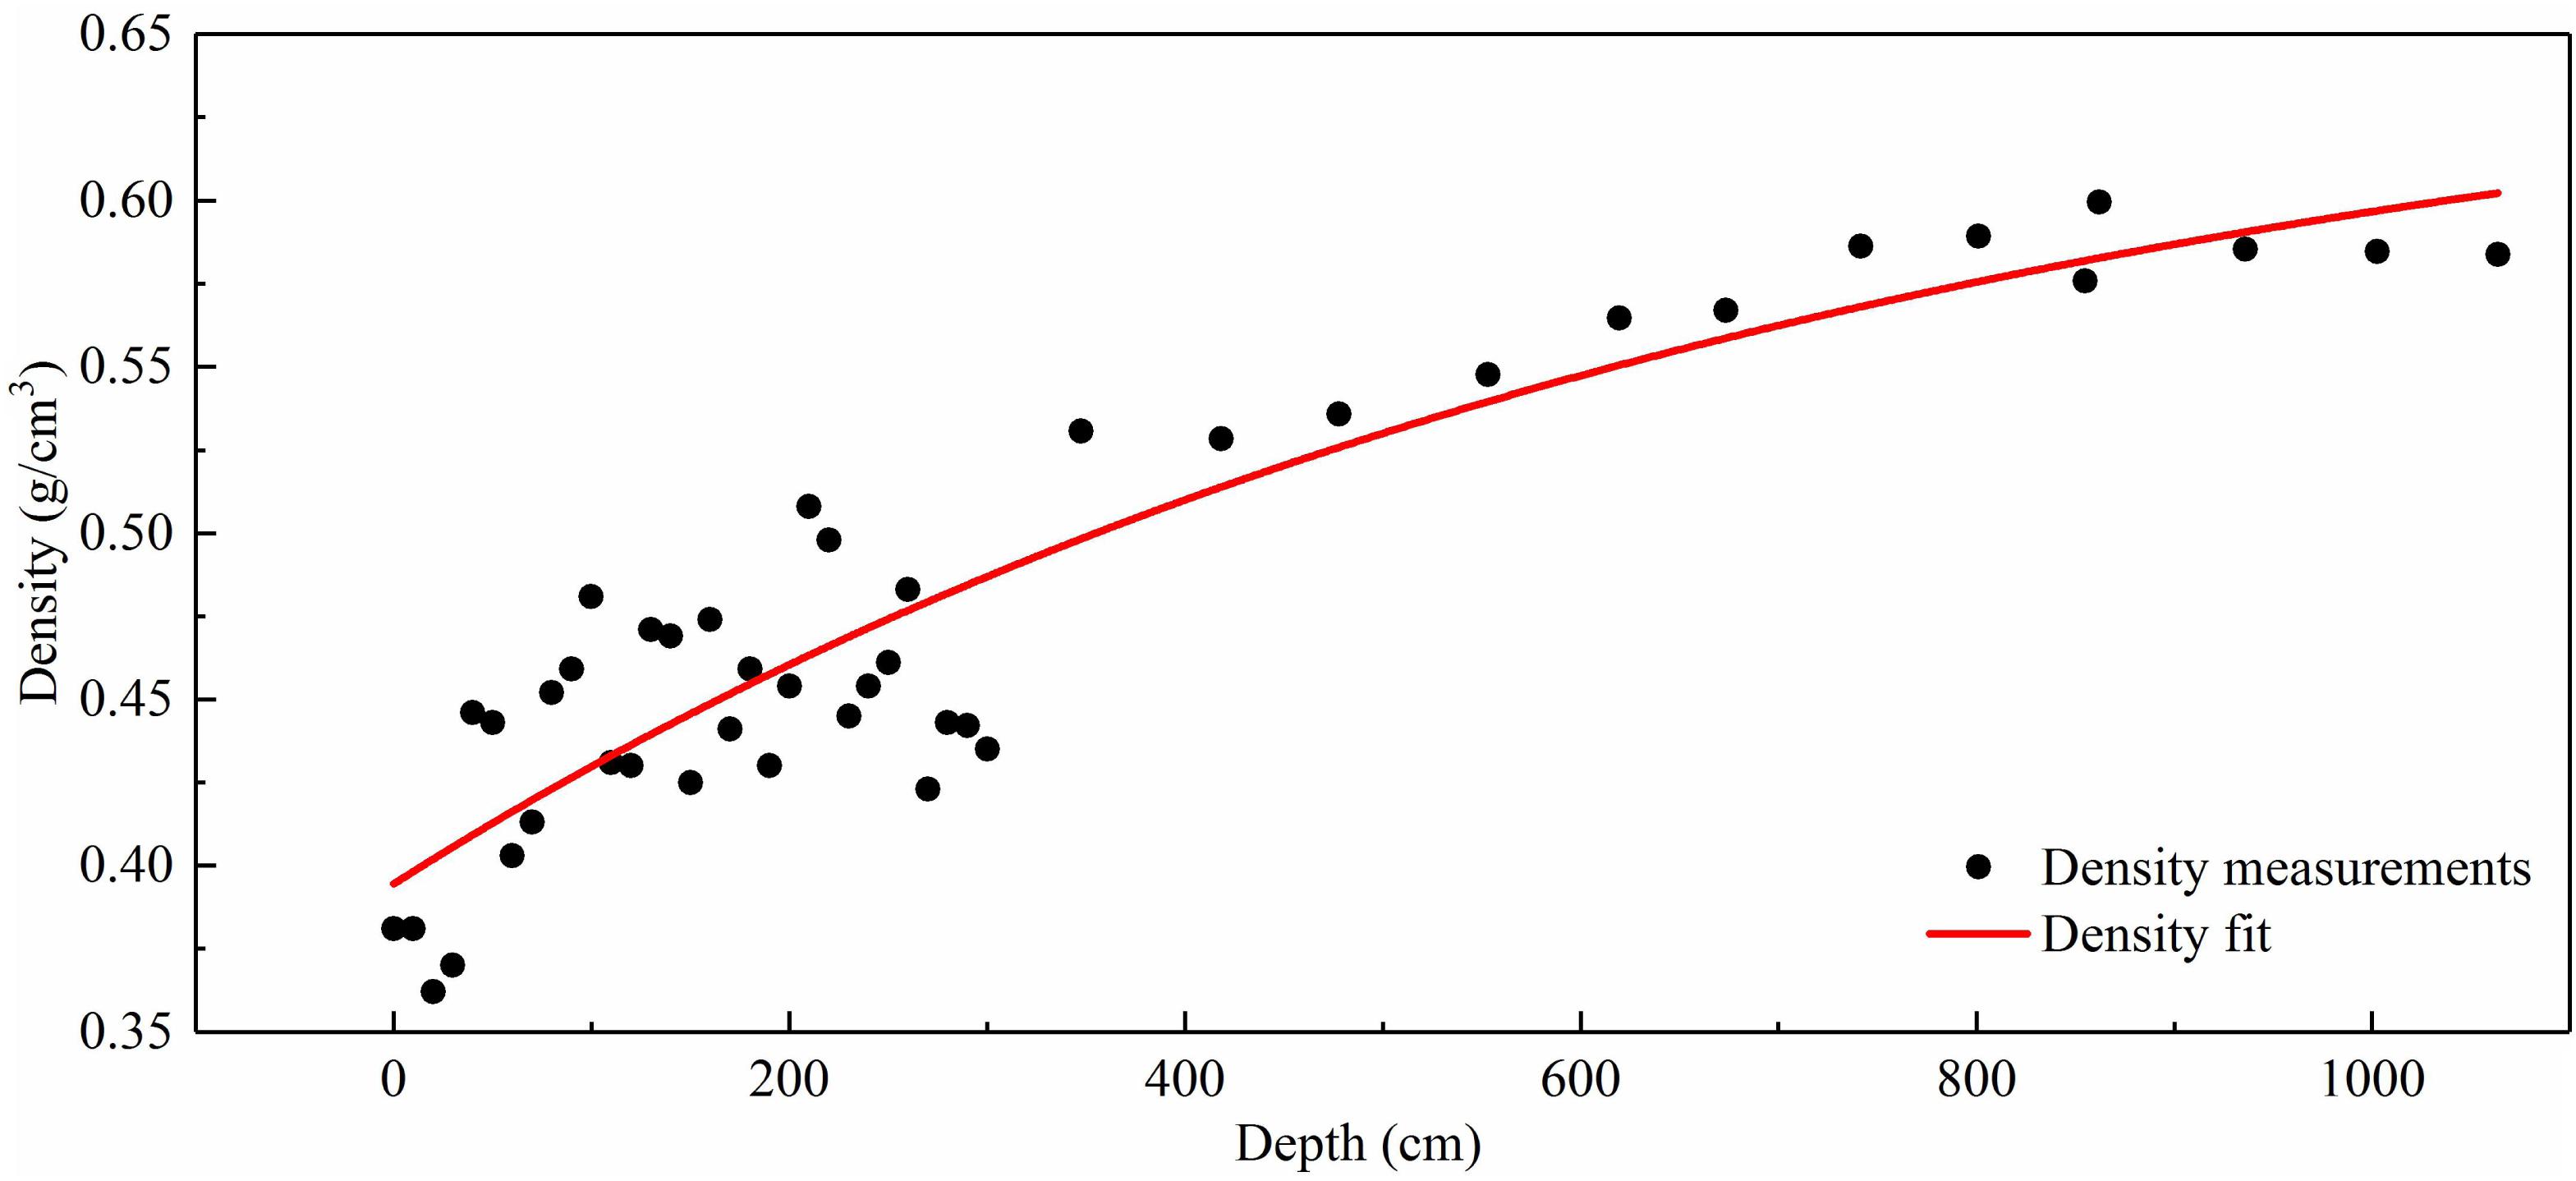
Figure 8. Snow density profile of Taishan Station from a 10 m shallow snow core.
where ρ is the snow (firn) density at depth z, ρi is the pure ice density, and ρs is the snow density at the surface. According to the fitting curve, it can be seen that the density shows an exponential change with depth. The density fluctuation range of the 10 m snow core is 0.35–0.60 g cm–3, and the surface snow density at Taishan Station is 0.381 g cm–3.
Previous studies have suggested one (ρ = 0.55 g cm–3) or even two (ρ = 0.83 g cm–3) critical values to proclaim different densification processes that occur in the snow column (Salamatin and Lipenkov, 2008). In the upper part (ρ < 0.55 g cm–3), the dominant densification processes are the grain settling and packing of snow grains. Thereafter, the densification process is slower and is mainly due to sublimation, diffusion and deformation processes until the density reaches the pore close-off depth (ρ = 0.83 g cm–3). From Figure 8, we can conclude that the depth corresponding to the first critical value of ice density in Taishan Station is 5.8 m. This result is similar to that shown in the simulation results (Ligtenberg et al., 2011).
From the characteristics of the snow profile, the composition of the 10 m snow core has experienced the transition from firn (wind panels) to fine snow, hard fine snow, medium snow, coarse snow, and then snow with an ice lens from top to bottom. The snow profile of Taishan Station is more complex and the hardness of the snow is greater than at other sampling points.
Meteorological Conditions
From February 2016 to February 2017, an Automatic Weather Station (AWS) was operational at Taishan Station. Figure 9 shows the monthly variation in the average wind speed observed from the AWS. It can be seen that the maximum monthly average wind speed occurs in June, up to 13.1 m s–1, and the minimum of monthly average wind speed occurs in January, up to 7.1 m s–1. The annual average wind speed of Taishan Station is about 11 m s–1. It is clear that there are notable seasonal changes in wind speed at Taishan Station, and the wind speed in winter is significantly higher than that in summer.
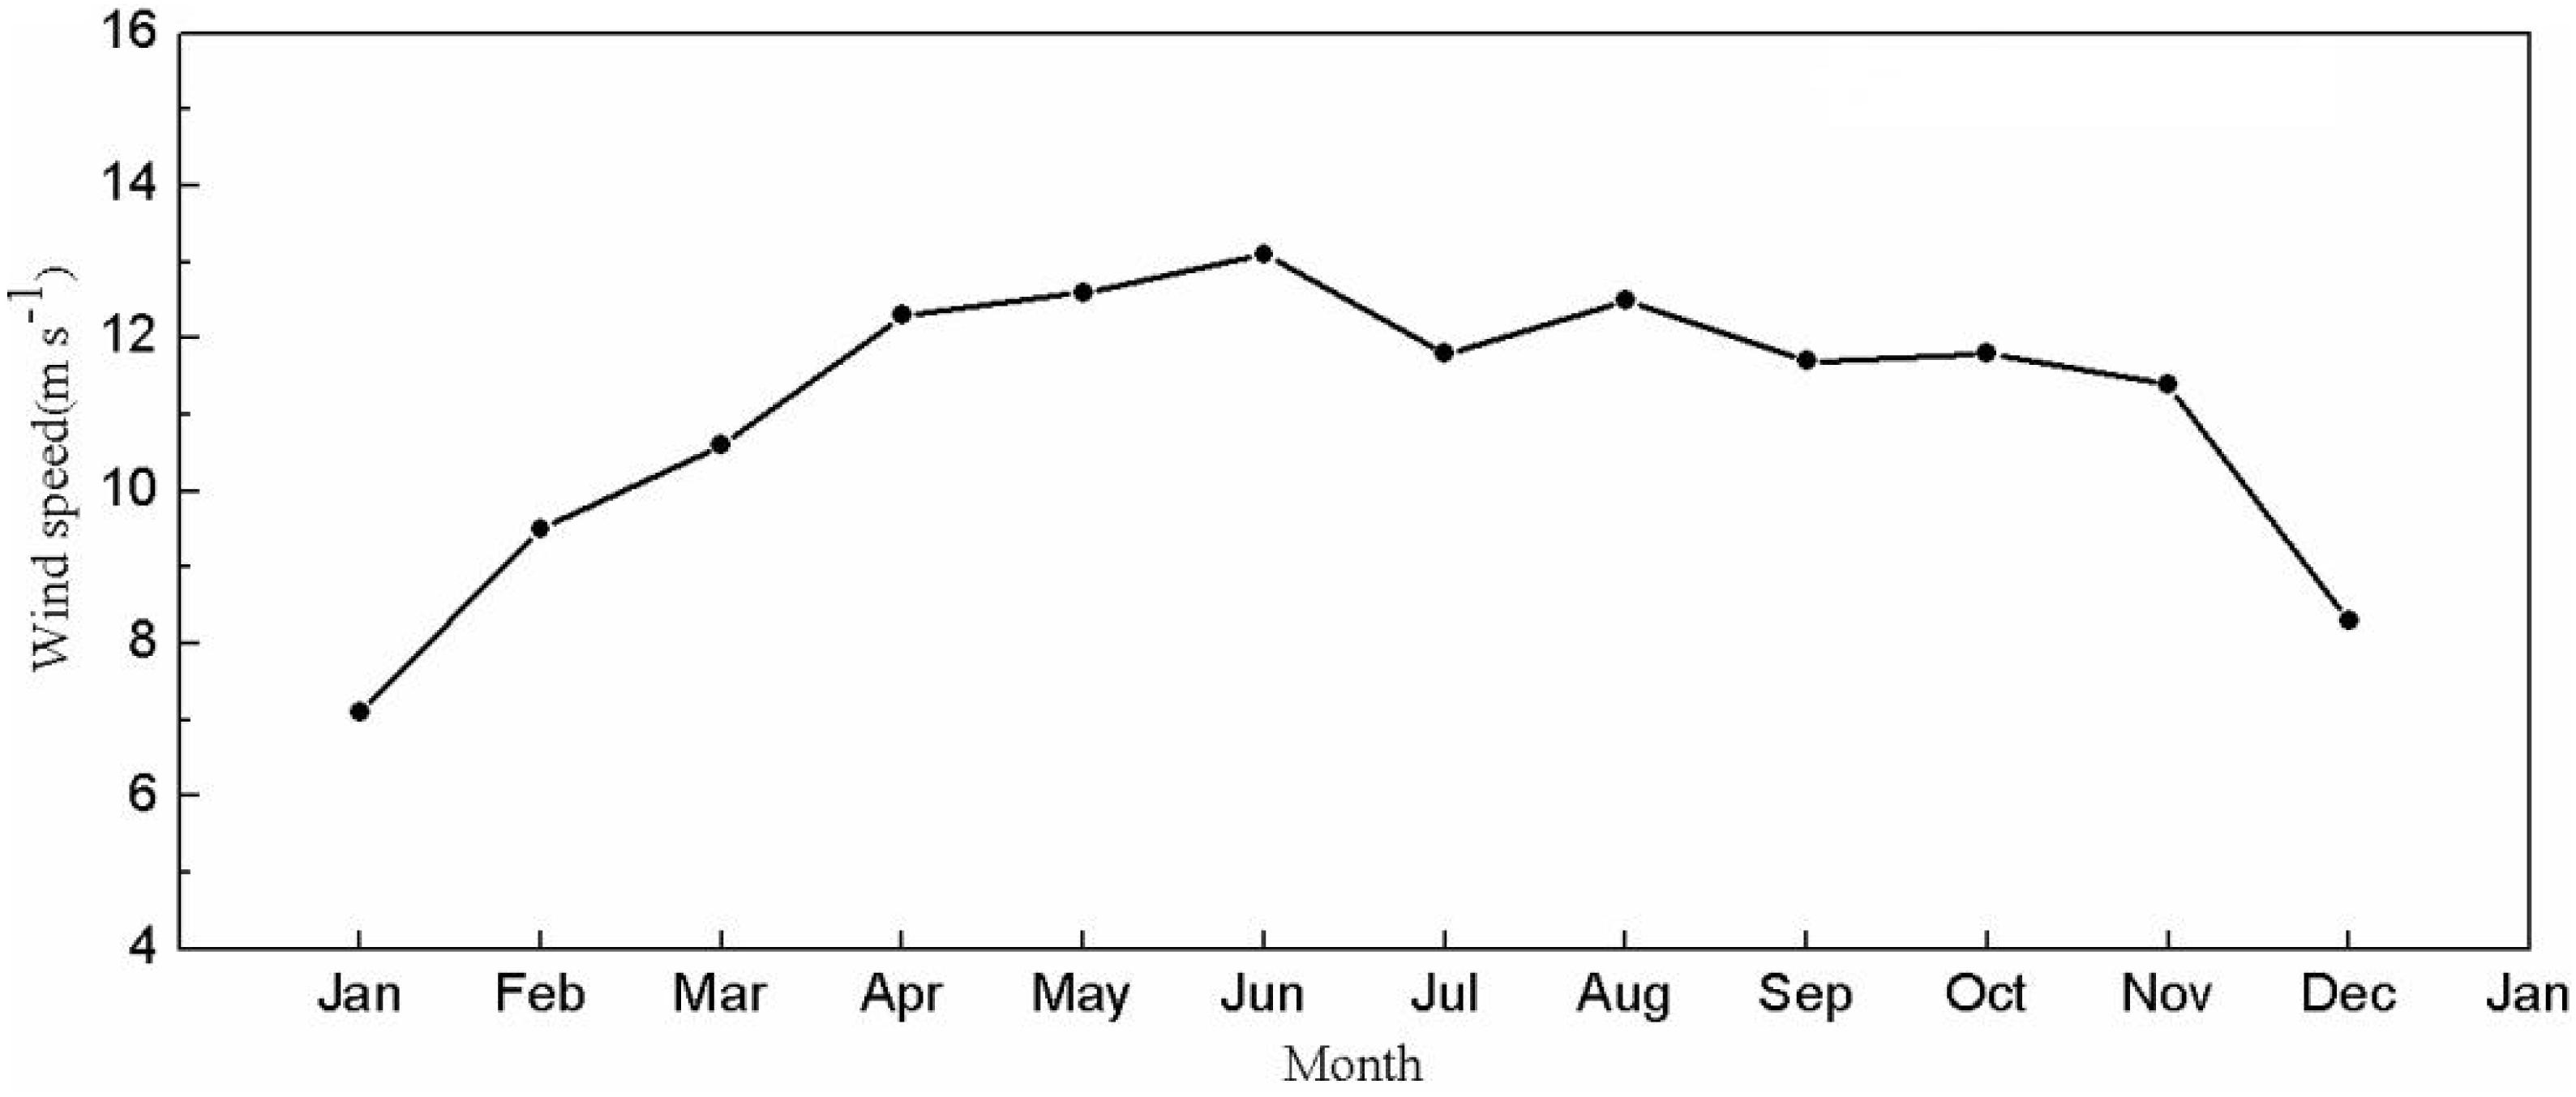
Figure 9. Monthly variation of the average wind speed at Taishan Station from an Automatic Weather Station at Taishan Station from February 2016 to February 2017.
Figure 10 shows the frequency of the average wind direction at Taishan Station. The dominant wind direction at Taishan Station is east with a frequency of 60.37%. The secondary wind directions are north-east and east-north-east winds, accounting for 22.64 and 3.77%, respectively. The wind direction is relatively concentrated, and the frequency of easterly winds can reach 86.78% of the total.
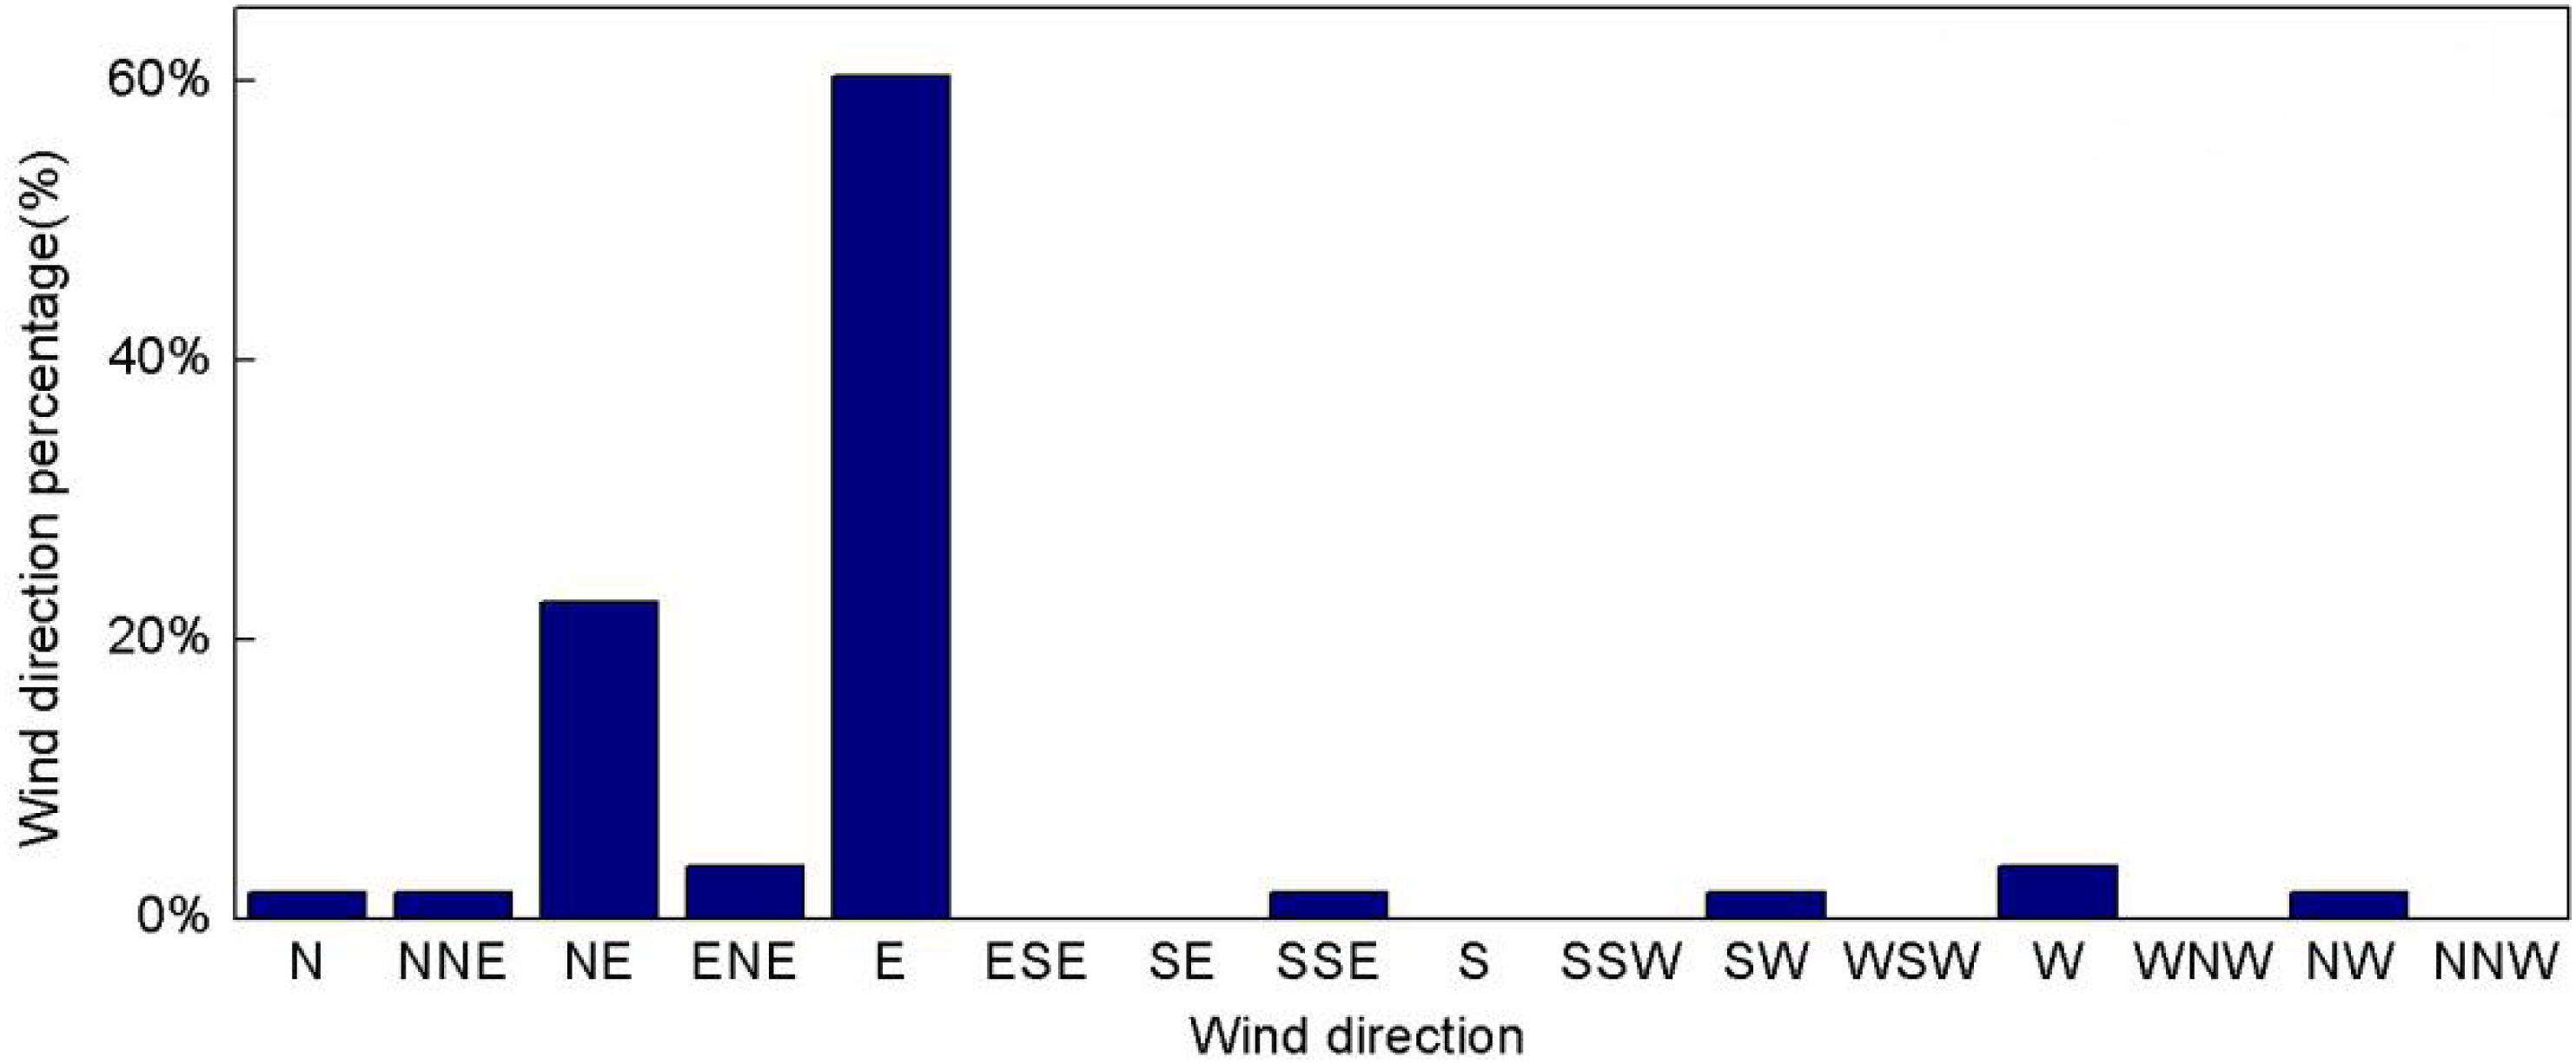
Figure 10. Frequencies of the average wind direction at Taishan Station.
Rose diagrams of the wind direction at Taishan Station are shown against both wind direction and wind speed in Figure 11. Figure 11A shows the wind direction in January, and Figure 11B shows the wind direction in July. It can be seen that the main wind force is at levels 3–5 (Beauford scale) in January, accounting for nearly 80% of the wind force. The frequency of wind force at levels 1–5 is close to 90%, and the lower wind speed is conducive to the safety of summer observations at Taishan Station.
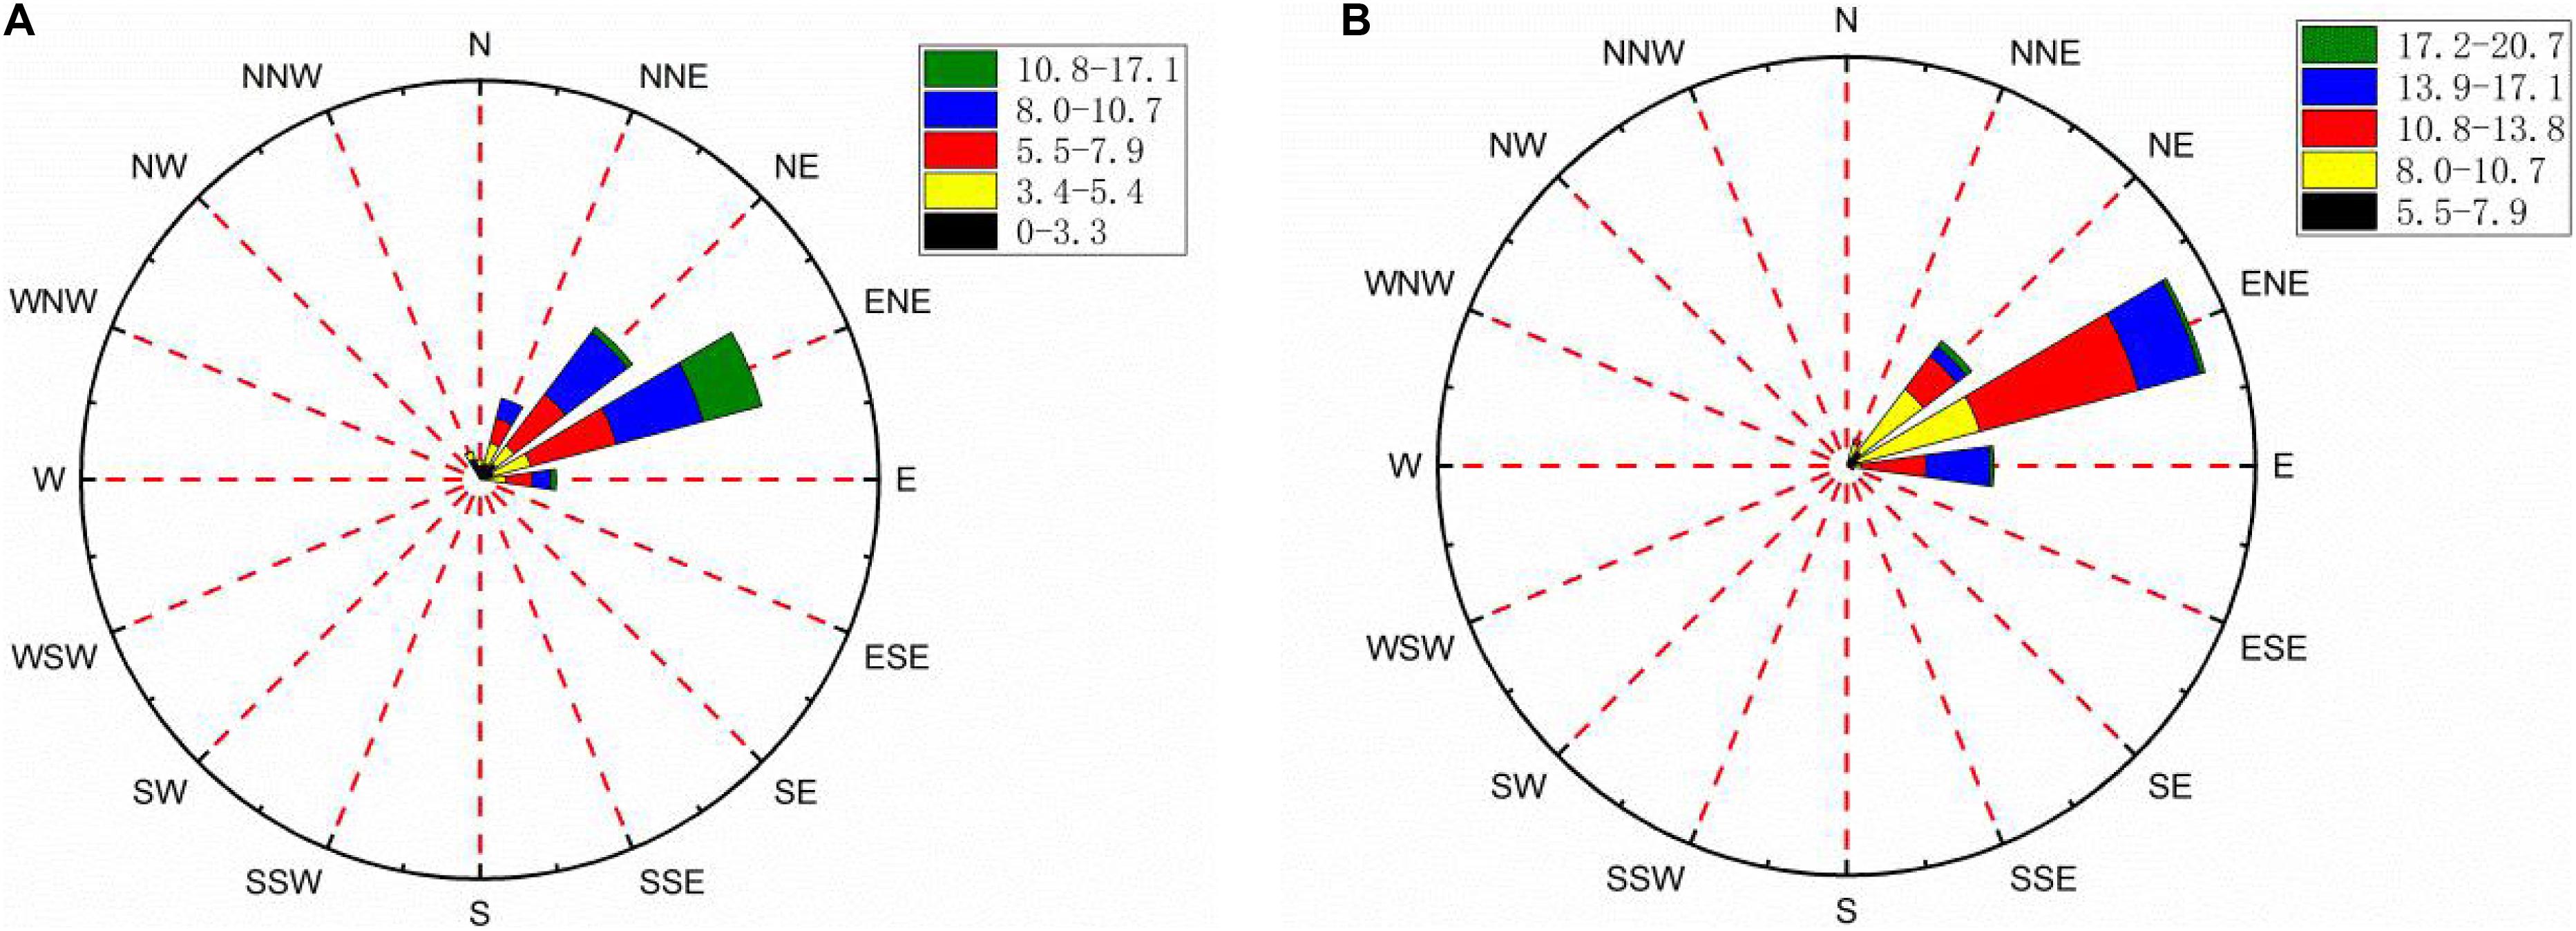
Figure 11. Seasonal variation of wind speed (Unit: m s–1) and wind direction from the Automatic Weather Station at Taishan Station, (A) January 2016, (B) July 2016.
In July, the main wind force is at levels 5–7, accounting for more than 90% of the wind force. It is difficult to work outdoors in such windy weather. Wind speeds are significantly different in winter and summer, and the wind force in January (Southern hemisphere summer) is significantly lower than that in July (Southern hemisphere winter). The seasonal difference in wind speed at Taishan Station may be related to its positioning as a summer scientific expedition station.
In January, the dominant wind direction at Taishan Station is east-north-east winds, with a frequency of 41.99%. The secondary wind directions are north-east winds and north-east-north winds. The sum of these three wind directions can reach 81.70% of the total. In July, the dominant wind direction at Taishan Station is also east-north-east winds with a frequency of 60.37%. The secondary wind directions are north-east winds and east winds. The sum of these three wind directions can reach 94.89% of the total. The distribution of the wind direction in July is relatively concentrated; the frequency of east winds in July increases significantly compared with that in January, and the wind direction in July has an obvious shift toward east relative to that in January. This is similar to the conclusion reached by Yang et al. (2007) at the LGB69 station (70°50′S, 77°04′E) in East Antarctica. Strong winds can carry a large amount of surface snow, and the stability of the wind direction determines the surface topography, which has a great influence on the credibility of local observation.
The annual average wind direction stability of Taishan Station is 0.89, which is higher than that of 0.78 in Dome A, which is related to the slope of Taishan Station being higher than that of Dome A (Ma et al., 2010). The large wind direction stability appears in the strong descending wind area with a large surface slope. In general, the wind at Taishan Station is obviously affected by the katabatic wind, and the wind direction is prevailing easterly winds. The observations of wind speed and wind direction provide a theoretical support for further analysis of the replenishment capacity at Taishan Station.
The spatial pattern of the surface pressure shows minimum values over the plateau of East Antarctica and maximum values over the Ross Sea (Figure 12A). The spatial pattern is mainly attributed to the Antarctic topography. The surface pressure at Taishan Station is approximately 700 hPa. In contrast to the surface pressure, the mean sea level pressure (MSLP) can reflect the realistic surface circulation. A high-pressure ridge occurs over the plateau of East Antarctica where the maximum value exceeds 1025 hPa (Figure 12B). Two low pressure troughs occur over the Amundsen Sea and the Southern Indian Ocean (120°E). The former usually corresponds to an Amundsen low. Taishan Station has a MSLP of 1000 hPa. Corresponding to the high pressure over East Antarctica, the surface wind field here shows a large anticyclonic circulation (Figure 12C). The steep topography over coastal regions drives a strong katabatic wind. The anticyclonic circulation enables the prevailing wind at Taishan Station to be an easterly wind. The surface air temperature over the Antarctic continent shows a similar pattern to the topography (Figure 12D). Namely, the higher terrain corresponds to the lower temperature and vice versa. The surface air temperature at Taishan Station is nearly 250 K (−23°C), which is apparently higher than the observational value (−36°C). It indicates that the reanalysis data overestimate the surface air temperature at Taishan Station.
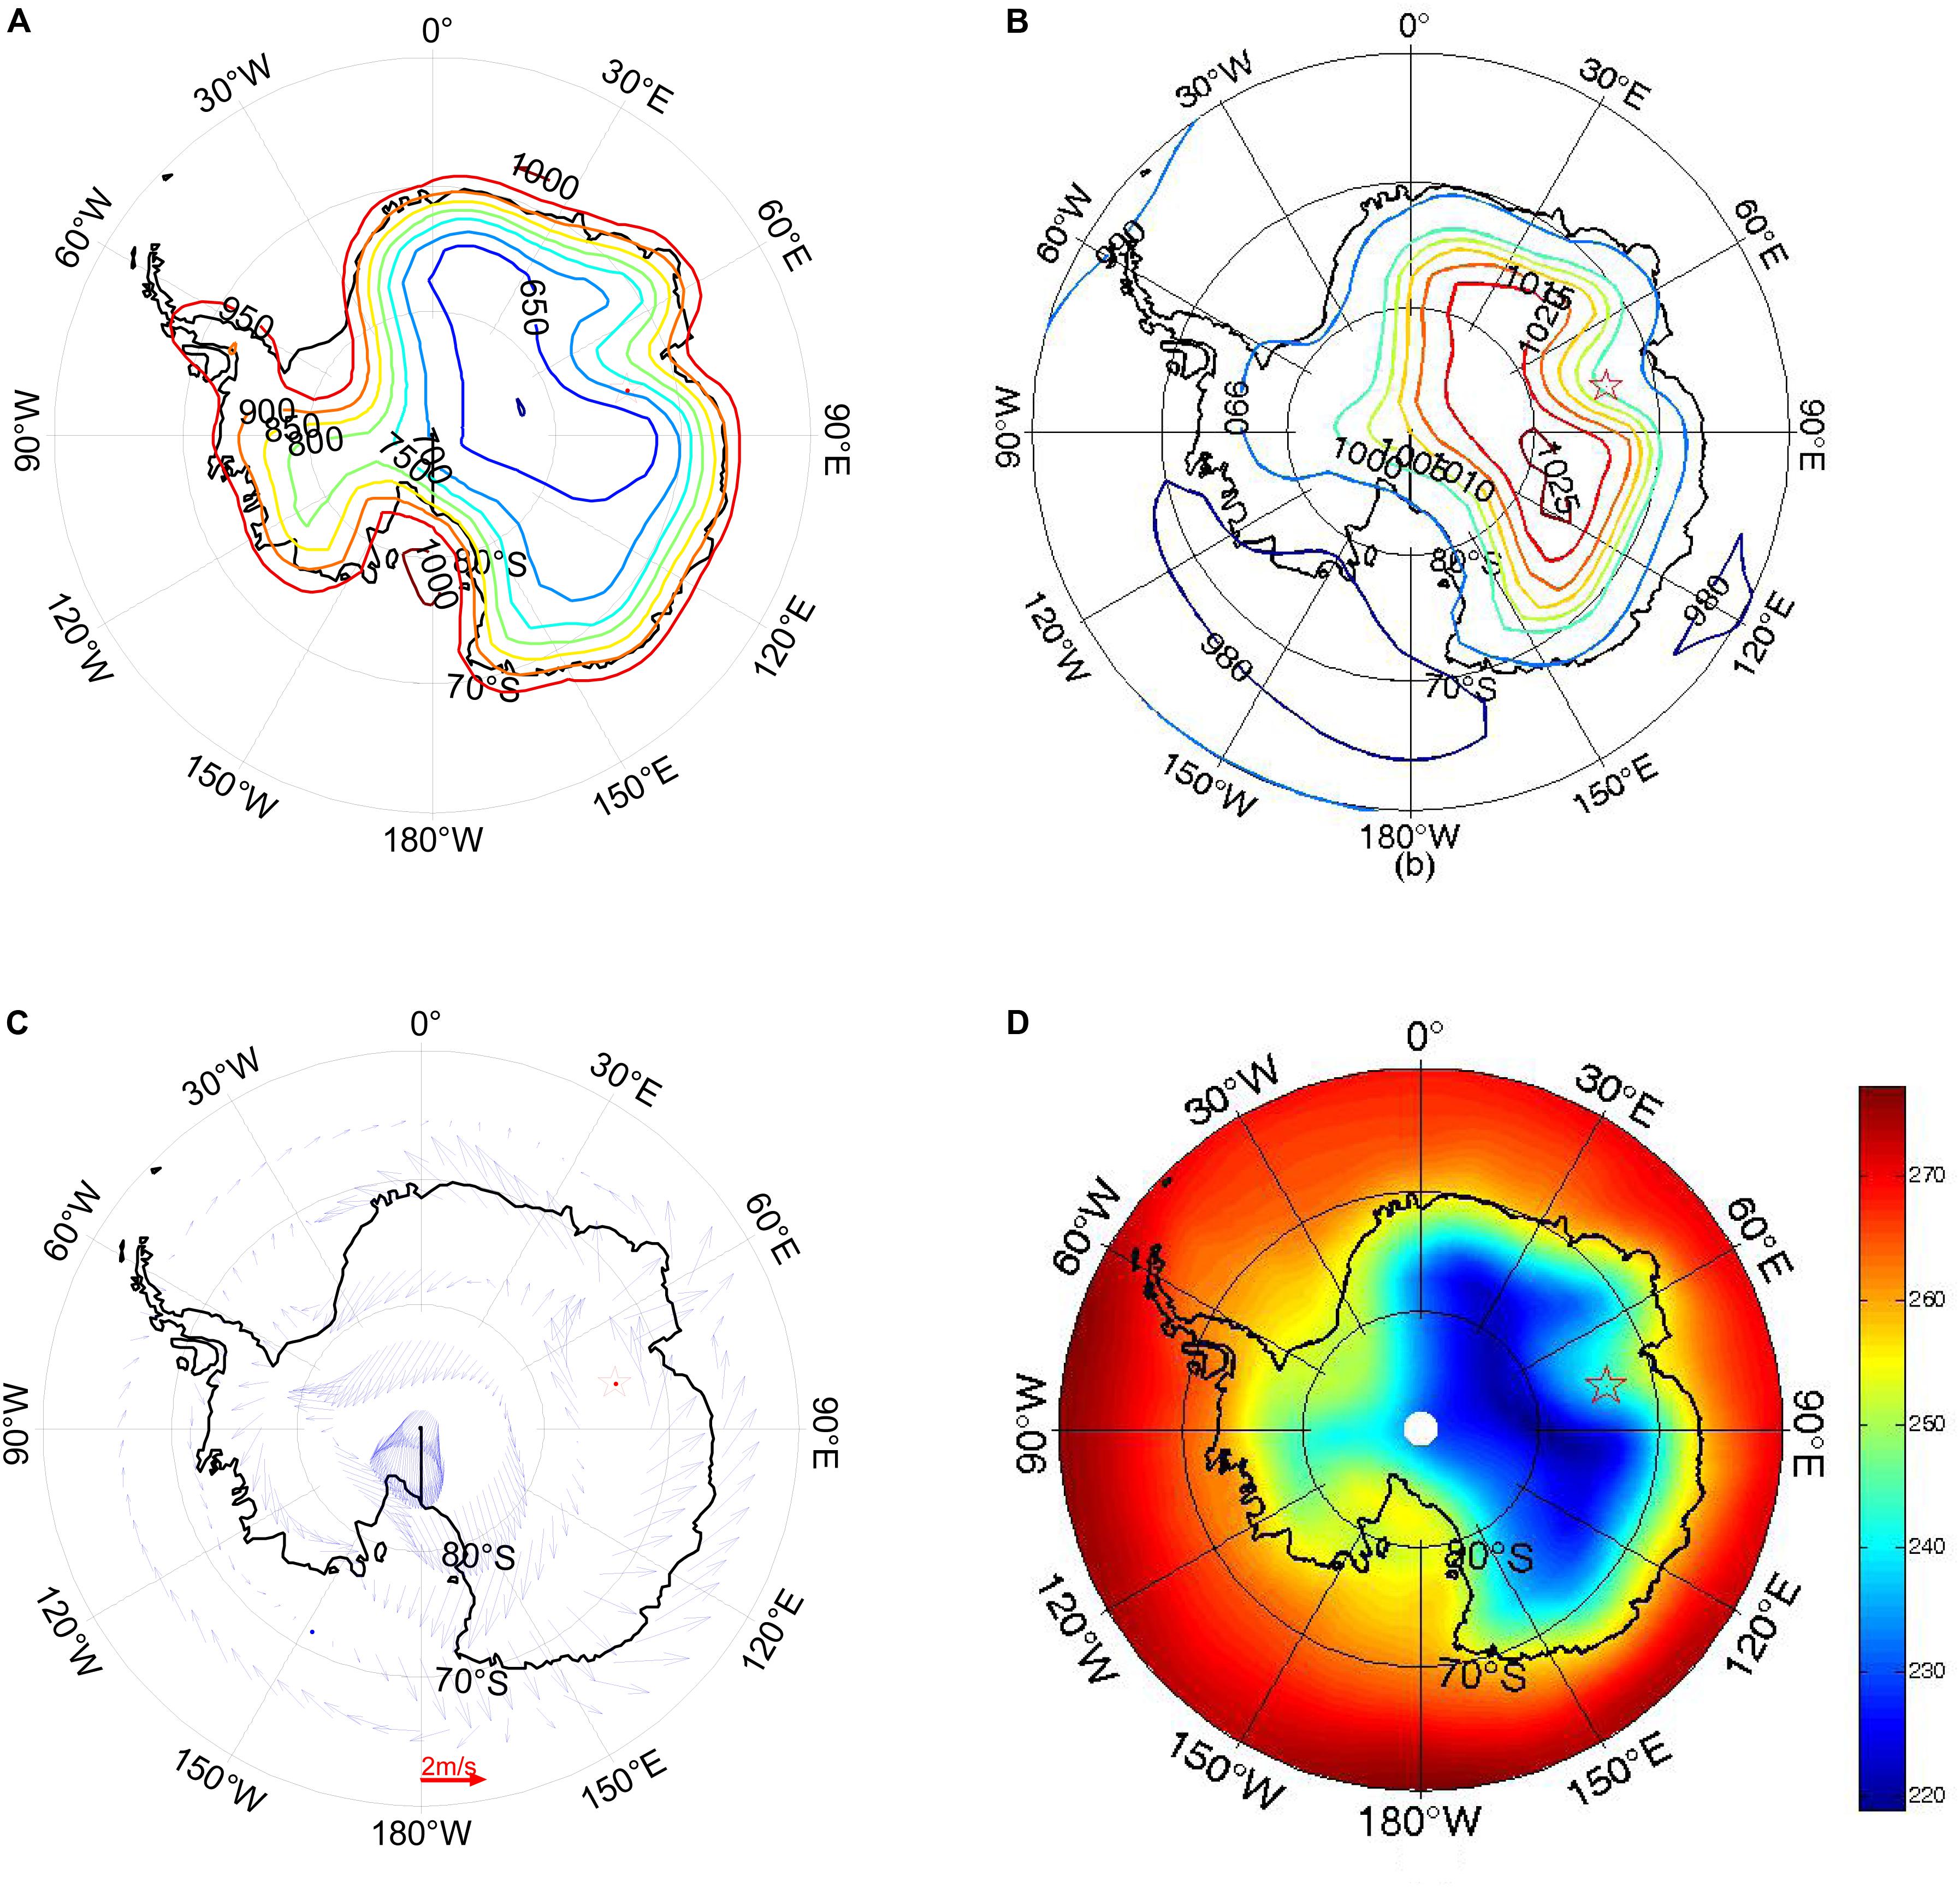
Figure 12. (A) Spatial patterns of the averaged surface pressure (Unit: hpa), (B) mean sea level pressure (Unit: hpa), (C) 10 m wind field, and (D) 2 m air temperature (Unit: K). The asterisk denotes the site of Taishan Station. All data are derived from the National Center for Environmental Prediction (NCEP)-DOE (Department of Energy) Reanalysis II dataset (ftp.cdc.noaa.gov/Projects/Datasets/necp.reanalysis2.derived/).
Snow Isotopes
The stable isotopes of water (δD and δ18O) are important climate proxies that are commonly interpreted in terms of temperature. The measured results from the surface snow along a section from Zhongshan Station to Dome A during the 31st CHINARE show that the spatial variation range of δ18O at Taishan Station is around −35 to −45‰, and the δD variation range is −260 to −360‰ (Ma et al., 2017). The δD record exhibits detectable seasonal cycles through ice core, providing a method to obtain a timescale by annual layer counting. Nitrate (NO3–) is one of the main chemical ions in Antarctic snow ice, which can account for more than 40% of the total ions in snow ice. The isotopic fractionation associated with nitrate volatilization at Taishan Station was minor. The snow mass, concentration, and isotopic composition of NO3– (δ15N and δ18O) near the site are constant during a 16-day experiment, and volatilization of NO 3– is estimated to decrease δ15 N and δ18 O in the snowpit by 0–3‰ and 0–6‰, respectively (Shi et al., 2019).
Conclusion
We conducted an integrated glaciological and meteorological investigation around the site of the Chinese Antarctic Taishan Station, focusing on the potential deep ice core drilling and supporting field activities in the East Antarctic plateau. We deduced the surface mass balance and ice velocity from the published data and derived the surface topography, ice thickness, internal layers and bed topography from radar data. The age control and englacial temperature from the internal layers seen in the radar data and ice modeling suggested a range of 50–150 kyr (kiloyear) and no melting over the basal ice. The internal layer structure also indicated that the ice around the Taishan Station site has been stable, with smaller undulations and disturbances at the shallower depth. The stratigraphical character of the internal layers offers an outstanding opportunity to improve our understanding of ice dynamics and to accurately infer the ice sheet history with the accompanying climatic change.
The snow temperature at the depth of 10 m was determined to be −35.5°C from a 10 m temperature chain, which can provide an estimate of the mean annual air temperature at the surface. The 10 m snow density profiles showed that different densification processes occur in the snow column. The annual average wind speed of Taishan Station is about 11 m s–1 from an AWS, and the wind direction is relatively concentrated and can redistribute the surface snow. The atmospheric reanalysis data showed that the site has a prevailing easterly wind and is sensitive to the strong katabatic wind over coastal regions. Furthermore, the surface air temperature around the station showed a similar pattern to the topography.
A significant way of selecting drilling locations is to trace the continuous internal layers along the radar profiles. Of interest in site selection is the smoothness of continuous internal layers and the geometric lengths of ice column (Tang et al., 2012). The properties that internal layers are relatively stable and conformal with bed topography and that the site has an ice thickness of 1,900 m suggest that Taishan Station may be a good location for drilling older and undisturbed ice. A deep ice core at Taishan Station would be expected to improve our understanding of past East Antarctic climate. It would be a better complement to the existing records (e.g., Dome A, Dome Fuji, Dome C) from the East Antarctic ice sheet. Taishan Station is considered as ideal logistical base because of the uniqueness of its location and glacio-meteorological conditions. Taishan Station can provide strong support for proposed ground-based and airborne investigations in the Antarctic ice sheet (e.g., Grove Mountains, Dome A, Ridge B, and Vostok, etc.). In fact, CHINARE has used Taishan station as its logistics base to investigate a large-scale area from the coastal to the interior of the East Antarctic ice sheet, including Prydz Bay, Amery Ice Shelf, Grove Mountains, Princess Elizabeth Land, Ridge B, Vostok and Dome A (Cui et al., 2018). Our study is potentially valuable for an ice dynamics investigation associated with the East Antarctic ice sheet in response to sea level and climate forcing.
Potential climate proxy data from ice cores at the Taishan Station site would be helpful for understanding changes in the East Antarctic climate variability and may provide new information for the evolution of the Antarctic ice sheet. In the future, to date the ice column of Taishan Station, it will be necessary to obtain a more continuous and direct stratigraphic link between the site and the Antarctic ice cores. However, our radar surveys failed to detect some deeper layers, possibly because the ice stream of Lambert glacier flowing into the Amery ice shelf disturbs the deeper layers and removes the surface troughs and their effects, affecting the layer geometries as the ice flows over them. It requires additional ground-based or airborne geophysical observations and modeling studies to aid in englacial structure mapping and determination of ice–bedrock interactions in the vicinity of Taishan Station. Additional glaciological and meteorological data on the present and past environment are also needed to evaluate the field work around the site.
Data Availability Statement
All the data presented in the paper are available for scientific purposes upon request to the corresponding author (XT, dGFuZ3h1ZXl1YW5AcHJpYy5vcmcuY24=).
Author Contributions
XT: methodology and formal analysis. XT and YZ: software. XT, YD, and JG: validation. XT, JG, XC, LL, SZ, and BS: resources. XT, YZ, SC, KL, and LY: writing – original draft preparation. XT, YZ, SC, and KL: writing – review and editing. XT, YD, and BS: supervision. All authors contributed to the article and approved the submitted version.
Funding
This study was supported by the National Natural Science Foundation of China (Nos. 41876230, 41876227, 41941006, and 41776199) and the Chinese Polar Environmental Comprehensive Investigation and Assessment Programs (CHIANRE 2017-01-01).
Conflict of Interest
The authors declare that the research was conducted in the absence of any commercial or financial relationships that could be construed as a potential conflict of interest.
Acknowledgments
We thank the Chinese National Antarctic Research Expedition for their help in the field data collection, an English editor of MDPI for improving the language of this text, and Richard C. Hindmarsh for providing the ice model.
References
Cavitte, M. G., Blankenship, D. D., Young, D. A., Schroeder, D. M., Parrenin, F., Lemeur, E., et al. (2016). Deep radiostratigraphy of the East Antarctic plateau: connecting the Dome C and Vostok ice core sites. J. Glaciol. 62, 323–334. doi: 10.1017/jog.2016.11
Chen, B., Zhang, R., Xiao, C., Bian, L., and Zhang, T. (2010). Analyses on the air and snow temperatures near ground with observations of an AWS at Dome A, the summit of Antarctic Plateau. Chin. Sci. Bull. 55, 1430–1436. doi: 10.1007/s11434-010-0099-1
Cuffey, K. M., and Paterson, W. S. (2010). The Physics of Glaciers. Cambridge, MA: Academic Press, doi: 10.1063/1.2915138
Cui, X., Greenbaum, J. S., Beem, L. H., Guo, J., Gregory, N. G., Li, L., et al. (2018). The First Fixed-wing Aircraft for Chinese Antarctic Expeditions: Airframe modifications. Scientific Instrumentation and Applications. J. Environ. Eng. Geophys. 23, 1–13. doi: 10.2113/JEEG23.1.1
Cui, X., Sun, B., Tian, G., Tang, X., Zhang, X., Jiang, Y., et al. (2010). Preliminary results of ice radar investigation along the traverse between Zhongshan and Dome A in East Antarctic ice sheet: Ice thickness and subglacial topography. Chin. Sci. Bull. 55, 2715–2722. doi: 10.1007/s11434-010-3238-9
Ding, M., Xiao, C., Jin, B., Ren, J., Qin, D., and Sun, W. (2010). Distribution of δ 18 O in surface snow along a transect from Zhongshan Station to Dome A. East Antarctica. Chin. Sci. Bull. 55, 2709–2714. doi: 10.1007/s11434-010-3179-3
Ding, M., Xiao, C., Li, C., Qin, D., Jin, B., Shi, G., et al. (2015). Surface mass balance and its climate significance from the coast to Dome A. East Antarctica. Sci. China Earth Sci. 58, 1787–1797. doi: 10.1007/s11430-015-5083-9
Ding, M., Xiao, C., Li, Y., Ren, J., Hou, S., Jin, B., et al. (2011). Spatial variability of surface mass balance along a traverse route from Zhongshan station to Dome A. Antarctica. J. Glaciol. 57, 658–666. doi: 10.3189/002214311797409820
Fretwell, P. T., Pritchard, H. D., Vaughan, D. G., Bamber, J. L., Barrand, N. E., Bell, R. E., et al. (2013). Bedmap2: Improved ice bed, surface and thickness datasets for Antarctica. Cryosphere 7, 375–393. doi: 10.5194/tc-7-375-2013
Glen, J. W. (1952). Experiments on the deformation of ice. J. Glaciol. 2, 111–114. doi: 10.1017/S0022143000034067
Greene, C. A., Gwyther, D. E., and Blankenship, D. D. (2017). Antarctic Mapping Tools for Matlab. Computers Geosci. 104, 151–157. doi: 10.1016/j.cageo.2016.08.003
Huybrechts, P., and Payne, T. (1996). The EISMINT benchmarks for testing ice-sheet models. Ann. Glaciol. 23, 1–12. doi: 10.1017/S0260305500013197
Li, C., Kang, S., Shi, G., Huang, J., Ding, M., Zhang, Q., et al. (2014). Spatial and temporal variations of total mercury in Antarctic snow along the transect from Zhongshan Station to Dome A. Tellus B Chem. Phys. Meteorol. 66:25152. doi: 10.3402/tellusb.v66.25152
Li, C., Ren, J., Qin, D., Xiao, C., Hou, S., Li, Y., et al. (2013). Factors controlling the nitrate in the DT-401 ice core in eastern Antarctica. Sci. China Earth Sci. 56, 1531–1539. doi: 10.1007/s11430-012-8888-9
Li, Y., Cole-Dai, J., and Zhou, L. (2009). Glaciochemical evidence in an East Antarctica ice core of a recent (AD 1450–1850) neoglacial episode. J. Geophys. Res. 114:D08117. doi: 10.1029/2008jd011091
Ligtenberg, S. R. M., Helsen, M. M., and Van Den Broeke, M. R. (2011). An improved semi-empirical model for the densification of Antarctic firn. Cryosphere 5, 809–819. doi: 10.5194/tc-5-809-2011
Liu, X., Lang, S., Zhao, B., Zhang, F., Liu, Q., Tang, C., et al. (2018). High-resolution ice-sounding radar measurements of ice thickness over East Antarctic Ice Sheet as a part of Chinese National Antarctic Research Expedition. IEEE Trans. Geosci. Remote Sens. 56, 3657–3666. doi: 10.1109/TGRS.2018.2804384
Ma, T., Xie, Z., Li, Y., An, C., Shi, G., Yu, J., et al. (2017). The spatial changes and impact factors of water stable isotope in surface snow along Zhongshan Station-Dome A. Chin. J. Polar Res. 29, 210–217.
Ma, Y., Bian, L., Xiao, C., Allison, I., and Zhou, X. (2010). Near surface climate of the traverse route from Zhongshan Station to Dome A. East Antarctica. Antarct. Sci. 22, 443–459. doi: 10.1017/s0954102010000209
Meredith, M., Sommerkorn, M., Cassotta, S., Derksen, C., Ekaykin, A., Hollowed, G., et al. (2019). “Polar Regions,” in: IPCC Special Report on the Ocean and Cryosphere in a Changing Climate, eds H.-O. Pörtner et al. (Geneva: IPCC)
Parrenin, F., Dreyfus, G., Durand, G., Fujita, S., Gagliardini, O., Gillet, F., et al. (2007). 1-D-ice flow modelling at EPICA Dome C and Dome Fuji, East Antarctica. Clim. Past. 3, 243–259. doi: 10.5194/cp-3-243-2007
Qin, D. (1987). The densification process of snow in the surface layer of the Antarctic ice sheet. J. Glaciol. Geocryol. 9, 190–204.
Qin, D., Ren, J., Kang, J., Xiao, C., Li, Z., Li, Y., et al. (2000). Primary results of glaciological studies along an 1100 km transect from Zhongshan station to Dome A, East Antarctic ice sheet. Ann. Glaciol. 31, 198–204. doi: 10.3189/172756400781819860
Raymond, C. F. (1983). Deformation in the vicinity of ice divides. J. Glaciol. 29, 357–373. doi: 10.1017/S0022143000030288
Reeh, N. (1988). A flow-line model for calculating the surface profile and the velocity, strain-rate, and stress fields in an ice sheet. J. Glaciol. 34, 46–55. doi: 10.3189/s0022143000009059
Ren, J., Qin, D., and Xiao, C. (2001). Preliminary results of the inland expeditions along a transect from the Zhongshan Station to Dome A, East Antarctica. J. Glaciol. Geocryol. 23, 51–56.
Rignot, E., Mouginot, J., and Scheuchl, B. (2011). MEaSUREs InSAR-Based Antarctica Ice Velocity Map. Boulder, CL: NASA DAAC at the National Snow and Ice Data Center, doi: 10.5067/MEASURES/CRYOSPHERE/nsidc-0484.001
Salamatin, A., and Lipenkov, V. (2008). Simple relations for the close-off depth and age in dry-snow densification. Ann. Glaciol. 49, 71–76. doi: 10.3189/172756408787814889
Shepherd, A., Ivins, E., Rignot, E., Smith, B., Van Den Broeke, M., Velicogna, I., et al. (2018). Mass balance of the Antarctic Ice Sheet from 1992 to 2017. Nature 558, 219–222. doi: 10.1038/s41586-018-0179-y
Shi, G., Chai, J., Zhu, Z., Hu, Z., Chen, Z., Yu, J., et al. (2019). Isotope fractionation of nitrate during volatilization in snow: a field investigation in Antarctica. Geophys. Res. Lett. 46, 3287–3297. doi: 10.1029/2019GL081968
Tang, X., Sun, B., Li, Y., Li, X., and Cui, X. (2012). Dome Argus: ideal site for deep ice drilling. Adv. Polar Sci. 23, 47–54. doi: 10.3724/SP.J.1085.2012.00047
Tang, X., Sun, B., Zhang, Z., Zhang, X., Cui, X., and Li, X. (2011). Structure of the internal isochronous layers at Dome A, East Antarctica. Sci. China Earth Sci. 54, 445–450. doi: 10.1007/s11430-010-4065-1
Tang, X. Y., Guo, J. X., Sun, B., Wang, T. T., and Cui, X. B. (2016). Ice thickness, internal layers, and surface and subglacial topography in the vicinity of Chinese Antarctic Taishan station in Princess Elizabeth Land. East Antarctica. Appl. Geophys. 13, 203–208. doi: 10.1007/s11770-016-0540-6
Van Liefferinge, B. V., and Pattyn, F. (2013). Using ice-flow models to evaluate potential sites of million year-old ice in Antarctica. Clim. Past 9, 2335–2345. doi: 10.5194/cp-9-2335-2013
Wu, X., Tian, Q., Jin, X., Jiang, P., Qing, C., Cai, J., et al. (2017). Estimating optical turbulence of atmospheric surface layer at Antarctic Taishan station from meteorological data. Acta Phys. Sin. 66, 380–388. doi: 10.7498/aps.66.039201
Yang, Q., Yin, T., Zhang, L., and Jiang, D. (2007). Analyses of surface winds along the track from Zhongshan Station to Dome A, Antarctica. Chin. J. Polar Res. 19, 295–304.
Zhang, S., Eaa, D., Wang, Z., Li, Y., Jin, B., and Zhou, C. (2008). Ice velocity from static GPS observations along the transect from Zhongshan station to Dome A, East Antarctica. Ann. Glaciol. 48, 113–118. doi: 10.3189/172756408784700716
Keywords: Chinese Taishan Station, glaciological and meteorological conditions, internal layer, mass balance, age-depth profile
Citation: Tang X, Guo J, Dou Y, Zhang Y, Cheng S, Luo K, Yu L, Cui X, Li L, Zhang S and Sun B (2020) Glaciological and Meteorological Conditions at the Chinese Taishan Station, East Antarctica. Front. Earth Sci. 8:250. doi: 10.3389/feart.2020.00250
Received: 03 January 2020; Accepted: 08 June 2020;
Published: 07 August 2020.
Edited by:
Tong Zhang, Los Alamos National Laboratory (DOE), United StatesReviewed by:
Masaki Kanao, National Institute of Polar Research, JapanAlexey Ekaykin, Arctic and Antarctic Research Institute, Russia
Copyright © 2020 Tang, Guo, Dou, Zhang, Cheng, Luo, Yu, Cui, Li, Zhang and Sun. This is an open-access article distributed under the terms of the Creative Commons Attribution License (CC BY). The use, distribution or reproduction in other forums is permitted, provided the original author(s) and the copyright owner(s) are credited and that the original publication in this journal is cited, in accordance with accepted academic practice. No use, distribution or reproduction is permitted which does not comply with these terms.
*Correspondence: Xueyuan Tang, dGFuZ3h1ZXl1YW5AcHJpYy5vcmcuY24=