- 1International Center for Climate and Environment Sciences, Institute of Atmospheric Physics, Chinese Academy of Sciences, Beijing, China
- 2University of Chinese Academy of Sciences, Beijing, China
- 3National Tibetan Plateau Data Center, Institute of Tibetan Plateau Research, Chinese Academy of Sciences, Beijing, China
- 4Land Surface Processes and Global Change Research Group, Institute of Geographic Sciences and Natural Resources Research, Chinese Academy of Sciences, Beijing, China
- 5Department of Environmental Science, Patan Multiple Campus, Tribhuvan University, Patan, Nepal
- 6Institute of Mountain Hazards and Environment, Chinese Academy of Sciences, Chengdu, China
Nepal is a mountainous country located on the southern slope of the central Himalayas, where the winter season contributes ∼3% of the total annual rainfall. This study sought to investigate the inter-annual variability and associated ocean-atmospheric pattern with winter precipitation during 1987–2015. A high-resolution APHRODITE and ERA5 reanalysis datasets are used to study the Empirical Orthogonal Function (EOF), Wavelet, Composites, and Correlation analysis, respectively. The results show that the leading EOF mode captures 53.2% of the total variance, exhibiting a single mode of variability. Wavelet analysis determined 2 to 2.6 years of the significant power spectrum. The time-series of winter precipitation anomalies revealed the years 1996, 1998, 2000, 2005, 2007, and 2008 as precipitation deficit years which is supported by negative precipitation anomalies with positive outgoing longwave radiation (OLR) and vertical velocity. These phenomena are converse for wet events during the years 1988, 1995, 1997, 2002, 2012, and 2014. Furthermore, the wet (dry) years exhibit moisture convergence (divergence) with strong southwesterly (northwesterly) wind anomalies. In the wave train of westerly flow, the cyclonic and anticyclonic circulation in northern India affects the moisture transport in wet and dry years, respectively. In excess precipitation years, Surface Air Temperature (SAT) over entire northern India and adjoining Nepal and Tibetan Plateau (TP) regions have a colder temperature than in deficit precipitation years. The correlation suggests the instance of Indian Ocean Basin Mode (IOBM) and NINO3.4 impacts on the inter-annual variability of the winter precipitation. Moreover, the warming and cooling over the Indo-Pacific regions affect the Walker and Hadley circulation bringing above and below-normal precipitation, respectively, over Nepal. The observed changes in the dry and wet years during winter are useful for disaster preparedness and the planning and monitoring of water resources and agriculture.
Introduction
Nepal is considered to be one of the most vulnerable countries to extreme weather events (Eckstein et al., 2018). In recent years, the country has been suffering from many meteorological disasters, such as floods and droughts due to the above and below-average rainfall (Krishnamurthy et al., 2013; Adhikari, 2018). High intensity related to extreme precipitation events is the principal cause of landslides, debris flows, and flood disasters in the country (Talchabhadel et al., 2018). Flooding has been reported to contribute to about 49% of the total disaster events in Nepal from 2000 to 2017 (CRED, 2018). Moreover, a flood is a complex hazard resulting in a cascade of secondary hazards, such as landslides and debris flow. Flood and drought events are leading to tremendous losses of life, property, and affecting socio-economic development (Eckstein et al., 2018). According to World Food Agricultural Organization, severe winter drought reduced the yield and quality of major food crops (barley and wheat) by 15% between 2008 and 2009 (World Food Programme, 2009). The seasonal variability of extreme events is expected to increase with ongoing climate change (Field et al., 2012).
The winter precipitation occurs in December, January, and February, and has a small contribution (∼3%) to the total annual rainfall in Nepal (Sigdel and Ikeda, 2012). However, it is an essential source of water to glaciers, rivers, and ecosystems in the dry season. In contrast to summer precipitation (June-September), winter precipitation is relatively less explored due to its limited contribution to annual rainfall (Sigdel and Ikeda, 2012; Sigdel and Devkota, 2013). The country has frequently been experiencing several extreme events in the winter season (Wang et al., 2013). The winter season is influenced by an eastward-moving synoptic weather system called Western Disturbances (WD; Yadav et al., 2012; Dimri, 2013a). The WDs are originated over the Mediterranean Sea or Mid-Atlantic Ocean and travel eastward over Iran, Afghanistan, Pakistan, and northwest India (Dimri, 2007) and finally enter into Nepal through the western region bringing winter precipitation. Comparably, the western region of Nepal gets more winter precipitation than the central and eastern regions (Kansakar et al., 2004; Ichiyanagi et al., 2007). Moreover, Western Himalayas is the area of significant importance as it receives the above-normal rainfall amount because of the cyclogenesis (Dimri, 2006).
The global forcing that controls the climate of the Northern Hemisphere is El Niño/Southern Oscillation (ENSO), Arctic Oscillation (AO), and Northern Atlantic Oscillation (NAO). Cannon et al. (2014) has investigated the role of the AO and ENSO on the on multi-annual variations in winter westerly disturbance activity affecting the Himalaya. In the context of recent global warming, precipitation variability is linked with Sea Surface Temperature (SST; Dimri, 2013a). The interannual variability of the winter precipitation, mainly drought in Central and Southwest Asia is linked with the SST changes in the Indian and Pacific Oceans (POs; Barlow et al., 2002). ENSO is the most widely studied ocean-atmospheric phenomenon on the variability of the precipitation (Yadav et al., 2012). The strong relationship between ENSO and winter precipitation over the Indian region has been reported in recent decades (Yadav et al., 2013; Kar and Rana, 2014). Further, the role between ENSO and the winter precipitation in northwest India has enhanced, whereas, the role of NAO/AO is diminishing in recent years (Yadav et al., 2009). The intensified WDs are observed over northwest India and Western Himalayas during the warm phase of the ENSO (Yadav et al., 2013; Dimri, 2013a). Moreover, the positive (negative) response of the India ocean Dipole (IOD) has favored (unfavored) the precipitation variability in south peninsular India (Kripalani and Kumar, 2004). The previous study shows that IOD develops in boreal summer and reaches a peak in the boreal fall (Saji et al., 1999). The dipole is characterized by the positive SST anomalies over the equatorial western Indian Ocean and negative SST anomalies over the equatorial eastern Indian Ocean. However, the pronounced warming of the Indian Ocean in recent decades acted as a capacitor to delay and prolong the influence of the ENSO (Yang et al., 2007; Lu et al., 2019). Thus, it is necessary to study the whole Indian Ocean Basin Mode (IOBM) impacts on the interannual variability of the winter precipitation over south Asia.
Many studies have been conducted in Nepal for studying spatio-temporal variation of summer precipitation and its related extreme events (Kansakar et al., 2004; Karki et al., 2017; Talchabhadel et al., 2018). The relation of summer monsoon variability has been linked with ENSO (Shrestha et al., 2000; Sigdel and Ikeda, 2012). Recently, Pokharel et al. (2019) studied the east-west division of precipitation over Nepal during 1951–2007 and found that mean annual precipitation has decreased in western Nepal due to the interannual variability of the IO SST. However, studies related to winter precipitation variability of Nepal are limited. For instance, (Wang et al., 2013) examined the drought over the western region of Nepal and discussed the mechanism on how AO can influence this variability. Their finding shows the decadal variability of winter precipitation between the 2001–2010 and 1991–2000 periods. Sigdel and Devkota (2013) found a weak relation of NAO and the strong relation of the Dipole Moment Index (DMI) with winter precipitation variability in Nepal. However, the above-mentioned studies have not quantified the physical mechanism relating to IO and PO on the precipitation change over the region. By studying different seasonal SST, it is possible to acquire predictive information on the interannual variability of precipitation. In particular, lead/lag response of the IO and PO with winter precipitation over the region is yet to be investigated because IOD, IOBM, and ENSO has developing and decaying phase (Saji et al., 1999; Lu et al., 2019; Zhou et al., 2019). For instance, there is a weak response between ENSO and North Xinjiang summer precipitation, however, a robust relation occurs in post-spring and summer (Lu et al., 2019). Further, the mechanical and thermal processes over the Tibetan Plateau (TP) are affecting global atmospheric circulation and global precipitation (Duan et al., 2012; Maussion et al., 2014). In the present study, we aim to link the temperature changes in TP, IO, and PO; cyclonic/anticyclonic circulation; and divergent/convergent wind patterns affecting winter precipitation of Nepal with recently released high-resolution reanalysis data (ERA5). For this, we analyze the year-to-year variability of excess or deficit winter precipitation over Nepal between 1987 and 2015 and present the physical mechanism of inter-annual variability. Understanding the variability of the winter precipitation is of great importance in the economy of Nepal because December to February is the winter copping season (Rohwerder, 2016). Further, it will help us to understand the occurrences of the past extreme events as being the basis for forecasting and monitoring drought and floods over Nepal.
Study Area
The study area, Nepal is a South Asian country located between 26.36°–30.45°N and 80.06°–88.2°E encompassing an area of 147,181 km2 bordering with Tibet, China in the north and India in the east, west and south (Figure 1). According to the Department of Hydrology and Meteorology (DHM), the mean annual precipitation and temperature of Nepal are 1,857.6 mm and 20°C, respectively, from 1971 to 2012 (Department of Hydrology and Meteorology [DHM], 2017). The four climatological seasons that exists in Nepal are the pre-monsoon (MAM), summer monsoon (JJAS), post-monsoon (ON), and winter (DJF). The Asian monsoon system governs the climate of Nepal, bringing more than 80% of precipitation during summer (Nayava, 1980; Shrestha et al., 2000). In the winter season, the country receives about 3% of its annual rainfall from the westerlies (Karki et al., 2017; Sharma et al., 2020). The interaction of two extensive weather systems; monsoon and westerly disturbances are two main phenomena causing inter-annual precipitation variability over Nepal. For climate study, the study area is divided into three categories, i.e., western (Western boundary to 83°E) central (from 83° to 85°E) and eastern (from 85°E to eastern boundary) regions (Kansakar et al., 2004; Figure 1). All three regions features same physiographic regions (Terai, hills and mountain) but with difference in distribution and duration of precipitation (Sharma et al., 2020). In this study, the South Asian region (5°S–39°N, 60°W–95°E) was selected for the study of the atmospheric circulation pattern.
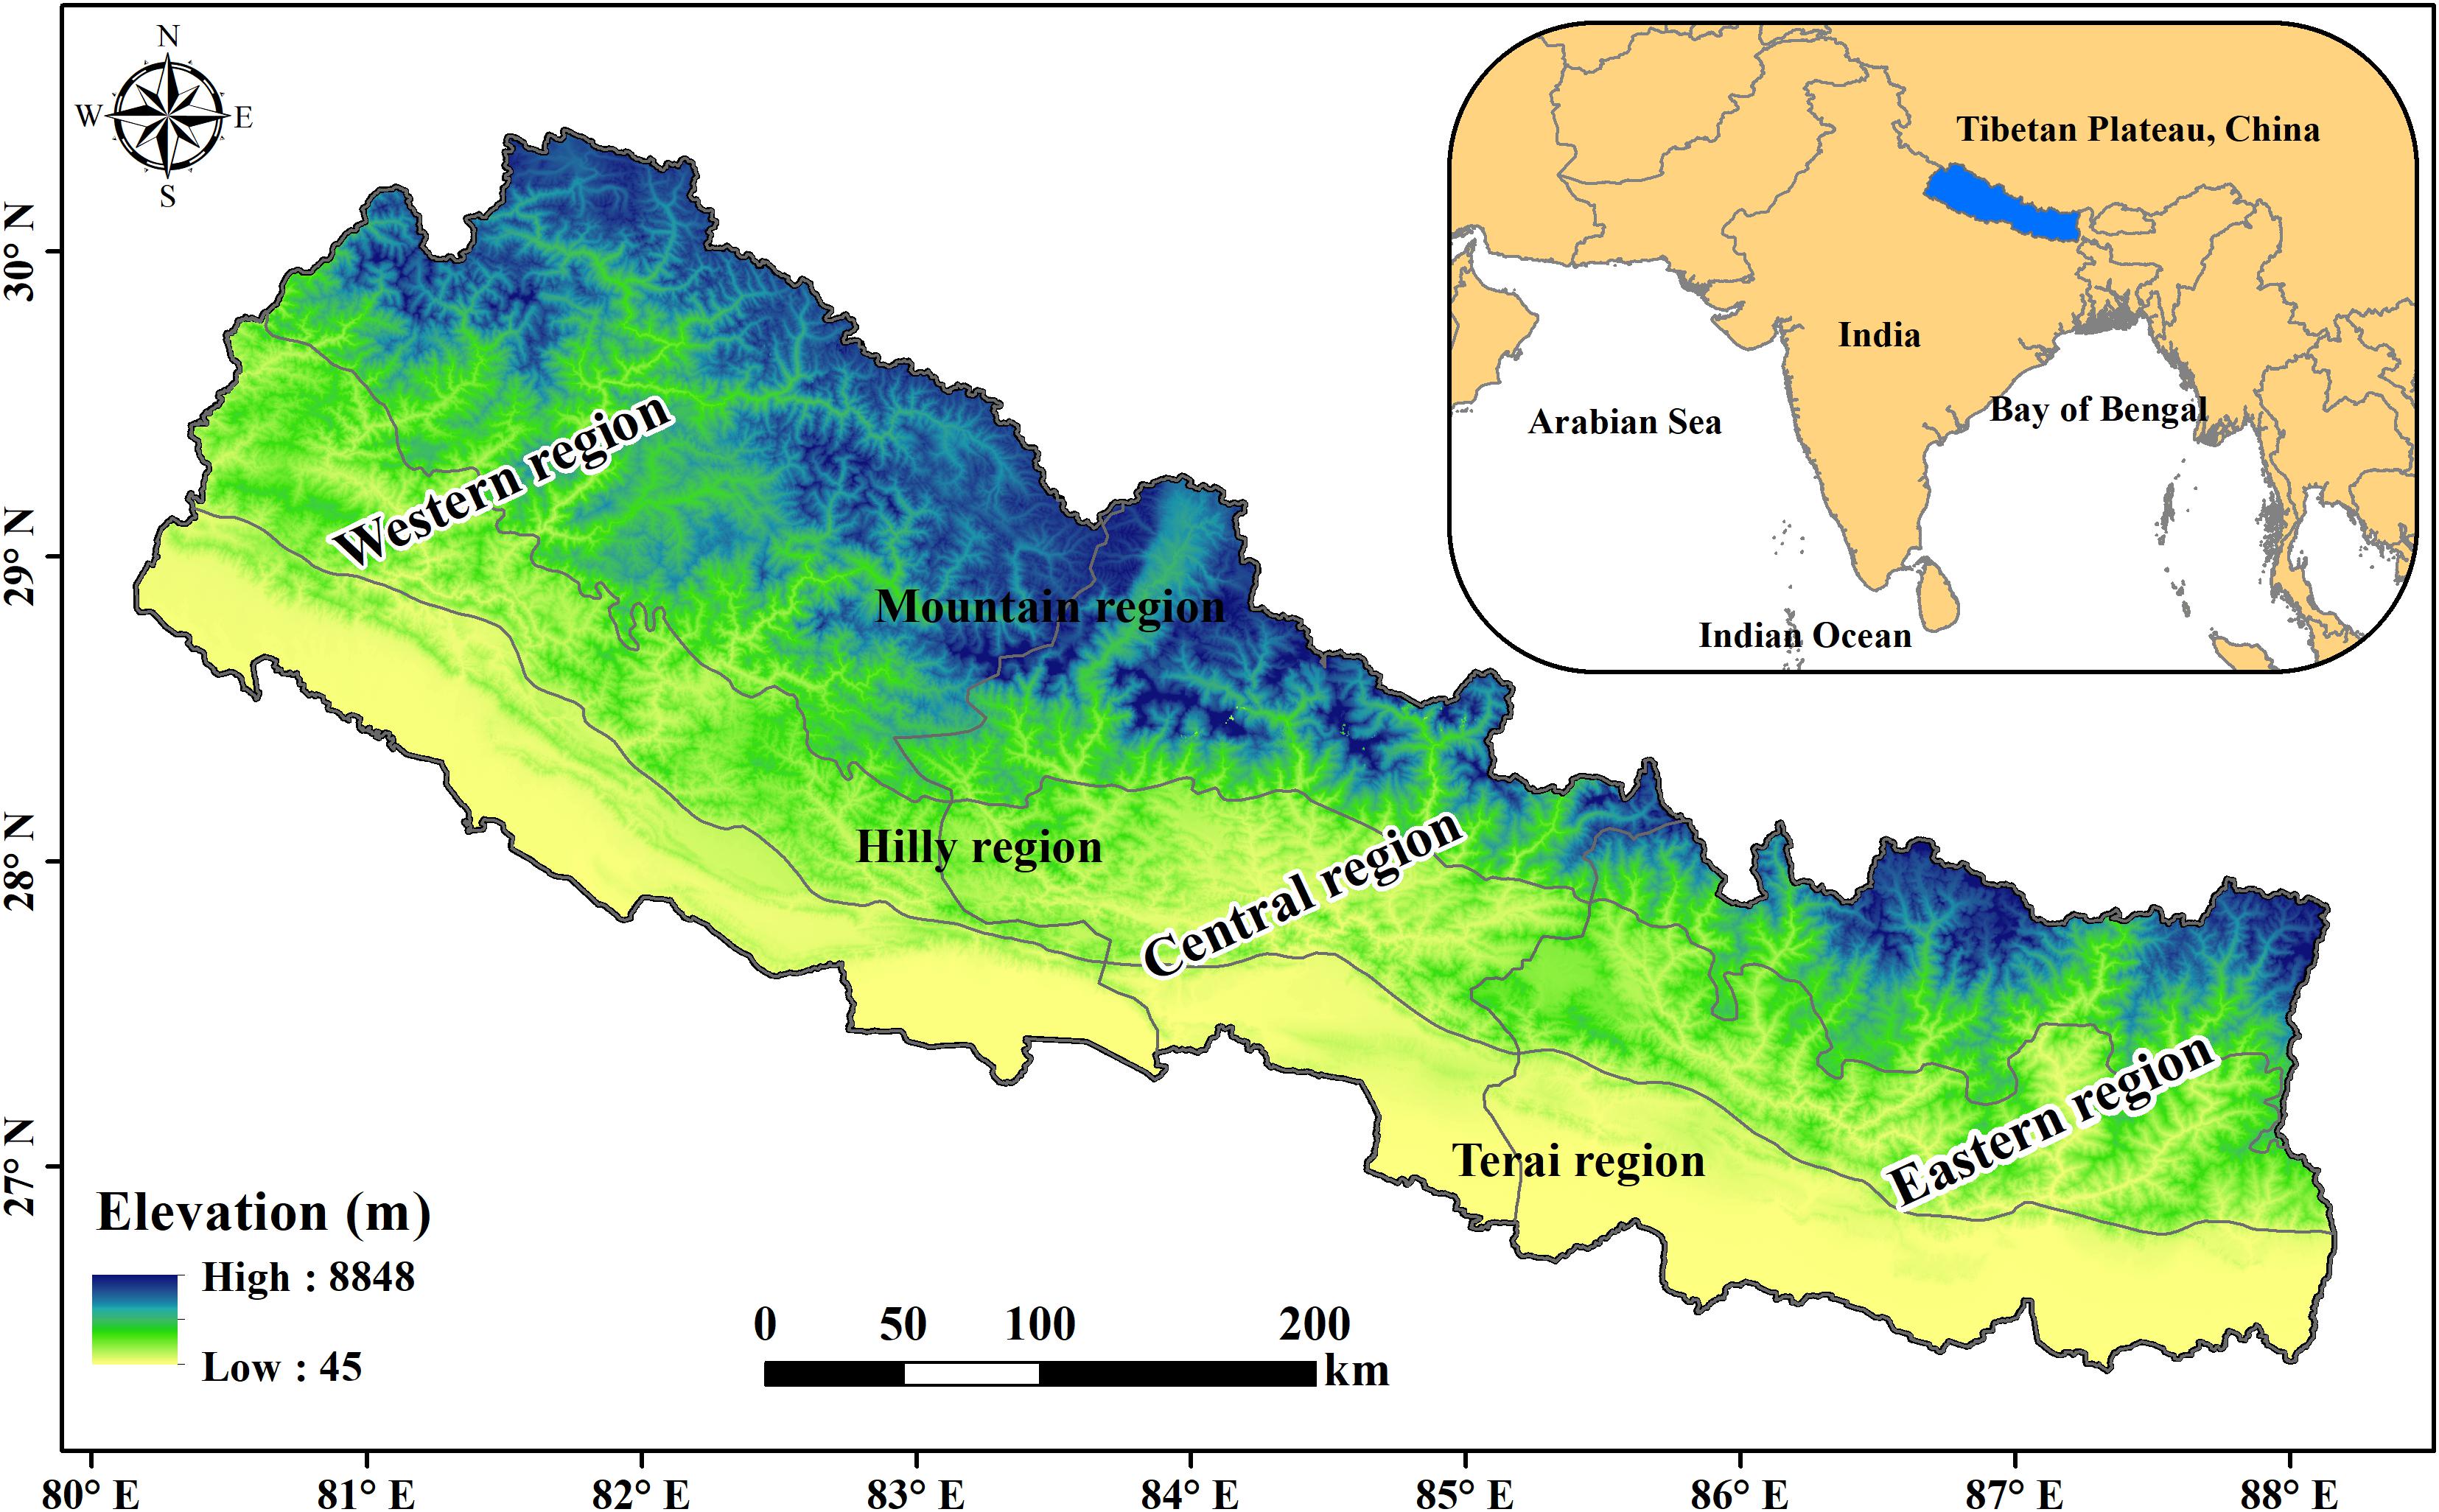
Figure 1. The study area, Nepal with different regions. The inset shows the location of Nepal in relation to the ocean and landmasses.
Data and Methods
Data
Asian Precipitation-Highly-Resolved Observational Data Integration toward Evaluation of Water Resources (APHRODITE) is a gridded precipitation dataset covering more than 57 years was created by collecting and analyzing rain gage observation data across Asia. This data set is based on observed precipitation data around the globe (from 5,000–12,000 stations) in conjunction with other pre-compiled datasets (Yatagai et al., 2009; Yatagai et al., 2012). For generating the gridded data sets, it has used maximum possible gages available across Nepal (Yatagai et al., 2009). The APHRODITE project contributes to studies, such as the determination of Asian monsoon precipitation change, evaluation of water resources, verification of high–resolution model simulations and satellite precipitation estimates, and improvement of precipitation forecasts. Here, 0.25° × 0.25° resolution monthly average data APHRODITE (APHRODITE-1 and APHRODITE-2) over monsoon Asia between 1987 and 2015 was used. APHRODITE data has followed the quality control procedures for refining and avoid inconsistency in data (Sunilkumar et al., 2019). Meanwhile, the validation of the APHRODITE gridded data set (1987–2015) with the data from 80 meteorological station data across Nepal showed a strong correlation of 0.80 in the same period (Figure 2). The observed data for validation were collected from the meteorological stations managed by the Department of Hydrology and Meteorology, Government of Nepal (DHM).
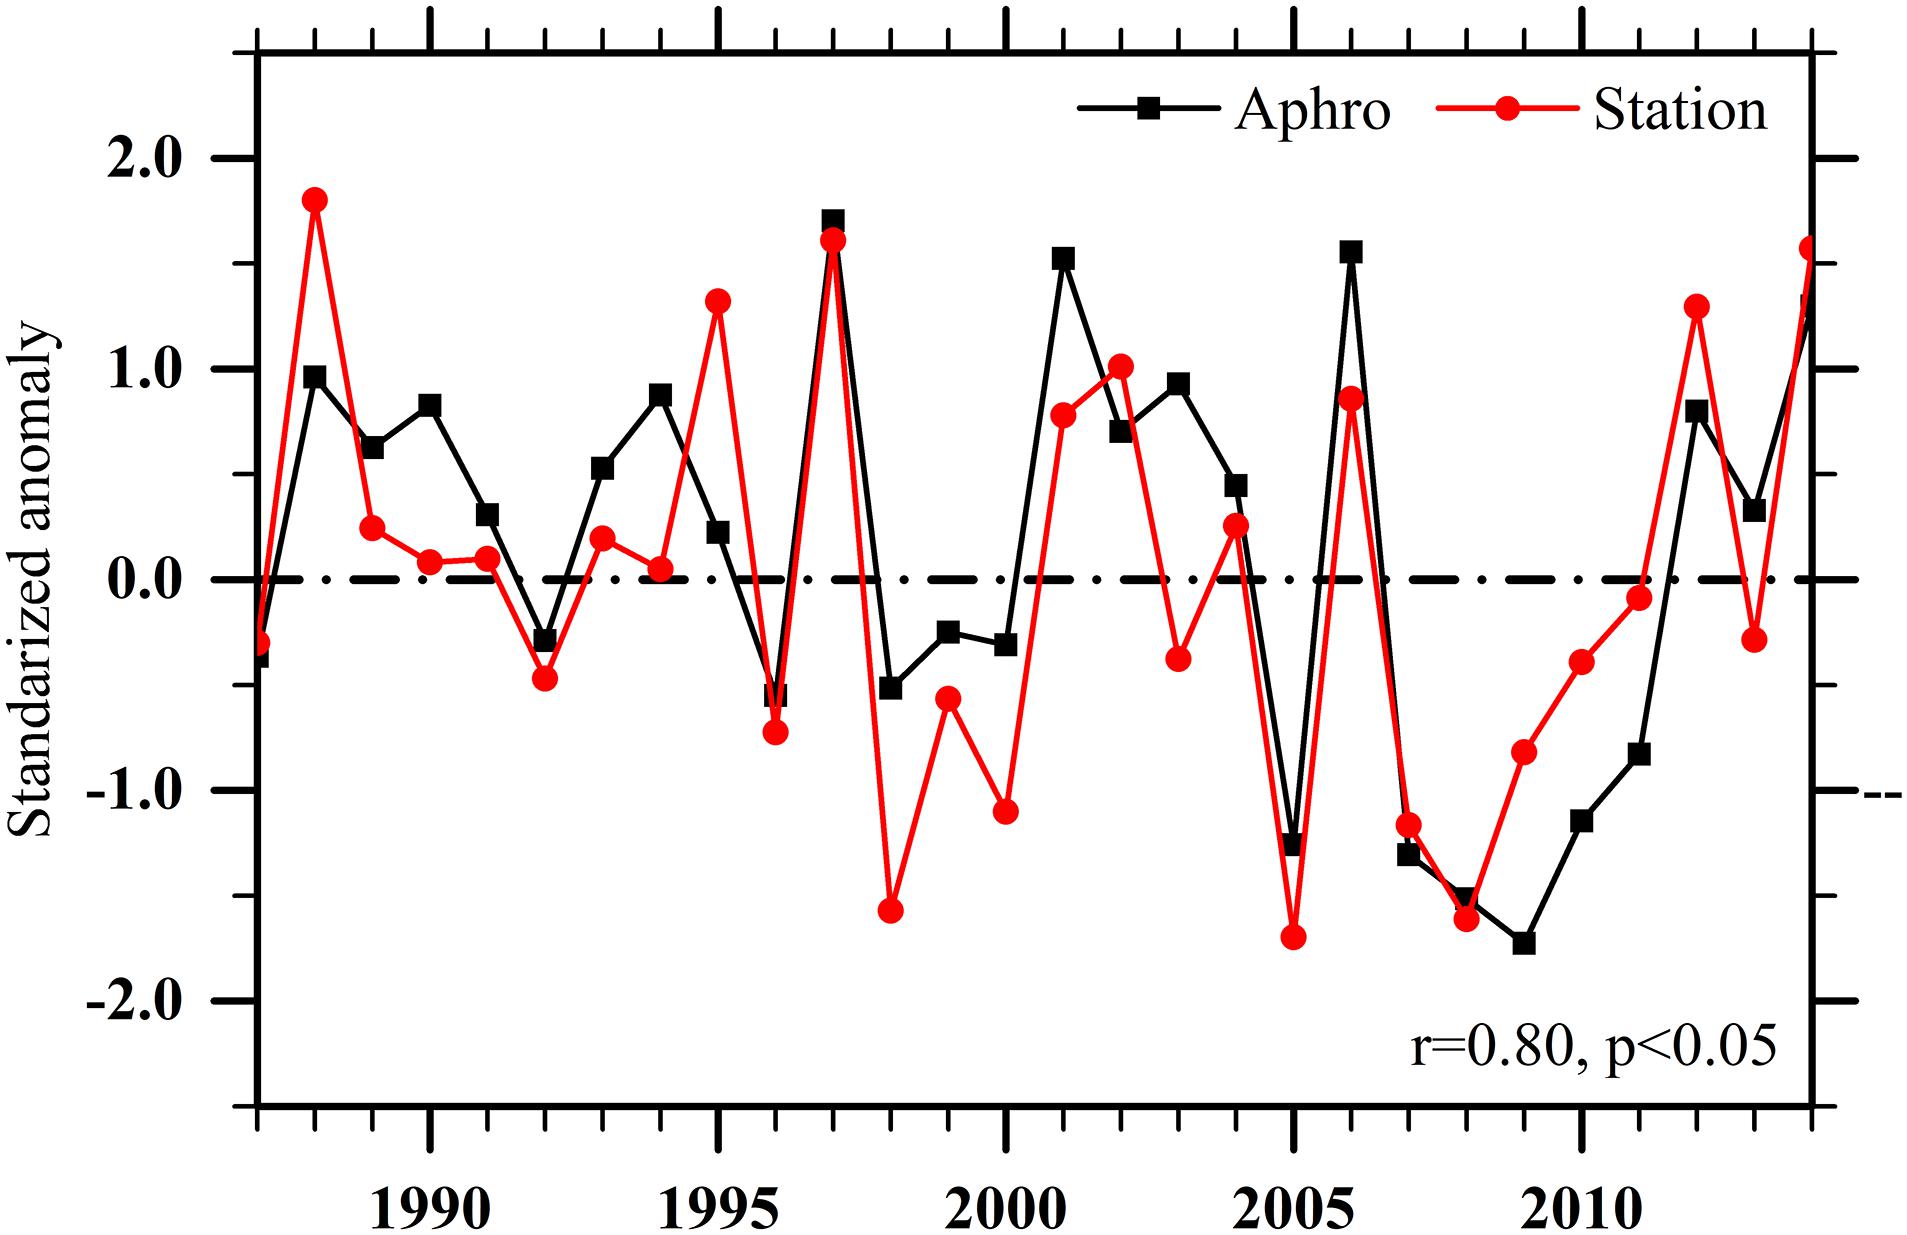
Figure 2. Validation of APHRODITE (Aphro) data with 80 meteorological station data using correlation analysis between 1987 and 2015.
The large scale atmospheric circulation parameters used are wind (u and v components), relative humidity, moisture flux, OLR, vertical velocity, 2 m Surface Air Temperature (SAT), and SST provided by ERA5 reanalysis dataset with the spatial resolution of 0.25° × 0.25°. ERA5 has recently released the fifth generation ECMWF reanalysis for the global climate and weather spanning between 1979 and 2019 (Copernicus Climate Change Service Climate [C3S], 2017). The SST indices: NINO3.4, DMI, and IOBM used in this study were calculated from the same ERA5 SST. NINO3.4 index is a widely used indicator of ENSO, which is the average SST anomaly in the region of 5°N to 5°S and 170°W to 120°W. Similarly, the IOD is the temperature difference between the western (50°E–70°E and 10°S–10°N) and the eastern (90°E–110°E and 10°S–10°N) equatorial Indian Ocean (Saji et al., 1999). DMI is an indicator of the intensity calculation of IOD. IOBM is defined as the averaged SST within 40°E–110E°; 20°S–20°N (Lu et al., 2019).
Methods
Empirical Orthogonal Function (EOF) analysis is a computation of the Eigenmodes for a covariance matrix based on precipitation giving the spatial pattern, time series, and percentage of variance (Sein et al., 2015). Here, EOF analysis was conducted to determine the dominant mode of winter rainfall over Nepal. The eigenvalues express the importance of the EOFs/Principal Components (PCs), whereas the first EOF (EOF1) is crucial, followed by the second EOF (EOF2), and so on (Wang X. et al., 2015). The theories and algorithms were adopted from Lorenz (1956), Zhang and Moore (2015) to analyze EOF. The wavelet analysis was carried out to visualize the potential signal in the standardized winter precipitation time series by following the methods described in the previous studies (Torrence and Compo, 1998; Mchugh, 2006; Dieppois et al., 2016). The composite analysis gives information about the common features and patterns of the variable in the atmosphere (Kar and Rana, 2014; Ngarukiyimana et al., 2018). Composite analysis of precipitation, OLR, wind, moisture flux, vertical velocity, velocity potential, relative humidity, and 2 m SAT was performed. The statistical significance test of composite analysis in this study is assessed using the student t-test at a 95% confidence interval. Several studies have revealed the application of this analysis over the South Asian countries (Shrestha, 2000; Krishnamurthy and Kirtman, 2009; Dimri, 2013a). In this study, the Pearson correlation analysis aims at displaying the relationship between the variables at a 95% confidence level. The time series of all the climatic parameters were detrended before passing through EOF, composite, and correlation analysis.
Results and Discussion
Characteristic of Winter (DJF) Precipitation
The seasonal precipitation cycle over Nepal was analyzed using the APHRODITE data set during 1987–2015 (Figure 3A). The analysis revealed that the rainfall is highest in the summer monsoon (JJAS) season and the lowest in the winter season (DJF). The climatology of winter precipitation over Nepal is presented in Figure 3B. The average winter precipitation of Nepal is 20.13 mm/month during the study period. The winter precipitation is higher (above 30 mm/month) in the far-western region than eastern and central regions (about 10–20 mm/month) of Nepal. The westerlies bringing winter precipitation are pronounced in the western region and weakens from west to east (Kansakar et al., 2004; Ichiyanagi et al., 2007). The previous study also showed a spatial variation of winter precipitation is more substantial in the western region than in the central and eastern regions (Ichiyanagi et al., 2007).
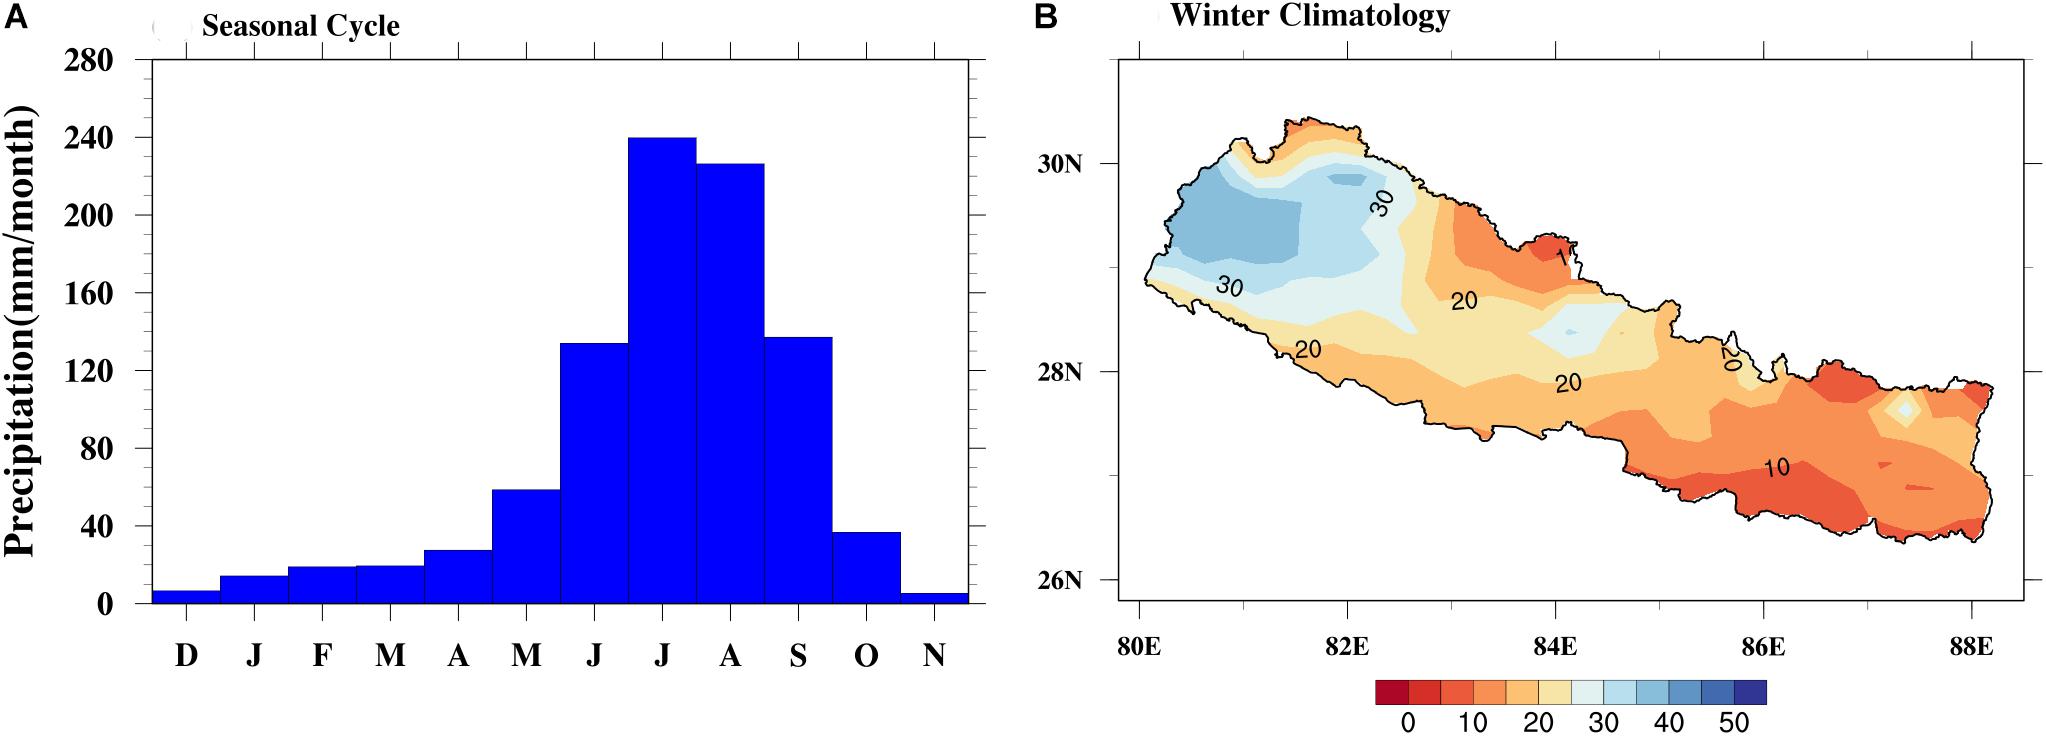
Figure 3. (A) Seasonal cycle and (B) Climatology of winter precipitation (mm/month) over Nepal using APHRODITE data from 1987 to 2015.
The Dominant Mode of Winter Rainfall
The precipitation time series was de-trended, and EOF analysis was obtained for the winter precipitation. The dominant modes of variability of the mean winter precipitation over Nepal are presented in Figure 4. EOF1 and EOF2 cannot explain whether Nepal is receiving high or low precipitation based on EOF maps; however, it gives precipitation field variation with eigenvalues. The leading EOF1 mode captures 53.2% of the variance, and the EOF2 contributes 17% of the total variance. Further, EOF1 exhibits a single mode of variability, with strong loadings in the central and western regions (Figure 4A). Meanwhile, EOF2 shows an intricate pattern (negative-positive-negative, from west to east Figure 4B). This pattern displays conflicting signals of variability in the far western and eastern regions. The distribution of precipitation in Nepal varies spatially due to local scale parameters, such as orography, wind exposure, and direction of the mountain range (Kansakar et al., 2004; Talchabhadel et al., 2018).
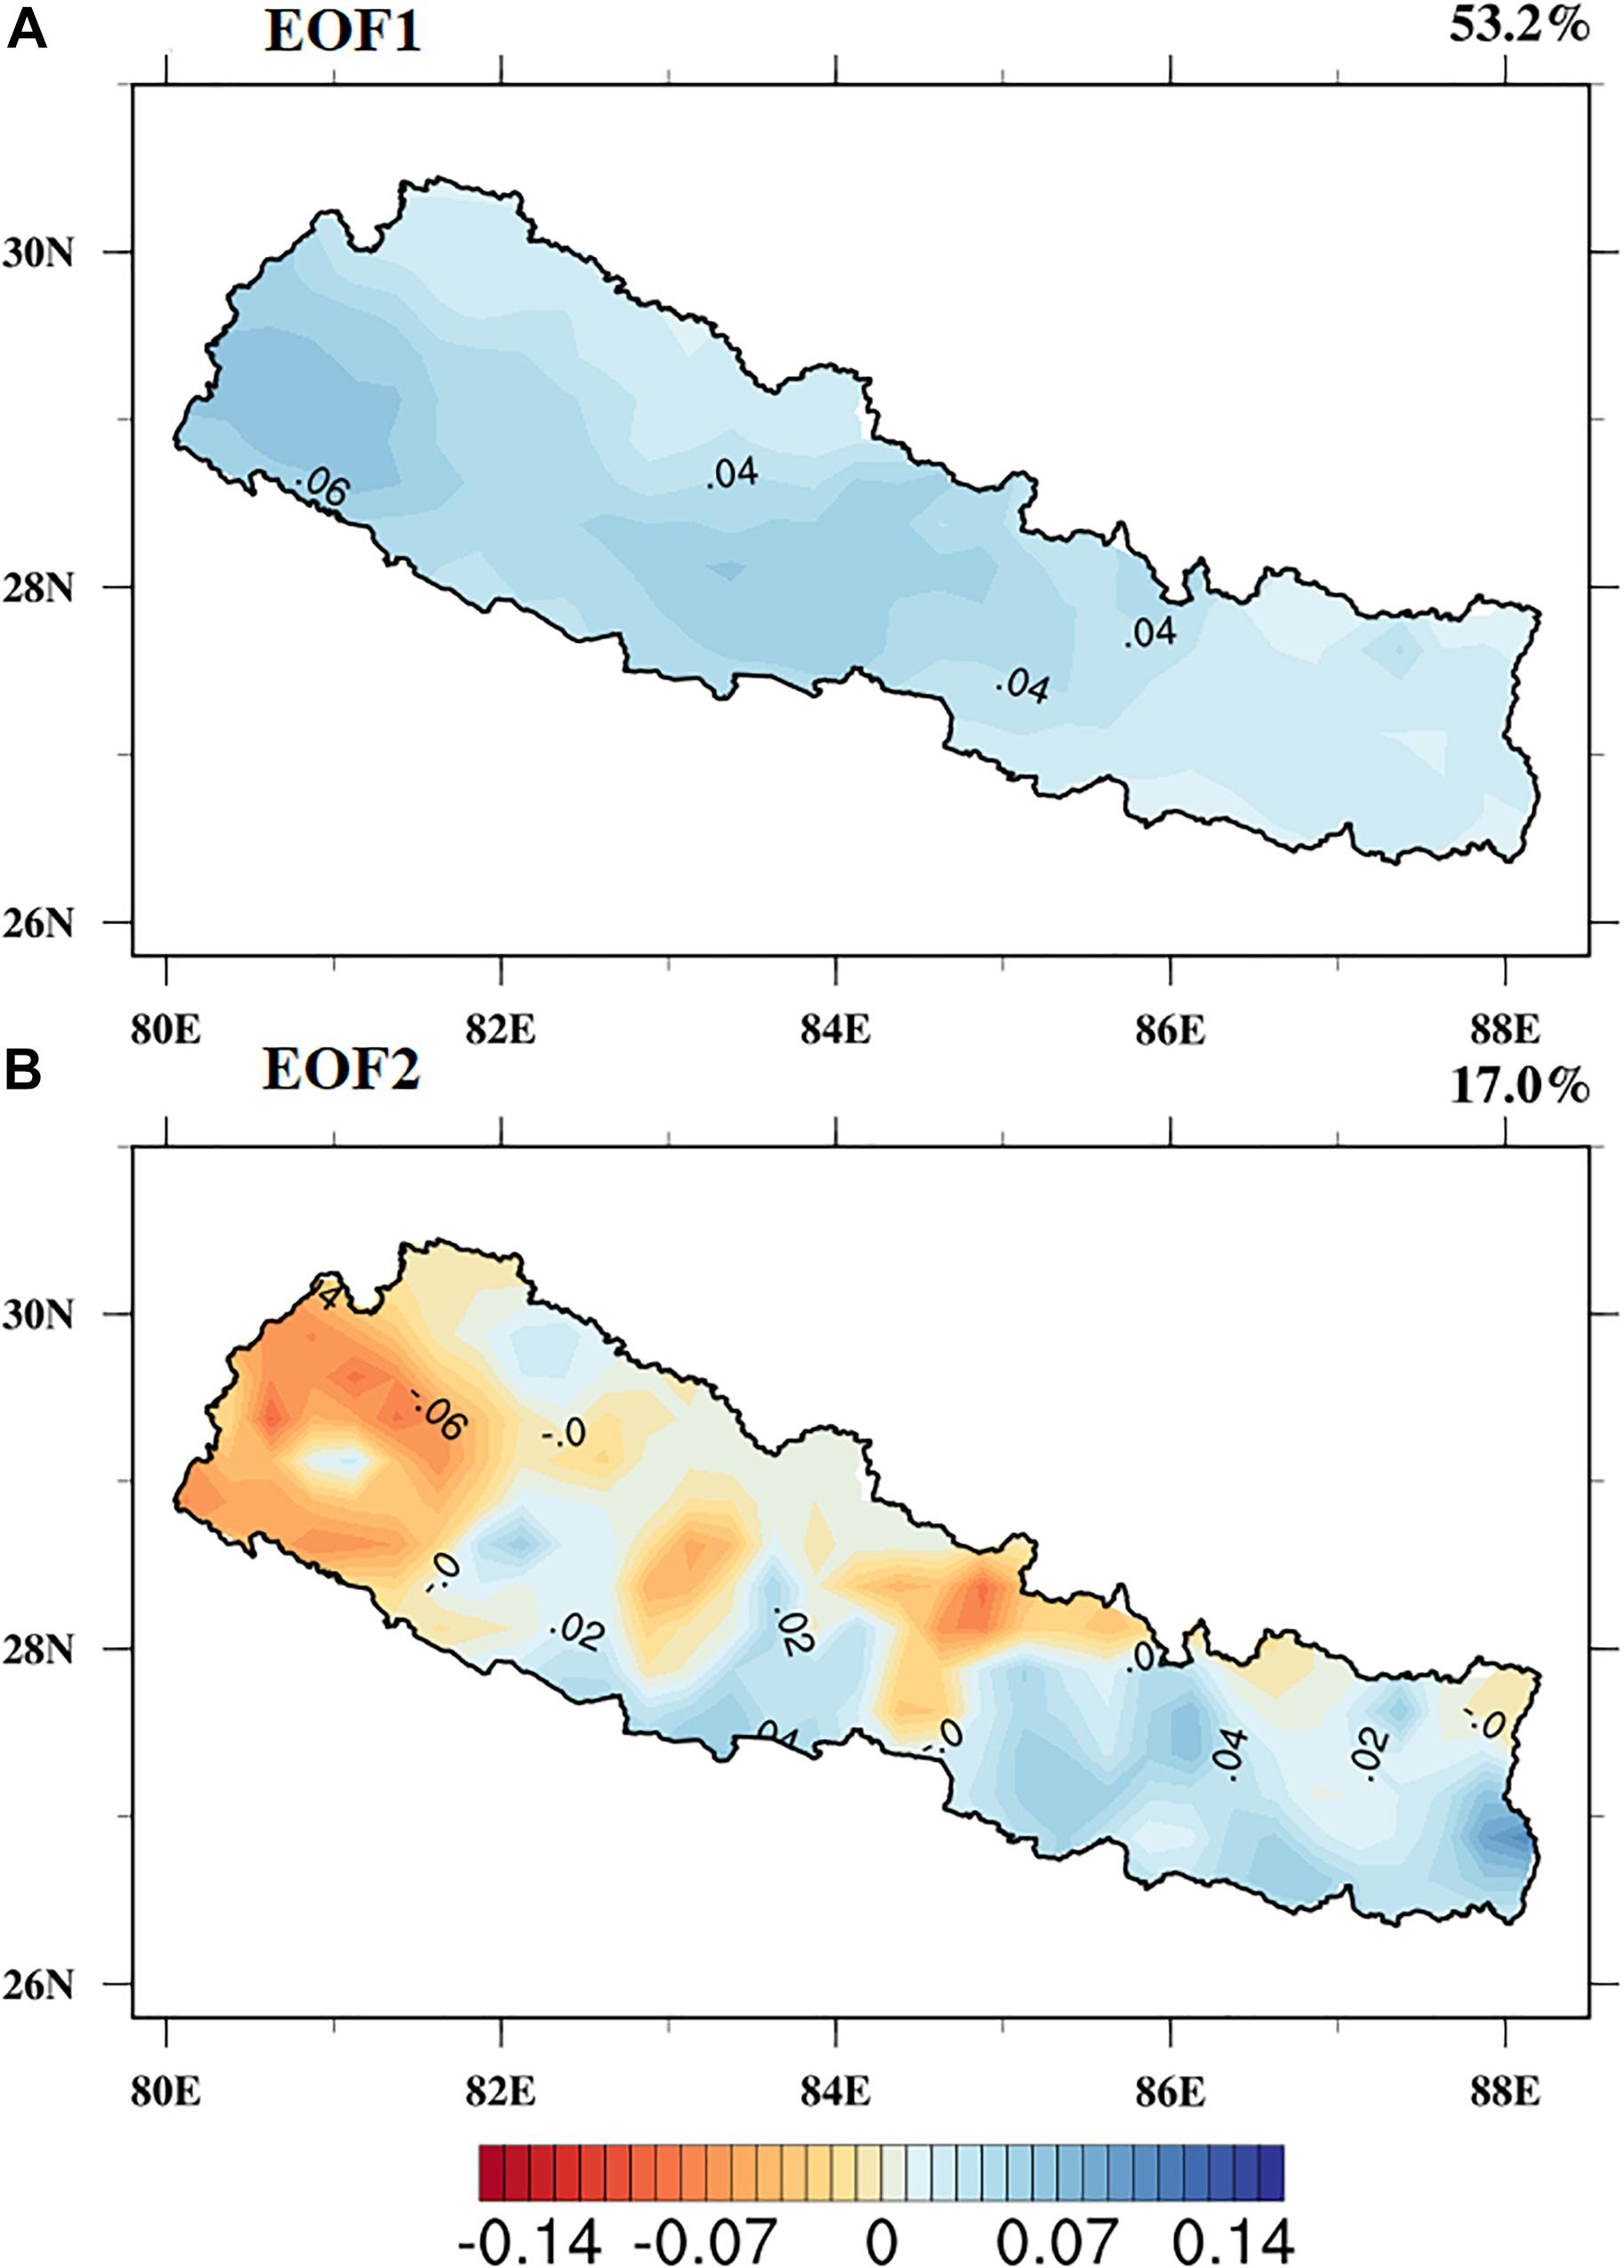
Figure 4. (A) The first dominant mode of variability (EOF1) explains 53.2% of the total variance of the mean winter precipitation and (B) the second dominant mode of variability (EOF2) explains 17% of the total variance of the mean winter precipitation over Nepal, based on APHRODITE data during 1987–2015.
The respective principal components (PC1 and PC2) of EOF1 and EOF2 are shown in Figures 5A,B, respectively. The PC1 and PC2 give information about the interannual and decadal variation of precipitation over Nepal from 1987 to 2015. The higher value of PC1, i.e., standardized anomalies exceeding + 1, shows the above-average precipitation and vice-versa (Figure 5A). Thus, 1988, 1995, 1997, 2002, 2012, and 2014 are above-normal precipitating years, whereas 1996, 1998, 2000, 2005, 2007, and 2008 are below-normal precipitating years. PC2 time series show decadal variability of precipitation, since, a negative decadal anomaly of precipitation (1987–2001) has changed to a positive anomaly during the next decade (2001–2015) over Nepal (Figure 5B). This implies that in these decades, the spatial distribution of precipitation was inverse mainly in the far western and eastern regions (Figure 4B). Similar findings also reported by Wang et al. (2013), where the second mode of EOF revealed the decadal variability of winter precipitation in the western region during 1991–2010, which is linked with AO.
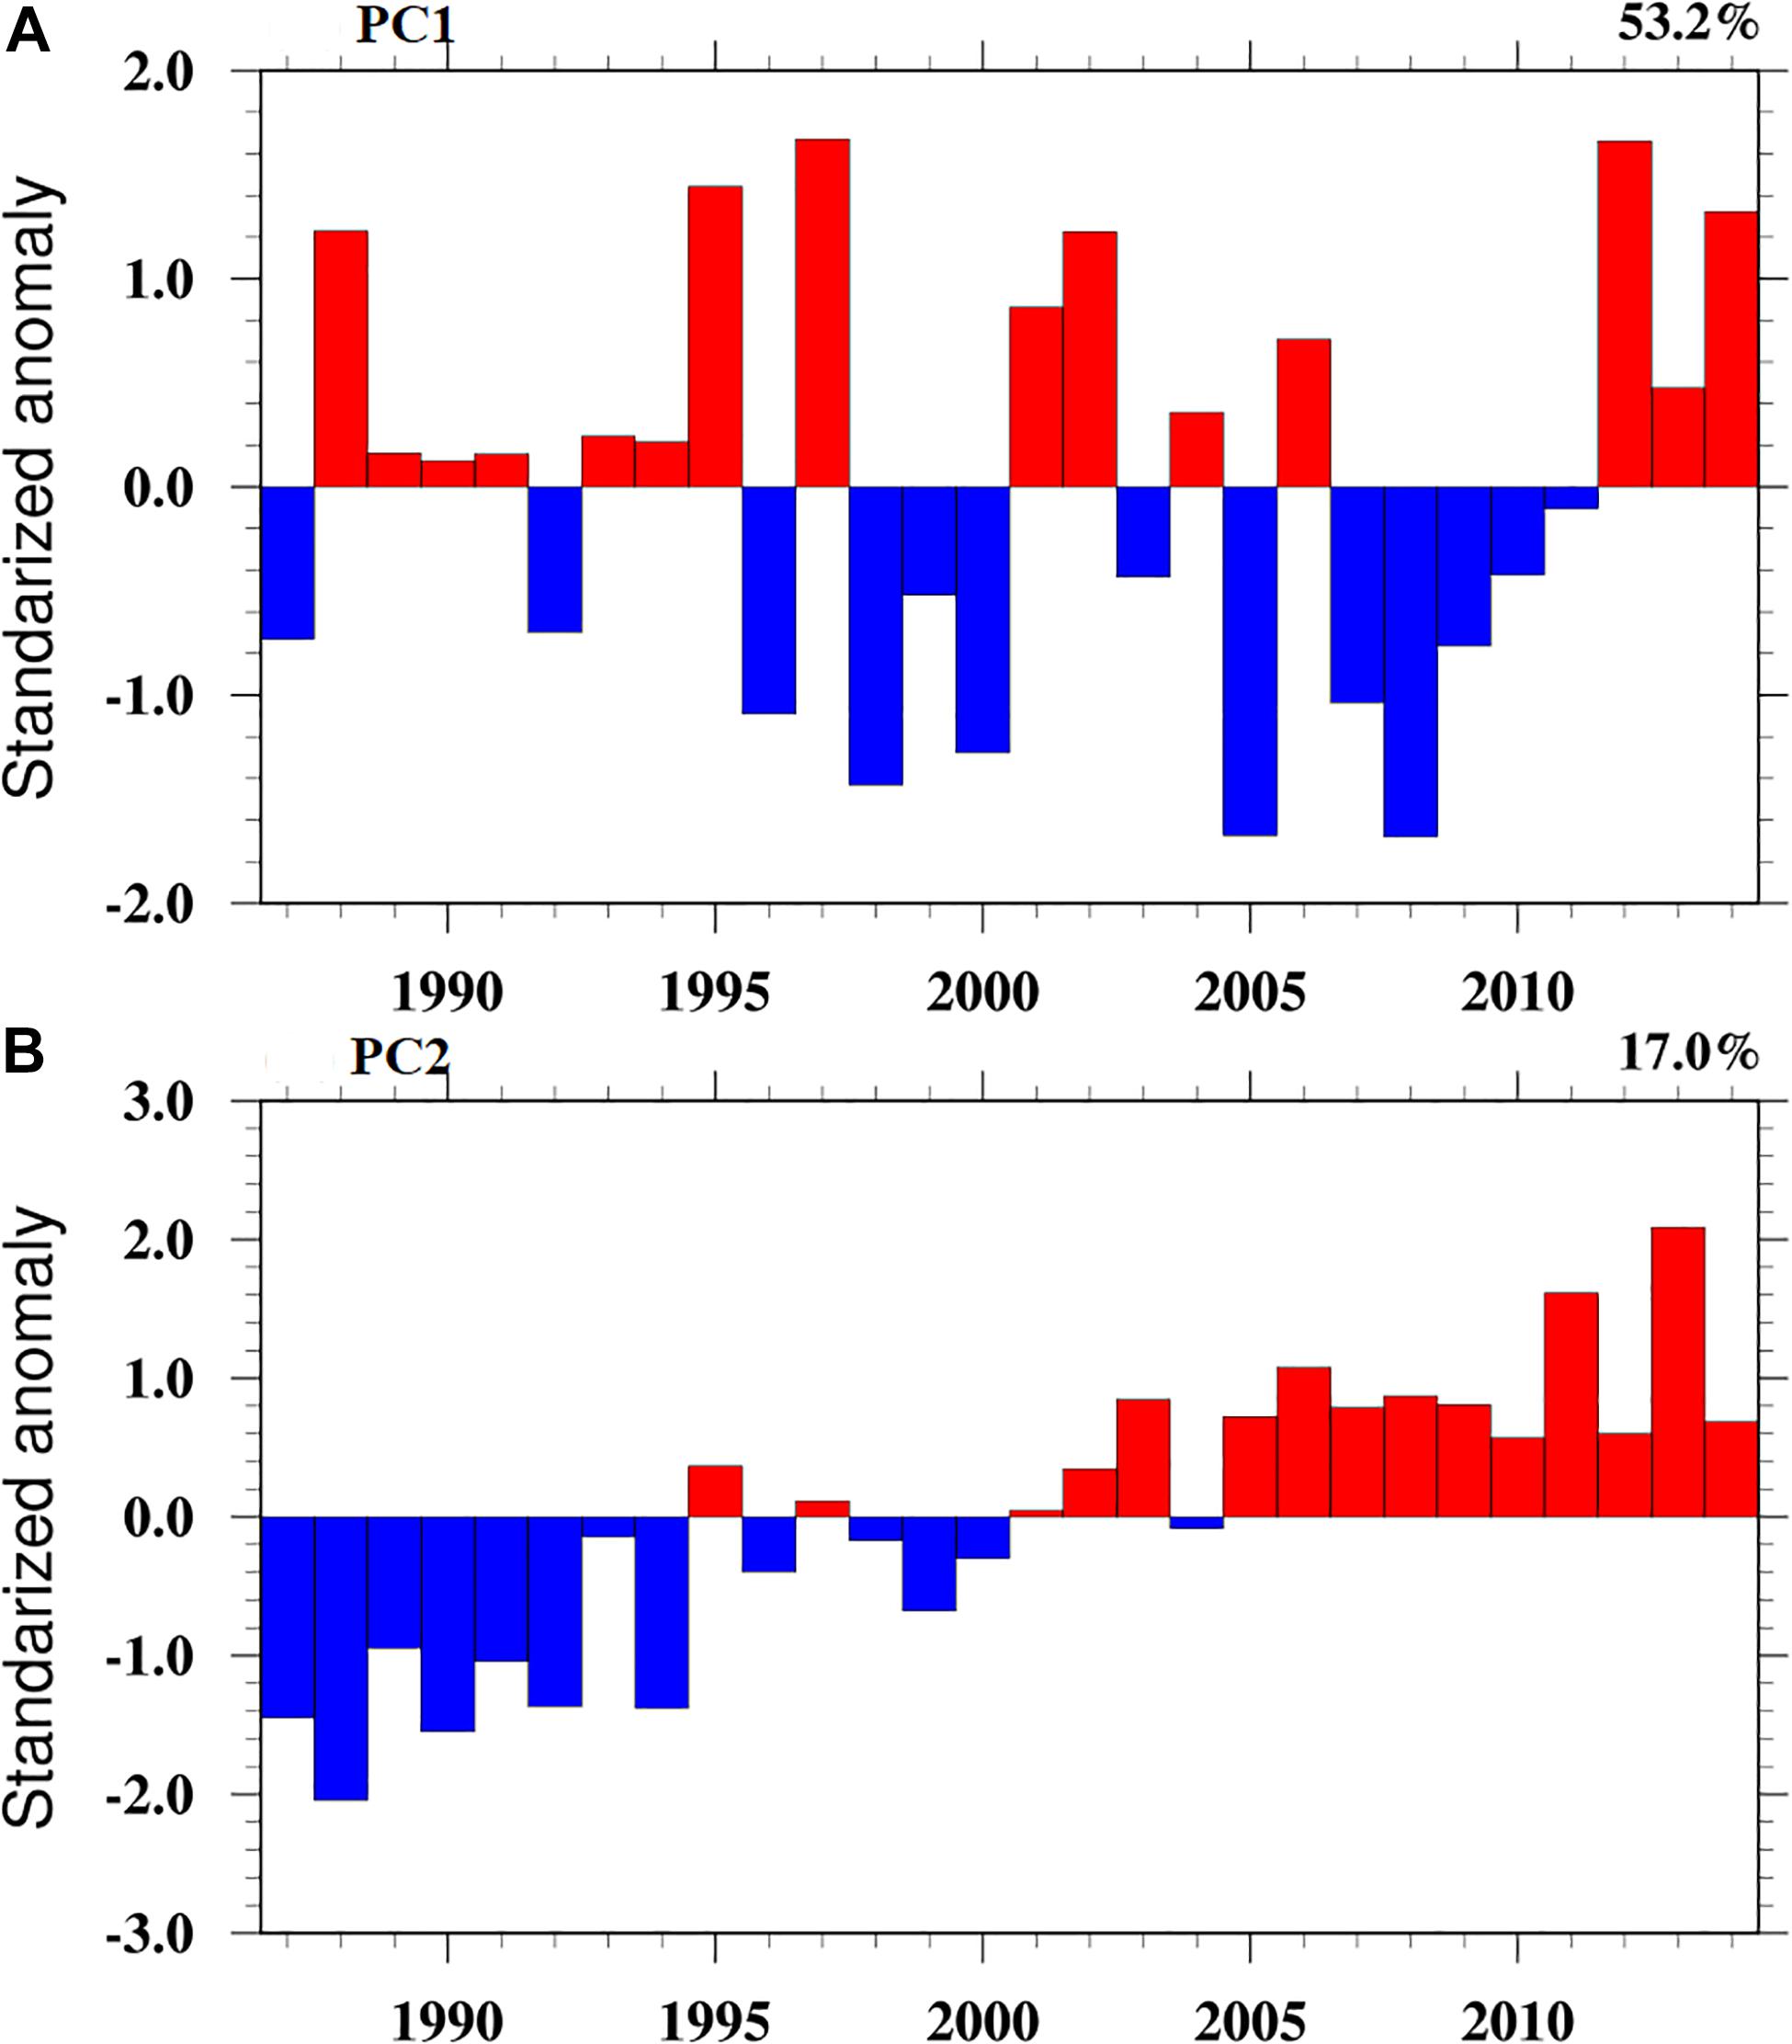
Figure 5. (A) The first Principal Component associated with EOF1 (PC1) and (B) The second Principle Component associated with EOF2 (PC2) of winter precipitation over Nepal, based on APHRODITE data from 1987 to 2015.
Inter-Variability of DJF Precipitation
The inter-annual variability of winter precipitation and PC1 over Nepal between 1987 and 2015 is presented in Figure 6. A strong correlation coefficient (0.97) was observed between EOF1 and detrended averaged winter precipitation over Nepal during the analysis period (Table 1). The EOF1 and PC1 mode contributes to the highest variance and capable of characterizing the winter precipitation variability in Nepal over the study period. The temporal analysis revealed that the country experienced a below-average rainfall amount in between 1995 and 2010. The anomalous strong or weak years were selected using standardized anomalies exceeding ± 1 (Figure 6). The result shows six of each positive (strong: 1988, 1995, 1997, 2002, 2012, and 2014) and negative (weak: 1996, 1998, 2000, 2005, 2007, and 2008) anomaly years.
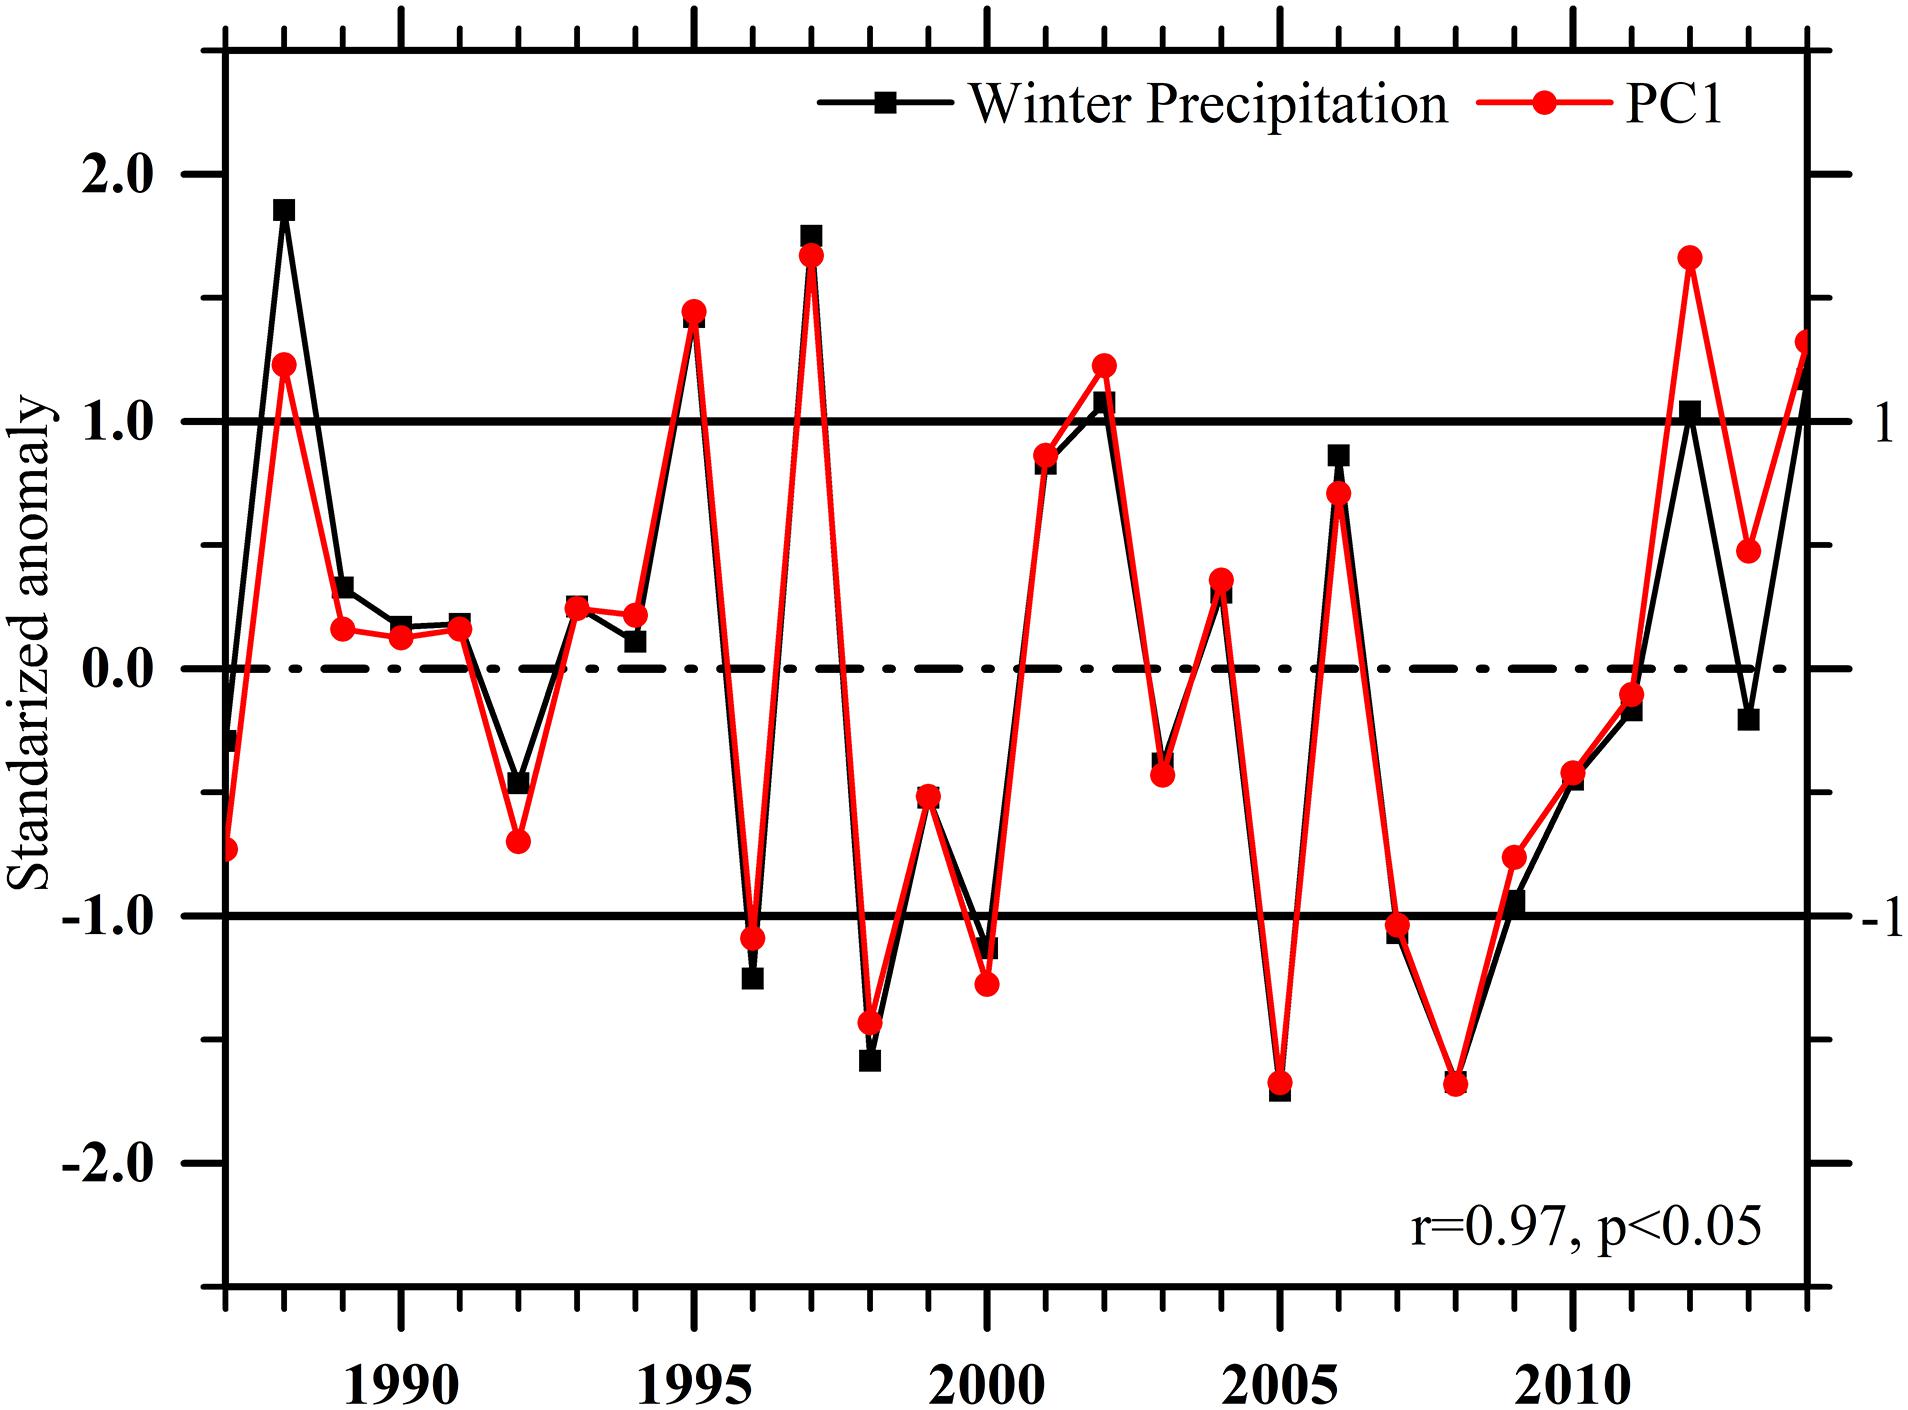
Figure 6. Inter–annual variability of PC1 and winter precipitation anomaly over Nepal. The black dotted line represents the reference line and blackline separates the wet and dry years during 1987–2015.
Morlet wavelet power spectrum analysis was performed on winter standardized precipitation anomalies to investigate the presence of significant signals that might be embedded in the study period. The detrended precipitation time series was passed through wavelet analysis. It was observed 2–2.6 years of the power spectrum between 1995 and 2005, which is statistically significant at a 95% confidence interval (Figure 7). The power spectrum of 8 years has been observed in 2000, which is not significant. The results indicate the inter-annual variability pattern of winter precipitation over Nepal, which can be associated with ENSO. The 1–2 years of the periodicity of power spectrum was observed in the years 1982/1983 and 1991/1992 that is linked with ENSO in winter westerly disturbance in the western Himalayas (Cannon et al., 2014). The decadal variability of a signal has been observed in 2000, which can be linked with AO. The previous study shows a 2–7 years variability pattern is associated with the influence of ENSO, while the longer duration of 7–12 years to AO/NAO (Torrence and Compo, 1998; Mpeta and Jury, 2001; Dieppois et al., 2016).
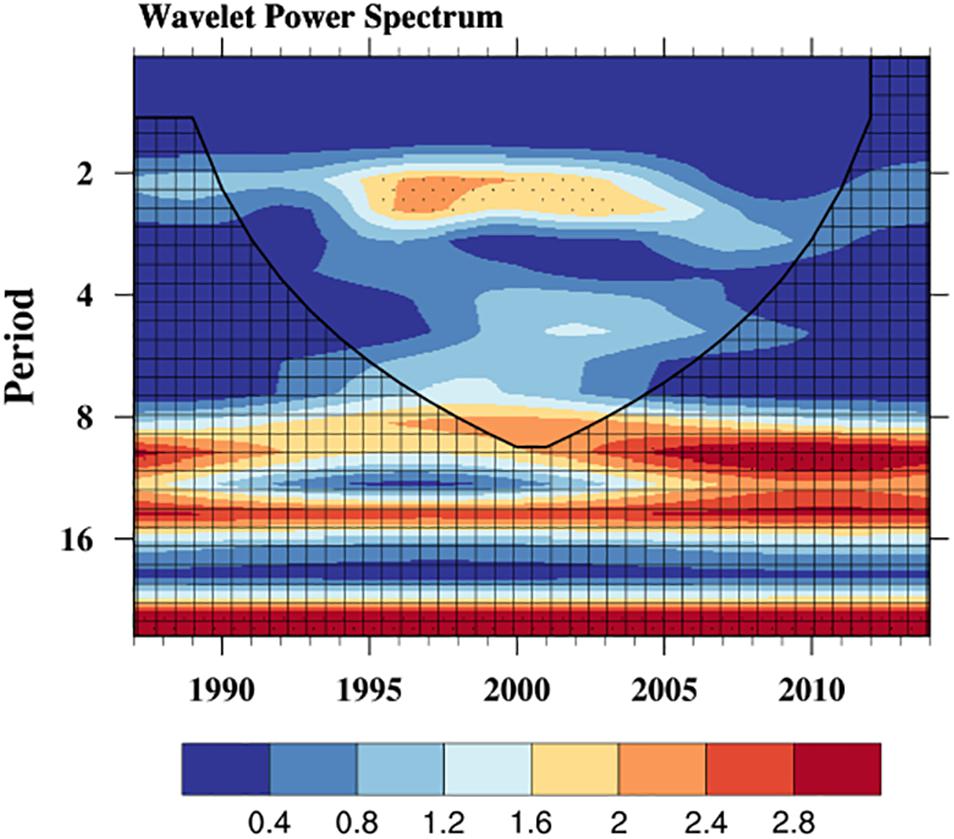
Figure 7. The wavelet power spectrum for the winter season from 1987 to 2015 using the Morlet wavelet method. The shaded color denotes wavelet power. The hatched area delimits the “cone of influence,” which influenced by edge effect. The dotted points represent the significant at a 95% confidence interval.
Circulation Anomaly Associated With Dry and Wet Years
The composites of precipitation anomalies during dry and wet years are shown in Figure 8. The dry year composite (Figure 8A) has significant negative anomalies all over the country with strong negative loading in the western and central regions, which coincides with the dominant mode of EOF1, as in Figure 4A. The converse pattern was observed in the wet years (Figure 8B). To understand the reason for negative and positive anomalies of precipitation over Nepal, Figures 9A,B was produced to show a composite of OLR of dry and wet years. Precipitation has a close inverse relation with OLR in tropical and subtropical areas (Shen et al., 2017). In a dry (wet) year, positive (negative) anomalies are observed over Pakistan, northern India, Nepal, and TP. Similarly, positive and negative OLR appeared over the Bay of Bengal region in wet and dry years, respectively. The high (low) values of OLR indicate lower (higher) cloud tops and consequent less (more) precipitation in the dry (wet) years (Ngarukiyimana et al., 2018). Moreover, vertical velocity explains the sinking and rising characteristics of clouds (Wang L. et al., 2015). The composite of vertical velocity anomalies at 500 hpa for the dry and wet years is presented in Figures 9C,D. Negative anomalies have been observed in Afghanistan, Pakistan, and northern India in wet years whereas positive anomalies during dry years. This pattern is not clear over the TP region. There are significant positive anomalies of vertical velocity at 500 hpa across the east-west of the country (79–90°E) favoring a strong subsidence motion, pointing toward a deficit precipitation amount (Figure 9C). The converse pattern was observed in wet years, i.e., negative vertical velocity anomalies over the study region; suitable for convection which results in enhanced precipitation (Figure 9D). The negative values of vertical velocity enhance the convective activity over the Indo-Pakistan region and produce a significant area of precipitation (Ahmed et al., 2019).
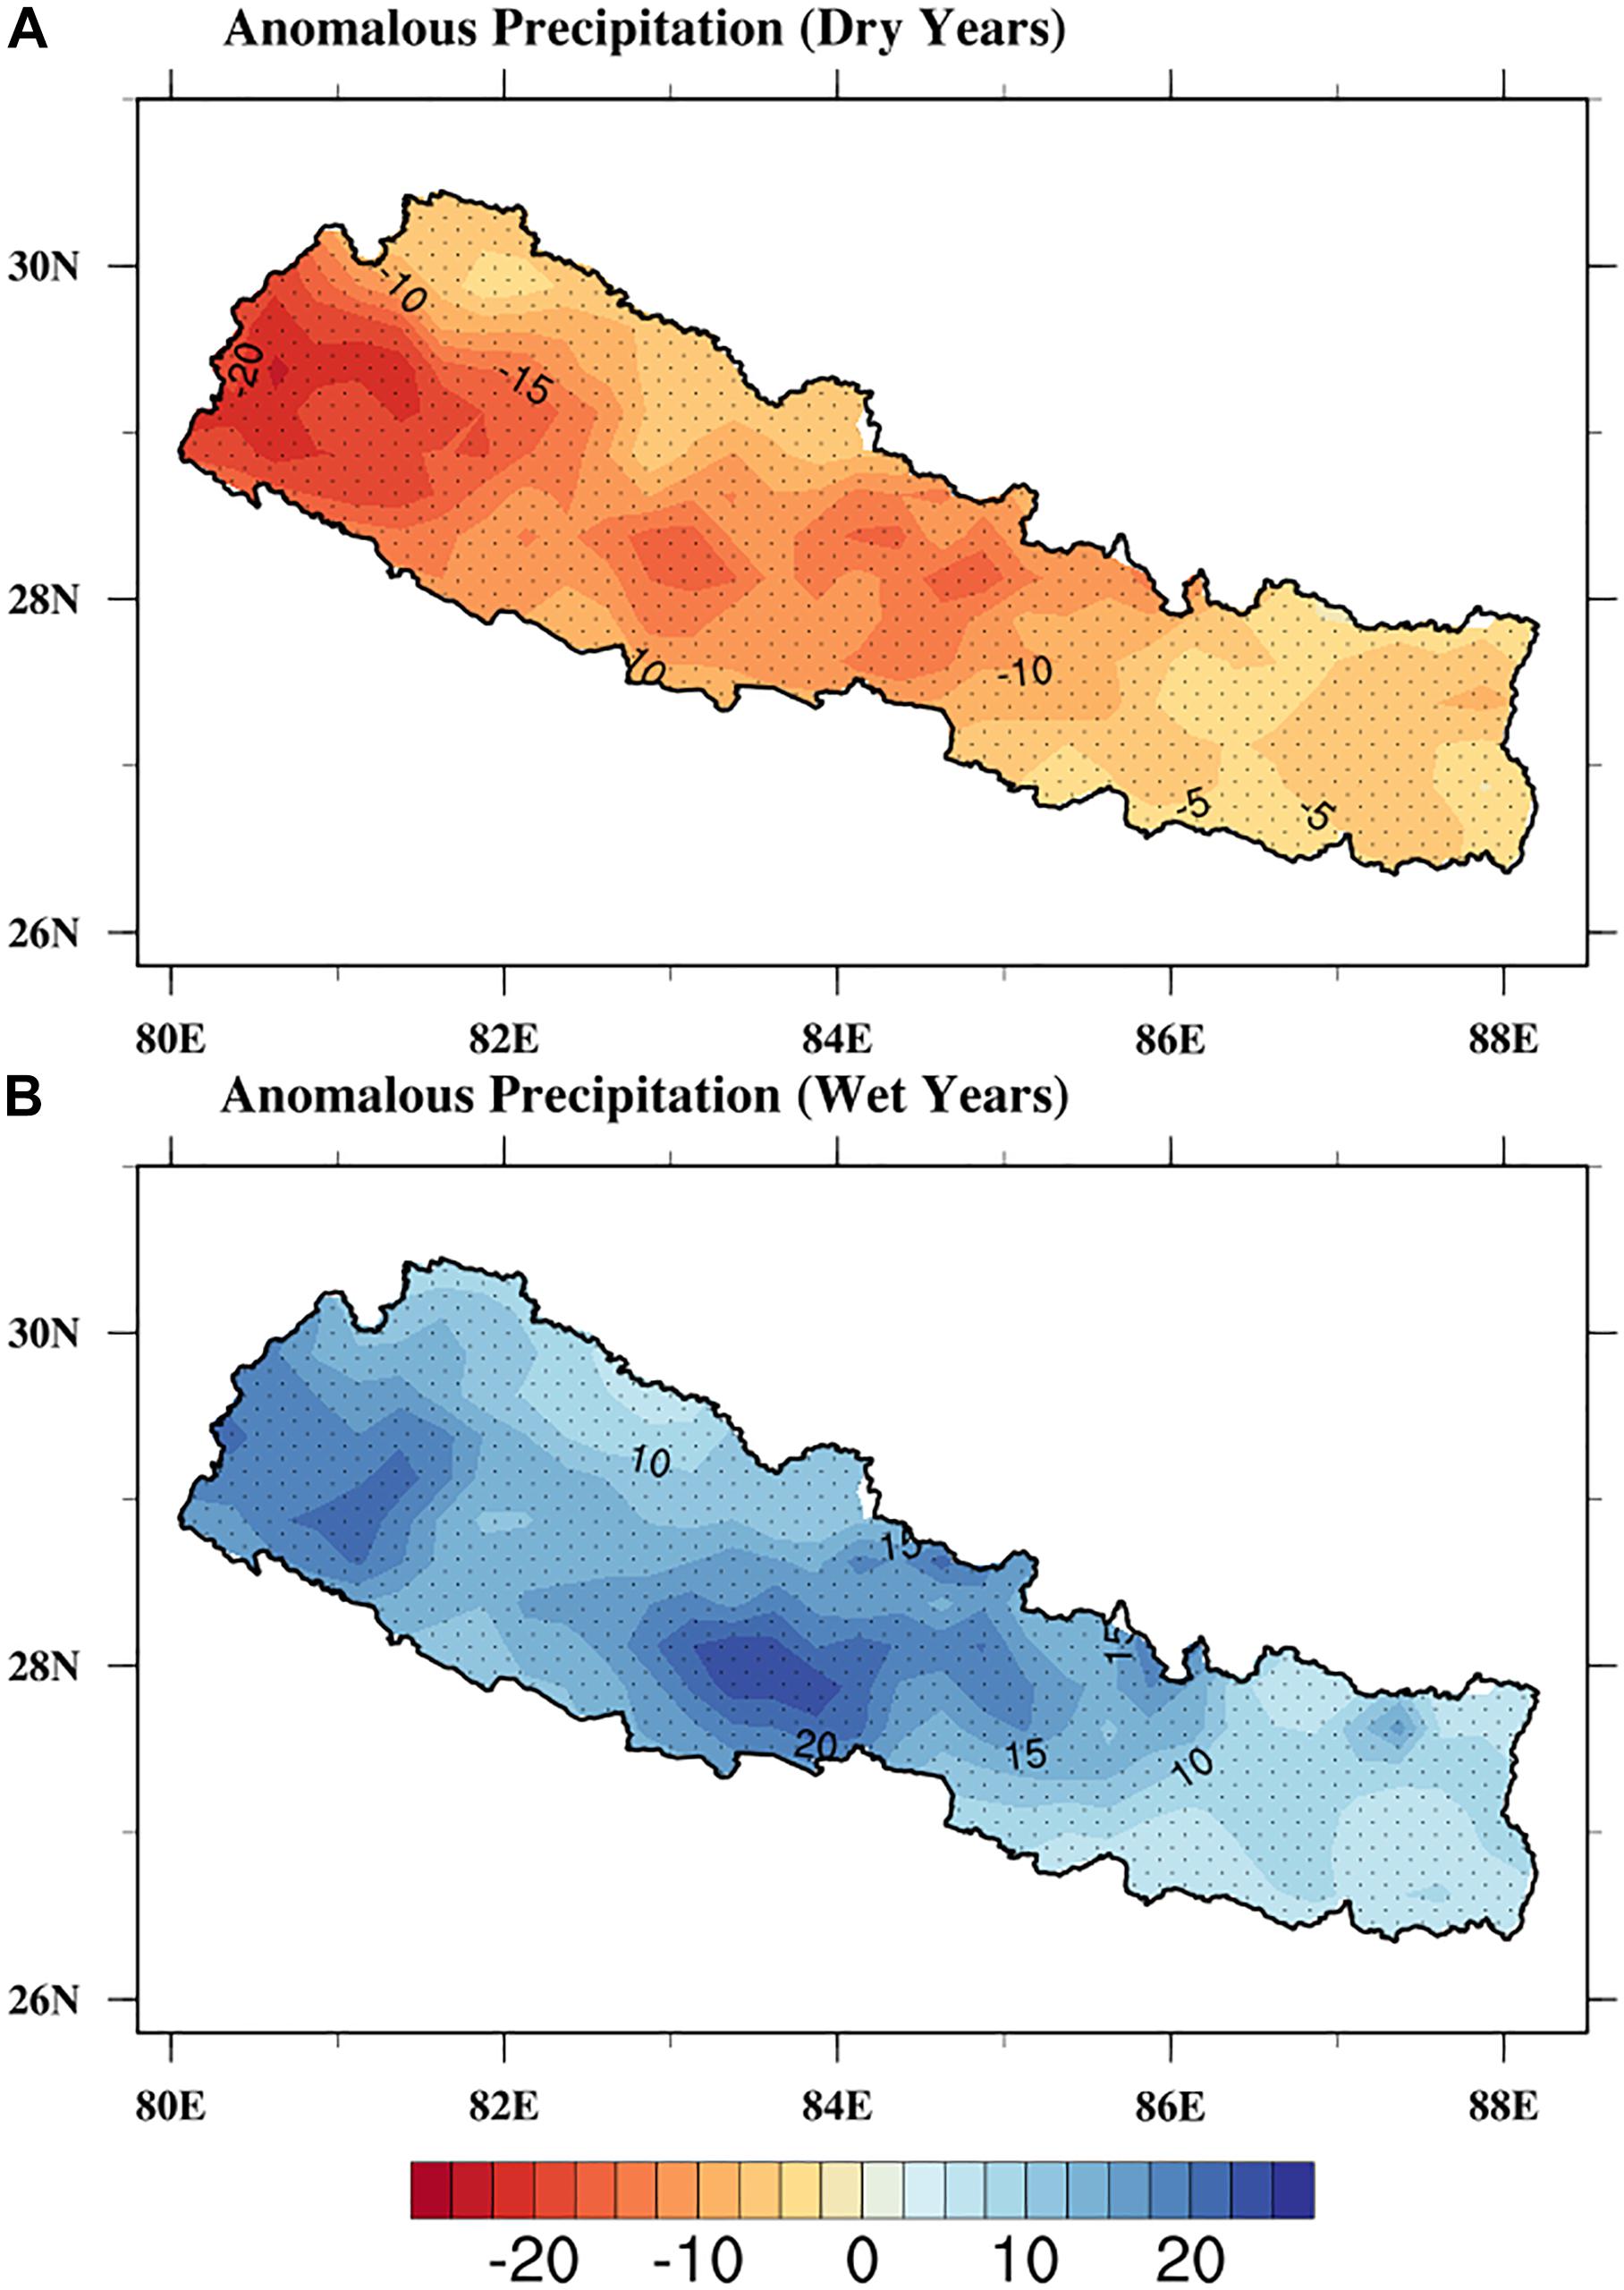
Figure 8. Composite precipitation anomalies (mm/month) for (A) dry years and (B) wet years based on APHRODITE data between 1987 and 2015. The dotted points represent the significance at a 95% confidence level.
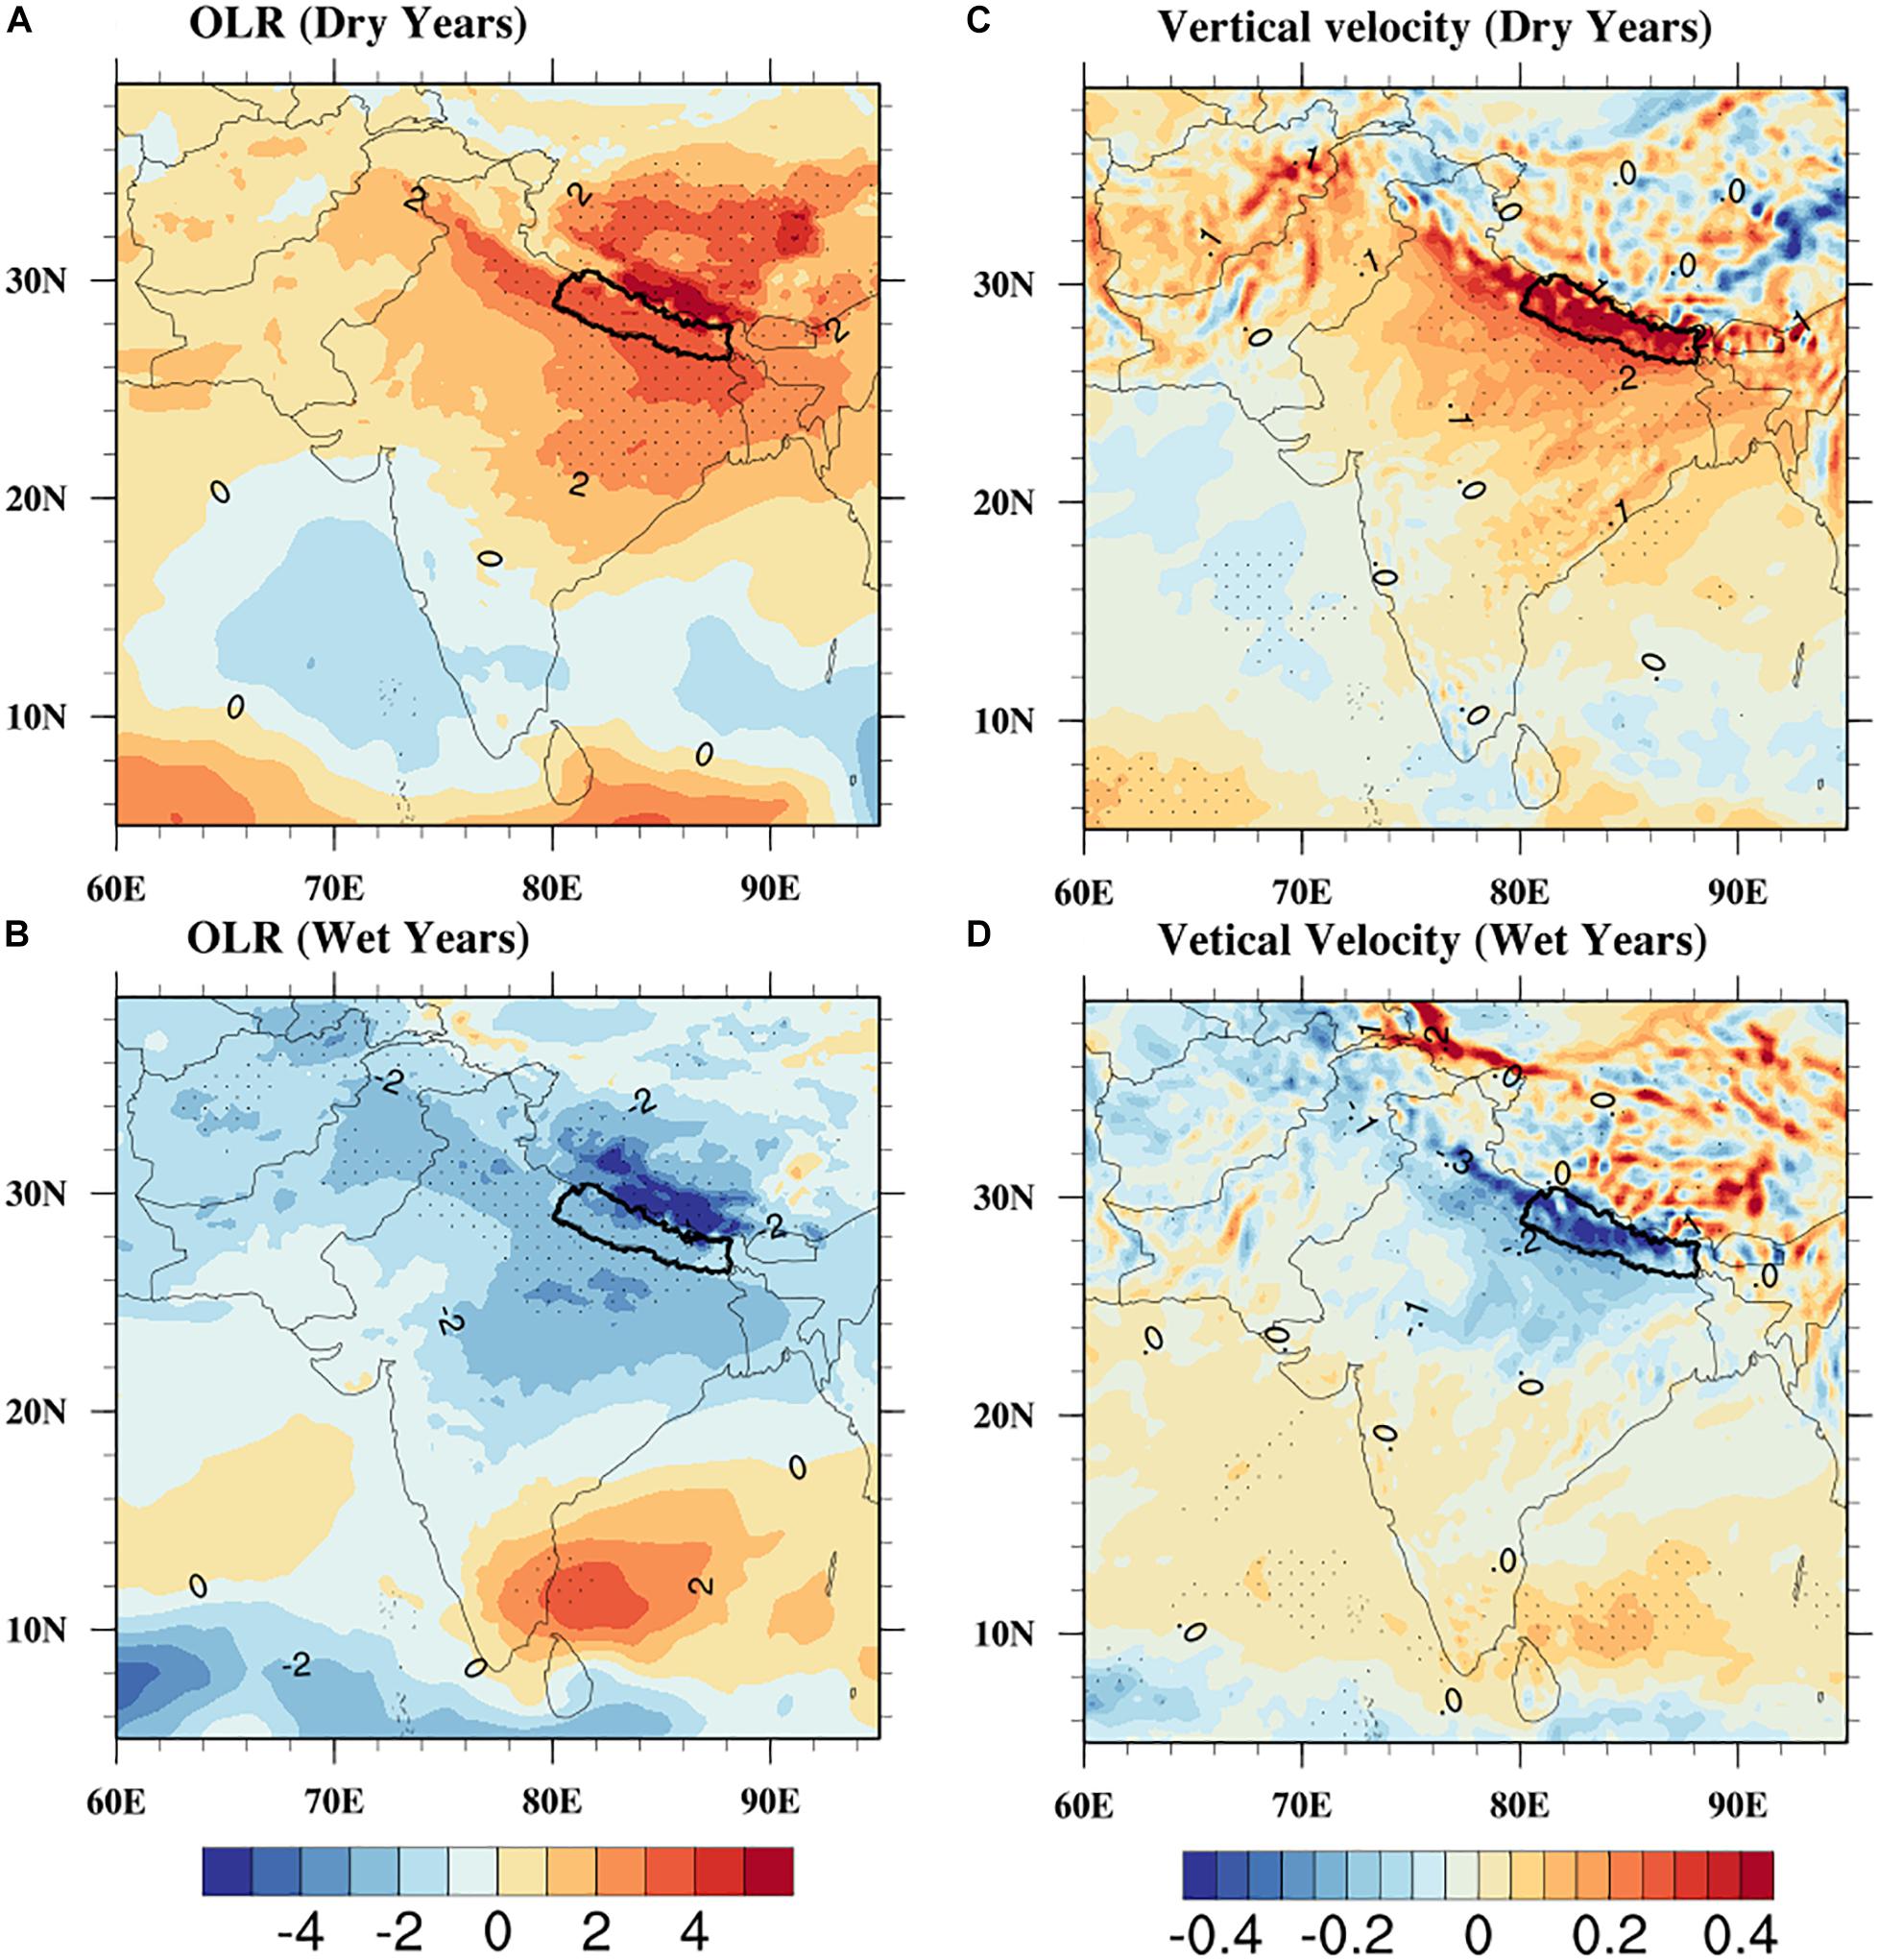
Figure 9. Composite OLR anomalies (10−5, W/m2) for (A) dry years, (B) wet years, and Vertical velocity (10, Pas–1) for (C) dry years, and (D) wet years based on ERA5 reanalysis data during 1987–2015. The dotted points represent the significance at a 95% confidence level.
The WDs enters Nepal following the route of Iran, Afghanistan, Pakistan, and northwest India. They are fast-moving air-currents that get intensified and captured by topography and orography of South Asia (Lang and Barros, 2004). The wind plays a significant role in carrying and supplying moisture to the migratory WDs (Yadav et al., 2013). Figures 10A,B displays the wind vector calculated from zonal and meridional components of Wind at 850 hPa during the dry and wet years, respectively. Analysis reveals that the stronger northwesterly wind anomalies are associated with a rainfall deficit in Pakistan, northern India, and Nepal (Figure 10A). Figure 10B shows opposite characteristics, indicating a strengthening of the southwesterly wind vectors during the wet years. By comparing, the wind flow patterns at 850 hpa, it is evident that cyclonic circulation persists at 15–30°N during wet years, whereas, the anticyclonic circulation is observed during dry years. The southwesterly winds anomalies are entered from the Arabian Sea (10–20°N). It is similar to the previous finding that, the westerly winds that originate from the Arabian Sea carry moisture to Nepal in the winter season (Sigdel and Ikeda, 2012). However, Figures 10C,D represents the vertically integrated moisture transport and wind vectors during wet and dry years calculated from surface pressure level (1000 hpa) to the top of the atmosphere (200 hpa) in this study during 1987–2015. The moisture transport during wet and dry cases show a clear difference in magnitude, the direction of the wind, and a way of moisture transport to the study area. In the dry years, the positive anomalous moisture (divergence) dominates over the study region (Figure 10C). In contrast, the negative anomalous moisture (convergence) is dominant over the western Himalayas and Nepal (Figure 10D). The central part of India (around 15–20°N) also shows intense convergent/divergent fluxes. An anomalous cyclonic (anticyclonic) circulation persists over the northern India and Pakistan during wet (dry) years (Figures 10C,D). The previous study reported that such circulations enhance (reduce) the supplements of moisture from nearby seas in the study region (Dimri, 2013b).
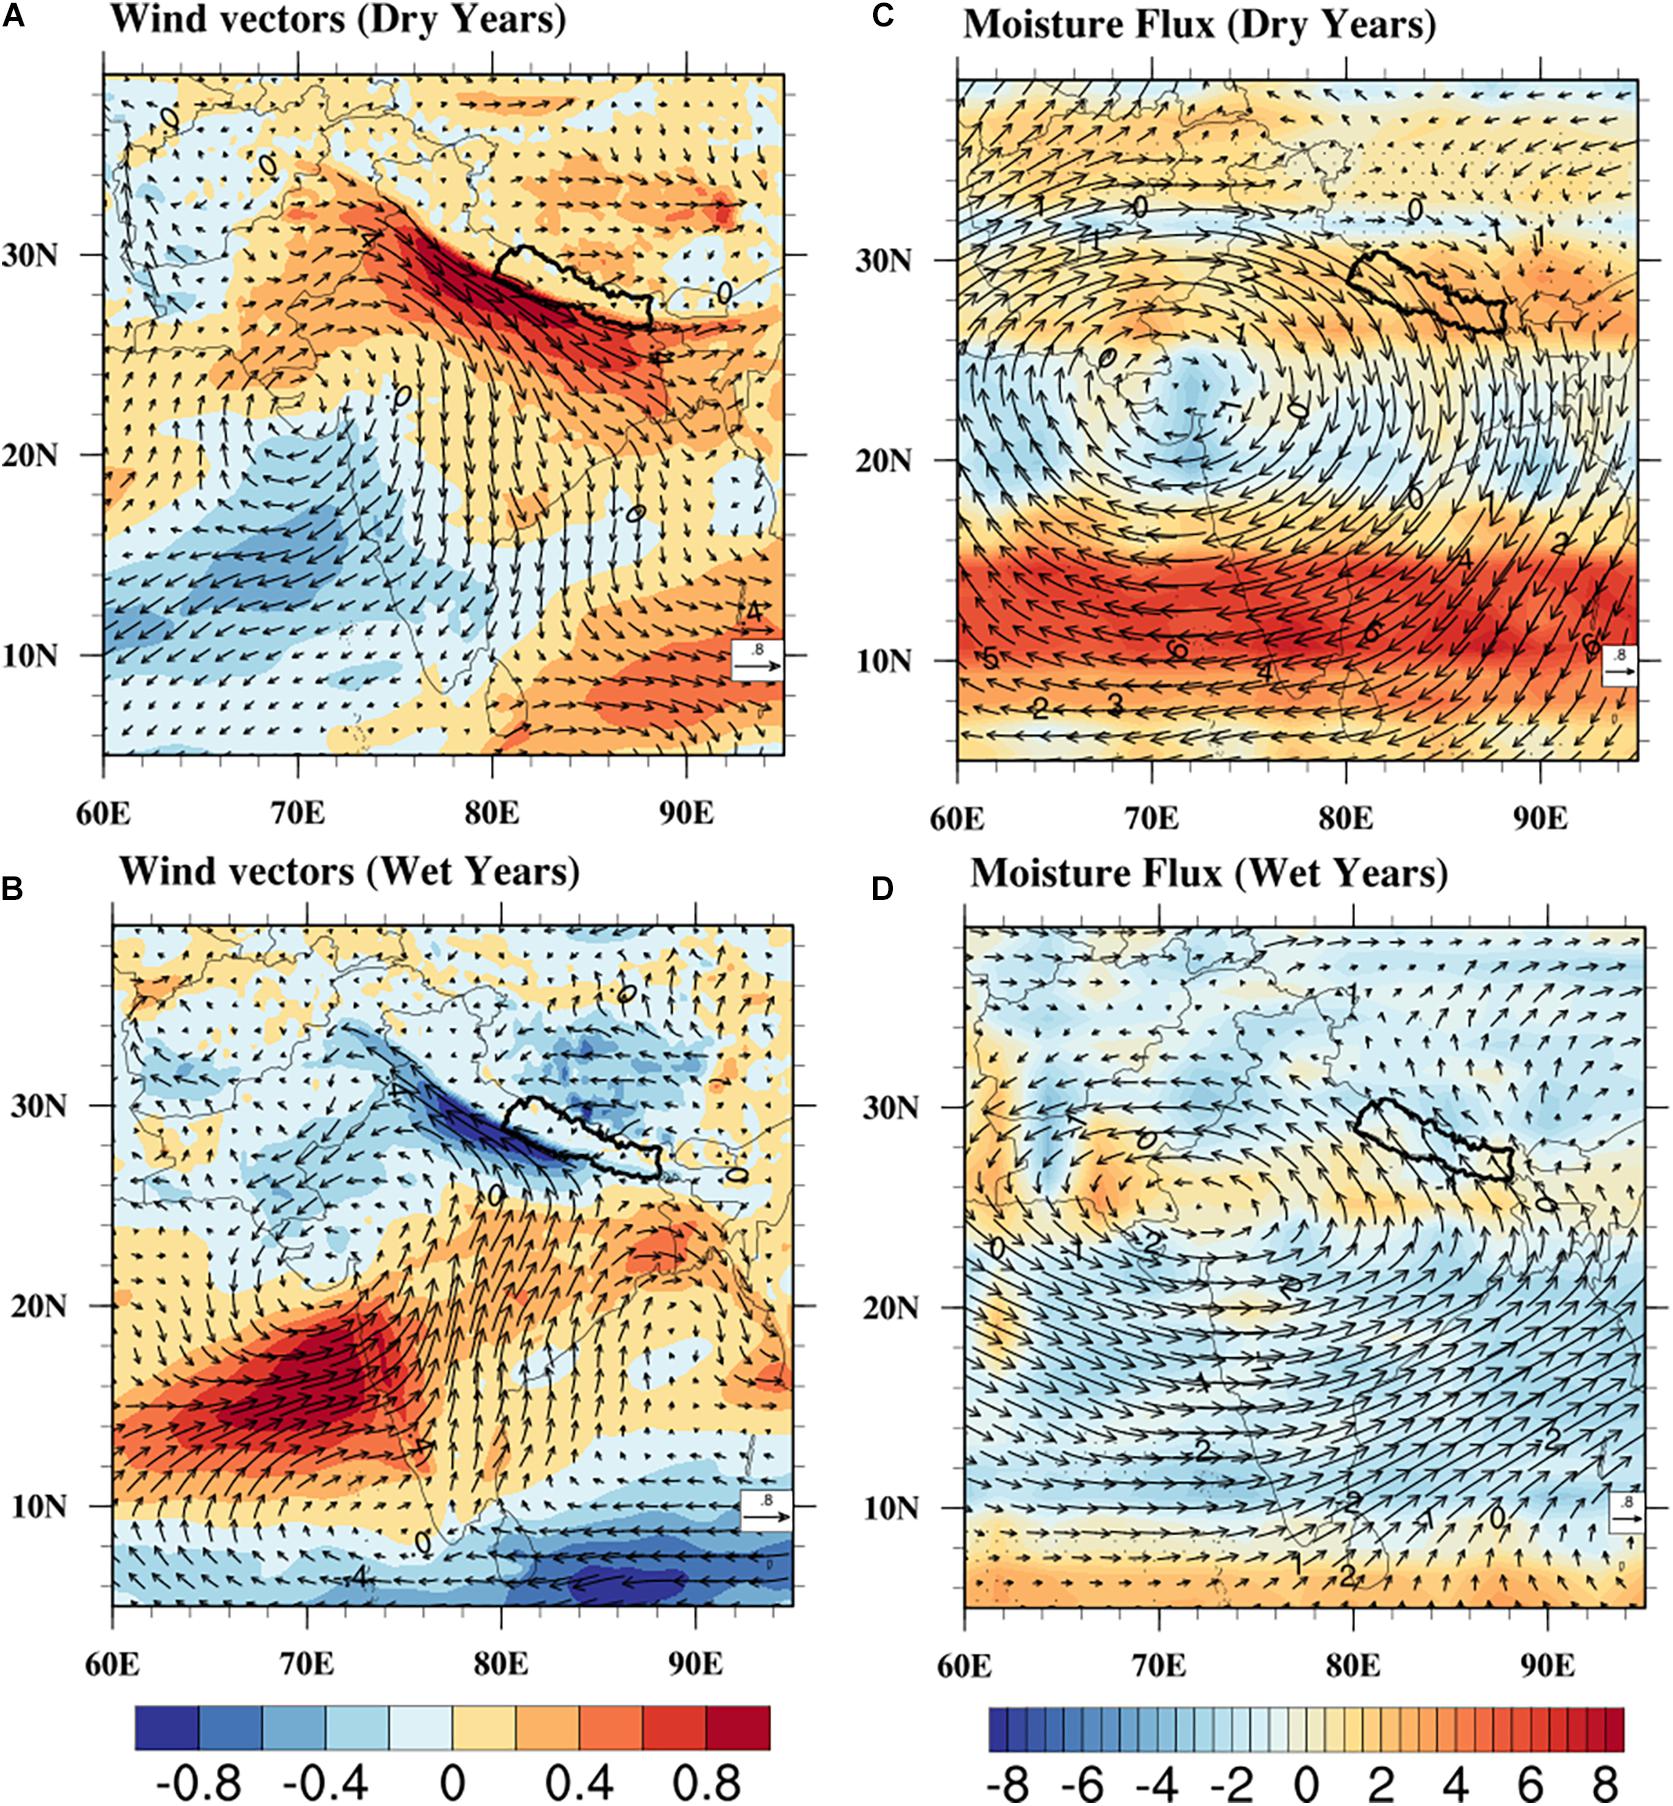
Figure 10. Wind anomaly vectors (ms–1) at 850 hPa (shading indicates the zonal component of wind anomalies) for (A) dry years, (B) wet years. Vertically Integrated Water Vapour Flux (10–5, kg m−2 s–1, the shading indicates negative anomalies convergence and positive anomalies divergence) for (C) dry years, and (D) wet years based on ERA5 reanalysis data from 1987 to 2015. The dotted points represent the significance at a 95% confidence level.
Air temperature is a useful parameter for determining extreme conditions. The strong positive anomalies of air temperature are observed over Nepal, India, Pakistan, and TP region during dry years (Figure 11A). In contrast, the strong negative anomalies are observed over TP, northern India, and Nepal during the wet years (Figure 11B). It is reported there is a significant negative and positive correlation of winter precipitation of Nepal with TP and IO, respectively (Supplementary Figure S1). Similarly, Dimri (2014) also presented the opposite relationship between air temperature and winter precipitation in the Himalayas. Himalayas and TP play an important role in the modification of the westerly system and moisture transport (Ahmed et al., 2019). The cooling over the TP region and warming over the IO corresponds to south-north transport of moisture, resulting in positive precipitation anomalies over the study region (Figure 8B) during winter. The results of this study are in good agreement with a previous study (Dimri, 2013a). Moreover, the heating and cooling of TP can affect the atmospheric circulation and large–scale teleconnections in the different seasons. For instance, TP loses its latent heat strength during the springtime; a reason for reduced precipitation along the southern and eastern slopes of the TP and increased area over northeastern India and Bay of Bengal (Duan et al., 2012). The decrease in summer precipitation trends is observed in Nepal because of the accelerated warming in the Hindu-Kush Himalayan and TP (Krishnan et al., 2019; Pokharel et al., 2019). Furthermore, the negative anomalies of relative humidity dominate at 850 hPa widely in the study area during the dry years (Figure 11C). In wet years, positive humidity anomalies are created over Nepal (Figure 11D). The humidity patterns inversely correspond with air temperature patterns in the study region. The higher temperatures are often associated with water-deficient conditions, whereas lower temperatures are associated with wet conditions (He et al., 2015). The temperature variability over the TP has a strong relation with winter precipitation over Nepal.
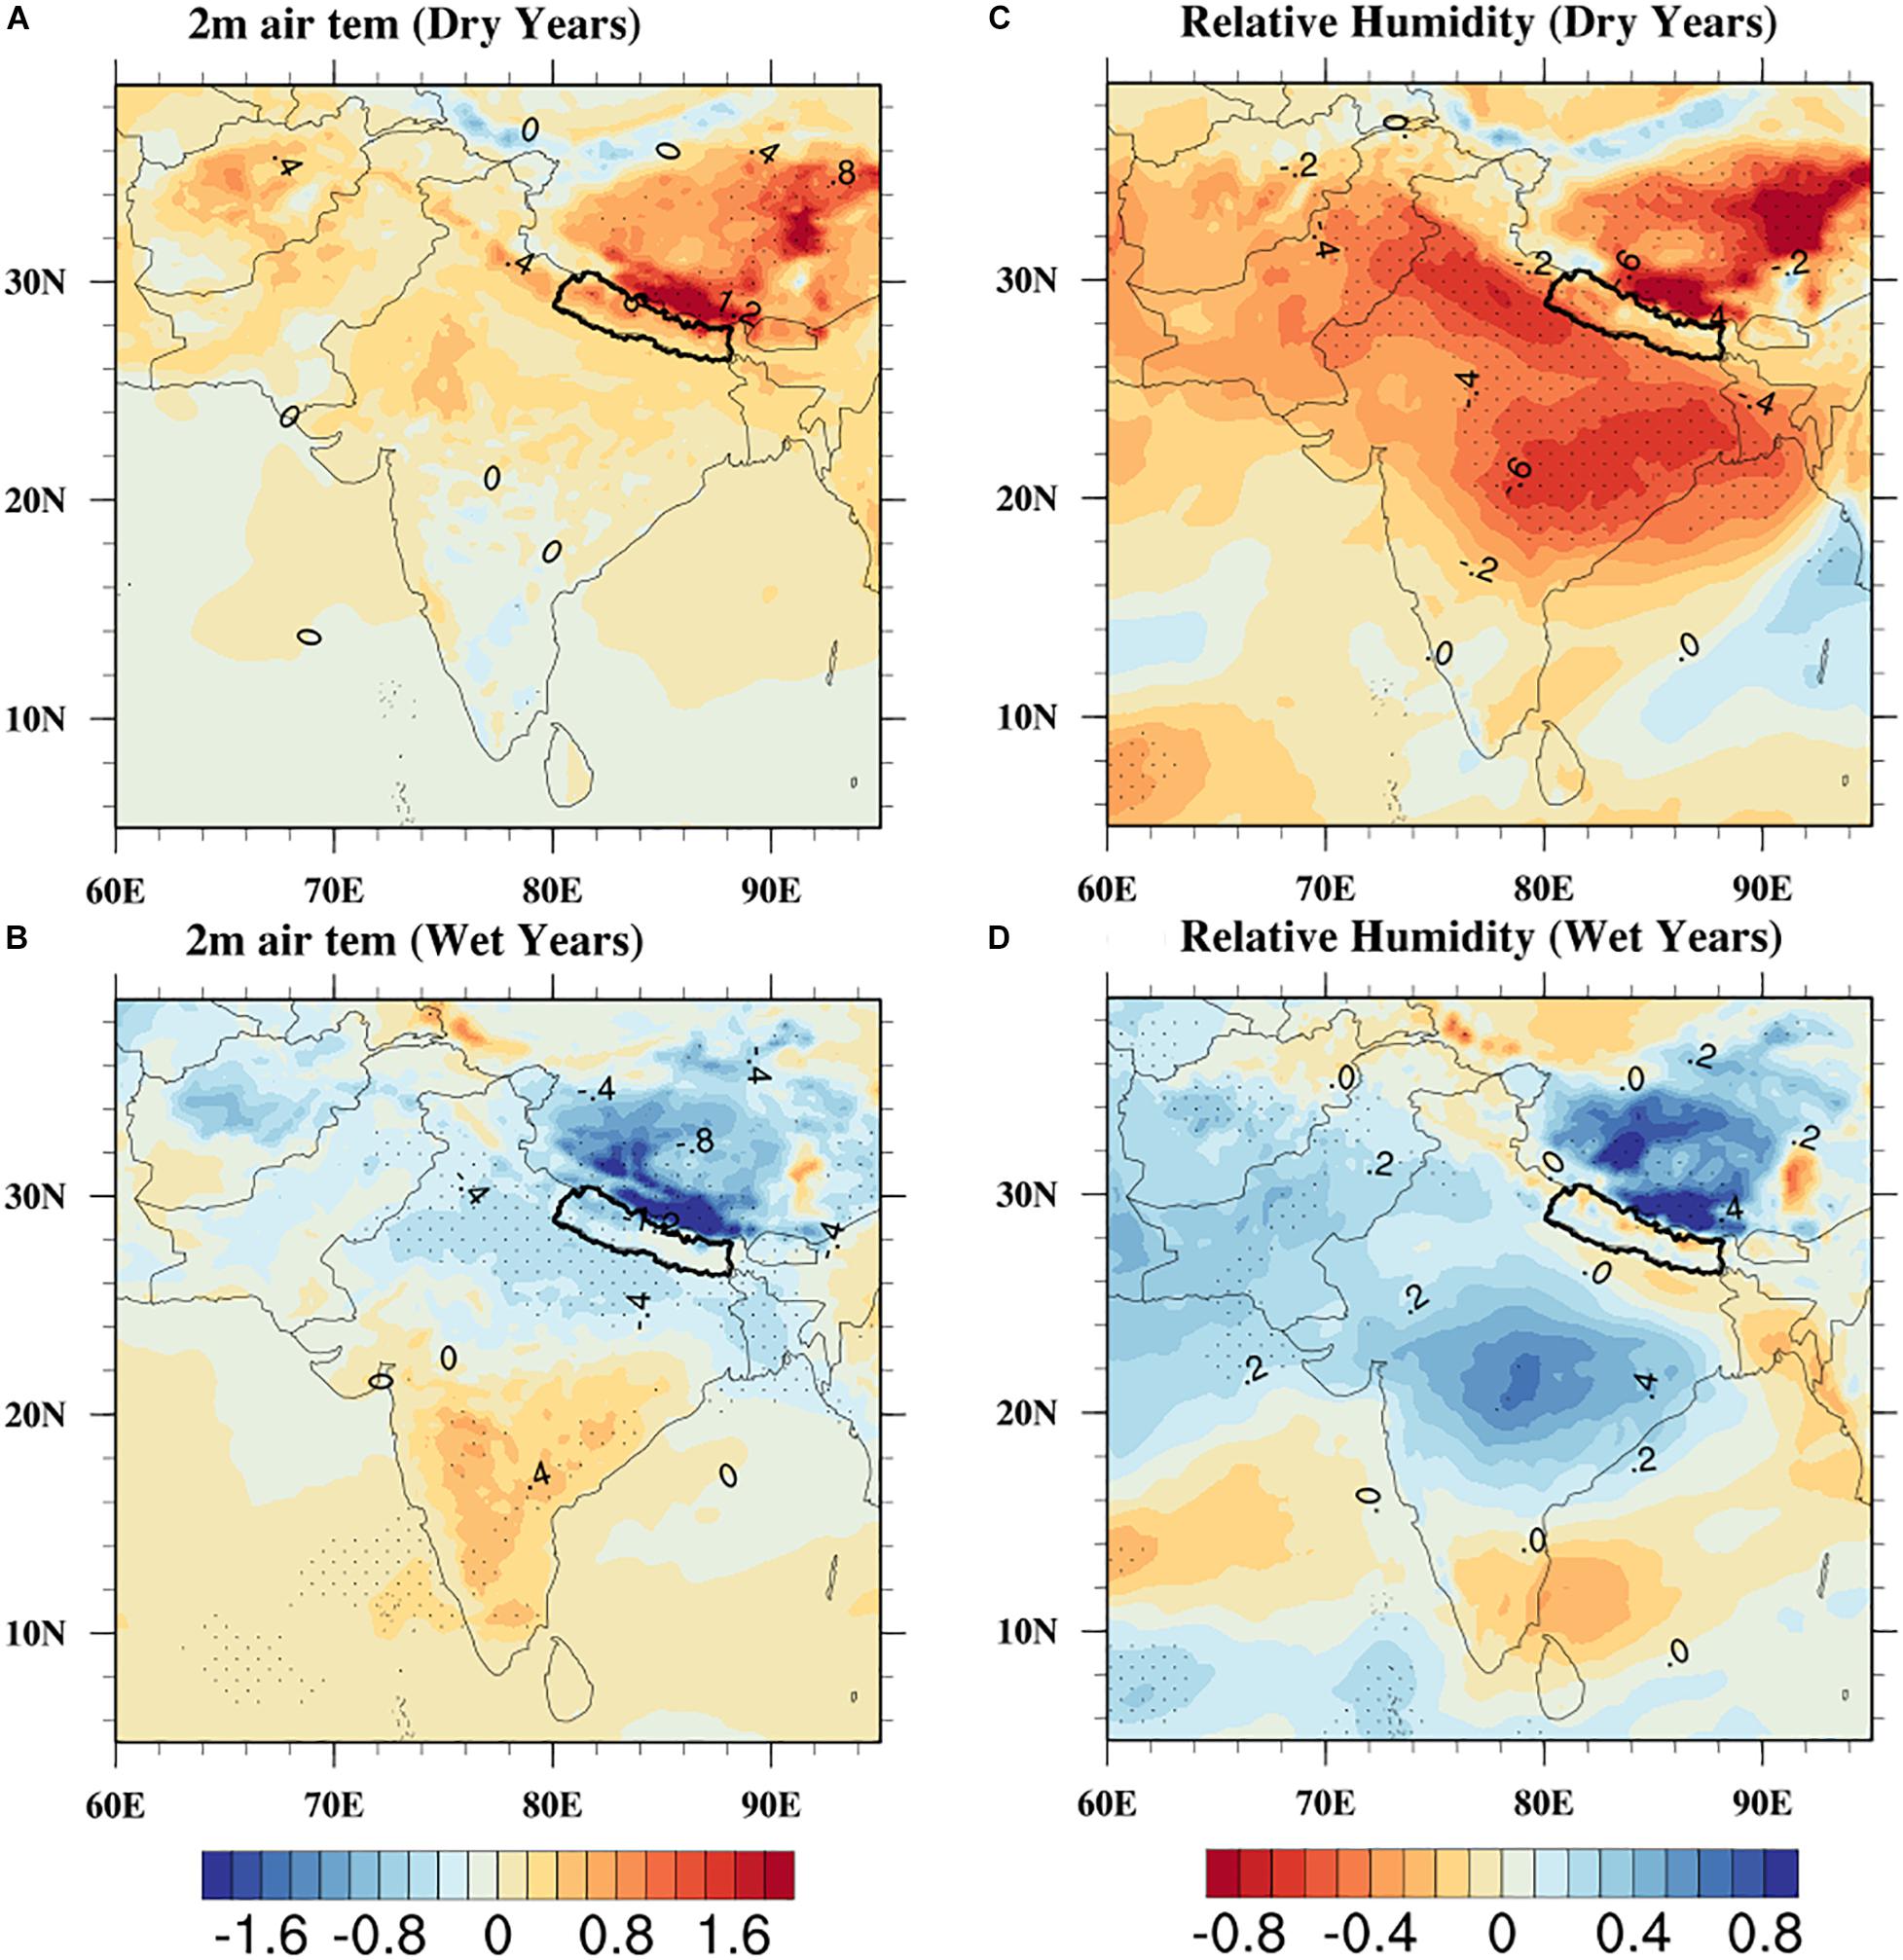
Figure 11. Composite 2 m surface air temperature (°C) for (A) dry years, (B) wet years, and relative humidity (10–1, %) during (C) dry years, and (D) wet years based on ERA5 reanalysis data from 1987 to 2015. The dotted points represent the significance at a 95% confidence level.
Relation With Ocean
Previous studies focus on a large part of the climate and weather predictability linked to the ocean, while a small portion is linked with inter-atmospheric variability (Saha et al., 2011; Syed and Kucharski, 2016). The lagged correlation between detrended winter precipitation and SST for 29 years (1987–2015) is presented in Figure 12, to observe the dependency of winter precipitation on large scale global force. From previous spring (Figure 12B), relations with eastern equatorial warming start to build up and the area of significant correlation increases in summer and fall (Figures 12C,D). By season approaches (winter), warming covers a large portion of the eastern equatorial Pacific (Figure 12E). The small patches of negative SST anomalies are found over the western equatorial Pacific. It gives the characteristics of ENSO. Furthermore, from the previous summer onwards, a positive correlation (warming) with the IO starts to build up (Figure 12C). However, the more substantial portion of significant correlation is evident only when it reached the fall (Figure 12D). The negative anomalies of the western Pacific extend into the eastern Tropical Indian Ocean (TIO) and northern Australia. The strong warm SST in the western TIO and a small portion of cold SST in the eastern TIO give the characteristics of the IOD pattern (Figure 12D). By the time, when the warming in the eastern equatorial Pacific reaches its peak phase, eastern TIO is replaced by western TIO with warm SST. Moreover, warming becomes vivid and strong over the whole basin in the study season. The finding is quite interesting as IOBM may have an impact on the winter precipitation of Nepal (Figure 12E). The oceanic wave dynamics involves in the evolution of IOBM from IOD as Rossy waves propagating westward reflects Kelvin waves in the eastern TIO, it would help to damp negative SST to positive SST (Yu et al., 2005; Wu et al., 2012).
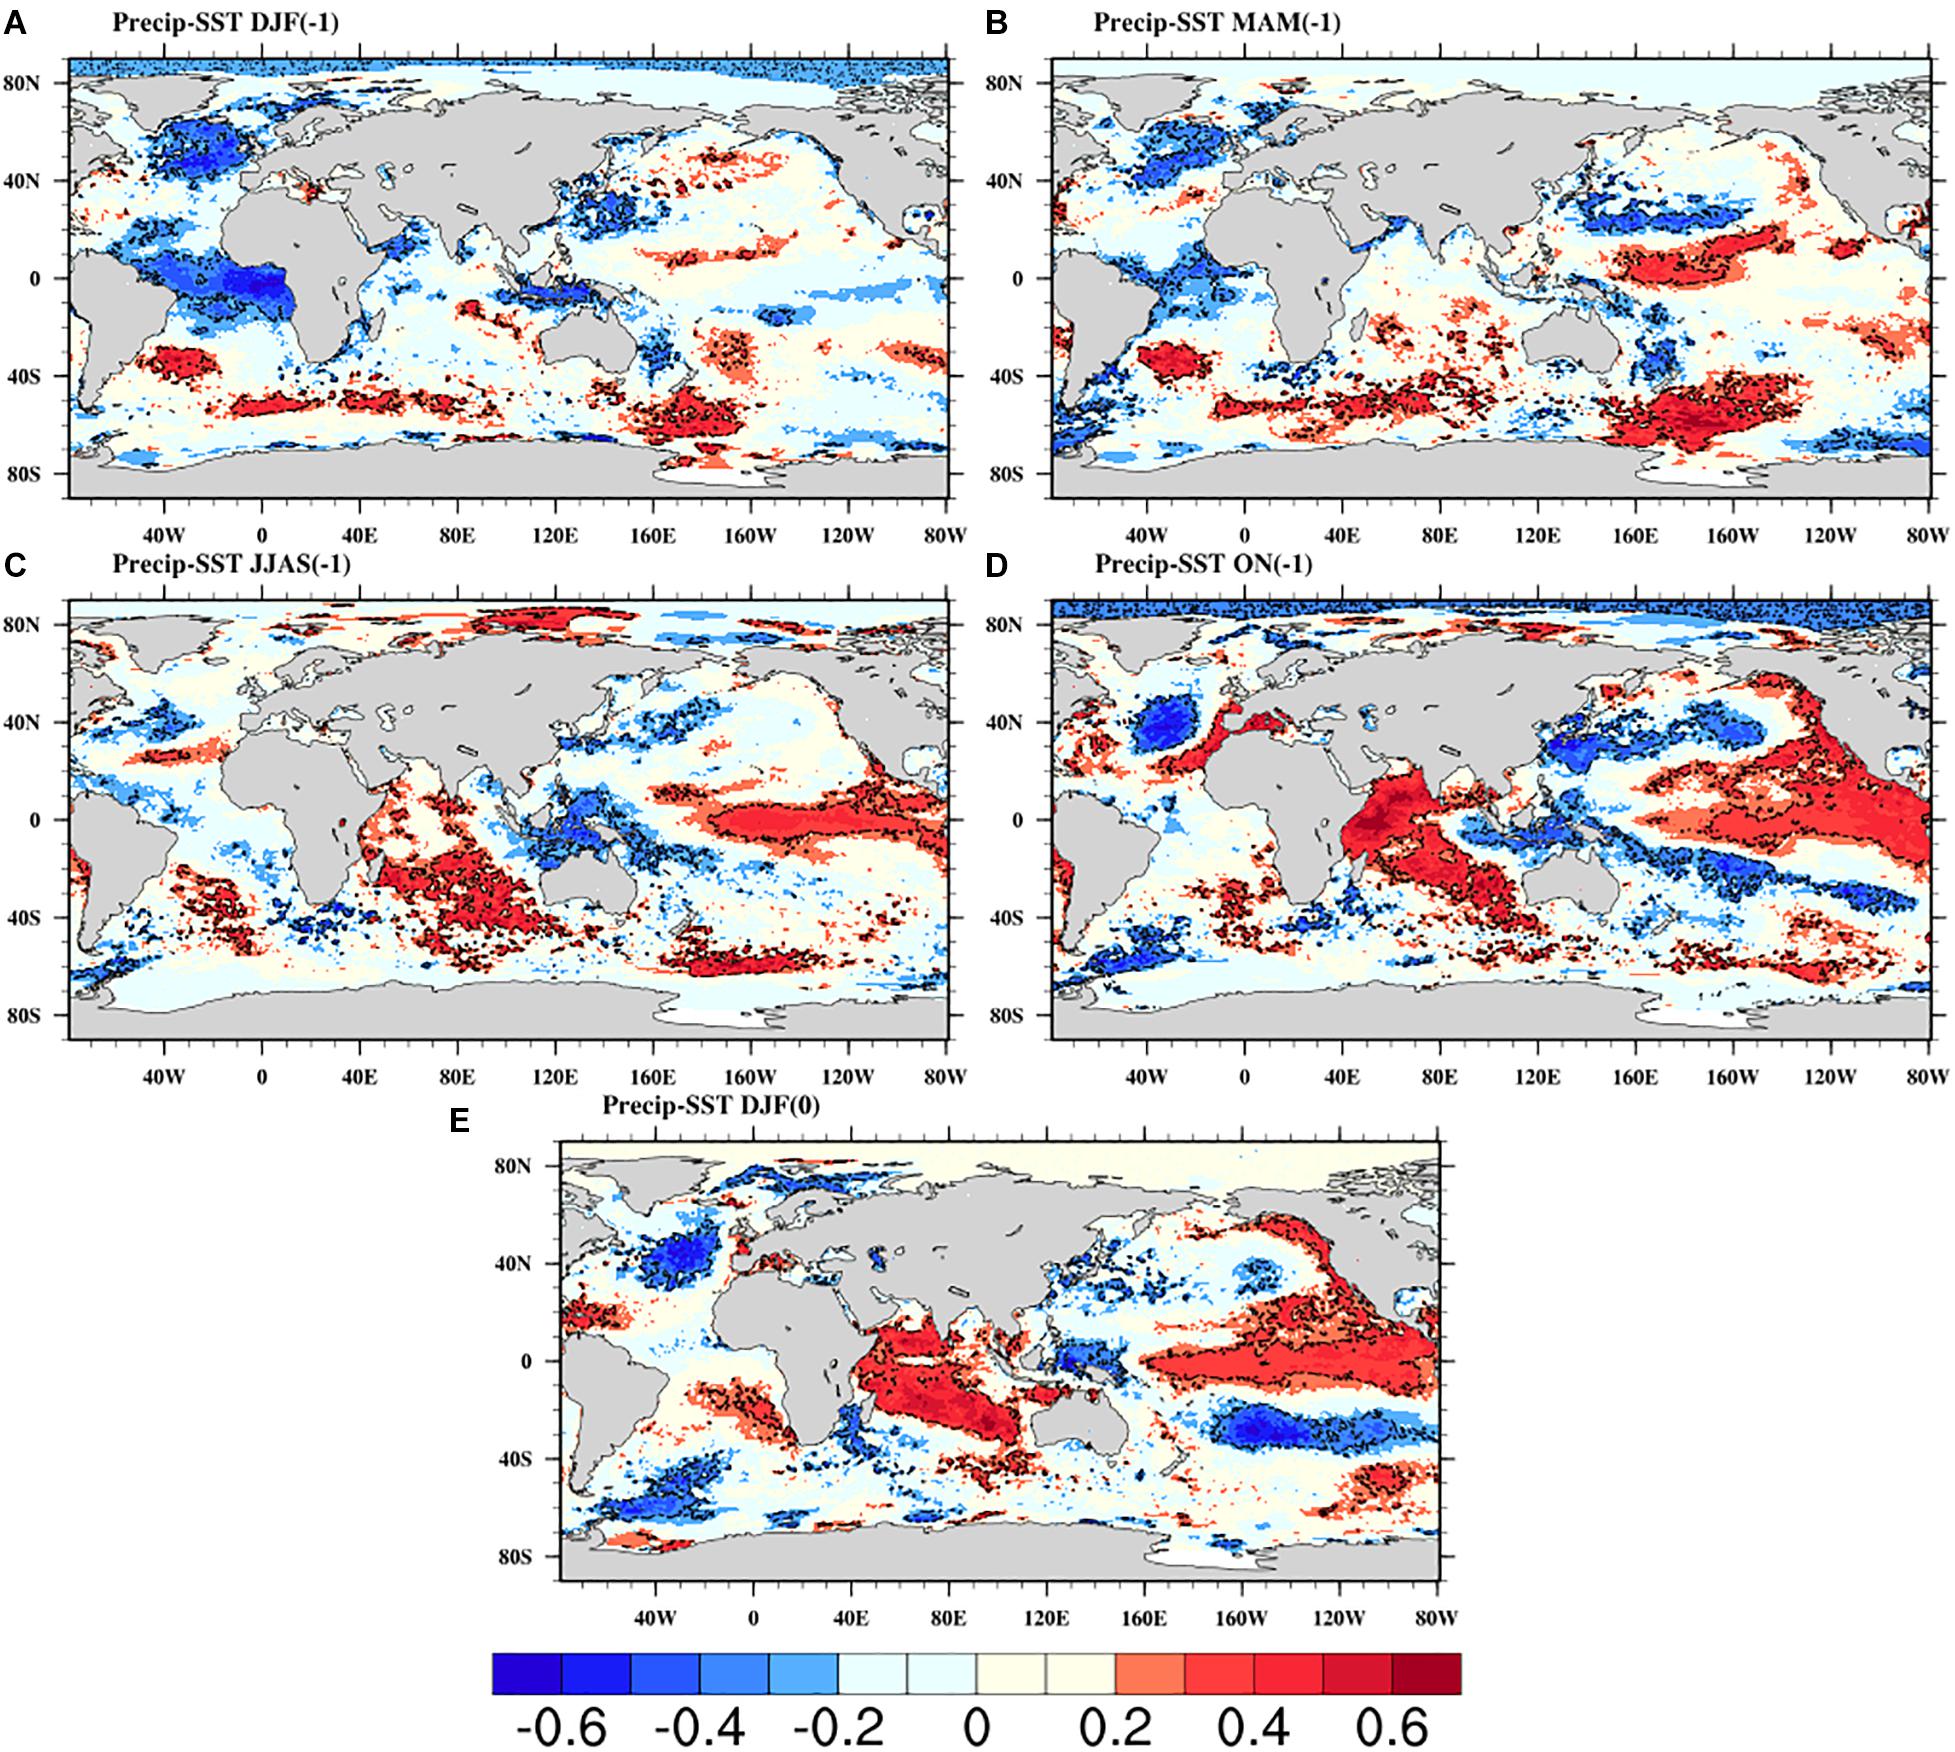
Figure 12. Correlation between averaged winter precipitation and SST during 1987–2015 (A) DJF(−1), (B) MAM(−1), (C) JJAS(−1), (D) ON(−1), (E) DJF(0), respectively. −1 and 0 represents lag and corresponding season, respectively. The black dotted contours represent the significance at a 95% confidence level.
NINO3.4, IOBM, and DMI are the indicators of SST over the PO and the IO. The influence of the ENSO signals on precipitation can persist from year to year (Li and Zhao, 2019). So, the lagged relationship between winter precipitation, NINO3.4, IOBM, and DMI between 1987 and 2015 was calculated (Table 2). The robust relation of winter precipitation is observed with the summer, fall, and winter’s NINO3.4. However, the concurrent response of NINO3.4 to winter precipitation for the study period is 0.40 (p < 0.05). The results also demonstrate that the increased precipitation over Nepal is associated with above-normal SST in the equatorial eastern PO (Figure 12E). It suggests that during the warm phase of ENSO, more rainfall is expected due to enhanced southwesterly winds (Tippett et al., 2003). The wind circulation pattern (Figures 10A,B) is affected during La Nina (El Nino) events; that involves northwesterly (southwesterly) moisture transport (Figures 10C,D) which brings below (above) normal precipitation (Figures 8A,B) over the study region (Mariotti, 2007; Dimri, 2013b). Also, ENSO affects the vertical baroclinic response over the Himalayan region and TP (as suspected in Figures 9C,D), which induces the WDs (Yadav et al., 2010; Yadav et al., 2013; Dimri, 2013a).
The concurrent response of DMI to winter precipitation for the period of 1987 to 2015 is positive; however, it has an insignificant correlation of 0.18. The fall DMI (r = 0.41, p < 0.05) is a clear indicator for the forecast of the following year’s winter precipitation over Nepal. An earlier study mentioned that the positive (negative) mode of IOD is favorable (unfavorable) for precipitation over South peninsular India and Pakistan (Kripalani and Kumar, 2004; Hussain et al., 2016).
The significant correlation between fall and winter IOBM with winter precipitation during the study period was 0.44 and 0.50, respectively. The result suggests that warming of the IO can prolong or delay the influence of ENSO on winter precipitation (Yang et al., 2007). These results are in good agreement with a study conducted over the region of North China, Xinjiang (Lu et al., 2019). Furthermore, the increased rainfall over the study area is associated with above-normal SST in the equatorial central PO and IO, which heightened the response of the Walker and Hadley Circulation (Wang et al., 2013; Dimri, 2013a). The warm SST over the IO intensifies the convention that helps in shifting the Subtropical Westerly Jet (SWJ) to northern India (Yadav et al., 2013). The SWJ intensifies the WDs resulting in the excess precipitation over Nepal and northern India (Kar and Rana, 2014). The presence of the cyclonic circulation over 15–30°N (Figure 10B) helps in bringing moisture from the Arabian Sea and supplying to the migratory WDs. Furthermore, the cooling over TP and heating over IO (Figures 11B, 12E, and Supplementary Figure S1) correspond to the south-north transport of moistures to the study region. These phenomena for wet years which are reversible for the dry years.
The key finding is that warming and cooling in the PO and the IO is related to the interannual variability of winter precipitation in Nepal. The drought events are increasing in Nepal, mainly after 2000 (Wang et al., 2013; Adhikari, 2018). Therefore, the Walker circulation over the PO and IO for dry years (La Nina years) is present in Figure 13. The pattern observed in the given figure indicates that the equatorial Indo-pacific walker circulation is affected by ENSO. The dry years are related to negative SST over the eastern PO and the IO, whereas, positive SST over the western Pacific and maritime continent. The two cell Walker circulations were observed over the tropical IO and the tropical PO, with one ascending arm over the maritime continent and two descending arms over the IO and the eastern PO, respectively. Further, it shows the upper-level divergence of wind anomalies over the maritime continent and convergent over the IO and the eastern PO. The warming occurs in the TP region during dry years (Figure 11A), shows the upper-level divergence of wind anomalies (around 30°N 90°E, Figure 13). The pattern counteracts a suppressed response of Walker circulation over the Indian and Pacific regions. This phenomenon triggers the enhanced convective activity over the maritime continent. Further, suppressed convention and descending air masses over IO and anomalous anticyclonic circulation over the north of India (Figure 10C) reduces the moisture transport to the Himalayan region and Nepal. Moreover, it reduces the moisture supply to the migratory mid-latitude disturbance passing through it (Yadav et al., 2010; Yadav et al., 2013). The sinking (descending) atmospheric motion over the IO and rising (ascending) motion over the TP weaken the Hadley circulation (Figure 13) resulting in the dry years. These phenomena are reversible during El Nino years (wet years) as intensified Walker and Hadley circulation shows the enhanced upper-tropospheric meridional transport from the Southern Hemisphere to the Northern Hemisphere (Dimri, 2013a).
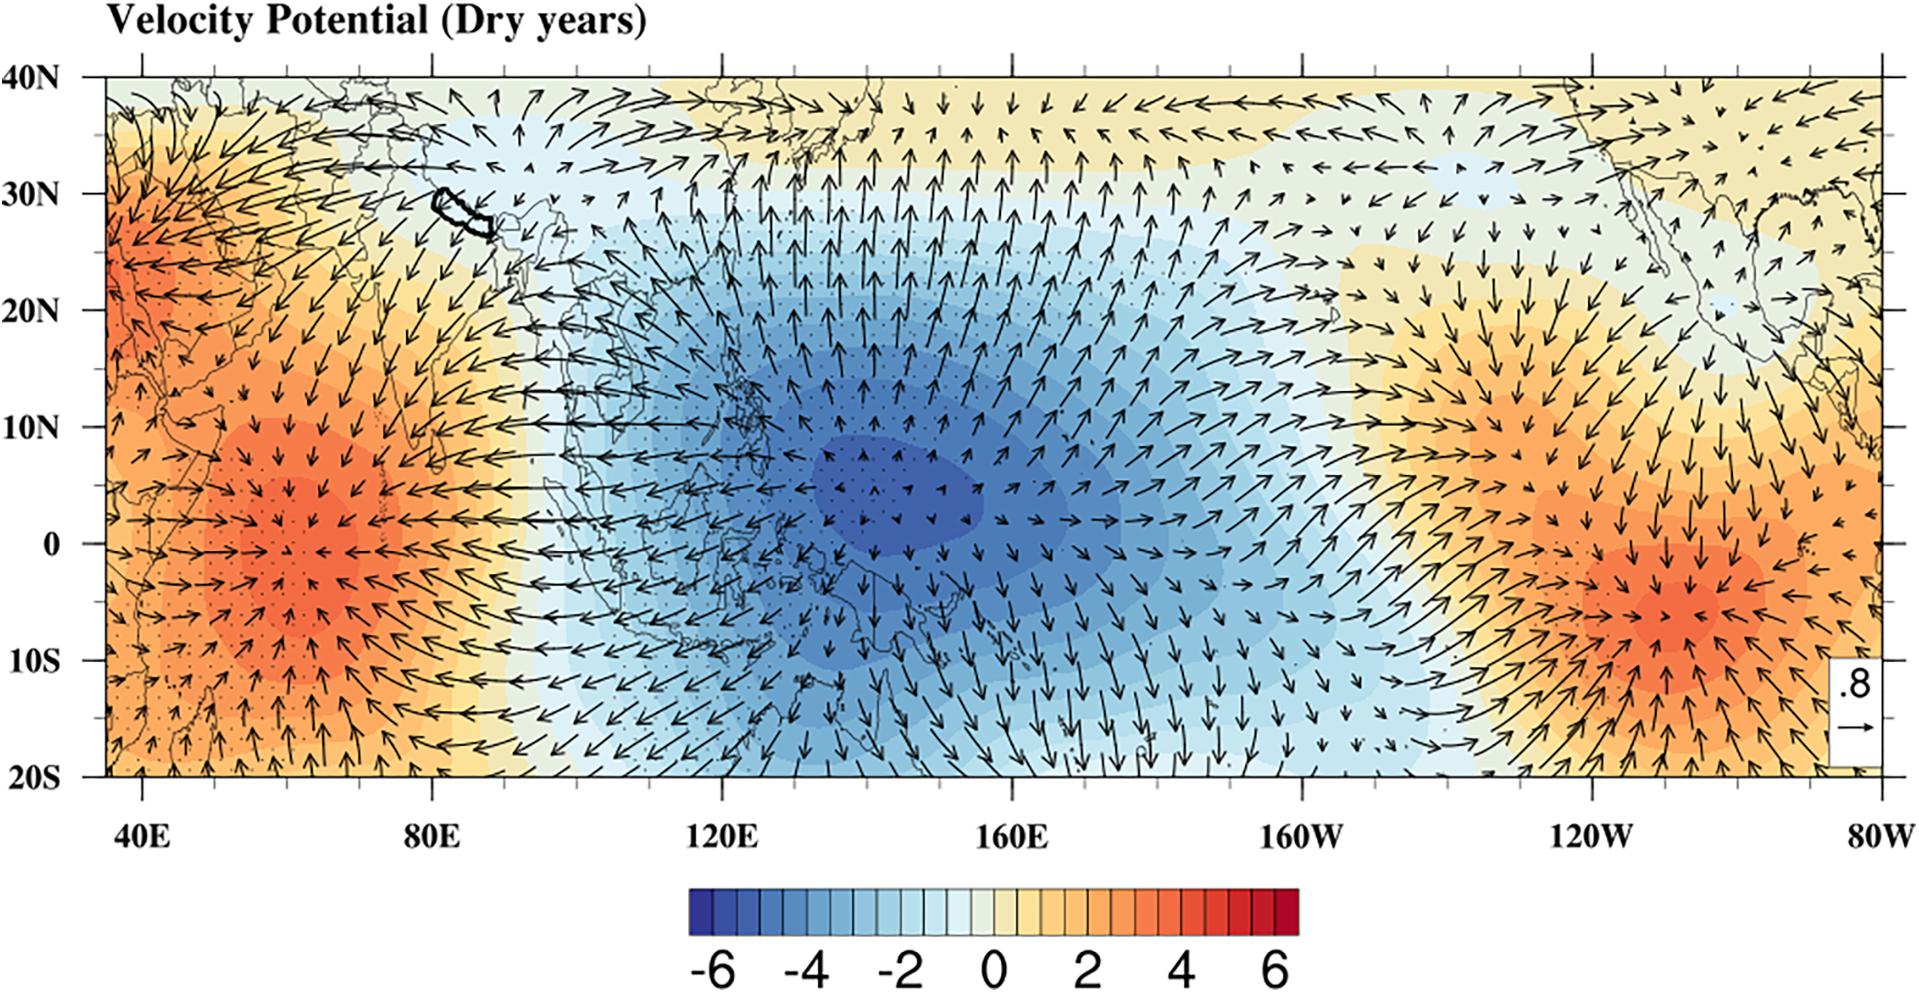
Figure 13. 200 hPa divergent/convergent winds (vectors; m2 s–1) and velocity potential (contours; 10–6, m2 s–1) for dry years based on ERA5 reanalysis data from 1987 to 2015. The dotted points represent the significance at a 95% confidence level.
Conclusion
This study investigated the inter-annual variability of winter precipitation (DJF) over Nepal during the historical period from 1987 to 2015, coupled with the ocean-atmosphere patterns. A high-resolution APHRODITE and ERA5 reanalysis datasets are used to study the EOF, Wavelet, Composites, and Correlation analysis, respectively. Nepal receives very less amount (about 3%) of precipitation in the winter season. EOF analysis displayed two dominant modes, whereas the leading mode captures 53.2% of the total variance exhibiting a single mode of variability. Wavelet analysis determined 2 to 2.6 years of the significant power spectrum on winter precipitation. The standardized anomalies of winter precipitation showed deficit precipitation in 1996, 1998, 2000, 2005, 2007, and 2008, whereas, excess precipitation in 1988, 1995, 1997, 2002, 2012, and 2014. The results displayed positive (negative) anomalies of OLR and vertical velocity over Nepal during dry (wet) years. Moisture divergence (positive anomalies) with strong northwesterly wind anomalies is dominated during the dry years, whereas convergence (negative anomalies) with strong southwesterly in the wet years. The increase in SAT over the TP creates an upper-level divergence of wind anomalies that impact on the reduction of winter precipitation. Furthermore, the negative SST over the tropical IO suppressed the convective activity, which reduced the moisture transport to the Himalayan region, resulting in dry years. The correlation suggests the instance of IOBM and NINO3.4 impacts on the inter-annual variability of the winter precipitation. Moreover, the warming and cooling over the Indo-Pacific regions affect the Walker and Hadley circulation bringing above and below normal precipitation, respectively, over Nepal. The response of indices (NINO3.4, IOBM, and IOD) on winter precipitation, needs further investigation. The comprehensive evaluation of winter precipitation helps to understand the occurrences of the past extreme events as being the basis for forecasting and monitoring drought and floods over Nepal.
Data Availability Statement
The datasets generated for this study are available on request to the corresponding author.
Author Contributions
Concept and data KH, SS. KH wrote the manuscript. NK, BB, and XZ corrected and improved the manuscript. KH and SS compiled all the experiments and analyses with the help of NK.
Conflict of Interest
The authors declare that the research was conducted in the absence of any commercial or financial relationships that could be construed as a potential conflict of interest.
Acknowledgments
The authors express their sincere thanks to the scientists of the APHRODITE and ECMFW for providing ERA5 datasets. The Department of Hydrology and Meteorology, Government of Nepal is also acknowledged for providing the observed precipitation datasets. Additionally, we would like to thank three reviewers for their constructive and insightful reviews and comments which has significantly helped to improve the manuscript.
Supplementary Material
The Supplementary Material for this article can be found online at: https://www.frontiersin.org/articles/10.3389/feart.2020.00161/full#supplementary-material
FIGURE S1 | Correlation between averaged winter precipitation and 2 m surface air temperature during 1987–2015, based on ERA5 data. The dotted points represent the significance at a 95% confidence level.
References
Adhikari, S. (2018). Drought impact and adaptation strategies in the mid-hill farming system of western nepal. Environments 5:101.
Ahmed, F., Adnan, S., and Latif, M. (2019). Impact of jet stream and associated mechanisms on winter precipitation in Pakistan. Meteorol. Atmos. Phys. 132, 225–238. doi: 10.1007/s00703-019-00683-8
Barlow, M., Cullen, H., and Lyon, B. (2002). Drought in central and southwest Asia: La Niña, the warm pool, and Indian Ocean precipitation. J. Clim. 15, 697–700.
Cannon, F., Carvalho, L. M. V., Jones, C., and Bookhagen, B. (2014). Multi-annual variations in winter westerly disturbance activity affecting the Himalaya. Clim. Dynam. 44, 441–455. doi: 10.1007/s00382-014-2248-8
Copernicus Climate Change Service Climate [C3S] (2017). ERA5: Fifth Generation of ECMWF Atmospheric Reanalyses of the Global Climate. Copernicus Climate Change Service Climate Data Store (CDS). Available Online at: https://cds.climate.copernicus.eu/cdsapp#!/home (accessed 12 Jan 2020).
CRED (2018). Decoding the Monsoon Floods.(New Delhi: SEEDS and CRECD), Available Online at: https://reliefweb.int/sites/reliefweb.int/files/resources/Decoding-the-monsoon-floods-report.pdf (accessed November 2019).
Department of Hydrology and Meteorology [DHM] (2017). Observed Climate Trend Analysis in the Districts and Physiographic Regions of Nepal (1971-2014). (Kathmandu: Department of Hydrology and Meteorology). Available Online at: https://www.dhm.gov.np/uploads/climatic/467608975Observed%20Climate%20Trend%20Analysis%20Report_2017_Final.pdf (accessed November 2019).
Dieppois, B., Pohl, B., Rouault, M., New, M., Lawler, D., and Keenlyside, N. (2016). Interannual to interdecadal variability of winter and summer southern African rainfall, and their teleconnections. J. Geophys. Res. Atmos. 121, 6215–6239.
Dimri, A. (2006). Surface and upper air fields during extreme winter precipitation over the western Himalayas. Pure Appl. Geophy. 163, 1679–1698.
Dimri, A. (2007). The transport of momentum, sensible heat, potential energy and moisture over the western Himalayas during the winter season. Theor. Appl. Climatol. 90, 49–63.
Dimri, A. (2013a). Interannual variability of Indian winter monsoon over the Western Himalayas. Global Planet. Change 106, 39–50.
Dimri, A. (2013b). Relationship between ENSO phases with Northwest India winter precipitation. Int. J. Climatol. 33, 1917–1923.
Dimri, A. (2014). Sub-seasonal interannual variability associated with the excess and deficit Indian winter monsoon over the Western Himalayas. Clim. Dynam. 42, 1793–1805.
Duan, A., Wu, G., Liu, Y., Ma, Y., and Zhao, P. (2012). Weather and climate effects of the Tibetan Plateau. Adv. Atmos. Sci. 29, 978–992.
Eckstein, D., Hutfils, M.-L., and Winges, M. (2018). Global Climate Risk Index 2019: Who Suffers Most From Extreme Weather Events? Weather-related Loss Events in 2017 and 1998 to 2017. Berlin: Germanwatch Nord-Süd Initiative eV.
Field, C. B., Barros, V., Stocker, T., Qin, D., Dokken, D., Ebi, K., et al. (2012). Managing the Risks of Extreme Events and Disasters to Advance Climate Change Adaptation: A Special Report of the Intergovernmental Panel on Climate Change. Cambridge: Cambridge University Press.
He, B., Wang, H., Wang, Q., and Di, Z. (2015). A quantitative assessment of the relationship between precipitation deficits and air temperature variations. J. Geophys. Res. Atmos. 120, 5951–5961.
Hussain, M. S., Kim, S., and Lee, S. (2016). On the relationship between Indian Ocean Dipole events and the precipitation of Pakistan. Theor. Appl. Climatol. 130, 673–685. doi: 10.1007/s00704-016-1902-y
Ichiyanagi, K., Yamanaka, M. D., Muraji, Y., and Vaidya, B. K. (2007). Precipitation in Nepal between 1987 and 1996. Int. J. Climatol. A J. R. Meteorol. Soc. 27, 1753–1762.
Kansakar, S. R., Hannah, D. M., Gerrard, J., and Rees, G. (2004). Spatial pattern in the precipitation regime of Nepal. Int. J. Climatol. A J. R. Meteorol. Soc. 24, 1645–1659.
Kar, S. C., and Rana, S. (2014). Interannual variability of winter precipitation over northwest India and adjoining region: impact of global forcings. Theor. Appl. Climatol. 116, 609–623.
Karki, R., Schickhoff, U., Scholten, T., and Böhner, J. (2017). Rising precipitation extremes across Nepal. Climate 5:4.
Kripalani, R., and Kumar, P. (2004). Northeast monsoon rainfall variability over south peninsular India vis-à-vis the Indian Ocean dipole mode. Int. J. Climatol. A J. R. Meteorol. Soc. 24, 1267–1282.
Krishnamurthy, P., Hobbs, C., Matthiasen, A., Hollema, S., Choularton, R., Pahari, K., et al. (2013). Climate Risk and Food Security in Nepal—analysis of Climate Impacts on Food Security and Livelihoods. Denmark: CGIAR Research Program on Climate Change, Agriculture and Food Security (CCAFS).
Krishnamurthy, V., and Kirtman, B. P. (2009). Relation between Indian monsoon variability and SST. J. Clim. 22, 4437–4458.
Krishnan, R., Shrestha, A. B., Ren, G., Rajbhandari, R., Saeed, S., Sanjay, J., et al. (2019). “Unravelling climate change in the Hindu Kush Himalaya: rapid warming in the mountains and increasing extremes,” in The Hindu Kush Himalaya Assessment, eds P. Wester, A. Mishra, A. Mukherji, and A. Bhakta Shrestha (Berlin: Springer), 57–97.
Lang, T. J., and Barros, A. P. (2004). Winter storms in the central Himalayas. J. Meteorol. Soc. Jpn. Ser. II 82, 829–844.
Li, C., and Zhao, T. (2019). Seasonal responses of precipitation in china to el niño and positive indian ocean dipole modes. Atmosphere 10:372.
Lorenz, E. N. (1956). Empirical Orthogonal Functions and Statistical Weather Prediction. Cambridge, MA: Massachusetts Institute of Technology.
Lu, B., Li, H., Wu, J., Zhang, T., Liu, J., Liu, B., et al. (2019). Impact of El Niño and Southern Oscillation on the summer precipitation over Northwest China. Atmos. Sci. Lett. 20:e928.
Mariotti, A. (2007). How ENSO impacts precipitation in southwest central Asia. Geophys. Res. Lett. 34. doi: 10.1029/2007GL030078
Maussion, F., Scherer, D., Mölg, T., Collier, E., Curio, J., and Finkelnburg, R. (2014). Precipitation seasonality and variability over the Tibetan Plateau as resolved by the High Asia Reanalysis. J. Clim. 27, 1910–1927.
Mchugh, M. J. (2006). Impact of South Pacific circulation variability on east African rainfall. Int. J. Climatol. A J. R. Meteorol. Soc. 26, 505–521.
Mpeta, E. J., and Jury, M. R. (2001). Intra-seasonal convective structure and evolution over tropical East Africa. Clim. Res. 17, 83–92.
Ngarukiyimana, J. P., Fu, Y., Yang, Y., Ogwang, B. A., Ongoma, V., and Ntwali, D. (2018). Dominant atmospheric circulation patterns associated with abnormal rainfall events over Rwanda, East Africa. Int. J. Climatol. 38, 187–202.
Pokharel, B., Wang, S. Y. S., Meyer, J., Marahatta, S., Nepal, B., Chikamoto, Y., et al. (2019). The east–west division of changing precipitation in Nepal. Int. J. Climatol. 12. doi: 10.1002/joc.6401
Rohwerder, B. (2016). Seasonal Vulnerability and Risk Calendar in Nepal (GSDRC Helpdesk Research Report 1358). (Birmingham, UK: GSDRC, University of Birmingham).
Saha, S. K., Halder, S., Kumar, K. K., and Goswami, B. (2011). Pre-onset land surface processes and ‘internal’interannual variabilities of the Indian summer monsoon. Clim. Dyn. 36, 2077–2089.
Saji, N., Goswami, B., Vinayachandran, P., and Yamagata, T. (1999). A dipole mode in the tropical Indian Ocean. Nature 401:360. doi: 10.1038/43854
Sein, Z. M. M., Ogwang, B. A., Ongoma, V., Ogou, F. K., and Batebana, K. (2015). Inter-annual variability of summer monsoon rainfall over Myanmar in relation to IOD and ENSO. J. Environ. Agric. Sci. 4, 28–36.
Sharma, S., Khadka, N., Hamal, K., Baniya, B., Luintel, N., and Joshi, B. B. (2020). Spatial and temporal analysis of precipitation and its extremities in seven provinces of nepal (2001-2016). Appl. Ecol. Environ. Sci. 8, 64–73.
Shen, Z., Shi, J., and Lei, Y. (2017). Comparison of the long-range climate memory in outgoing longwave radiation over the Tibetan Plateau and the Indian Monsoon Region. Adv. Meteorol. 2017:7.
Shrestha, A. B., Wake, C. P., Dibb, J. E., and Mayewski, P. A. (2000). Precipitation fluctuations in the Nepal Himalaya and its vicinity and relationship with some large scale climatological parameters. Int. J. Climatol. 20, 317–327.
Shrestha, M. (2000). Interannual variation of summer monsoon rainfall over Nepal and its relation to Southern Oscillation Index. Meteorol. Atmos. Phys. 75, 21–28.
Sigdel, M., and Devkota, L. (2013). Connection of winter time precipitation system in and around nepal with pacific and indian ocean indices. Pakistan J. Meteorol. 10.
Sigdel, M., and Ikeda, M. (2012). Seasonal contrast in precipitation mechanisms over Nepal deduced from relationship with the large-scale climate patterns. Nepal J. Sci. Technol. 13, 115–123.
Sunilkumar, K., Yatagai, A., and Masuda, M. (2019). Preliminary evaluation of GPM-IMERG rainfall estimates over three distinct climate zones with APHRODITE. Earth Space Sci. 6, 1321–1335.
Syed, F. S., and Kucharski, F. (2016). Statistically related coupled modes of South Asian summer monsoon interannual variability in the tropics. Atmos. Sci. Lett. 17, 183–189.
Talchabhadel, R., Karki, R., Thapa, B. R., Maharjan, M., and Parajuli, B. (2018). Spatio-temporal variability of extreme precipitation in Nepal. Int. J. Climatol. 38, 4296–4313.
Tippett, M. K., Barlow, M., and Lyon, B. (2003). Statistical correction of central southwest Asia winter precipitation simulations. Int. J. Climatol. 23, 1421–1433.
Torrence, C., and Compo, G. P. (1998). A practical guide to wavelet analysis. Bull. Am. Meteorol. Soc. 79, 61–78.
Wang, L., Chen, W., Zhou, W., and Huang, G. (2015). Teleconnected influence of tropical Northwest Pacific sea surface temperature on interannual variability of autumn precipitation in Southwest China. Clim. Dyn. 45, 2527–2539.
Wang, X., Cui, G., Wu, F., and Li, C. (2015). Analysis of temporal-spatial precipitation variations during the crop growth period in the Lancang River basin, southwestern China. Ecol. Eng. 76, 47–56. doi: 10.1016/j.ecoleng.2014.02.003
Wang, S.-Y., Yoon, J.-H., Gillies, R. R., and Cho, C. (2013). What caused the winter drought in western Nepal during recent years? J. Clim. 26, 8241–8256.
Wosrld Food Programme. (2009). 2008/09 Winter drought in Nepal – Crop and Food Security Assessment. Rome: World Food Programme.
Wu, G., Liu, Y., He, B., Bao, Q., Duan, A., and Jin, F. (2012). Thermal controls on the Asian summer monsoon. Sci. Rep. 2:404. doi: 10.1038/srep00404
Yadav, R., Kumar, K. R., and Rajeevan, M. (2012). Characteristic features of winter precipitation and its variability over northwest India. J. Earth Syst. Sci. 121, 611–623.
Yadav, R., Rupa Kumar, K., and Rajeevan, M. (2009). Increasing influence of ENSO and decreasing influence of AO/NAO in the recent decades over northwest India winter precipitation.. J. Geophys. Res. Atmos. 114. doi: 10.1029/2008JD011318
Yadav, R., Ramu, D., and Dimri, A. (2013). On the relationship between ENSO patterns and winter precipitation over North and Central India. Global Planet. Change 107, 50–58.
Yadav, R. K., Yoo, J. H., Kucharski, F., and Abid, M. A. (2010). Why is ENSO influencing northwest India winter precipitation in recent decades? J. Clim. 23, 1979–1993.
Yang, J., Liu, Q., Xie, S. P., Liu, Z., and Wu, L. (2007). Impact of the Indian Ocean SST basin mode on the Asian summer monsoon. Geophys. Res. Lett. 34.
Yatagai, A., Arakawa, O., Kamiguchi, K., Kawamoto, H., Nodzu, M. I., and Hamada, A. (2009). A 44-year daily gridded precipitation dataset for Asia based on a dense network of rain gauges. Sola 5, 137–140.
Yatagai, A., Kamiguchi, K., Arakawa, O., Hamada, A., Yasutomi, N., and Kitoh, A. (2012). APHRODITE: constructing a long-term daily gridded precipitation dataset for Asia based on a dense network of rain gauges. Bull. Am. Meteorol. Soc. 93, 1401–1415.
Yu, W., Xiang, B., Liu, L., and Liu, N. (2005). Understanding the origins of interannual thermocline variations in the tropical Indian Ocean. Geophys. Res. Lett. 32. doi: 10.1029/2005gl024327
Zhang, Z., and Moore, J. C. (eds). (2015). “Chapter 6-empirical orthogonal functions,” in Mathematical and Physical Fundamentals of Climate Change (Boston: Elsevier), 161–197.
Keywords: winter precipitation variability, dry events, wet events, westerlies, Nepal
Citation: Hamal K, Sharma S, Baniya B, Khadka N and Zhou X (2020) Inter-Annual Variability of Winter Precipitation Over Nepal Coupled With Ocean-Atmospheric Patterns During 1987–2015. Front. Earth Sci. 8:161. doi: 10.3389/feart.2020.00161
Received: 15 November 2019; Accepted: 29 April 2020;
Published: 22 May 2020.
Edited by:
Xingcai Liu, Chinese Academy of Sciences, ChinaReviewed by:
Jing Yang, Beijing Normal University, ChinaNavaraj Pokharel, Tribhuvan University, Nepal
Copyright © 2020 Hamal, Sharma, Baniya, Khadka and Zhou. This is an open-access article distributed under the terms of the Creative Commons Attribution License (CC BY). The use, distribution or reproduction in other forums is permitted, provided the original author(s) and the copyright owner(s) are credited and that the original publication in this journal is cited, in accordance with accepted academic practice. No use, distribution or reproduction is permitted which does not comply with these terms.
*Correspondence: Shankar Sharma, U2hhcm1hLnNoOTY5QGdtYWlsLmNvbQ==
 Kalpana Hamal
 Shankar Sharma
 Binod Baniya
 Nitesh Khadka
 Xu Zhou
