 Xiaoying Yue
 Zhongqin Li1,2
 Nozomu Takeuchi
 Lin Wang
94% of researchers rate our articles as excellent or good
Learn more about the work of our research integrity team to safeguard the quality of each article we publish.
Find out more
ORIGINAL RESEARCH article
Front. Earth Sci. , 19 May 2020
Sec. Cryospheric Sciences
Volume 8 - 2020 | https://doi.org/10.3389/feart.2020.00110
This article is part of the Research Topic Impure Snow and Ice in Remote Areas: Arctic, Antarctica and High Mountains View all 11 articles
Surface albedo is an important driver of surface processes that promote glacier melting and is a key variable influencing glacier surface melt. Despite much focus in the literature on variations in albedo and its influence on snow surfaces, little attention has been paid to dust and its impact on bare-ice albedo with respect to glacier melting surfaces. In this paper, spatial changes in glacier albedo were investigated using three Landsat images taken during the ablation season in 2006; temporal variations in albedo were measured by an automatic weather station (AWS) in the ablation zone between 26 June and 1 August 2007 at Urumqi Glacier No. 1 in Tien Shan. Ice and snow samples and reflection spectra at 325–1050 nm were collected in August, 2007 at Urumqi Glacier No. 1. The data suggested that spatial changes in glacier albedo are not prominent after snowfall; however, once ice becomes exposed, glacier albedo varies remarkably and generally increases with elevation, especially around the snow line. Temporal variations are characterized by a large range and high frequency, and most are induced by snowfall, changes in cloud conditions, and surface dust; snowfall and cloud increase glacier albedo. Furthermore, the response of snow albedo is more sensitive to cloud compared with the response of ice albedo. Over a bare ice surface, the albedo generally decreases as the concentration of surface dust increases. Organic matter is a primary factor in reducing the albedo over ice.
An important source of freshwater, it is well known that mountain glaciers are seriously threatened by global climate change. A widespread decrease in the extent of glaciers and a continuous loss of glacier mass have been observed over the past 50 years (Zemp et al., 2019). These phenomena are particularly severe in semi-arid regions, where populations are heavily dependent on snow and glacier melt for their water supplies (Farinotti et al., 2015). Shortwave radiation provides the main energy source for glacial melting and consequently dominates the glacial surface melt magnitude (Hock, 2005; Sun et al., 2017). The shortwave radiation absorbed by glaciers is controlled by surface albedo, which is highly variable in space and time. Therefore, surface albedo is a critical variable affecting the energy and mass balance at a melting glacier surface. The glacier surface mass balance (the sum of accumulation and ablation) is extremely sensitive to changes in albedo, varying, for example, by 36% when the albedo changed by 0.1 in the ablation zone of Laohugou Glacier No. 12 from 1 June to 30 September 2011 (Sun et al., 2017, 2014). On the Peyto Glacier, Munro (1991) reported that an increase of 0.05 in glacier albedo caused a change in mass balance of 0.66 m w.e., while mass balance changed −0.83 m w.e. with a decrease in glacier albedo of 0.05. This high sensitivity is linked to a positive feedback mechanism between glacier melt and surface albedo, involving enhanced melting and increased exposure of bare ice; aggregated impurities and meltwater on the glacier’s surface; and reduced surface albedo and increased solar radiation absorption, consequently accelerating melt (Klok and Oerlemans, 2004; Moustafa et al., 2015). Driven by surface-atmosphere feedback, albedo reduction on a glacier’s surface is considered responsible for accelerated recession (Li et al., 2011). Therefore, significant motivation exists to investigate the temporal and spatial variation in glacier albedo to reveal the response mechanism of glaciers to climate change.
To date, most long-term studies on spatiotemporal changes in glacier albedo have been generally based on point data recorded by an automatic weather station (AWS) set up on the glacier’s surface (Oerlemans et al., 2009) or coarsely spatial resolution satellite data, such as that obtained by the Advanced Very High Resolution Radiometer (AVHRR) (Stroeve et al., 1997) or the Moderate Resolution Imaging Spectroradiometer (MODIS) (Sirguey et al., 2016; Mortimer and Sharp, 2018). However, for the limited size of mountain glaciers and the complex surrounding topography, the spatial resolution of MODIS data (500 m) and AVHRR data (1000 m) is not high enough, and no appropriate high-resolution albedo product is readily available (Naegeli et al., 2019). However, in order to capture the more detailed spatiotemporal changes in surface albedo on mountain glaciers, increasing numbers of researchers are focusing on the retrieval of glacier albedo from high spatial resolution satellite data. For example, Klok et al. (2003) first proposed in detail glacier albedo retrieval methods using Landsat images and found that, on average, satellite-derived albedos exceed measured surface albedos by 0.03 over a glacier with rugged topography. Fugazza et al. (2016) investigated the spatial distribution of surface albedo at the Forni Glacier, Stelvio National Park, Central Italian Alps, during the ablation season between 2011 and 2013 using four satellite images from the Landsat 7 ETM + images, and they showed that, over the ablation tongue, the albedo is typical of debris-rich ice. Conversely, over accumulation basins, albedo values were typical of old snow for all Landsat images. Naegeli et al. (2019) assessed the temporal evolution of shortwave, broadband albedo derived from 15 end-of-summer Landsat scenes for the bare-ice areas of 39 large glaciers in the western and southern Swiss Alps and declared that trends in bare-ice albedo crucially depend on spatial scales. They emphasized that no significant negative temporal trend in bare-ice albedo was found on a regional to glacier-wide scale, however, at grid cells scales of Landsat images, they discovered significant darkening for the study period of 1999–2016.
In addition, it is necessary to further quantify the dependence of albedo on its influencing factors for the accurate simulation of glacier energy and mass balance. Major factors affecting glacier albedo were related to the surface itself physical properties and the solar irradiance. The surface physical properties relate to the grain size, liquid water, impurities, surface roughness, snow depth, crystal orientation, and structure. The solar irradiance is dependent on the solar incidence angle, cloud optical thickness, cloud amount, aerosol extinction, and shadowing by terrain (Hock, 2005; Gardner and Sharp, 2010). An important factor driving change in glacier albedo is the occurrence of impurities or cryoconite (dark-colored spherical aggregates of mineral particles, organic matter, and microbes, including snow algae, cyanobacteria, and bacteria) at the glacier’s surface (Takeuchi et al., 2010). The quantities and characteristics of these impurities vary spatially and temporally (Azzoni et al., 2016). For example, wind-blown dust is usually deposited in spring on Asian glaciers (Dong et al., 2009), and, on Alaskan glaciers, snow-algae bloom is generally aggregated near the snowline in summer (Takeuchi, 2009). Previous studies have revealed that impurities substantially decrease glacier surface albedo by absorbing incident radiation in the visible region (300–700 nm), where absorption by the glacier is weakest (Cutler and Munro, 1996; Yue et al., 2017; Li et al., 2019). For example, black carbon can strongly enhance absorption at visible and near-infrared wavelengths, whereas iron oxides, the primary light-absorbing component in mineral dust, reduce ultraviolet and visible waveband reflectance (Lafon et al., 2006; Zhang et al., 2015). Cong et al. (2018) found that organic materials in cryoconite were the most important light absorbers at wavelengths of 450 and 600 nm and that goethite played a stronger role than black carbon at shorter wavelengths for most glaciers on the Tibetan Plateau. Moreover, the albedo-reducing effect of biological impurities arises from their dark pigmentation – impurities such as xanthophyll, chlorophyll, and carotenoid, which absorb light with characteristic spectral profiles across ultraviolet and visible wavelengths; ice, typical in these areas, exhibits little absorption (Yallop et al., 2012).
Dust deposition on snowpacks has been well studied (Dumont et al., 2014; Ming et al., 2016; Skiles and Painter, 2016; Niu et al., 2017; Hu et al., 2018; Li et al., 2018). Variation in snow albedo results from light-absorbing impurities (i.e., black carbon, organic carbon, and mineral dust) and snow metamorphism. Temperature since previous snowfall events is deemed as a proxy for increasing grain size and impurity content, which leads to lower albedo (Klok and Oerlemans, 2004). Thus, snow albedo is best estimated from accumulated daily positive temperatures, since previous snowfall (Brock et al., 2000; Hock and Holmgren, 2005; Pellicciotti et al., 2005). However, little attention has been paid to the decreasing ice albedo caused by dust deposition on the glacier’s melting surface. Moreover, in energy balance melt models, the ice albedo is usually treated as constant in time and space, about 0.3 (Oerlemans and Knap, 1998; Huintjes et al., 2015; Zhu et al., 2015). Brock et al. (2000) attempted to parameterize ice albedo using its relationship with elevation, and Azzoni et al. (2016) found that fine coverage values were directly proportional to the natural logarithm of measured ice albedo in the Forni Glacier, Italy.
In general, albedo parameterization within energy and mass balance models cannot account for all spatial and temporal variations in surface albedo, especially for the surface of ice, and such parameterization is consequently regarded as a major source of error (Arnold et al., 1996; Klok and Oerlemans, 2002, 2004). Therefore, further studies are needed to combine measurements of the impurity characteristics with systematic measurements of ice albedo. Takeuchi et al. (2006, 2010) developed a field procedure and further standardized lab analysis to quantify the characteristics of surface dust and its effects on reflectance based on studies in the Alaska Range (2009), Qilian Mountain (2005), Altay (2006), the Himalayas (2000), Patagonia (2001), Russian Siberia (2015), and Greenland (2014). However, these studies were limited to monitoring changes based on several field points during the study period.
In the current study, Urumqi Glacier No. 1 was selected. Taking advantage of records provided by the AWS in the ablation zone, between 26 June and 1 August 2007, and three satellite images from the Landsat TM and ETM + in the warm season of 2006, high spatiotemporal resolution changes in surface albedo were investigated. Reflectance spectra in the wavelength range of 325–1050 nm were collected, and surface dust, as well as its organic matter content, was measured at six different elevations on 1 August 2007. The characteristics of surface dust and its role on ice albedo reduction are analyzed. In addition, the influence of cloud on surface albedo for snow and bare ice is discussed, in terms of physical properties. The principal purpose of this study was to investigate high spatiotemporal resolution variation in albedo and its influencing factors over glacier melting surfaces and to improve existing albedo parameterizations.
Urumqi Glacier No. 1 (UG1), located in an arid and semi-arid region of central Asia, is surrounded by vast desert areas (Figure 1A); it is a typical valley glacier with an area of 1.62 km2 and an axis length of nearly 2.1 km, as of August 2012 (Figure 1C). It flows northeastward from the highest elevation of 4445 m.a.s.l to its terminal position of 3752 m.a.s.l. The latest radar echo-sounding measurement was carried out on the glacier in August 2012, indicating its maximum thickness to be 124 ± 5 m (WGMS, 2017).
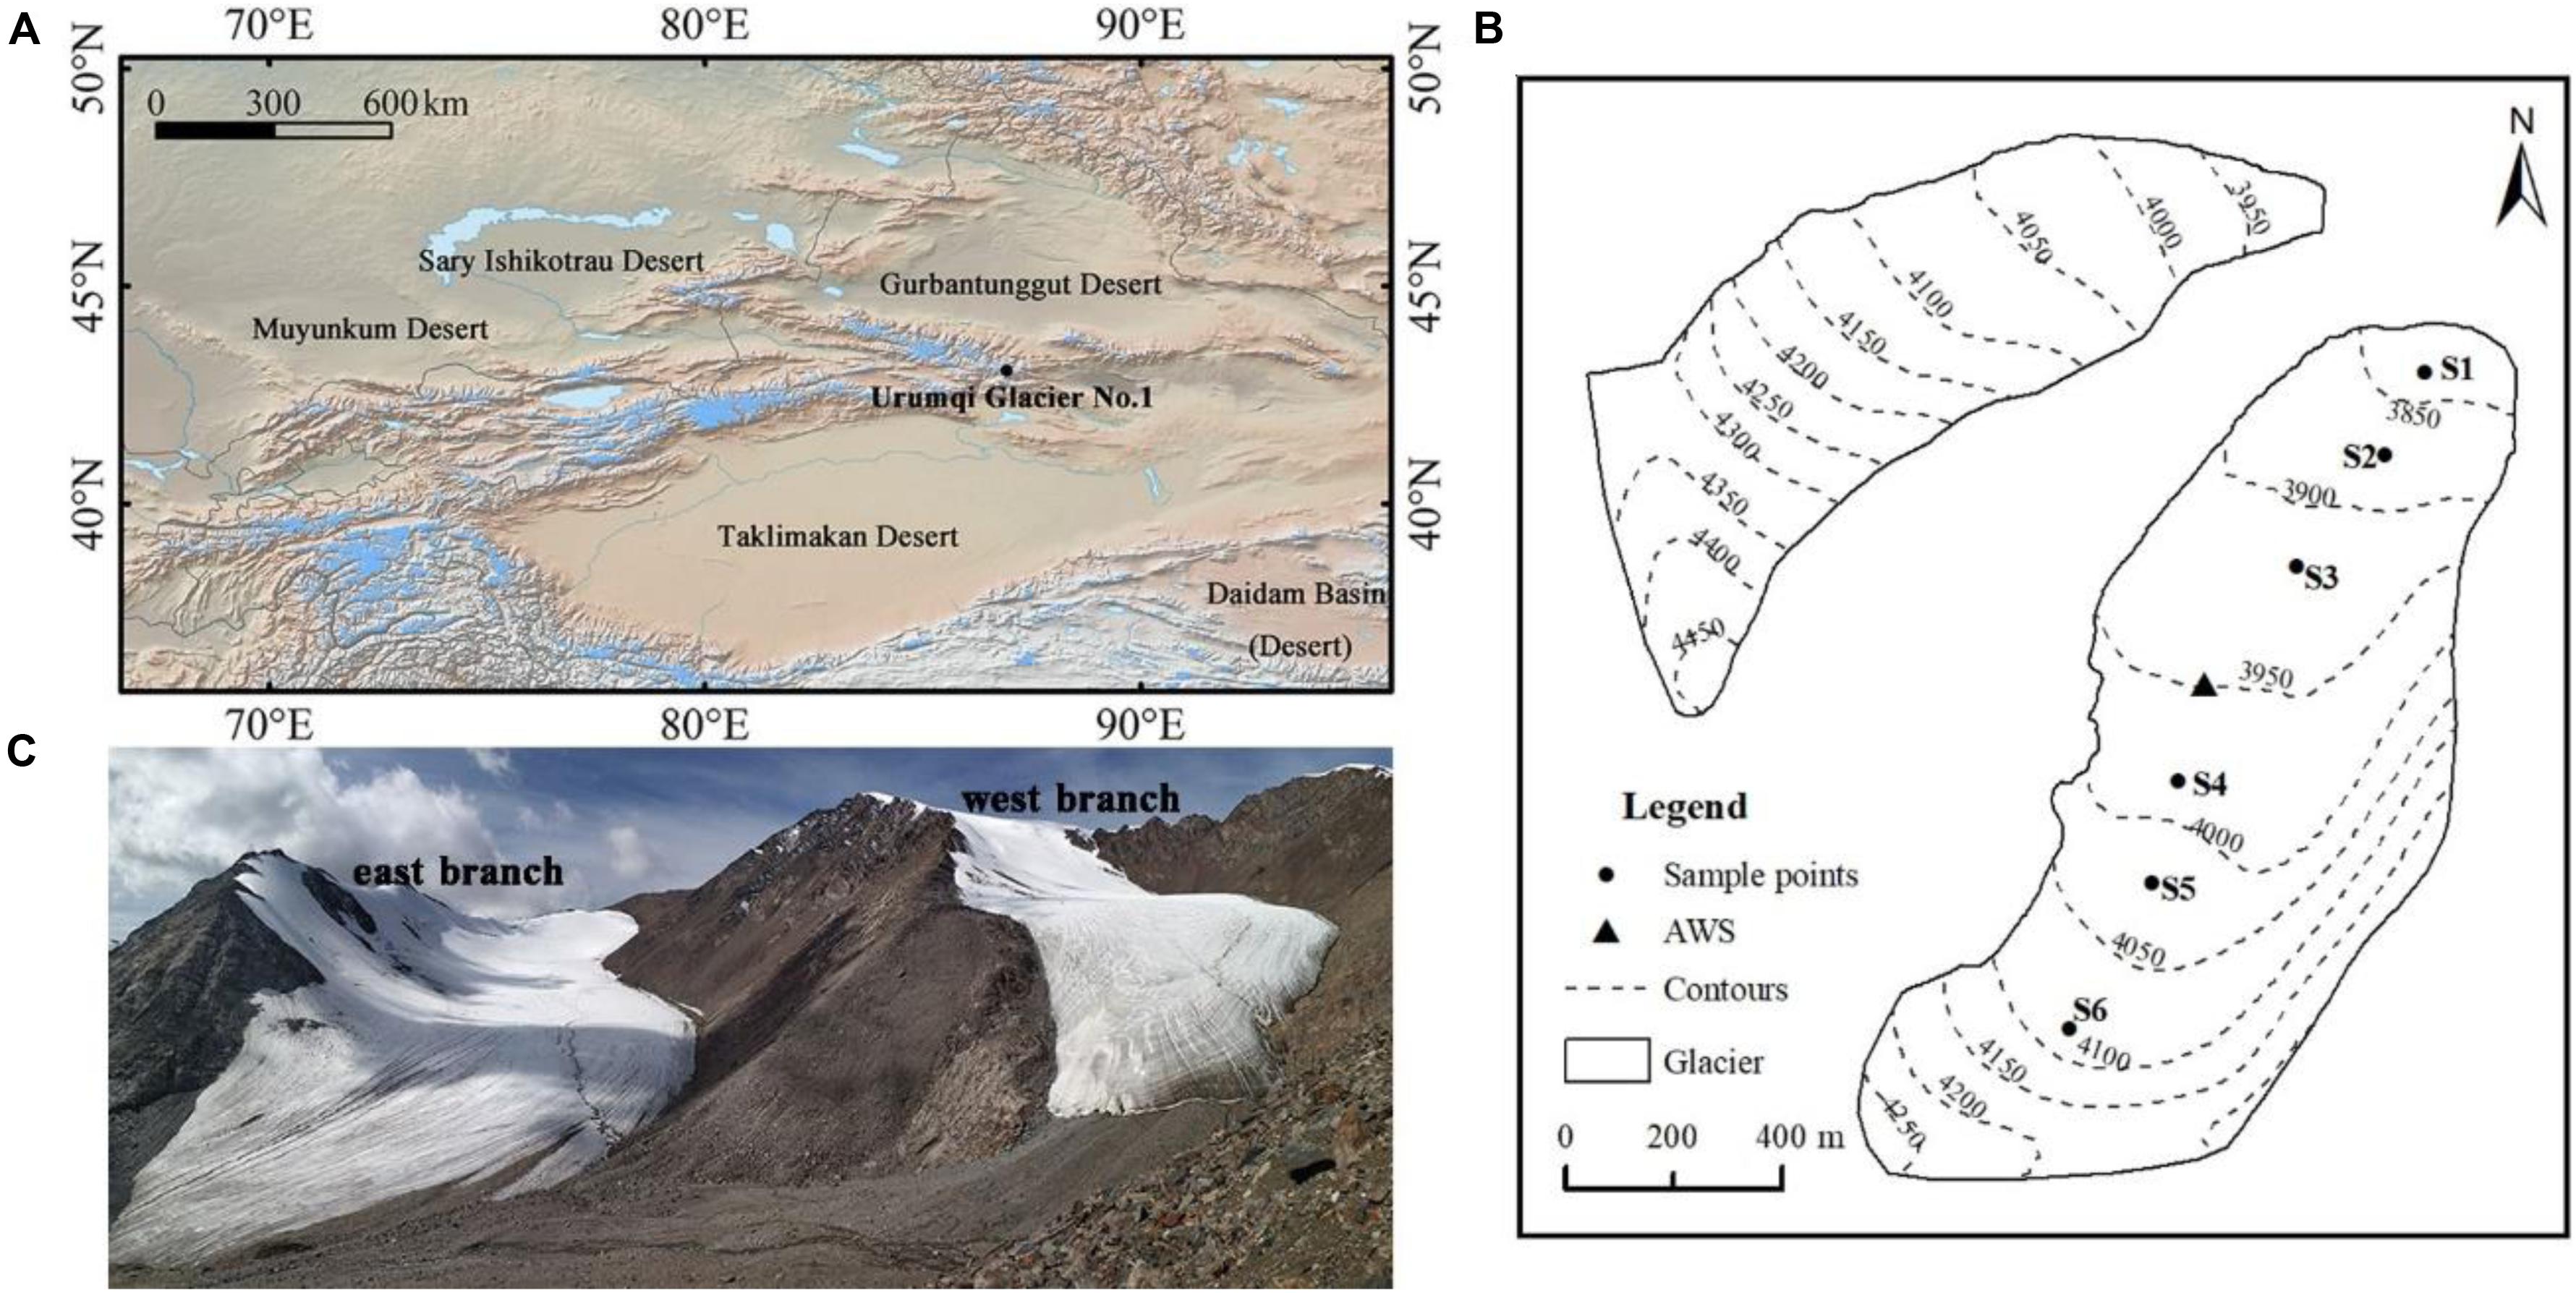
Figure 1. Geographical location (A) and map (B) of Urumqi Glacier No. 1 in Tien Shan, China. Landscape photograph (C) of Urumqi Glacier No. 1 was taken on 20 July 2012.
Urumqi Glacier No. 1 is a reference glacier in the WGMS glacier monitoring network and has provided the longest and best glaciological and climatological monitoring records in China since 1959. The records show that the glacier has been in constant recession for the past 60 years, especially for the past 30 years – the glacier has experienced a rapid and accelerated shrinkage. Increased precipitation has not been sufficient to mitigate the impact of temperature increase in this area (Li et al., 2011). Consequently, the glacier divided itself into an eastern branch and a western branch in 1993. Recent measurements revealed that the cumulated mass balances of Urumqi Glacier No. 1 were -20 334 mm w.e. and that the ELA averaged approximately 4050 m a.s.l. over the period 1960–2018. The glacier experienced two accelerations in mass loss in the past 60 years, the first starting in 1985 and the second in 1996 (Li et al., 2011). Meanwhile, the ELA increased from 3940 to 4240 m a.s.l.
The study region of the paper is dominated by the westerly jet stream in the upper troposphere, the Siberian anticyclonic circulation, and the cyclonic disturbances of west wind circulation (Farinotti et al., 2015). The mean annual air temperature is about −5.0°C, and the annual precipitation is generally 460 mm, measured at the nearby meteorological station located at 3549 m.a.s.l (Daxigou Meteorological Station). Seventy-eight percent of the annual total precipitation occurs from May to August, predominantly as solid precipitation, as snow, hail, or sleet, at higher elevations (Yang et al., 1992). For Urumqi Glacier No. 1, accumulation and ablation both take place primarily during the warm season.
Measurement of continuous albedo was carried out by an AWS in the ablation zone, between 26 June and 1 August 2007 (Figure 1B). The AWS was equipped with MS-402 pyranometers (EKO Instruments Co., Japan) to measure shortwave incoming (Gh) and shortwave reflected (Rh) radiation. The pyranometer was mounted horizontally, 1.5 m above the surface. The pyranometer error was about 5% in the wavelength range 0.3–2.8 μm. A data logger (CR1000) recorded half-hourly mean measurements taken every 10 s. During the measurement period, we visited the station and checked the sensors every 3–5 days to ensure the pyranometer remained at a height of 1.5 m.
In order to minimize the error introduced by installing the pyranometer horizontally instead of parallel to the sloping surface, the half-hourly albedo was corrected according to Jonsell et al. (2003). The corrected formula is as follows:
Here, Rh is reflected shortwave radiation; Gh is incident shortwave radiation in the horizontal plane; Z is the solar zenith angle; φ is the solar azimuth angle; β is the slope angle of the surface with azimuth angle θ; and d is the diffuse portion of Gh, which is computed using an empirical relationship relating the ratio of incoming shortwave radiation (Gh) and extraterrestrial solar radiation (T). T can be calculated from solar geometric relationships, and Gh is approximately equal to the incoming shortwave radiation provided by AWS on the glacier.
In addition, the ratio Gh/T was taken as a measure of cloud cover (Cutler and Munro, 1996; Brock, 2004). In the current study, to quantify the effect of cloud on albedo, we related the change in albedo between two successive half-hourly measurements to the corresponding change in the diffuse portion of incoming shortwave radiation, Δ(Gh/T). The approach was used by Jonsell et al. (2003) on Storglaciaren, Sweden. As cloudiness increases, less solar radiation will reach the surface, the ratio Gh/T will decrease, and d will tend to decrease. Thus, the ratio is generally higher under clear-sky conditions than under overcast-sky conditions. A positive change, Δ(Gh/T), indicates decreasing cloudiness, while a negative change corresponds to increasing cloudiness.
Half-hourly broadband albedo values derived from measured incoming shortwave radiation with values <4 W⋅m–2 and zenith angle >65° were discarded, as instruments give unreliable responses for very low incoming shortwave radiation values and high zenith angles (Arendt, 1999). Moreover, albedo values that exceeded 0.98 (a value generally assumed for fresh snow) (Cuffey and Paterson, 2010) were also discarded.
In this study, satellite images were used to investigate the spatial variation in albedo over the whole glacier. Unfortunately, there were no Landsat satellite images acquired of Urumqi Glacier No. 1 during the ablation period in 2007 because of cloud and timing. Thus, three Landsat satellite images were selected over this area between June and August 2006 (Table 1).
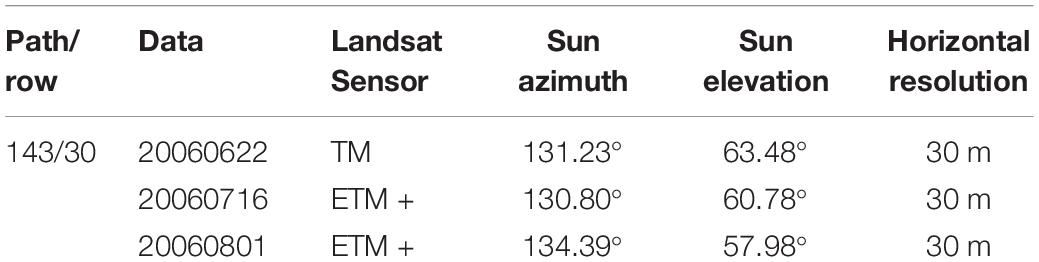
Table 1. Landsat images were used to retrieve the surface albedo of glacier.
We adopted the methodology in Klok et al. (2003) to retrieve the glacier surface albedo from Landsat images. The methodology include geolocation, radiometric calibration, atmospheric correction, topographic correction, anisotropic correction, and narrow-to-broadband conversion. The process of deriving surface albedo is described in detail by Yue et al. (2017). The retrieval method considers all important processes that substantially influence the relationship between satellite signal and surface albedo. The method, therefore, has been widely applied for a number of mountain glaciers, such as Urumqi Glacier No. 1, China (Yue et al., 2017); Forni Glacier, Italy (Fugazza et al., 2016); Morteratschgletscher, Switzerland (Klok et al., 2003); and Haut Glacier, Switzerland (Knap et al., 1999). In these studies, good agreement between the Landsat-derived albedo and measured albedo suggests that the retrieval methodology generally produces accurate estimates of surface albedo and can be used quantitatively to research the spatiotemporal evolution of glacier albedo.
In order to quantify the effects of surface dust and its organic-matter content on albedo, field work was carried out on the east branch of Urumqi Glacier No. 1 in August 2007. Ice and snow samples on the surface layer were collected with a stainless-steel scoop in an area of approximately 15 cm × 15 cm to a depth of 1–3 cm at five sites in the bare ice area (S1–S5) and one site in the snow area (S6) (Figure 1B). Five samples were randomly selected from the surface at each study site. The chosen sites were visibly representative of the surface conditions around each site, in terms of surface roughness and the amount of rocky debris. In the laboratory, the samples were dried for 24 h at 60°C. Then, they were combusted for 3 h at 500°C. After each processing step, the samples were weighed to obtain the amount of surface dust and its organic matter content. The amount of dust per unit area of the glacier was obtained based on measurements of the dry weight and the sampling area. All samples were analyzed in a laboratory of Chiba University, Japan. The process of sample collection and analysis has been described in detail by Takeuchi and Li (2008).
Reflectance spectra were collected at 325–1050 nm using a portable spectroradiometer (MS-720, Eiko Seiki, Japan), with a spectral resolution of 10 nm. Reflectances were obtained by dividing the surface radiances by the radiance acquired from a white reference panel that is nearly 100% reflective and diffuse. The distance between the sensor and the glacier surface was approximately 20 cm and had a region size of ∼8.9 cm diameter on surface. Under changing sky conditions, and before each measurement, the instrument was recalibrated. To minimize the influence of slope and solar zenith angle on albedo, all measurements were conducted on a surface-parallel plane, 11:00–14:00 local standard time in clear-sky conditions. At each measuring location, three consecutive spectral measurements were recorded and averaged.
The broadband albedo was calculated at wavelengths from 350 to 1050 nm. The associated expression is as follows:
where αnarrow(λ) denotes the measured spectral albedo using the spectroradiometer, and i(λ) is incoming solar irradiance, which is provided by the American Society for Testing and Materials (ASTM G-173-03 data). A similar method was also adopted by Wright et al. (2014); Moustafa et al. (2015), and Li et al. (2019).
To obtain a high-quality albedo data set, rigorous quality controls were implemented. Outliers were removed – physically unrealistic spectral albedo values (>0.98) and raw spectra that were markedly different from other spectra across the entire spectral range (visible and near-infrared wavelengths) for the same sample.
The half-hourly albedo recorded at the AWS in 2007 is shown in Figure 2, revealing a variety of diurnal patterns. In general, the half-hourly albedo value has a large range, from a maximum of 0.98 on 18 July to a minimum of 0.075 on 23 July. There are four “jumps” in the minimum albedo value between 1 day and the next – the most obvious increases in albedo occur on 30 June, 10 July, 17 July, and 29 July, likely to have resulted from fresh solid precipitation (Figure 3). Solid precipitation events were recognized according to the results of Kang and Atsumu (1993) on Urumqi Glacier No. 1. Specifically, when air temperature was lower than 2.8°C, the form of precipitation is classified as solid. In addition, the gradual decreasing trends of minimum albedo value are shown for during the day, from 10 July to 15 July, which reveal the transition in surface type from fresh snow to old snow and bare ice. Different magnitudes of the diurnal albedo cycle were observed, with little variation to considerable variation over the course of a day. The largest range was to be expected when the transitions between snow and ice happened because of snowfall and melting, and the diurnal variation of snow albedo was larger than that of ice (Table 2). Moreover, high frequency and small-to-medium magnitude albedo variability over all surfaces suggested that other factors were active, such as solar zenith angle and cloud. Generally, albedo is higher in the morning and afternoon than at noon, but asymmetry around solar noon is more pronounced; this phenomenon is likely to result from the change in solar zenith angle, while reduced afternoon values result from snow metamorphism and surface melt. However, minimal indications of diurnal albedo cycles were found between 22 and 27 July over ice surfaces, which implies that the effect of solar zenith angle <65° on ice albedo is negligible.
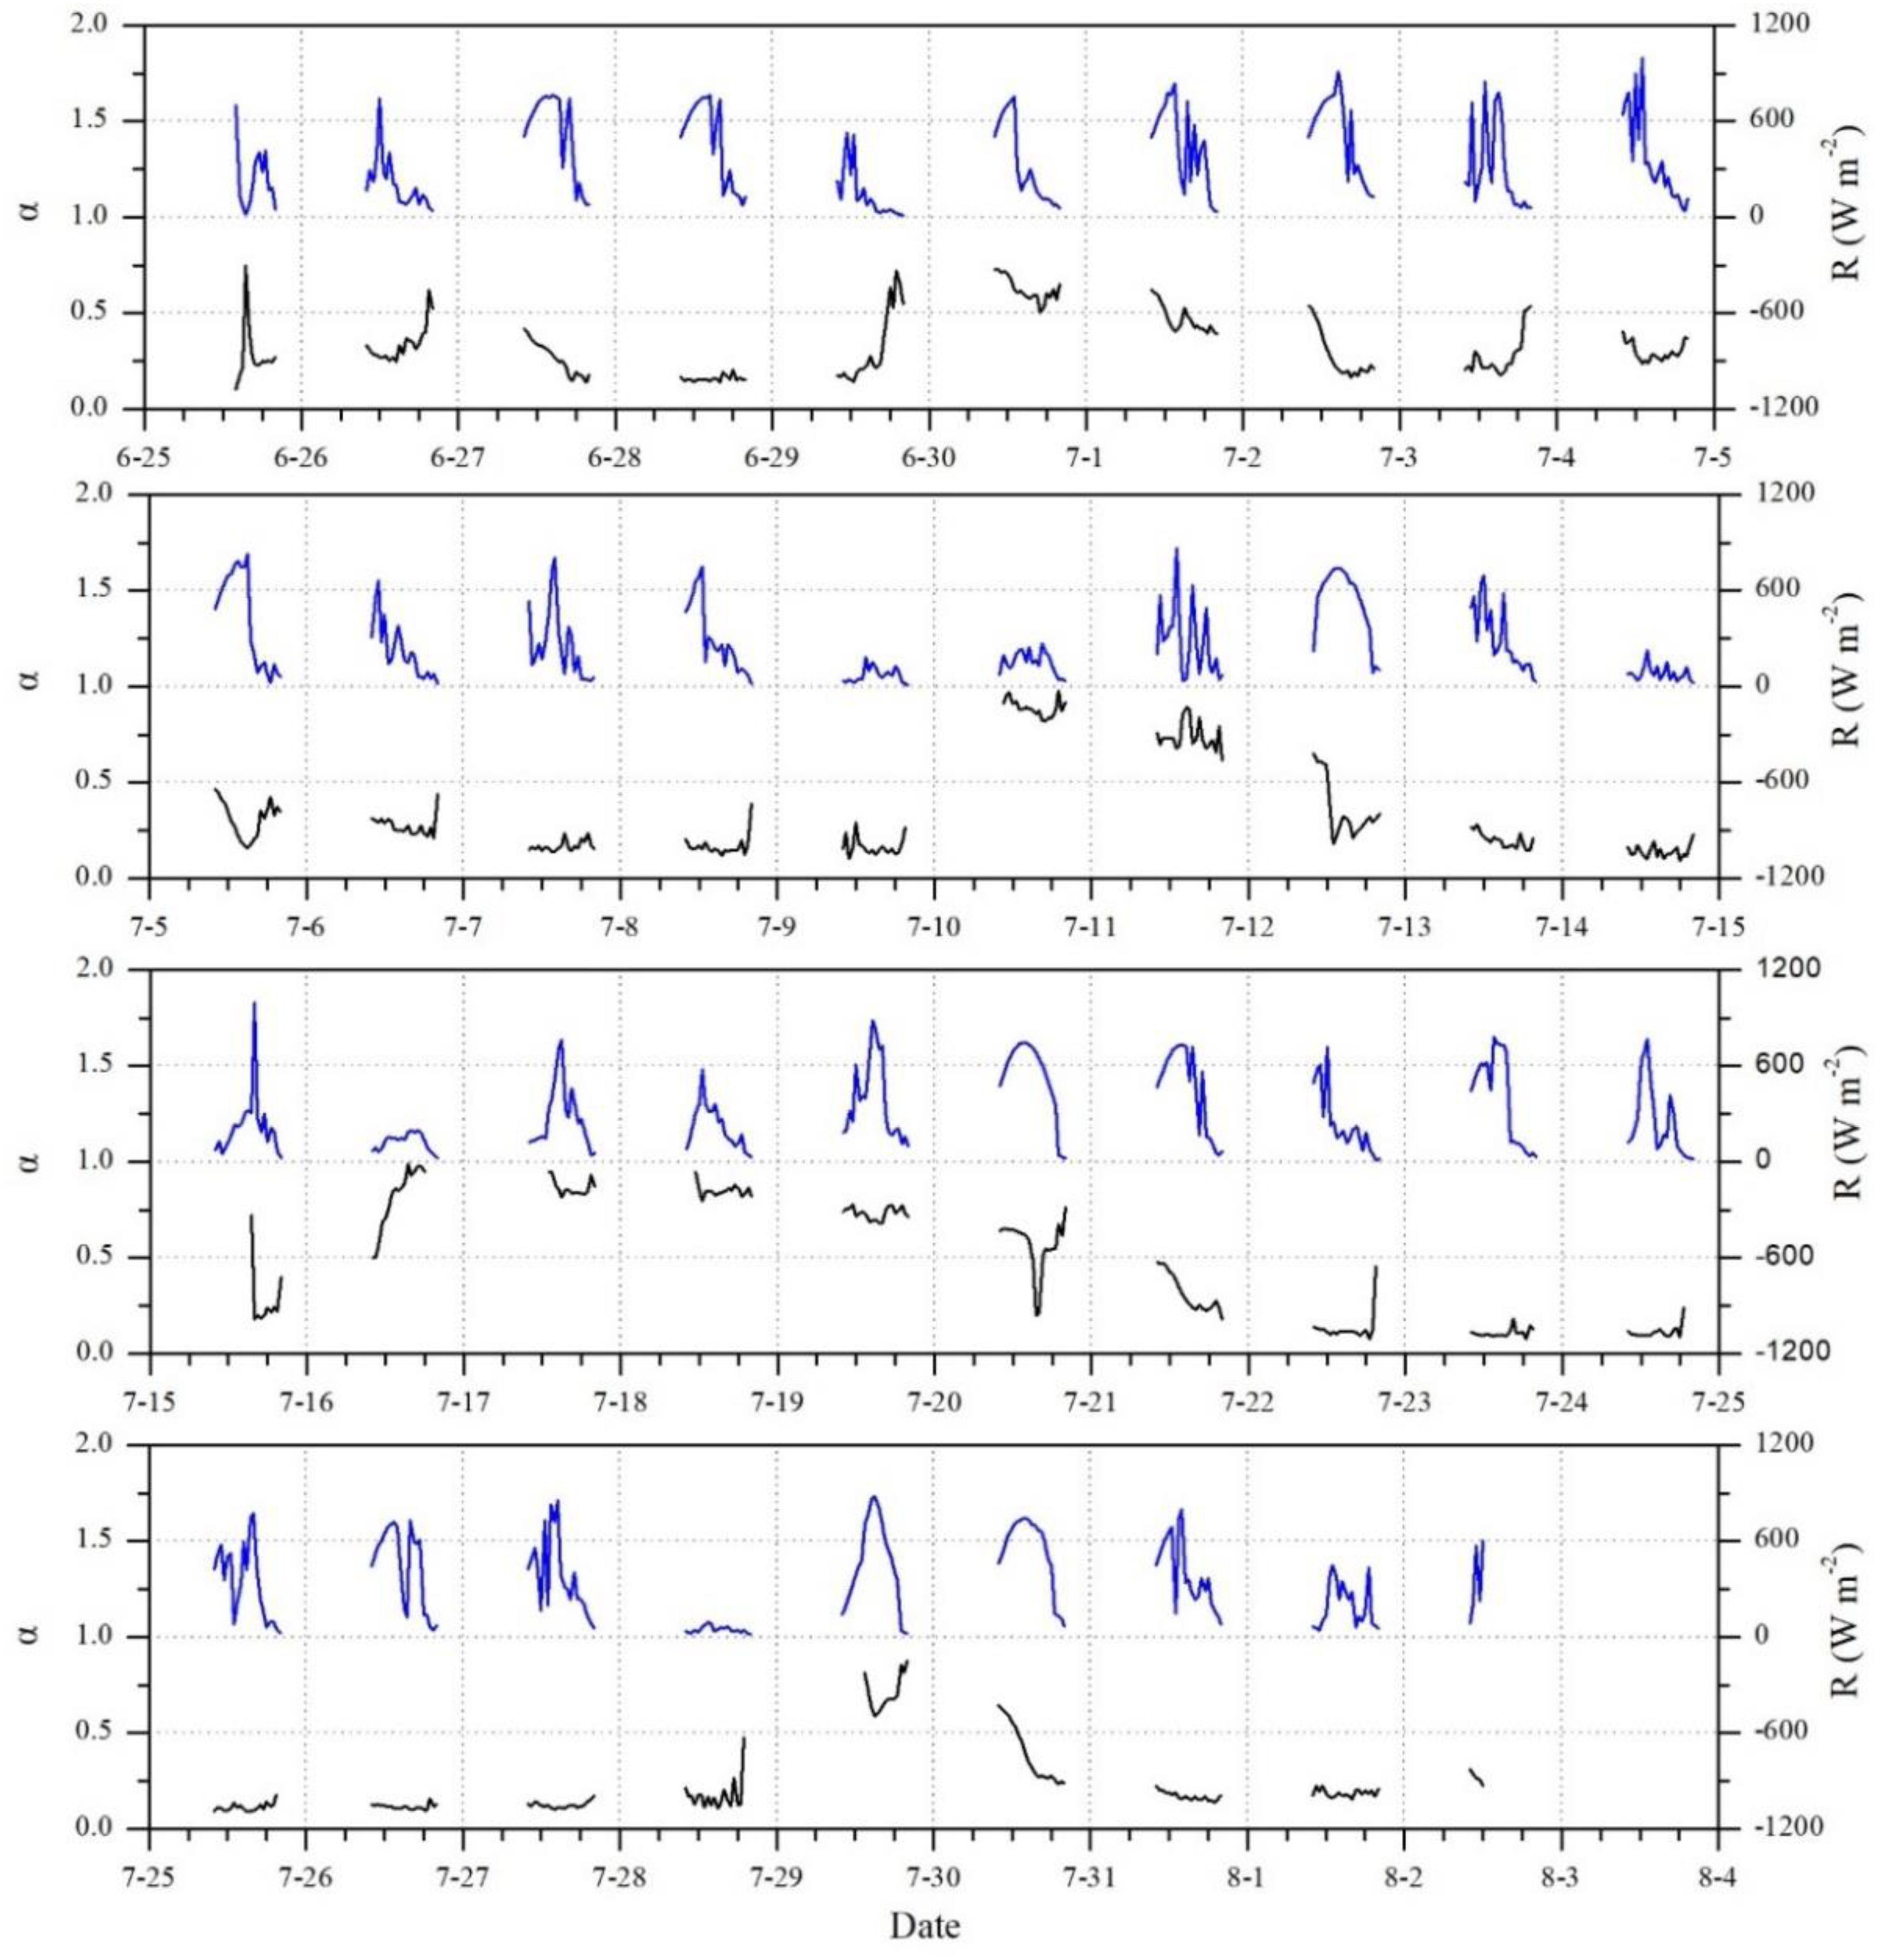
Figure 2. Half-hourly albedo (α, black line) and incoming shortwave radiation (R, blue line) records by AWS between 26 June and 2 August 2007. Half-hourly values with solar zenith angle >65° were not considered.
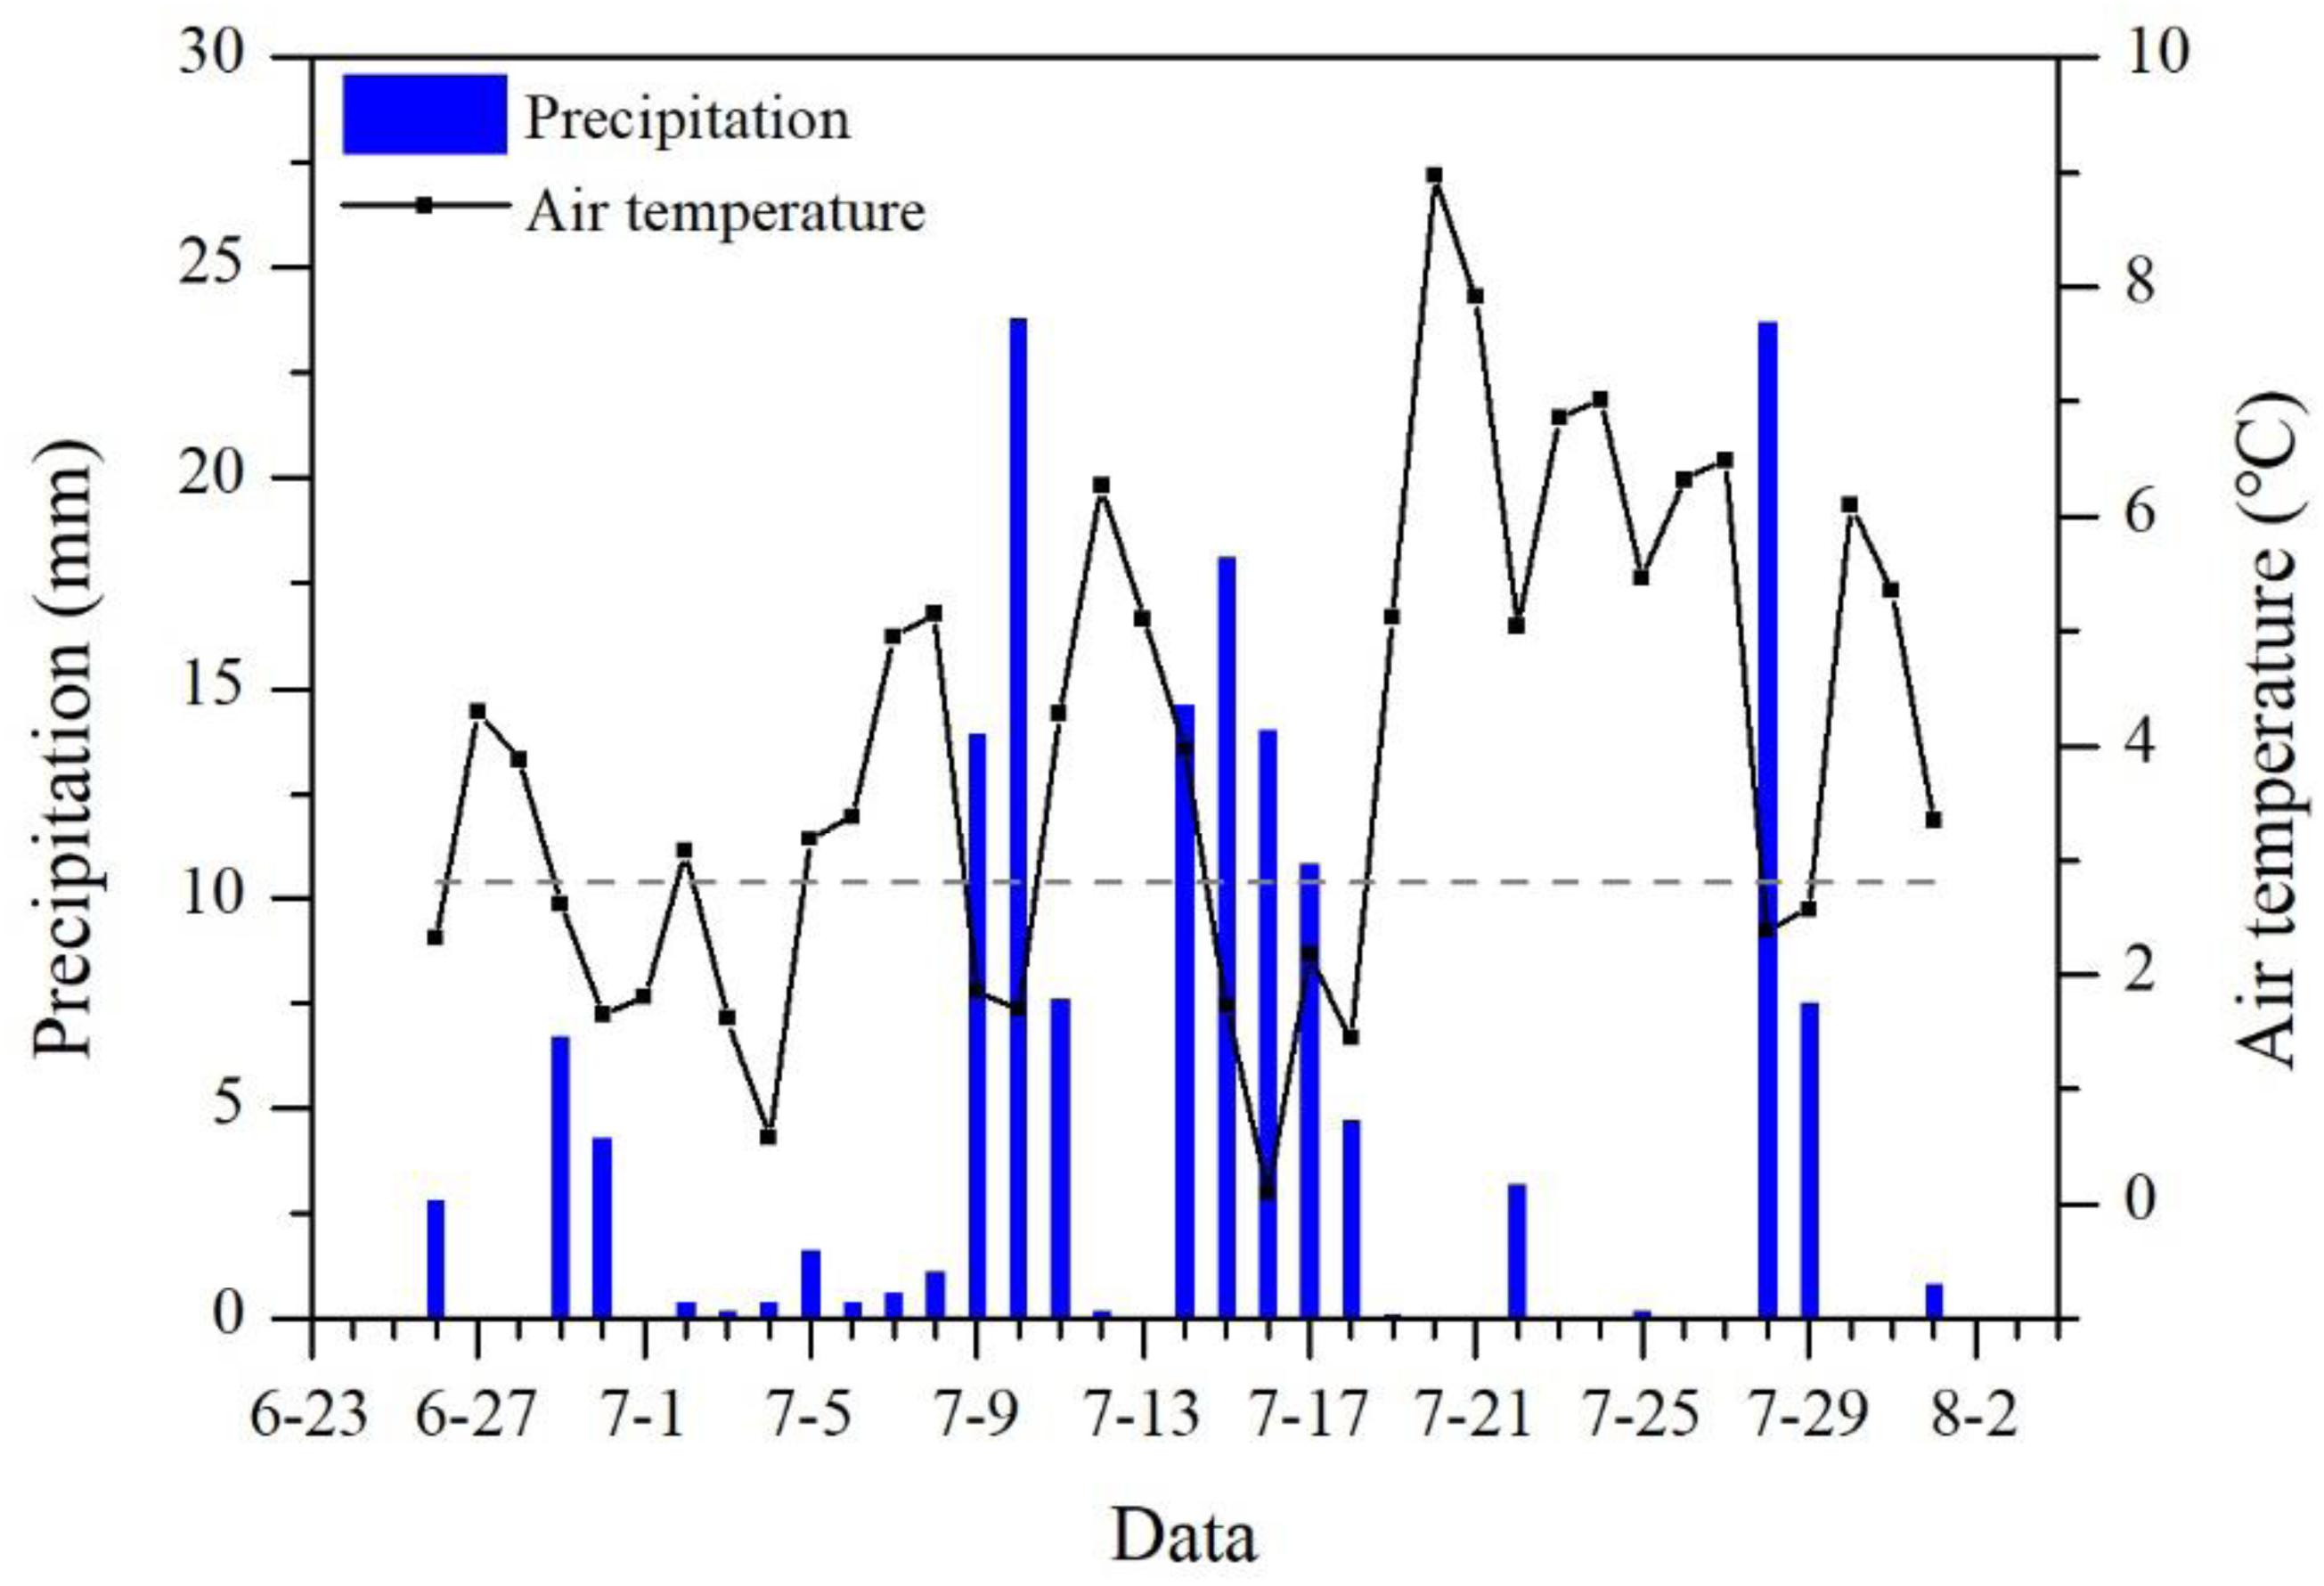
Figure 3. Daily variation of the air temperature and precipitation on Urumqi Glacier No.1 between 26 June and 1 August 2007. The dashed line represented the air temperature threshold of snowfall, which was 2.8°C. The meteorological data was from the Daxigou station (86°50’ E, 43°6’ N, elevation: 3593 m a.s.l), which is located 3 km southeast of Urumqi Glacier No. 1.
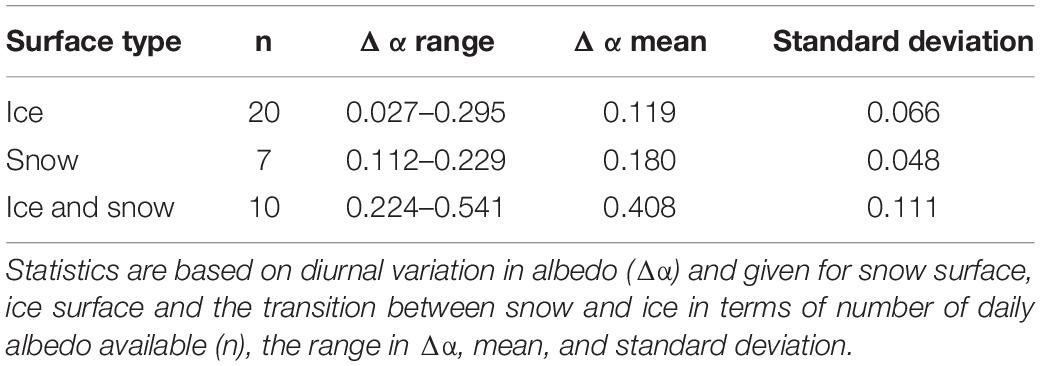
Table 2. Characteristics of variation in diurnal albedo records (Δα) in AWS between 26 June and 2 August 2007.
Figure 4 shows the spatial variation in the retrieved albedo from the satellite snapshots over the whole glacier. Missing data in some of the Landsat ETM + images (due to the SLC failure, post May 2003) occur in our albedo retrievals. However, compared with the image on 22 June, the percentage of missing data is less than 10% over the whole glacier on 16 July and 1 August, which has a negligible impact.
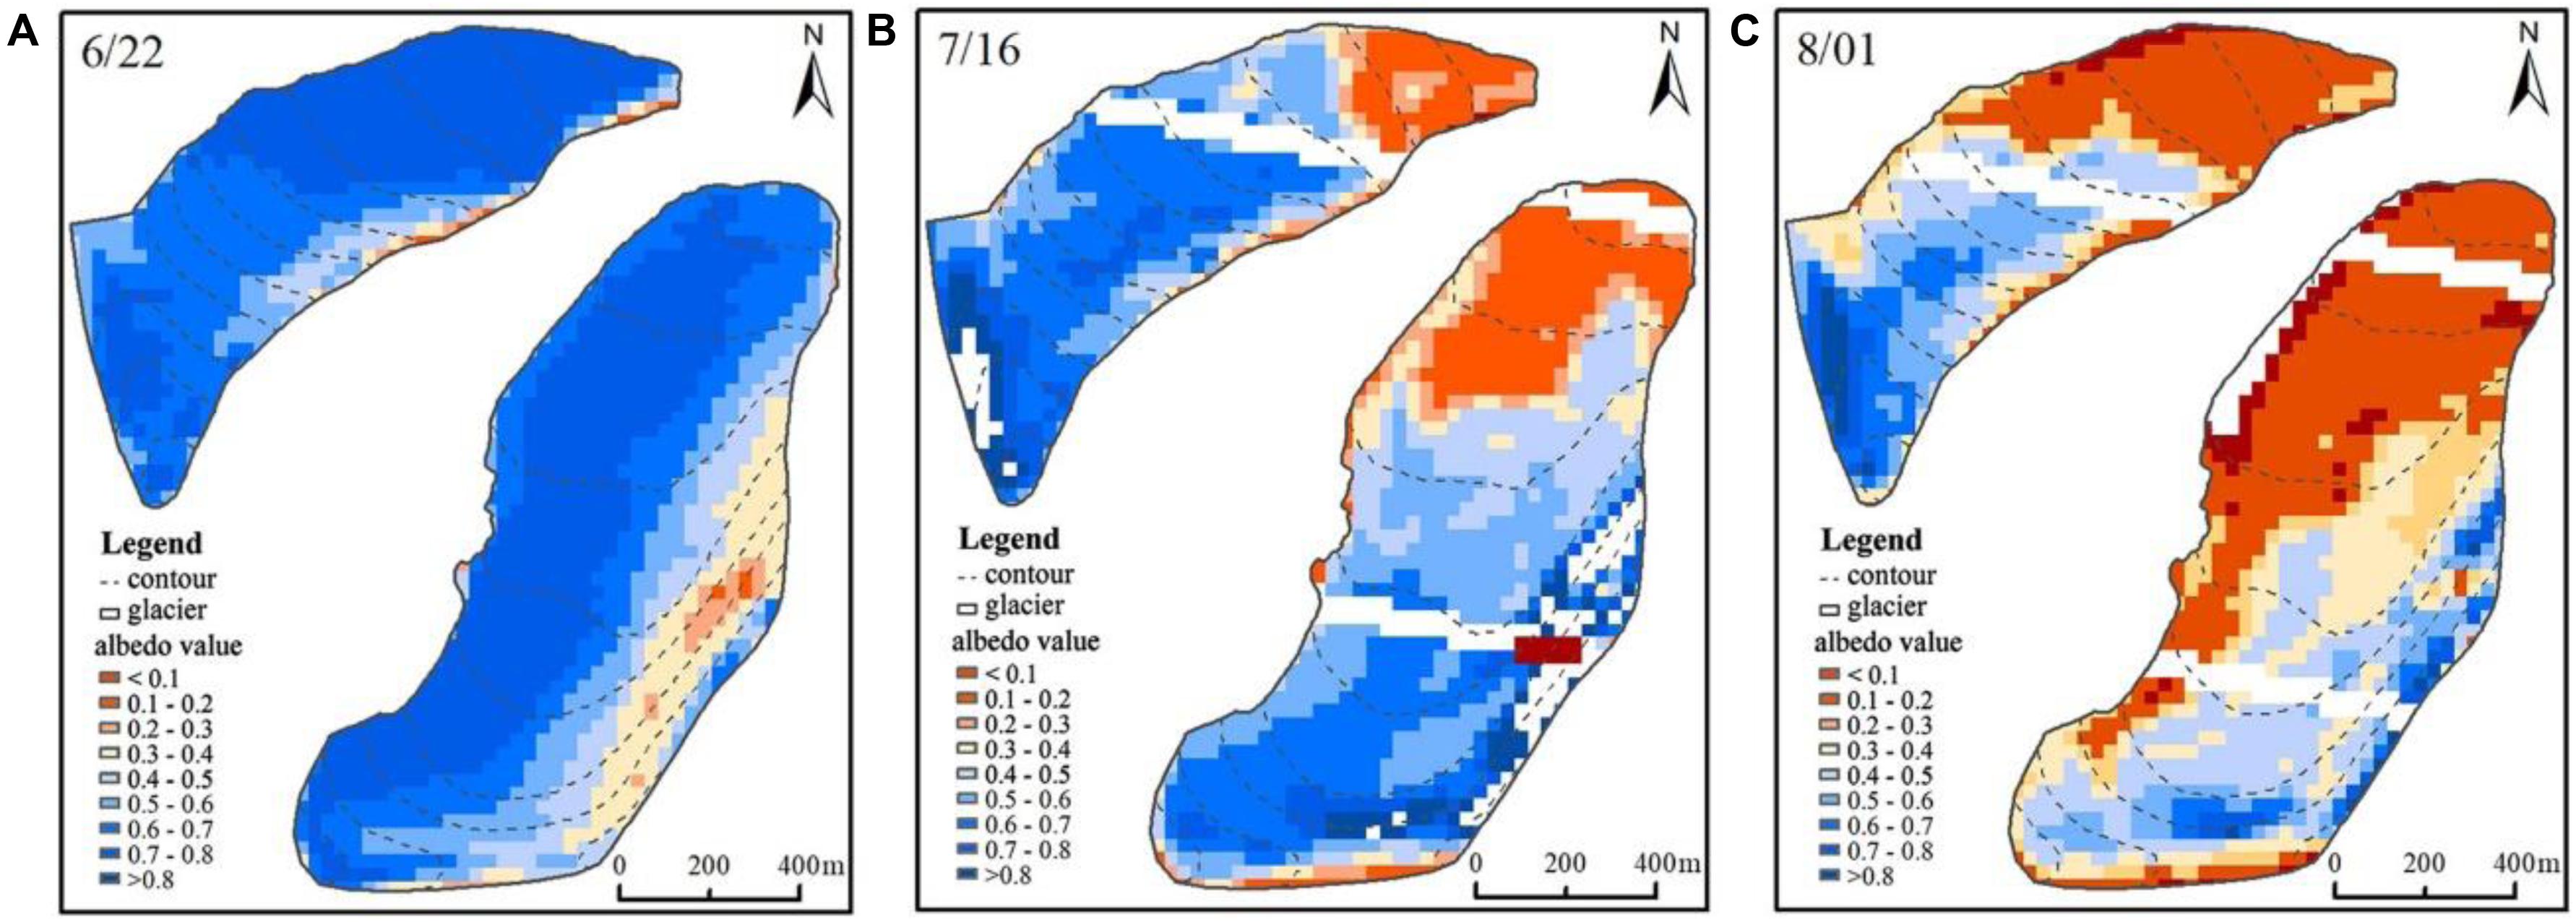
Figure 4. Spatial distribution of the surface albedo of Urumqi Glacier No. 1 in the 2006 ablation season.
On 22 June, spatial variation in the albedo was not obvious. The average albedo values for the glacier-wide scale was rather high, with a mean of 0.62 and a standard deviation of 0.13, indicating that the physical composition of the glacier surface was uniform. The frequency distribution of pixels has a peak around 0.70 (Figure 5). The glacier was, therefore, covered by snow, perhaps fresh snow or snow in an early stage of metamorphism.
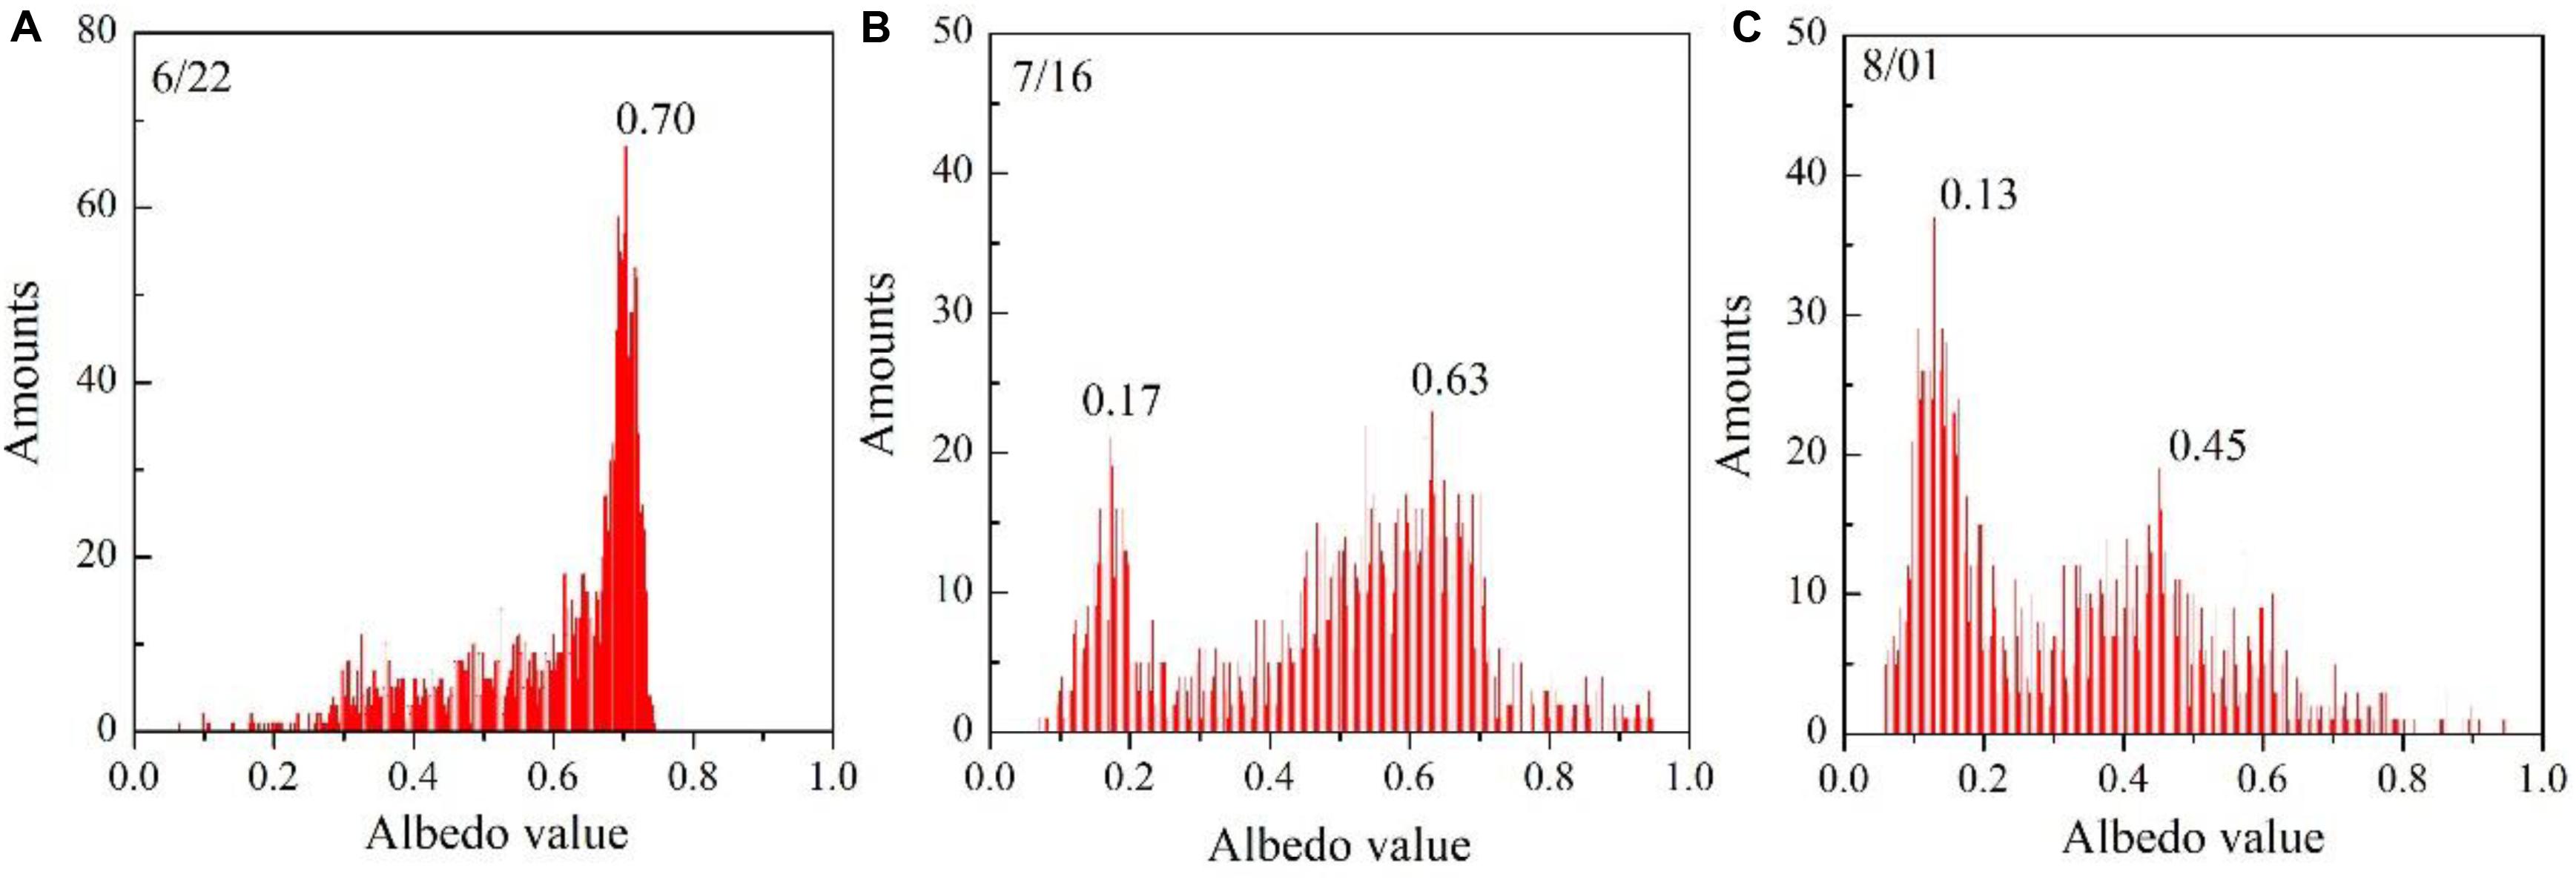
Figure 5. The frequency distribution of the surface albedo over the whole Urumqi Glacier No. 1 in the 2006 ablation season.
On 16 July, the glacier albedo showed considerable spatial variation, markedly increasing with altitude. The mean of the albedo was 0.49 with a standard deviation of 0.20 over the whole glacier. Two distinct peaks corresponding to the albedo of ice and snow are present in Figure 5 (Cuffey and Paterson, 2010). The snow albedo distribution is positively skewed around a value of 0.63, and the ice albedo is more normally distributed, with a strong peak at 0.17 (Figure 5). The glacier was clearly divided into a bare ice area and snow area by a snow line. The snow line altitude was around 3900 m a.s.l. on the eastern branch and 4000 m a.s.l. on the western branch. The pattern of spatial variation in albedo was slightly different between the eastern branch and the western branch. On the eastern branch, below the snow line, the albedo value was rather low, and variation with altitude was almost absent; the albedo value significantly increased above the snow line. On the western branch, the albedo fluctuated between low and high values below the snow line, while a gentle increase trend was shown above the snow line.
On 1 August, due to the expansion of ice surfaces, variation in albedo with altitude over the whole glacier was remarkable, while the mean albedo of the whole glacier decreased to 0.32 with a standard deviation of 0.19. The peaks corresponding to the albedos of ice and snow are very distinct, and low values occur more frequently than high values (Figure 5). The ice albedo decreased slightly by an average of 0.04, but the snow albedo decreased by an average of 0.18. The snow line retreated further and reached around 4000 m a.s.l. on the eastern branch and 4050 m a.s.l. on the western branch. Differences in spatial variation in albedo remained between the eastern branch and the western branch. On the eastern branch, below the snow line, 70% of the albedo values were lower than 0.2, while above the snow line, the albedo increased weakly, ranging from 0.4 to 0.6. However, on the western branch, below the snow line, the fluctuations disappeared: high values only occurred on the terminal part of the glacier. Above the snow line, the albedo increased steadily and reached a maximum of 0.8 at 4400 m a.s.l.
It is notable that the surface albedo is generally higher on the western branch glacier than on the eastern branch glacier during the study period. This may be attributed to morpho-topographic variables, such as average altitude, slope and aspect, as well as surface dust abundance. In addition, on 1 August, in the same altitude zone, the albedo value was lower on the west side than on the east side, mainly resulting from the differential ablation due to terrain shadowing of the eastern mountain. However, the above difference between eastern and western sides is not shown on 22 June and 16 July, which may be linked to the retrieval accuracy of the Landsat albedo. On 22 June and 16 July, differences between the surface conditions of the eastern and western sides of the were so small that the retrieval accuracy was not high enough to respond to the variation in albedo caused by different surface conditions.
Across the sampling sites of snow and ice, the considerable variation in the dry weight of surface dust is shown in Figure 6A. For the bare ice sites, the dry weight of dust varies between 228 g m–2 and 414 g m–2, with an average of 312 g m–2. The altitudinal profile of such amounts shows that surface dust content is higher in middle of the glacier than at the upper (S5) and terminal (S1) of the study glacier, except for the snow area. Meanwhile, the heterogeneous distribution of the dust is revealed by large standard deviations of the mean dry weight at each ice site – the largest value appears at site S4. The variability in the dry weight of organic matter is similar to that of surface dust (Figure 6B). The organic matter content ranges from 16 g m–2 (S5) to 43 g m–2 (S4), and the mean is 30.2 g m–2. However, on the bare ice surface, the altitudinal variation in the percentage of organic matter is slightly different from that the abundance of surface dust and organic matter (Figure 6C). The highest value is at site S2 (10.9%), gradually decreasing to site S5 (6.9%), with increasing altitude. Overall, for all ice sampling sites, the dry weight proportion of organic matter averages 9.4%.
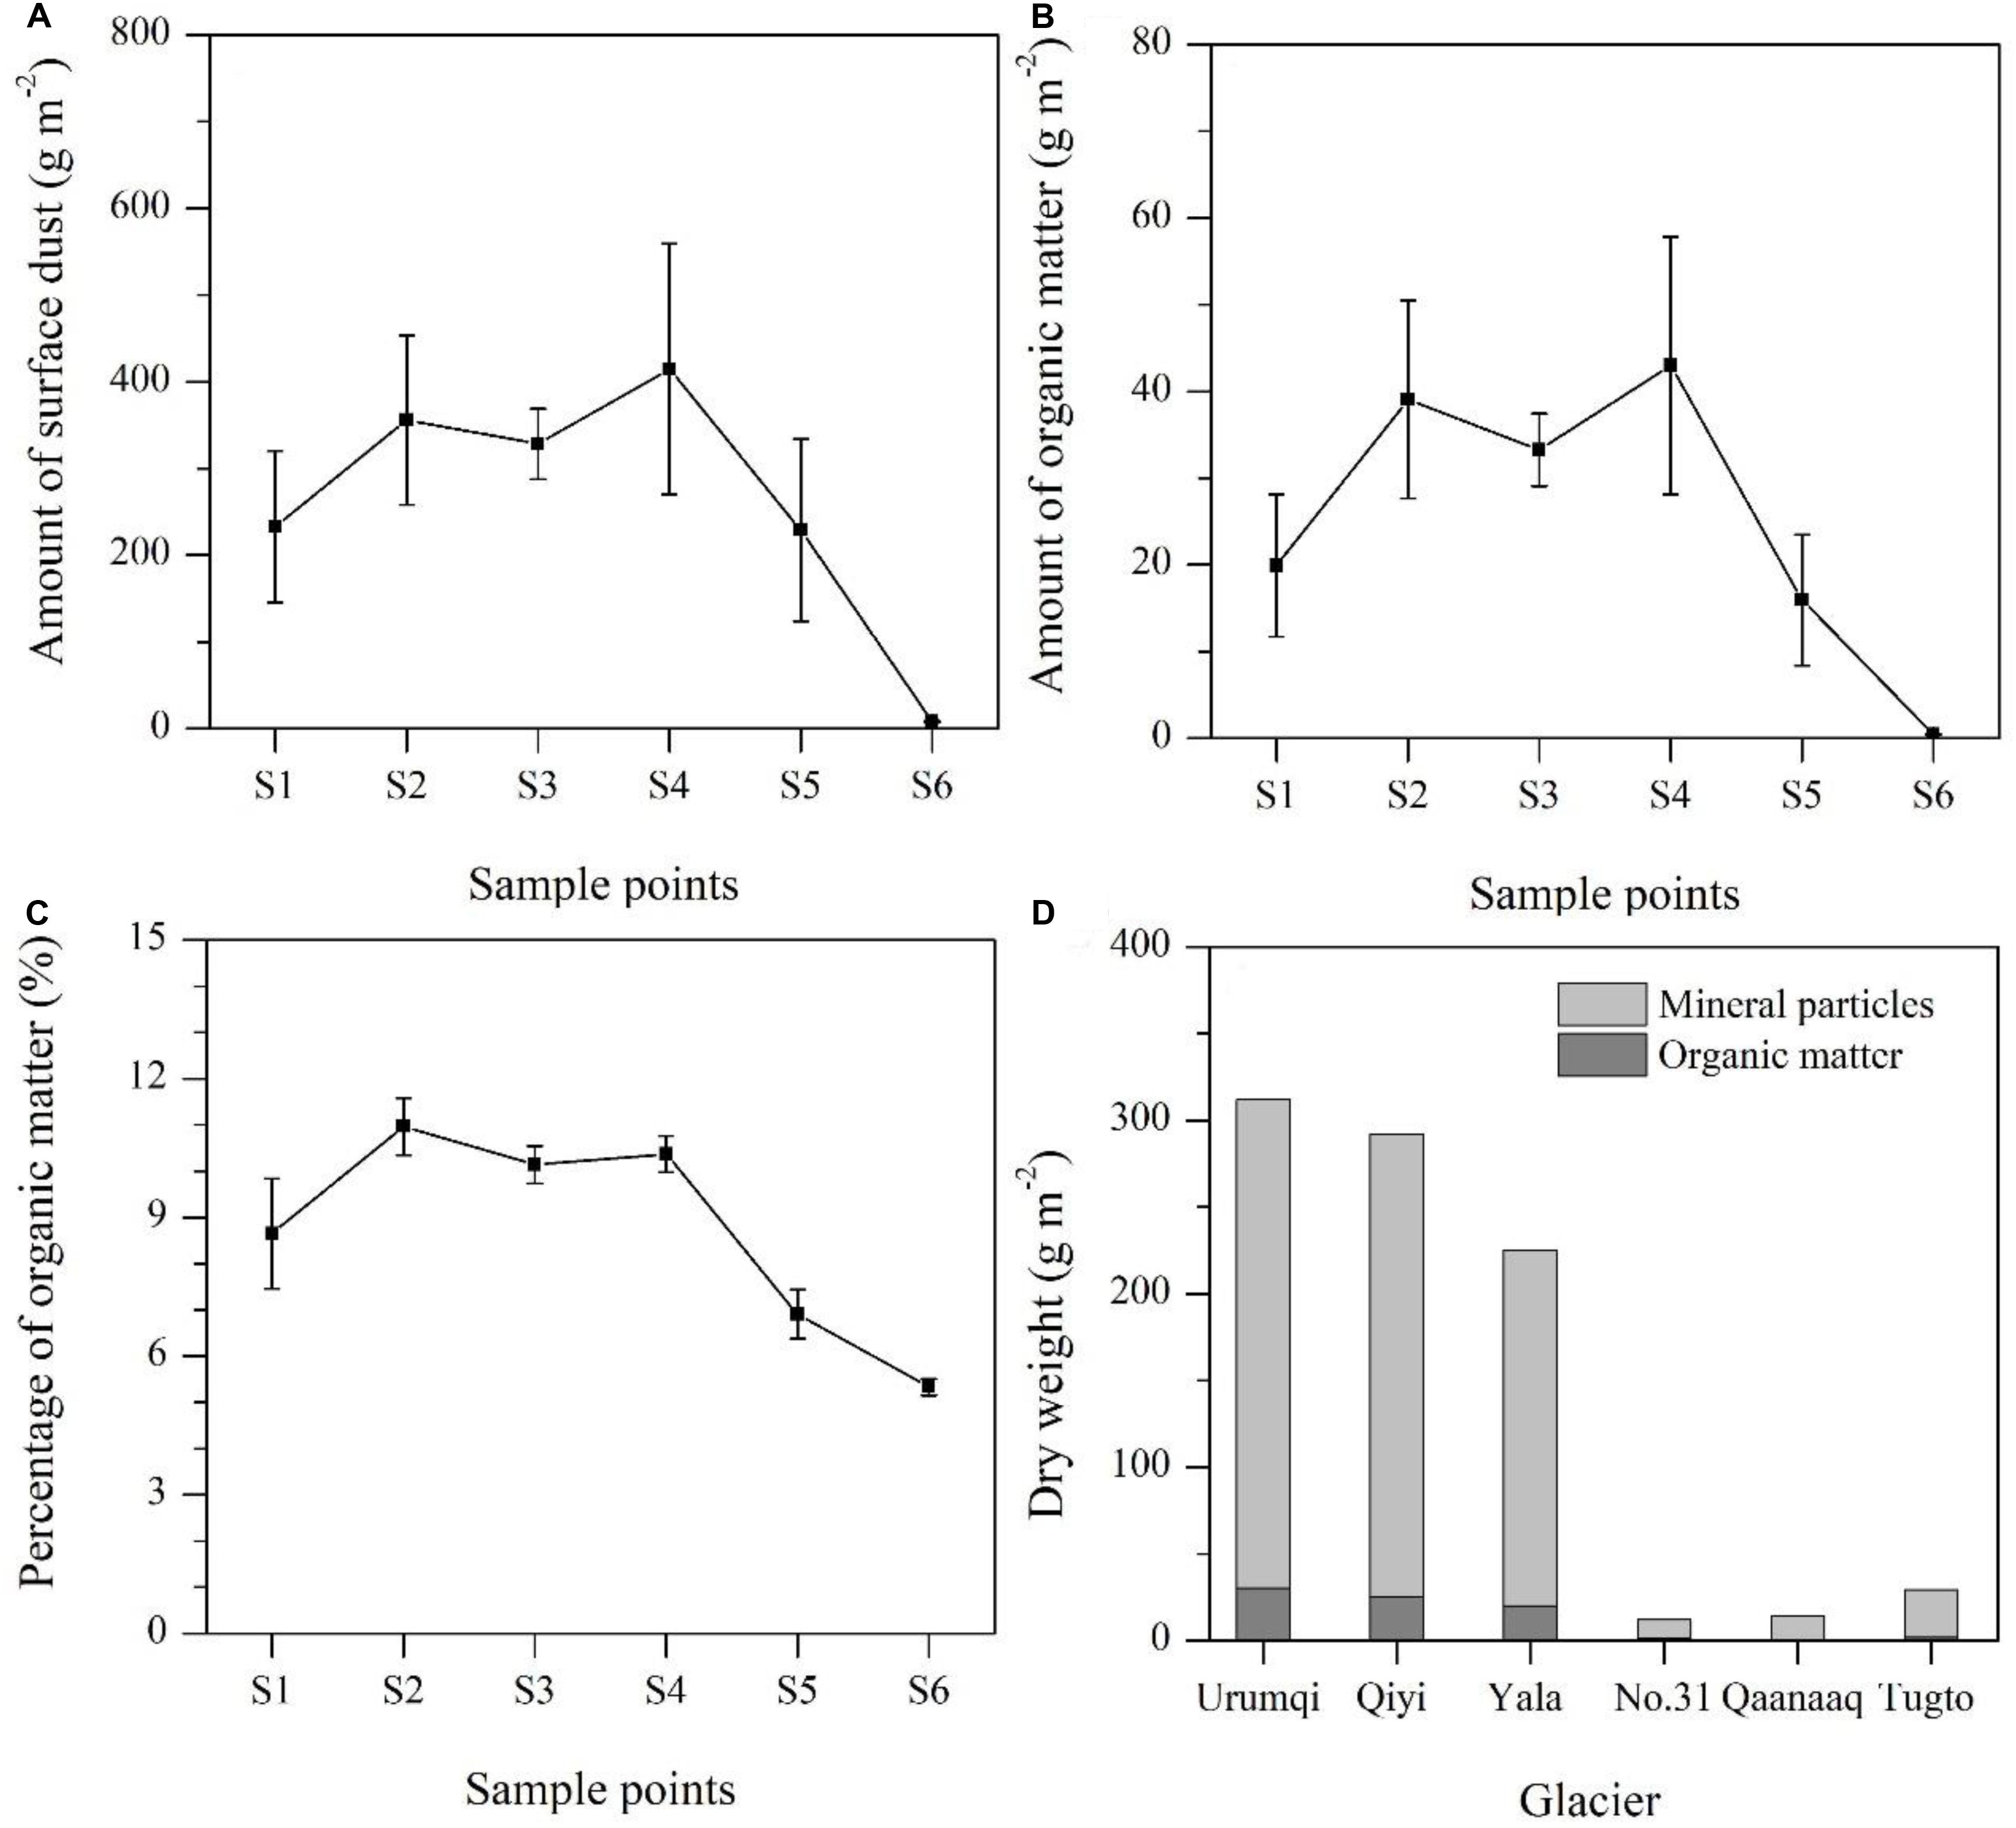
Figure 6. Variations in amount of surface dust (A) and organic matter (B), and percentage organic matter (C) on the Urumqi Glacier No. 1. Error bars indicates standard deviation. (D) Is the comparison of amounts of surface dust and their components among various glaciers around the world. Snow line located between site S5 and S6.
The dry weight of surface dust and its organic matter abundance, as well as the altitudinal variation agreed with the results obtained in August 2006 for Urumqi Glacier No. 1 by Takeuchi and Li (2008). This implies that the results of the present study are reliable, and that variation in the characteristics of surface dust on Urumqi Glacier No. 1 are relatively weak on a short timescale.
Compared with glaciers in polar or sub-polar regions, the abundance of mineral particles and organic matter on Urumqi Glacier No. 1 was markedly high (Figure 6D). The average abundance of mineral matter on Urumqi Glacier No. 1 was about 16 times that on the Northwest Greenland (Takeuchi et al., 2014) and eastern Russian Siberian glaciers (Takeuchi et al., 2015), and the abundance of organic matter was approximately 24 times. However, the abundance of surface dust was comparable that on the Asian mountain glaciers. The amount of total surface dust has been reported to be 225 ± 121 g m–2 for the Himalayas (Takeuchi et al., 2000) and 291 ± 166 g m–2 for the Qilian Mountains in China (Takeuchi et al., 2005), indicating that Asian glaciers may be typically characterized by a high abundance of dust. High levels of mineral particles on these glaciers are probably caused by exposure to abundant wind-blown deposits of desert dust, while the organic components may be the result of intensive biological productivity on the glacial surface (Takeuchi and Li, 2008). In addition, the altitudinal variation in dust abundance on Urumqi Glacier No. 1 was also distinct from that of many other mountain glaciers, such as Gulkana Glacier, the Alaska Range (Takeuchi, 2009), and Xiaodongkemadi Glacier (Li et al., 2017). Generally, on an ablation surface, dust or debris is more abundant in the low part (or near the terminus) of the glacier because mineral particles are mainly supplied from above by glacial flow or from the basal bed by marginal shearing and concentrated on the surface layer as glacier ice melts (Takeuchi et al., 2014). However, compared with sites in the middle of the glacier (S2, S3, and S4), a small amount of dust was discovered in the area near the terminus of Urumqi Glacier No. 1 (S1). The altitudinal variation in surface dust abundance may be attributed to the removal of surface dust by meltwater in the lower part of the glacier (Brock, 2004; Azzoni et al., 2016). Moreover, in the middle of the glacier, the flatter surface terrain is beneficial for the concentration of windblown deposits of dust and microbial activity.
Recently, various research groups have revealed that surface dust significantly reduces glacier albedo, thus accelerating glacier melt (Takeuchi, 2002; Oerlemans et al., 2009; Gabbi et al., 2015; Wittmann et al., 2017). In addition, as shown in Figure 4, albedo values were higher in the low zone of the glacier than in the middle zone of the glacier for the west branch, which contradicts the general assumption that surface albedo increases with altitude in mid-latitude mountain glaciers (Wang et al., 2014; Fugazza et al., 2016). These distinctive albedo spatial distributions were mainly attributed to surface dust concentration.
In order to quantify the effects of surface dust on albedo, reflectance spectra were collected at ice and snow sampling sites (Figure 1B). The large amounts of surface dust at S4 coincided with a relatively low albedo (0.14), and small amounts of surface dust at S5 coincided with a high albedo (0.27) except for the snow area (S6). The albedo significantly decreases, and spectral curves flatten, as the concentration of surface dust increases (Figure 7). Thus, the amount of surface dust accounts for variation in glacier albedo. We analyzed the correlation between the dry weight of organic matter and mineral particles in surface dust and ice albedos, respectively (Figure 8). The results show that ice albedo follows a negative correlation relationship with the dry weight of mineral particles and organic matter. Organic matter had a much higher correlation with albedo than mineral particles (r = -0.94, p = 0.016, n = 5 vs. r = -0.87, p = 0.055, n = 5, respectively), although the mass proportion of organic matter was much less than that of mineral particles (6.9–11.5% for organic matter content). These relationships suggest that organic matter in the cryoconite decreases the glacier albedo more effectively than do mineral particles.
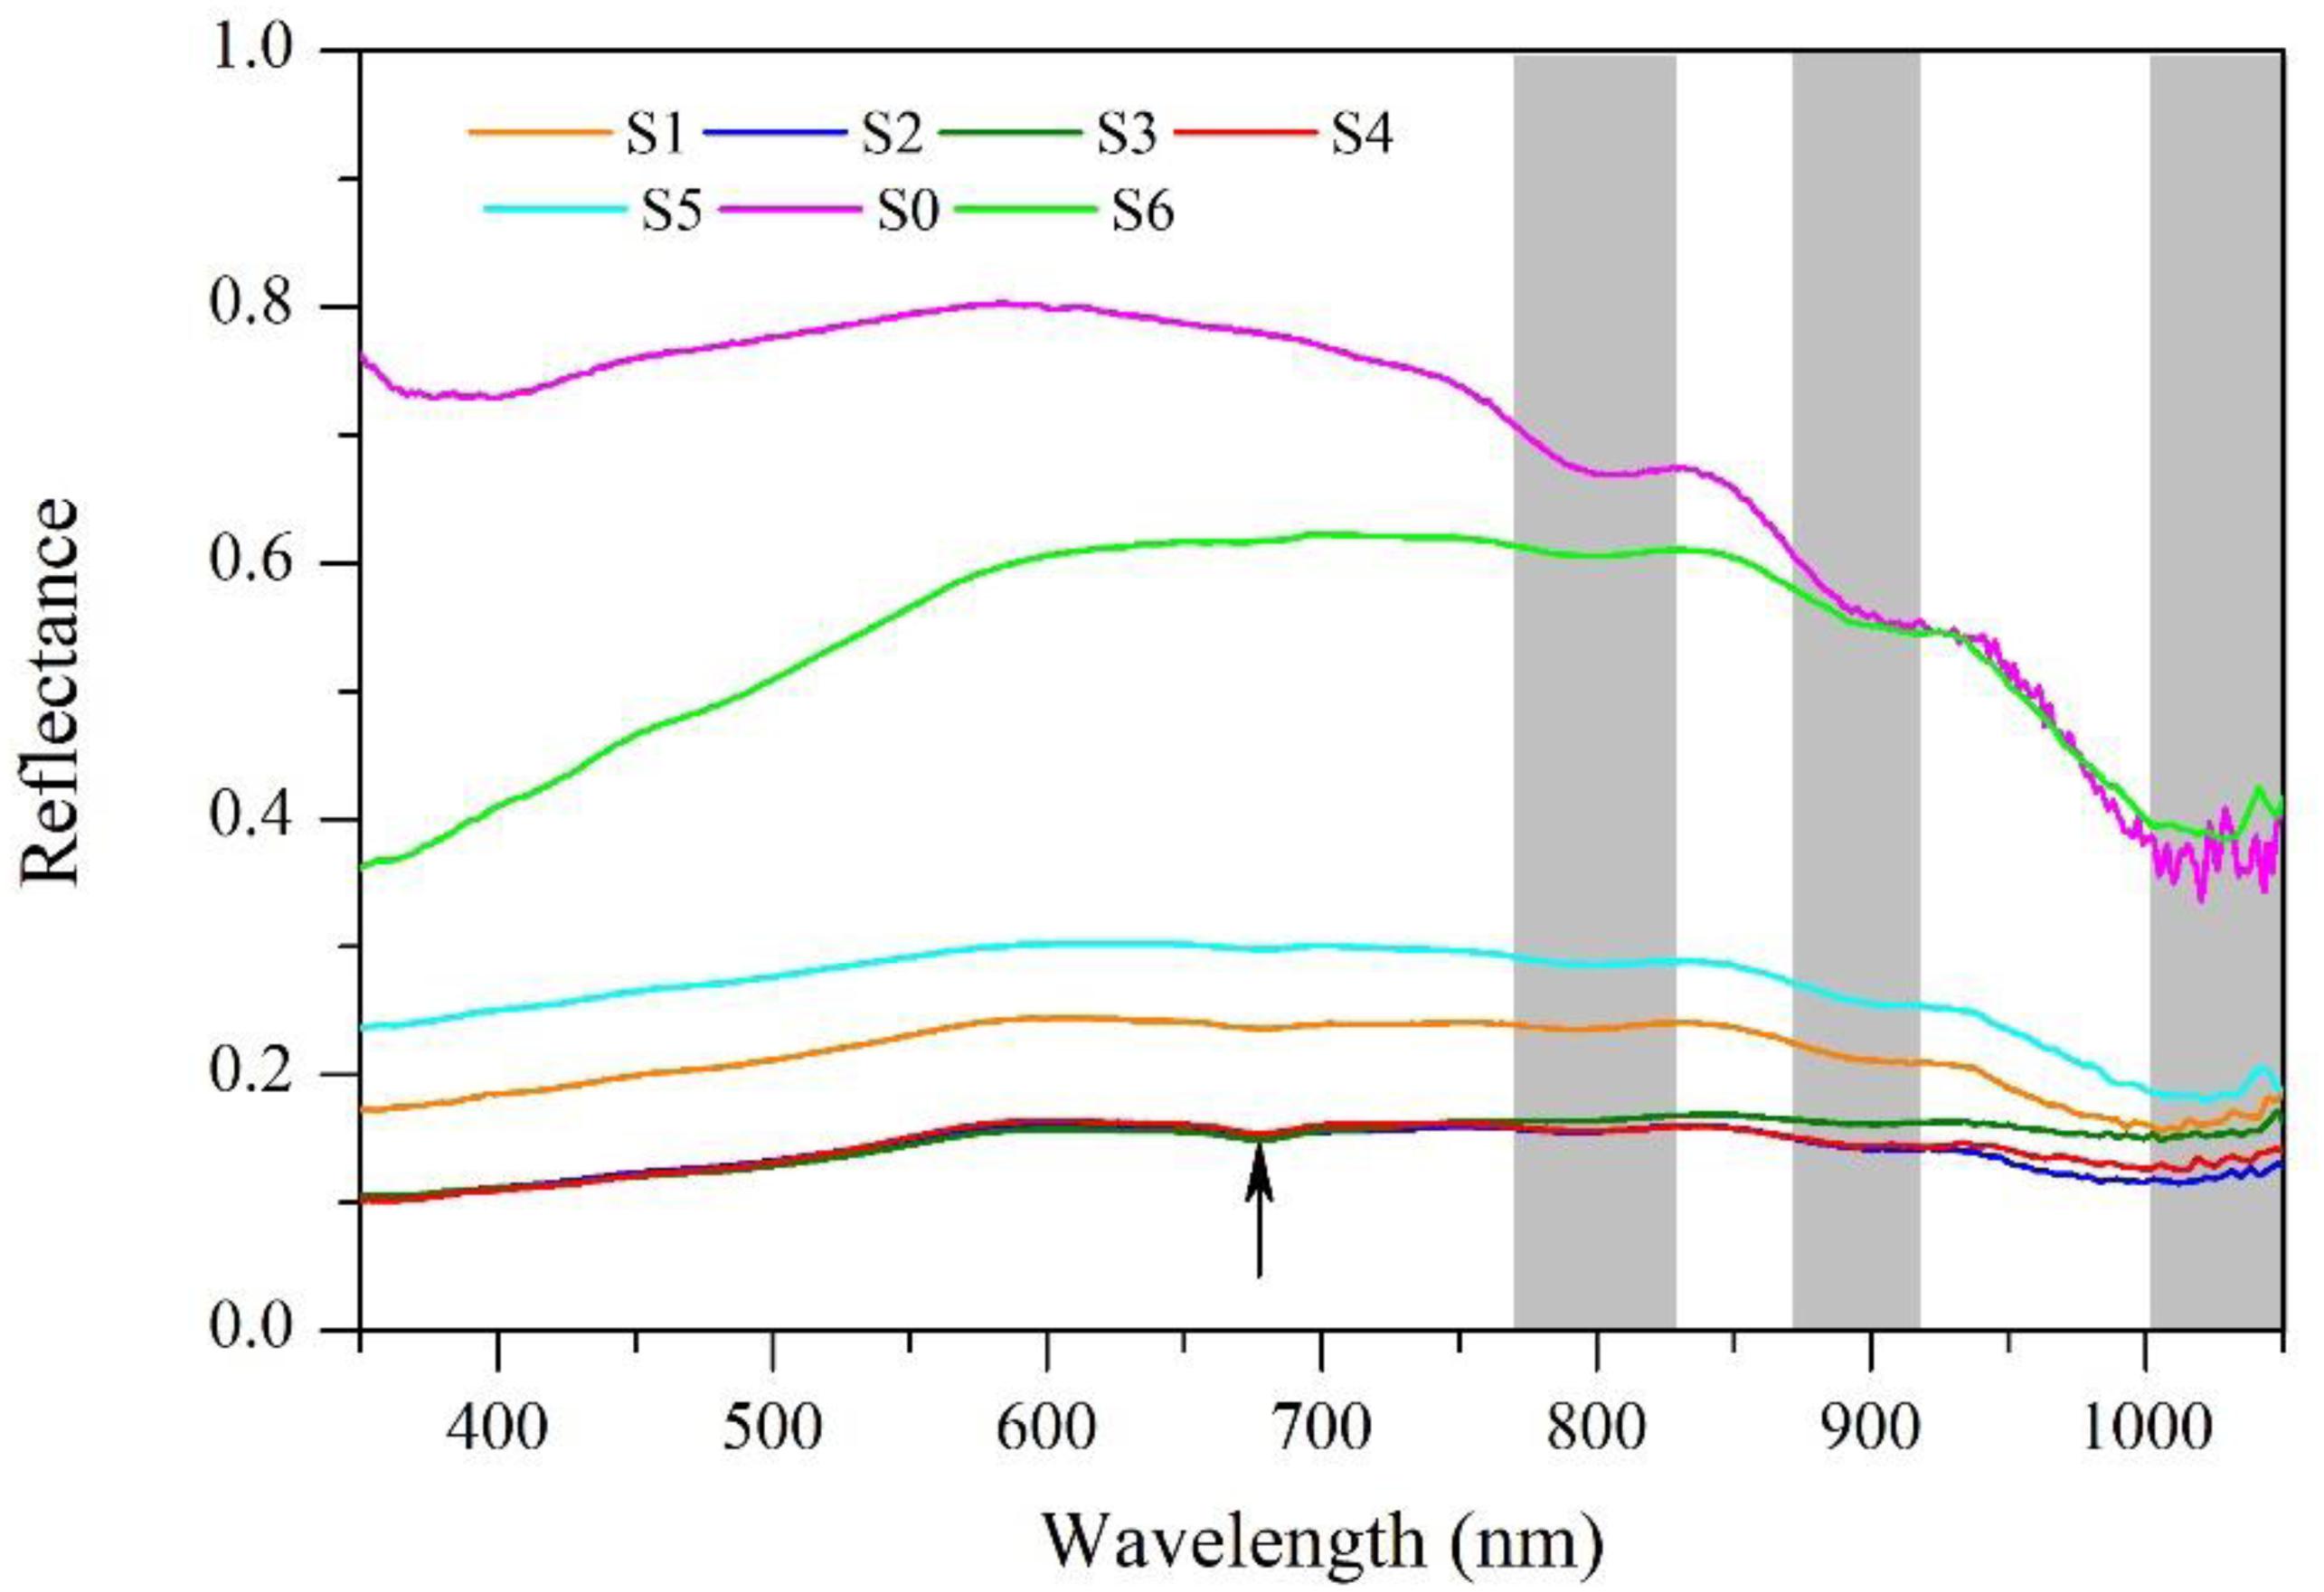
Figure 7. The reflectance spectrum curves in wavelength ranged from 350 to 1050 nm on the surface of the Urumqi Glacier No. 1. S0 was collected over the pure aged snow surface of Urumqi Glacier No. 1 (Yue et al., 2017). The arrow shows absorption feature at 670–680 nm due to chlorophyll in the surface dust. The gray bands mark the known absorption wavelengths for ice/water.
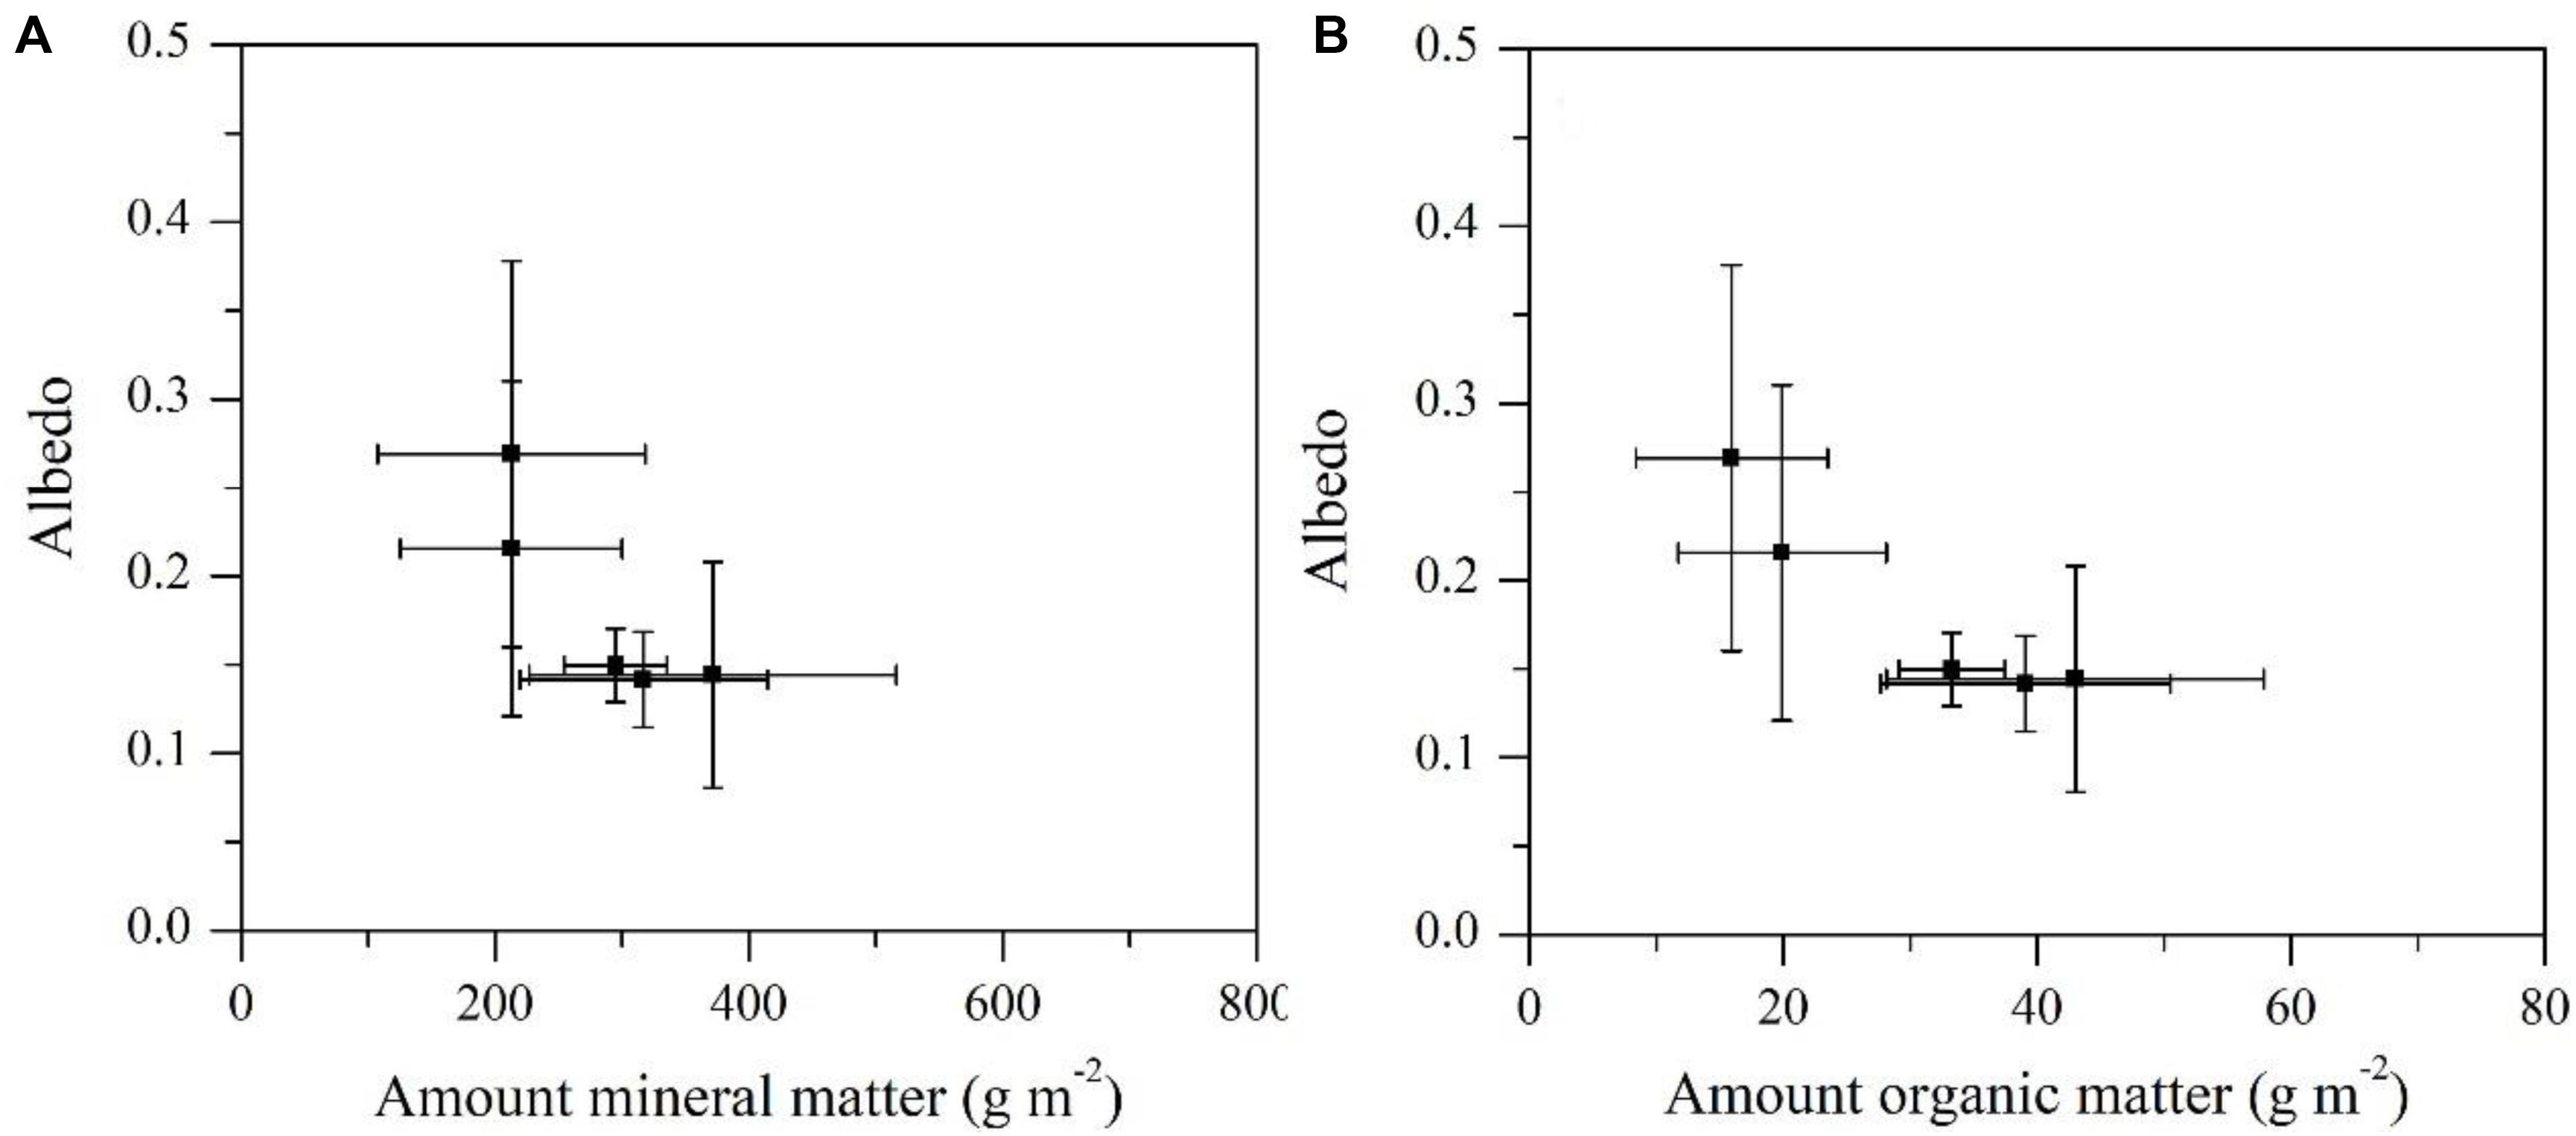
Figure 8. Relationships between surface albedo and the number of mineral particles (A) and surface albedo and the amount of organic matter (B) on the ice surfaces.
A microscopic study indicated that dust or cryoconite on the glacier surface is composed of wind-blown desert dust and organic matter. The latter is a product of microbial activity on the glacier itself, including the activity of filamentous cyanobacteria, dead bodies of microbes, and a dark-colored humic substance (Takeuchi et al., 2010). For the ice-surface spectrum, a valley at around 680 nm is clearly evident, which probably results from the chlorophyll of snow algae and cyanobacteria on the cryoconite (Figure 7).
For the snow albedo, the crude profile of the snow reflectance spectrum is determined by the complex refractive index of ice, which closely approximates that of liquid water at wavelengths (λ) less than 5 μm (Wiscombe and Warren, 1980; Li et al., 2019). Valleys at wavebands of ∼770–830, 870–920, and 1000–1050 nm are shown, resulting from the strong absorption of ice and water. In general, snow reflectance increases for λ < 600 nm and decreases for λ > 850 nm (Li et al., 2019). Compared with pure aged snow (S0), dust reduces spectral reflectance at wavelengths shorter than 900 nm (Figure 7). According to the simulated results by Ming et al. (2016) in Urumqi Glacier No. 1, dust and black carbon contribute about 7% and 25% to the reduction in albedo in the accumulation zone, respectively.
An important factor driving variations in albedo is cloud-cover fluctuations. Glacier albedo normally increases with increasing cloudiness, and the visible wavelengths (300–695 nm) are more sensitivity than the near-infrared wavelengths (695–2800 nm) to the presence of cloud (Gardner and Sharp, 2010; Abermann et al., 2014). Furthermore, there is a more sensitive response of snow reflectivity to variation in cloud compared with ice reflectivity (Jonsell et al., 2003; Brock, 2004).
In order to quantify the effect of cloud on glacier albedo, the linear relationship Δα to Δ(Gh/T) was fitted by scatter of points, and analyses were performed separately for snow and ice surfaces (Figure 9). A weak, but significant, negative correlation between albedo change and cloud-cover variation is evident. Furthermore, compared with snow surfaces, ice surfaces have a correlation that exhibits more scatter, with a lower slope of the linear fit. These results also suggest that the sensitivity of ice albedo to cloud is much weaker. When Δ(Gh/T) = 1, the linear fit predicts a maximum Δα of 0.18 that lies between 0.02 and 0.24 as a maximum value for cloud-induced albedo change according to previous studies (Table 3; Abermann et al., 2014).
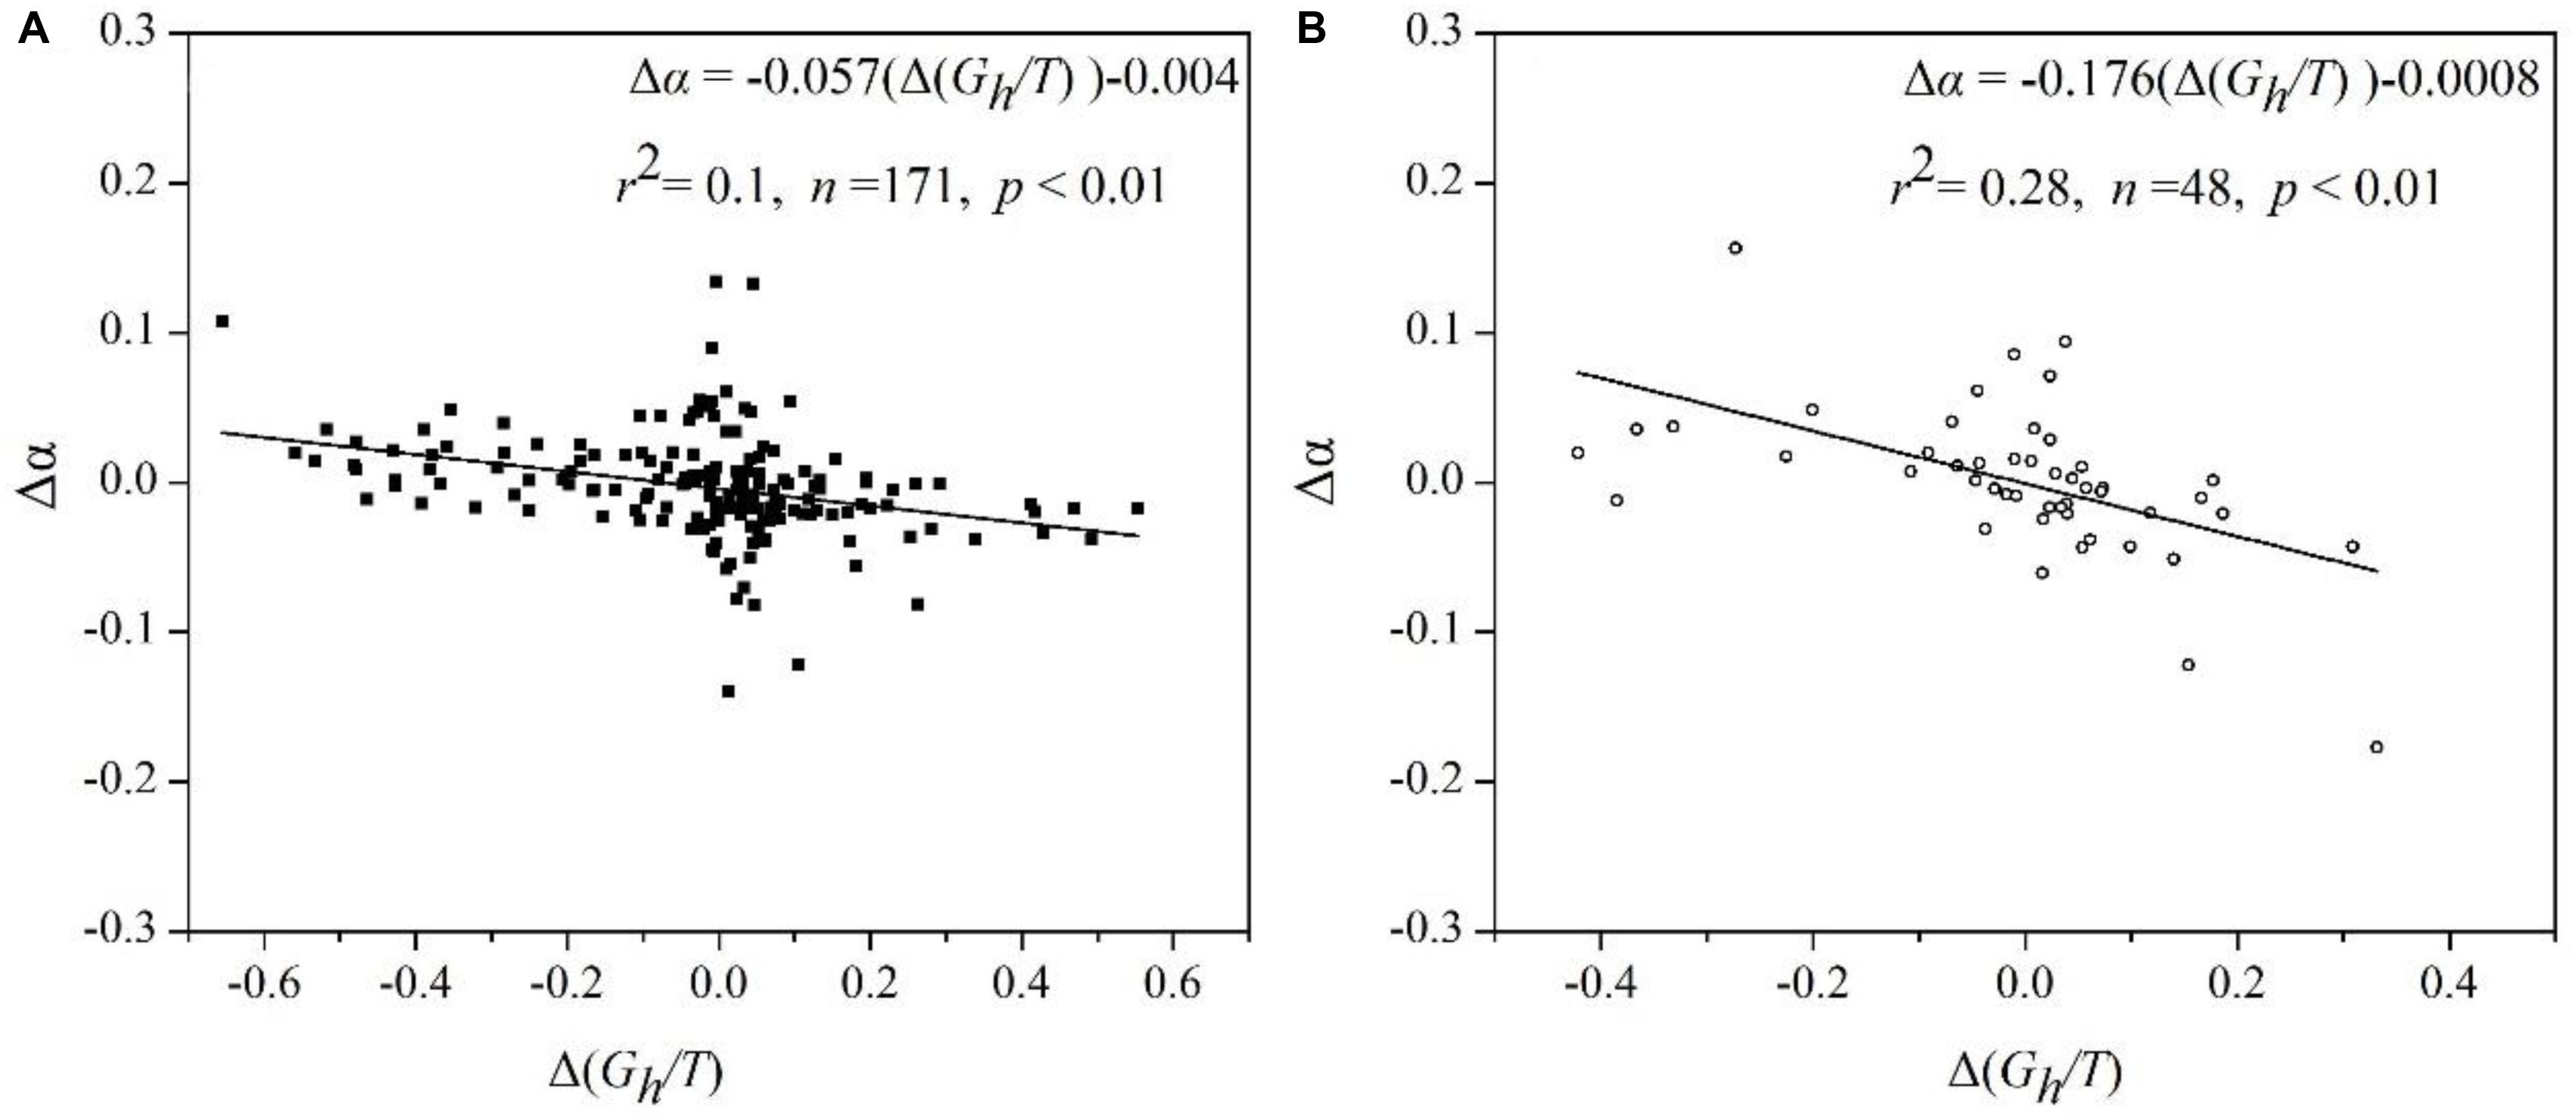
Figure 9. The changes in albedo (Δα) between successive half hour vs. the corresponding changes in diffuse portion of shortwave incident radiation, Δ(Gh/T) over ice (A) and snow (B) between 26 June and 2 August 2007.
The increase in reflectivity caused by clouds has several causes. Clouds, which have similar optical properties to snow, can alter the spectral distribution of incident shortwave radiation by preferentially absorbing near-IR wavelengths and returning near-UV and visible wavelengths. Consequently, this increases the fraction of total shortwave radiation incident at shorter wavelengths where the albedo of glacier is highest (Gardner and Sharp, 2010). Moreover, the weaker sensitivity of ice albedo to cloud due to the lower albedo of ice compared with that of snow, and creating multiple reflections between the surface and the cloud base to less efficient at increasing albedo (Jonsell et al., 2003). In addition, the weaker sensitivity of ice albedo to cloud may be related to the cloud base height, as observed at Haut Glacier d’Arolla by Brock (2004). Clouds also alter the effective solar zenith angle of the incident radiation due to an increase in its diffuse fraction (Abermann et al., 2014). In general, albedo increases with solar incident angle. This is because, at large angles of incidence, on average, a photon travels a path closer to the glacier surface, resulting in an increase in the probability that it is scattered, moving it out of the snowpack (Warren, 1982). However, diffuse radiation has an effective solar zenith angle of ∼50° over a horizontal snow surface (Warren, 1982; Gardner and Sharp, 2010). Below 50°, an increase in albedo is expected (as a result of an increased effective zenith angle), whereas above 50°, a decrease of albedo occurs (Abermann et al., 2014).
In addition, for the ice albedo, the sensitivity of a “clear” and “dark” ice albedo to clouds may be different. Theoretically, as mentioned above, the proportion of visible light is enhanced with the occurrence of clouds. However, impurities substantially decrease the glacier surface albedo in the visible region (300–700 nm) where absorption by the glacier is weakest, and albedo decreases. Thus, the effects of impurities on glacier albedo is contrary to the clouds. Under cloudy conditions, the presence of impurities may compromise the increase in albedo to some extent, and, as with the increase in the impurity abundance, the degree of its offset may be enhanced. In addition, because the degree of decrease of glacier albedo caused by impurities depends on the kinds of impurities, the sensitivity of dark ice albedo to cloud needs to take into account the kind of impurities. Of course, the above speculation requires a sufficiently large and accurate albedo measurement dataset to verify.
In a melting surface, the spatial distribution of surface albedo primarily depends on the area of snow and bare ice. The glacier is mainly covered by snow or firn in the accumulation zone, and glacier ice is exposed in the ablation zone. Hence, surface albedo generally increases with elevation. In particular, around the snow line, the transition of ice to snow or firn results in a rapid and distinct increase in albedo. Moreover, the spatial change in surface albedo is related to slope and aspect, which dominate the solar incident angle; glacier albedo clearly increases with solar incident angle, even for uniform surface coverage (Wang et al., 2014; Yue et al., 2017). In addition, there are high concentrations of dust over a bare ice surface and spatial variation in albedo is controlled by the abundance of surface dust; albedo significantly decreases as the abundance of surface dust increases.
In the current study, along the length of a glacier, the dust abundance is higher at the middle elevation sites (S2, S3, and S4) than at the higher elevation (S5) and lower elevation sites (S1) except for the snow area. In the transverse scale of the glacier, it is easy to accumulate dust or debris on the left and right sides of the glacier because these sides are close to bare soil surfaces. Thus, theoretically, the surface albedo should be lower in the middle elevation or near the left and right sides of the glacier. However, these spatial variations in albedo were not obvious in the retrieved surface albedo map taken from Landsat images. For a bare ice area, the altitudinal variation in satellite-derived albedo is slightly different from the measurement results of Takeuchi and Li (2008). These differences likely result from the retrieval accuracy of the Landsat albedo, which is not high enough to respond well to variation in the albedo caused by differences in dust abundance. In addition, it is probably due to a contrast of spatial resolution between the ground based and satellite-derived data (Yue et al., 2017). The measurement albedo and dust abundance can have high spatial variability over distances of only a few meters, evidenced by the high standard deviation. Thus, it is very probable that any abnormal sampling point has a significantly low or high dust abundance and albedo. However, the albedo derived from the Landsat image is the average value for a 30 m × 30 m area.
In this study, the temporal variations in albedo were investigated using a data set of half-hour albedo measurements by AWS between 26 June and 1 August 2007 over the ablation area of Urumqi Glacier No. 1, a valley glacier in China. The data suggested that glacier albedo changes were characterized by a large range and very high frequency in the ablation season. Moreover, variations in surface albedo were generally more drastic for snow than ice, when solar zenith angle variations were less than 65°. The temporal variation in albedo emphasized that snow and ice surfaces must be treated separately. Over an ice surface, under the condition of more intense ablation, almost no variation in diurnal albedo cycles implied that the satellite-derived albedo represented short-term albedo values if there was no snowfall. However, rapid albedo variation caused by snowfall and snow metamorphism can quickly render satellite-derived albedo measurements out of date, even over the course of 1 day.
Spatiotemporal variation in albedo on a glacier-wide scale was also studied using three Landsat images taken during the ablation season in 2006. The retrieval results indicated that the mean of the glacier albedo gradually decreased as the ablation progressed, from 0.62 to 0.32. However, differences in the physical composition of the glacier surface gradually increased, with a standard deviation of 0.13–0.20. Spatial variation in surface albedo was not obvious after snowfall. However, once ice was exposed, spatial variation became marked and generally increased with elevation, especially around the equilibrium line. Moreover, the patterns of spatial variation in the albedo on the eastern branch and the western branch were slightly different, which may be related to morpho-topographic variables, such as average altitude, slope, and aspect.
The characteristics of surface dust and their effect on glacier albedo were analyzed based on reflectance spectra and sampling snow and ice. The study glacier was mostly covered by fine brown dust in the ablation area. The dry weight of the surface dust ranged from 228 to 414 g m–2 with a mean of 312 g m–2, which was within the normal range for Asian glaciers but significantly higher than that of glaciers of polar or sub-polar regions. Organic matter content in the dust ranged from 6.9 to 10.9% (with a mean value of 9.4%) on the ice surface. The abundances of dust and organic matter were greater in the middle parts of the glacier compared with the lower and upper parts of the glaciers. Glacier albedo was significantly reduced by surface dust, and organic matter was more effective than mineral particles in reducing albedo.
This study has discussed the influence of cloud on glacier albedo, in terms of physical properties, and attempted to quantify the dependence of variation in surface albedo on cloudiness over snow and ice surfaces using the diffuse portion of shortwave incoming radiation. The results indicated that a higher sensitivity of albedo to cloud was shown over snow surfaces.
The datasets for this article are not publicly available. Requests to access the datasets should be directed to XY, eXVleGlhb3lpbmdAbHpiLmFjLmNu or bnRha2V1Y2hAZmFjdWx0eS5jaGliYS11Lmpw.
XY, ZL, and NT designed research. XY performed the data analysis and wrote the manuscript. NT conducted field investigations and laboratory analyses. JZ and XY retrieved the glacier surface albedo from Landsat images. JF edited the English language of this manuscript. LW contributed to the figures drawing.
This work was supported by the Foundation for Excellent Youth Scholars of NIEER, CAS (FEYS2019003), the Strategic Priority Research Program of Chinese Academy of Sciences (XDA20020102 and XDA20020103), State Key Laboratory of Cryospheric Sciences (SKLCS-ZZ-2020), the National Natural Science Foundation of China (41761134093, 41771081, 41771077, and 41601076), the Grant-in-Aids of Japan Society for the Promotion of Science (23221004, 26247078, 26241020, and 16H01772), and the domestic visiting research program of Northwest Normal University.
The authors declare that the research was conducted in the absence of any commercial or financial relationships that could be construed as a potential conflict of interest.
We would thank to the members of Tien Shan Glaciological Station, Northwest Institute of Eco-Environment and Resources of Chinese Academy of Sciences in Lanzhou, China, and Professor Takeuchi team of Department of Earth Sciences of Graduate School of Science of Chiba University, Japan, for supporting the data collection and laboratory analyses. We also thank the USGS (US Geological Survey) for the Landsat image data. In addition, we are very grateful to chief editor, scientific editor, and two reviewers for their comments on the manuscript.
Abermann, J., Kinnard, C., and Macdonell, S. (2014). Albedo variations and impact of cloud on glaciers in the Chilean semi-arid Andes. J. Glaciol. 60, 183–191. doi: 10.3189/2014JoG13J094
Arendt, A. (1999). Approaches to modelling the surface albedo of a high arctic glacier. Geogr. Ann. 81A, 477–487. doi: 10.1111/j.0435-3676.1999.00077.x
Arnold, N. S. I., Willis, I. C., Sharp, M. J., Richards, K. S., and Lawson, W. J. (1996). A distributed surface energy-balance model for a small valley glacier. I. development and testing for Haut Glacier d’Arolla, Valais, Switzerland. J. Glaciol. 42, 77–89. doi: 10.1017/S0022143000030549
Azzoni, R., Antonella, S., Zerboni, A., Maugeri, M., Smiraglia, C., and Diolaiuti, G. A. (2016). Estimating ice albedo from fine debris cover quantified by a semi-automatic method the case study of Forni Glacier. Italian Alps. Cryosphere 10, 665–679. doi: 10.5194/tc-10-665-2016
Brock, B. W. (2004). An analysis of short-term albedo variations at Haut Glacier d’Arolla, Switzerland. Geogr. Ann. 86, 53–65. doi: 10.1111/j.0435-3676.2004.00213.x
Brock, B. W., Willis, I. C., and Sharp, M. J. (2000). Measurement and parameterization of albedo variations at Haut Glacier d’Arolla, Switzerland. J. Glaciol. 46, 675–688. doi: 10.3189/172756500781832675
Cong, Z., Gao, S., Zhao, W., Wang, X., Wu, G., Zhang, Y., et al. (2018). Iron oxides in the cryoconite of glaciers on the Tibetan Plateau: abundance, speciation and implications. Cryosphere 12, 3177–3186. doi: 10.5194/tc-12-3177-2018
Cuffey, K. M., and Paterson, W. S. B. (2010). The Physics of Glaciers, 4th Edn. Oxford: Butterworth-Heinemann/Elsevier.
Cutler, P. M., and Munro, D. S. (1996). Visible and near-infrared reflectivity during the ablation period on Peyto Glacier, Alberta, Canada. J. Glaciol. 42, 333–340. doi: 10.3189/S0022143000004184
Dong, Z., Li, Z., Wang, F., and Zhang, M. (2009). Characteristics of atmospheric dust deposition in snow on the glaciers of eastern Tian Shan, China. J. Glaciol. 55, 797–804. doi: 10.3189/002214309790152393
Dumont, M., Brun, E., Picard, G., Michou, M., Libois, Q., Petit, J.-R., et al. (2014). Contribution of light-absorbing impurities in snow to Greenland’s darkening since 2009. Nature Geosci. 7, 509–512. doi: 10.1038/NGEO2180
Farinotti, D., Longuevergne, L., Moholdt, G., Duethmann, D., Molg, T., Bolch, T., et al. (2015). Substantial glacier mass loss in the Tian Shan over the past 50 years. Nature Geosci. 8, 716–722. doi: 10.1038/NGEO2513
Fugazza, D., Senese, A., Azzoni, R. S., Maugeri, M., and Diolaiuti, G. A. (2016). Spatial distribution of surface albedo at the Forni Glacier (Stelvio National Park, Central Italian Alpa). Cold Reg. Sci. Technol. 125, 128–137. doi: 10.1016/j.coldregions.2016.02.006
Gabbi, J., Huss, M., Bauder, A., Gao, F., and Schwikowski, M. (2015). The impact of Saharan dust and black carbon on albedo and long-term mass balance of an Alpine glacier. Cryosphere 9, 1385–1400. doi: 10.5194/tc-9-1385-2015
Gardner, A. S., and Sharp, M. J. (2010). A review of snow and ice albedo and the development of a new physically based broadband albedo parameterization. J. Geophys. Res. 115, 137–147. doi: 10.1029/2009JF001444
Hock, R. (2005). Glacier melt: a review of processes and their modeling. Prog. Phys. Geogr. 29, 362–391. doi: 10.1191/0309133305pp453ra
Hock, R., and Holmgren, B. (2005). A distributed surface energy balance model for complex topography and its application to Storglaciaren, Sweden. J. Glaciol. 51, 25–36. doi: 10.3189/172756505781829566
Hu, Z., Kang, S., Yan, F., Zhang, Y., Li, Y., Chen, P., et al. (2018). Dissolved organic carbon fractionation accelerates glacier-melting: a case study in the northern Tibetan Plateau. Sci. Total Environ. 627, 579–585. doi: 10.1016/j.scitotenv.2018.01.265
Huintjes, E., Sauter, T., Schroter, B., Maussion, F., Yang, W., Kropacek, J., et al. (2015). Evaluation of a coupled snow and energy balance model for Zhadang glacier, Tibetan Plateau, using glaciological measurements and time-lapse photography. Arct. Antarct. Alp. Res. 47, 573–590. doi: 10.1657/AAAR0014-073
Jonsell, U., Hock, R., and Holmgren, B. (2003). Spatial and temporal variations in albedo on Storglaciaren, Sweden. J. Glaciol. 49, 59–68. doi: 10.3189/172756503781830980
Kang, E., and Atsumu, O. (1993). Study on energy-water-mass balance and the hydrological flow model in a glacierized catchment of Tianshan mountain. Chin. Sci. Bull. 38, 925–929.
Klok, E. J., Greull, W., and Oerlemans, J. (2003). Temporal and spatial variation of the surface albedo of morteratschgletscher, Switzerland, as derived from 12 landsat images. J. Glaciol. 49, 491–502. doi: 10.3189/172756503781830395
Klok, E. J., and Oerlemans, J. (2002). Model study of the spatial distribution of the energy and mass balance of Morteratschgletscher, Switzerland. J. Glaciol. 48, 505–518. doi: 10.3189/172756502781831133
Klok, E. J., and Oerlemans, J. (2004). Modelled climate sensitivity of the mass balance of Morteratschgletscher and its dependence on albedo parameterization. Int. J. Climatol. 24, 231–245. doi: 10.1002/joc.994
Knap, W. H., Brock, B. W., Oerlemans, J., and Willis, I. C. (1999). Comparison of landsat TM-derived and ground-based albedos of Haut Glacier d’Arolla, Switzerland. Int. J. Remote Sens. 20, 3293–3310. doi: 10.1080/014311699211345
Lafon, S., Sokolik, I. N., Rajot, J. L., Caquineau, S., and Gaudichet, A. (2006). Characterization of iron oxides in mineral dust aerosols: implications for light absorption. J. Eophys. Res. Atmos. 111:D21207. doi: 10.1029/2005JD007016
Li, X., Kang, S., He, X., Qu, B., Tripathee, L., Jing, Z., et al. (2017). Light-absorbing impurities accelerate glacier melt in the Central Tibetan Plateau. Sci. Total Environ. 58, 482–490. doi: 10.1016/j.scitotenv.2017.02.169
Li, X., Kang, S., Zhang, G., Qu, B., Tripathee, L., Paudyal, R., et al. (2018). Light-absorbing impurities in a southern Tibetan Plateau glacier: variations and potential impact on snow albedo and radiative forcing. Atmos. Res. 200, 77–87. doi: 10.1016/j.atmosres.2017.10.002
Li, Y., Kang, S., Yan, F., Chen, J., Wang, K., Paudyal, R., et al. (2019). Cryoconite on a glacier on the northeastern Tibetan plateau light absorbing impurities albedo and enhanced melting. J. Glaciol. 65, 633–644. doi: 10.1017/jog.2019.41
Li, Z., Li, H., and Chen, Y. (2011). Mechanisms and simulation of accelerated shrinkage of continental glaciers: a case study of Urumqi Glacier No. 1 in eastern Tianshan, Central Asia. J. Earth Sci. 22, 423–430. doi: 10.1007/s12583-011-0194-5
Ming, J., Xiao, C., Wang, F., Li, Z., and Li, Y. (2016). Grey tienshan urumqi glacier No.1 and light-absorbing impurities. Environ. Sci. Pollut. Res. 23, 9549–9558. doi: 10.1007/s11356-016-6182-7
Mortimer, C. A., and Sharp, M. (2018). Spatiotemporal variability of Canadian high arctic glacier surface albedo from MODIS data, 2001–2016. Cryosphere 12, 701–720. doi: 10.5194/tc-12-701-2018
Moustafa, S. E., Rennermalm, K. A., Smith, L. C., Miller, M. A., Mioduszewski, J. R., Koenig, L. S., et al. (2015). Multi-modal albedo distributions in the ablation area of the southwestern Greenland Ice Sheet. Cryosphere 9, 905–923. doi: 10.5194/tc-9-905-2015
Munro, D. S. (1991). A surface energy exchange model of glacier melts and net mass balance. Int. J. Climatol. 11, 689–700. doi: 10.1002/joc.3370110610
Naegeli, K., Huss, M., and Hoelzle, M. (2019). Change detection of bare-ice albedo in the Swiss Alps. Cryosphere 13, 397–412. doi: 10.5194/tc-13-397-2019
Niu, H., Kang, S., Shi, X., Paudyai, R., He, Y., Li, G., et al. (2017). In-situ measurements of light-absorbing impurities in snow of glacier on Mt. Yulong and implications for radiative forcing estimates. Sci. Total Environ. 581–582, 848–856. doi: 10.1016/j.scitotenv.2017.01.032
Oerlemans, J., Giesen, R. H., and Van Den Broeke, M. R. (2009). Retreating alpine glaciers increased melt rates due to accumulation of dust (Vadret da Morteratsch, Switzerland). J. Glaciol. 55, 729–736. doi: 10.3189/002214309789470969
Oerlemans, J., and Knap, W. H. (1998). A 1 year record of global radiation and albedo in the ablation zone of Morteratscher, Switzerland. J. Glaciol. 44, 231–238. doi: 10.3189/s0022143000002574
Pellicciotti, F., Brock, B., Strasser, U., Burlando, P., Funk, M., and Corripoi, J. (2005). An enhanced temperature index glacier melt model including the shortwave radiation balance development and testing for Haut Glacier d’Arolla, Switzerland. J. Glaciol. 51, 573–587. doi: 10.3189/172756505781829124
Sirguey, P., Still, H., Cullen, N. J., Dumont, M., Arnaud, Y., and Conway, J. P. (2016). Reconstructing the mass balance of Brewster Glacier, New Zealand, using MODIS-derived glacier-wide albedo. Cryosphere 10, 2465–2484. doi: 10.5194/tc-10-2465-2016
Skiles, S. M., and Painter, T. (2016). Daily evolution in dust and black carbon content, snow grain size, and snow albedo during snowmelt, Rocky Mountains, Colorado. J. Glaciol. 63, 118–132. doi: 10.1017/jog.2016.125
Stroeve, J., Nolin, A., and Steffen, K. (1997). Comparison of AVHRR derived and in situ surface albedo over the Greenland ice sheet. Remote Sens. Environ. 62, 262–276. doi: 10.1016/s0034-4257(97)00107-7
Sun, W., Qin, X., Du, W., Liu, W., Liu, Y., Zhang, T., et al. (2014). Ablation modeling and surface energy budget in the ablation zone of Laohugou glacier No. 12, western Qilian Mountains, China. Ann. Glaciol. 55, 111–120. doi: 10.3189/2014aog66a902
Sun, W., Qin, X., Wang, Y., Chen, J., Du, W., Zhang, T., et al. (2017). The response of surface mass and energy balance of a continental glacier to climate variability, western Qilian Mountains, China. Clim. Dyn. 50, 3557–3570. doi: 10.1007/s00382-017-3823-6
Takeuchi, N. (2002). Optical characteristics of cryoconite (surface dust) on glacier the relationship between light absorbency and the property of organic matter contained in the cryoconite. Ann. Glaciol. 34, 409–414. doi: 10.3189/172756402781817743
Takeuchi, N. (2009). Temporal and spatial variations in spectral reflectance and characteristics of surface dust on Gulkana Glacier, Alaska range. J. Glaciol. 55, 701–709. doi: 10.3189/002214309789470914
Takeuchi, N., Fujisawa, Y., Kadota, T., Tanaka, S., Miyairi, M., Shirakawa, T., et al. (2015). The effect of impurities on the surface melt of a glacier in the suntar-khayata mountain range, Russian Siberia. Front. Earth Sci. 3:82.
Takeuchi, N., Kohshima, S., Yoshimura, Y., Seko, K., and Fujita, K. (2000). Characteristics of cryoconite holes on a Himalayan glacier, Yala Glacier central Nepal. Bull. Glaciol. Res. 17, 51–59.
Takeuchi, N., and Li, Z. (2008). Characteristics of surface dust on Ürümqi Glacier No. 1 in the Tien Shan Mountains, China. Arct. Antarct. Alp. Res. 40, 744–750. doi: 10.1657/1523-0430(07-094)[takeuchi]2.0.co;2
Takeuchi, N., Matsuda, Y., Sakai, A., and Fujita, K. (2005). A large amount of biogenic surface dust (cryoconite) on a glacier in the Qilian Mountains, China. Bull. Glaciol. Res. 22, 1–8.
Takeuchi, N., Nagatsuka, N., Uetake, J., and Shimada, R. (2014). Spatial variations in impurities (cryoconite) on glaciers in northwest Greenland. Bull. Glaciol. Res. 32, 85–94.
Takeuchi, N., Nishiyama, H., and Li, Z. (2010). Structure and formation process of cryoconite granules on Urumqi glacier No. 1, Tien Shan, China. Ann. Glaciol. 51, 9–14. doi: 10.3189/172756411795932010
Takeuchi, N., Uetake, J., Fujita, K., Aizen, V., and Nikitin, S. (2006). A snow algal community on Akkem Glacier in the Russian Altai Mountains. Ann. Glaciol. 43, 378–384. doi: 10.3189/172756406781812113
Wang, J., Ye, B., Cui, Y., He, X., and Yang, G. (2014). Spatial and temporal variations of albedo on nine glaciers in western China from 2000 to 2011. Hydrol. Process. 28, 3454–3465. doi: 10.1002/hyp.9883
WGMS (2017). Global Glacier Change Bulletin No. 2 (2014–2015). CSU(WDS)/IUGG (IACS)/UNEP/UNESCO/WMO. Zurich: World Glacier Monitoring Service.
Wiscombe, W. J., and Warren, S. G. (1980). A model for the spectral albedo of snow. I: pure snow. J. Atmos. Sci. 37, 2712–2733.
Wittmann, M., Zwaaftink, C. D. G., Schmidt, L. S., Guðmundsson, S., Pálsson, F., Arnalds, O., et al. (2017). Impact of dust deposition on the albedo of Vatnajökull ice cap, Iceland. Cryosphere 11, 741–754. doi: 10.5194/tc-11-741-2017
Wright, P., Bergin, M., Dibb, J., Lefer, B., Domine, F., Carman, T., et al. (2014). Comparing MODIS daily snow albedo to spectral albedo field measurements in Central Greenland. Remote Sens. Environ. 140, 118–129. doi: 10.1016/j.rse.2013.08.044
Yallop, M. L., Alexandre, A. M., Perkins, R. G., Cook, J., Telling, J., Fagan, D., et al. (2012). Photophysiology and albedo-changing potential of the ice algal community on the surface of the Greenland ice sheet. ISME J. 6, 2302–2313.
Yang, D., Kang, E., and Felix, B. (1992). Characteristics of precipitation in the source area of the Urumqi river basin. J. Glaciol. Geocryol. 14, 258–266.
Yue, X., Zhao, J., Li, Z., Zhang, M., Fan, J., Wang, L., et al. (2017). Spatial and temporal variations of the surface albedo and other factors influencing Urumqi Glacier No. 1 in Tien Shan, China. J. Glaciol. 63, 899–911. doi: 10.1017/jog.2017.57
Zemp, M., Huss, M., Thibert, E., McNabb, R., Huber, J., Barandun, M., et al. (2019). Global glacier mass changes and their contributions to sea-level rise from 1961 to 2016. Nature 568, 382–386. doi: 10.1038/s41586-019-1071-0
Zhang, X., Wu, G., Zhang, C., Xu, T., and Zhou, Q. (2015). What is the real role of iron oxides in the optical properties of dust aerosols? Atmos. Chem. Phys. 15, 12159–12177.
Keywords: albedo, temporal and spatial variations, surface dust, cloud, mountain glacier
Citation: Yue X, Li Z, Zhao J, Fan J, Takeuchi N and Wang L (2020) Variation in Albedo and Its Relationship With Surface Dust at Urumqi Glacier No. 1 in Tien Shan, China. Front. Earth Sci. 8:110. doi: 10.3389/feart.2020.00110
Received: 28 November 2019; Accepted: 25 March 2020;
Published: 19 May 2020.
Edited by:
Tong Zhang, Los Alamos National Laboratory (DOE), United StatesReviewed by:
Yukihiko Onuma, The University of Tokyo, JapanCopyright © 2020 Yue, Li, Zhao, Fan, Takeuchi and Wang. This is an open-access article distributed under the terms of the Creative Commons Attribution License (CC BY). The use, distribution or reproduction in other forums is permitted, provided the original author(s) and the copyright owner(s) are credited and that the original publication in this journal is cited, in accordance with accepted academic practice. No use, distribution or reproduction is permitted which does not comply with these terms.
*Correspondence: Nozomu Takeuchi, bnRha2V1Y2hAZmFjdWx0eS5jaGliYS11Lmpw
Disclaimer: All claims expressed in this article are solely those of the authors and do not necessarily represent those of their affiliated organizations, or those of the publisher, the editors and the reviewers. Any product that may be evaluated in this article or claim that may be made by its manufacturer is not guaranteed or endorsed by the publisher.
Research integrity at Frontiers
Learn more about the work of our research integrity team to safeguard the quality of each article we publish.