 Robert S. Eckard1*
 Brian A. Bergamaschi2Brian Pellerin2Robert G. Spencer3Rachel Dyda1
 Peter J. Hernes1
- 1Department of Land, Air, and Water Resources, University of California, Davis, Davis, CA, United States
- 2U.S. Geological Survey, California Water Science Center, Sacramento, CA, United States
- 3Department of Earth, Ocean, and Atmospheric Science, Florida State University, Tallahassee, FL, United States
Rivers continually integrate terrestrial organic matter (OM) into their waters, in a process that transfers 1.9 Pg C yr–1 as the primary linkage between oceanic and terrestrial carbon cycles. Yet rivers are not simple, conservative OM integrators. Patchy local land uses (wetlands, bogs, agriculture) release OM that can disproportionately alter river biogeochemistry and overprint upstream carbon. These releases are quantifiable at the plot scale but remain unpredictable across river reaches and watersheds, critically inhibiting our ability to scale up terrestrial-aquatic linkages to regional/global carbon cycling models. We evaluated OM overprinting distance along a human-influenced watershed to quantify river integration of terrestrial OM and to bridge the quantification gap between habitats and waterway biogeochemistry. We investigated changes in dissolved organic carbon (DOC) concentration and dissolved organic matter (DOM) composition (lignin phenols, fluorescence excitation-emission spectra using parallel factor analysis [PARAFAC], and the relative fraction of optically active DOM [EEMDOC]). DOC concentrations increased continually (p < 0.001) downstream, from median 1.0 mg L–1 at 30 km (headwaters) to 3.3 mg L–1 at the river mouth. This rate of increase corresponded to a DOC overprinting distance—the longitudinal distance over which DOC concentrations double—of 13 km. Mainstem DOC overprinting distance ranged from 8 km (winter, rainy season) to 21 km (summer, dry season with irrigation), highlighting stronger overprinting during increased hydraulic connectivity. Stronger overprinting also correlated to higher EEMDOC (p < 0.001). Overprinting distance effectively quantifies river integration of DOM along the terrestrial-aquatic interface, helping to refine bottom-up carbon cycle estimates, inform upscaling of site-specific fluxes, and to track land use and climate influence on river biogeochemistry.
Introduction
Rivers act as biogeochemical integrators across their entire drainage basin (Hedges, 1981; Ertel et al., 1986), embodying—at the chemical level—the foundational concept from stream ecology in which the terrestrial environment determines river characteristics (“In every aspect, the valley rules the stream”) (Hynes, 1975). This integration process is globally responsible for the capture of about 1.9 Pg yr–1 of carbon from the terrestrial environment (Cole et al., 2007), rendering rivers as the primary linkage between oceanic and terrestrial carbon cycles. Yet valleys do not rule equally, and rivers do not act as simple, conservative integrators. To the contrary, certain habitats or land uses exert a disproportionate influence on organic matter concentration and composition, rapidly altering DOM characteristics even along large rivers. For example, organic carbon from lowland floodplains replaced forest-derived organic carbon in the lower reaches of the Amazon (Ward et al., 2015), while organic carbon from wetlands and agricultural areas in a 2,980 km2 delta in the western United States was sufficient to overwhelm organic carbon signatures from the 76,600 km2 watershed upstream (Eckard et al., 2007). Similarly, localized land cover in tropical African rivers was a primary control on organic matter quantity and quality (Lambert et al., 2015). Yet directly quantifying the control that local sources exact over river DOM composition remains elusive, highlighting critical uncertainties surrounding the terrestrial-aquatic interface and its influence on carbon cycling at local to global scales.
To date, conceptual models such as the river continuum concept and various others have categorized and analyzed terrestrial influences on rivers qualitatively (Vannote et al., 1980; Junk et al., 1989; Thorp et al., 2006). In lieu of further conceptualization, we propose that refocusing on biogeochemical transitions within a body of water—as the water flows downstream and is influenced by the terrestrial environment—permits direct quantification of biogeochemical change. Such an approach could potentially, for example, highlight how local factors like hot spots and hot moments (i.e., locations or periods with an especially strong signature) (McClain et al., 2003), diffuse sources (Ertel et al., 1986; Hedges et al., 2000; Gladyshev et al., 2015), and larger-scale (i.e., subwatershed or landscape scale) organic matter sources including those referenced above (Eckard et al., 2007; Lambert et al., 2015; Ward et al., 2015), collectively change river biogeochemistry. Organic matter overprinting, which quantifies change in organic matter concentration or composition as a function of distance traveled downstream, is an amenable metric to identify and quantify these transitions. DOM overprinting has been observed at a wide range of spatial scales encompassing moderate-sized rivers (Hernes et al., 2017) up to the large waterways noted previously. Improved understanding of DOM integration could, in turn, more precisely answer questions of how land use, land use change, or climate change will affect aquatic ecosystems, carbon cycling, and carbon export to the oceans. Thus, DOM overprinting shows promise for quantifying several of the uncertainties surrounding the influence of the terrestrial-aquatic interface on local, regional, and global carbon cycling.
Spectral absorbance and fluorescence measurements provide information on DOM characteristics such as molecular weight (spectral slope), aromaticity (standard ultraviolet absorbance at 254 nm, or SUVA254), and DOC concentration (absorbance at 350 nm, or α350) (Blough and Del Vecchio, 2002; Boss and Zaneveld, 2003; Weishaar et al., 2003). Spectral data analyzed by Parallel Factor Analysis (PARAFAC) can be used to assess the relative humic-like and protein-like (or phenylpropyl) content of DOM, generating additional insight into DOM composition (Ohno and Bro, 2006; Stedmon et al., 2007; Walker et al., 2009). In contrast, lignin phenols derived from vascular plants are chemical biomarkers that can be used to estimate vascular plant source and degradation state (Hedges and Mann, 1979; Hedges et al., 1988). Combining spectral data with chemical biomarkers can help to overcome limitations of both spectral data (limited ability to estimate chemical concentration of DOM constituents) and biomarkers (limited samples due to cost and workup time) (Hernes et al., 2009; Spencer et al., 2009; Mann et al., 2016), including when deciphering terrestrial-aquatic linkages. Nonetheless, current spectral data analysis is limited in its ability to quantify relationships between photoactive and photo-inactive DOM fractions. Specifically, much of DOM is not optically active, and is therefore impossible to directly characterize using optical measurements. As a result, the degree to which spectral data reflect or represent bulk DOM composition is rarely discussed or considered.
Most watersheds are highly patchy and spatially diverse, encompassing myriad habitats and/or land uses. The various habitats generate different organic carbon source signatures, which are difficult to tease apart, contributing to the statistical noise common in the analysis of many environmental sample sets. Willow Slough, a predominantly agricultural watershed in Northern California with minimal wetland or riparian area, provides a convenient system for evaluating how one dominant land use category—agriculture—influences organic carbon concentration and composition of the adjacent waterway.
We hypothesize that organic matter from local, terrestrial inputs will integrate into and overprint in-stream organic matter in proportion to contact distance between a given land use and the stream that drains it. To that end, the objectives of this study are to (1) quantify changes in organic matter along the Willow Slough watershed using DOC concentration, lignin phenols, UV-visible, and optical EEMs with a PARAFAC decomposition; (2) quantify the distance over which organic matter from adjacent land use meaningfully alters organic matter concentration and composition (i.e., overprinting distance) along the waterway; and (3) provide a foundation for future efforts to scale-up terrestrial-aquatic interactions to watershed, river, and larger scales. Ultimately, such progress could allow researchers to quantify how land use, land use change, global climate change, or other local and regional factors inform river integration of organic matter, carbon dynamics of waterways, and local, regional, and global carbon cycling.
Materials and Methods
Site Description and Sampling
We conducted water sampling across the 425 km2 Willow Slough watershed in the Sacramento Valley, CA, United States. The watershed encompasses hilly topography (mean slope of 25 percent) along the eastern flank of California’s Coast Range before flattening onto an expansive, low-lying alluvial plain (mean slope of 1 percent) between the Coast Range and the Sacramento River. The watershed has an average annual precipitation of 552 mm and a Mediterranean climate, where 95 percent of annual rainfall occurs between April and October (Oh et al., 2013). Summers are dry and hot (mean 22.8°C). Winters are wet and cool (mean 8.2°C). Natural grassland/shrubland characterizes the upper (western) third of the watershed, while the lower two-thirds of the watershed is agricultural, supporting alfalfa (Medicago sativa; 28% of agricultural area), tomato (Lycopersicon esculentum; 14%), forage grasses (13%), orchards (10%), and rice (Oryza sativa; 7%) among others (Oh et al., 2013; Figure 1).
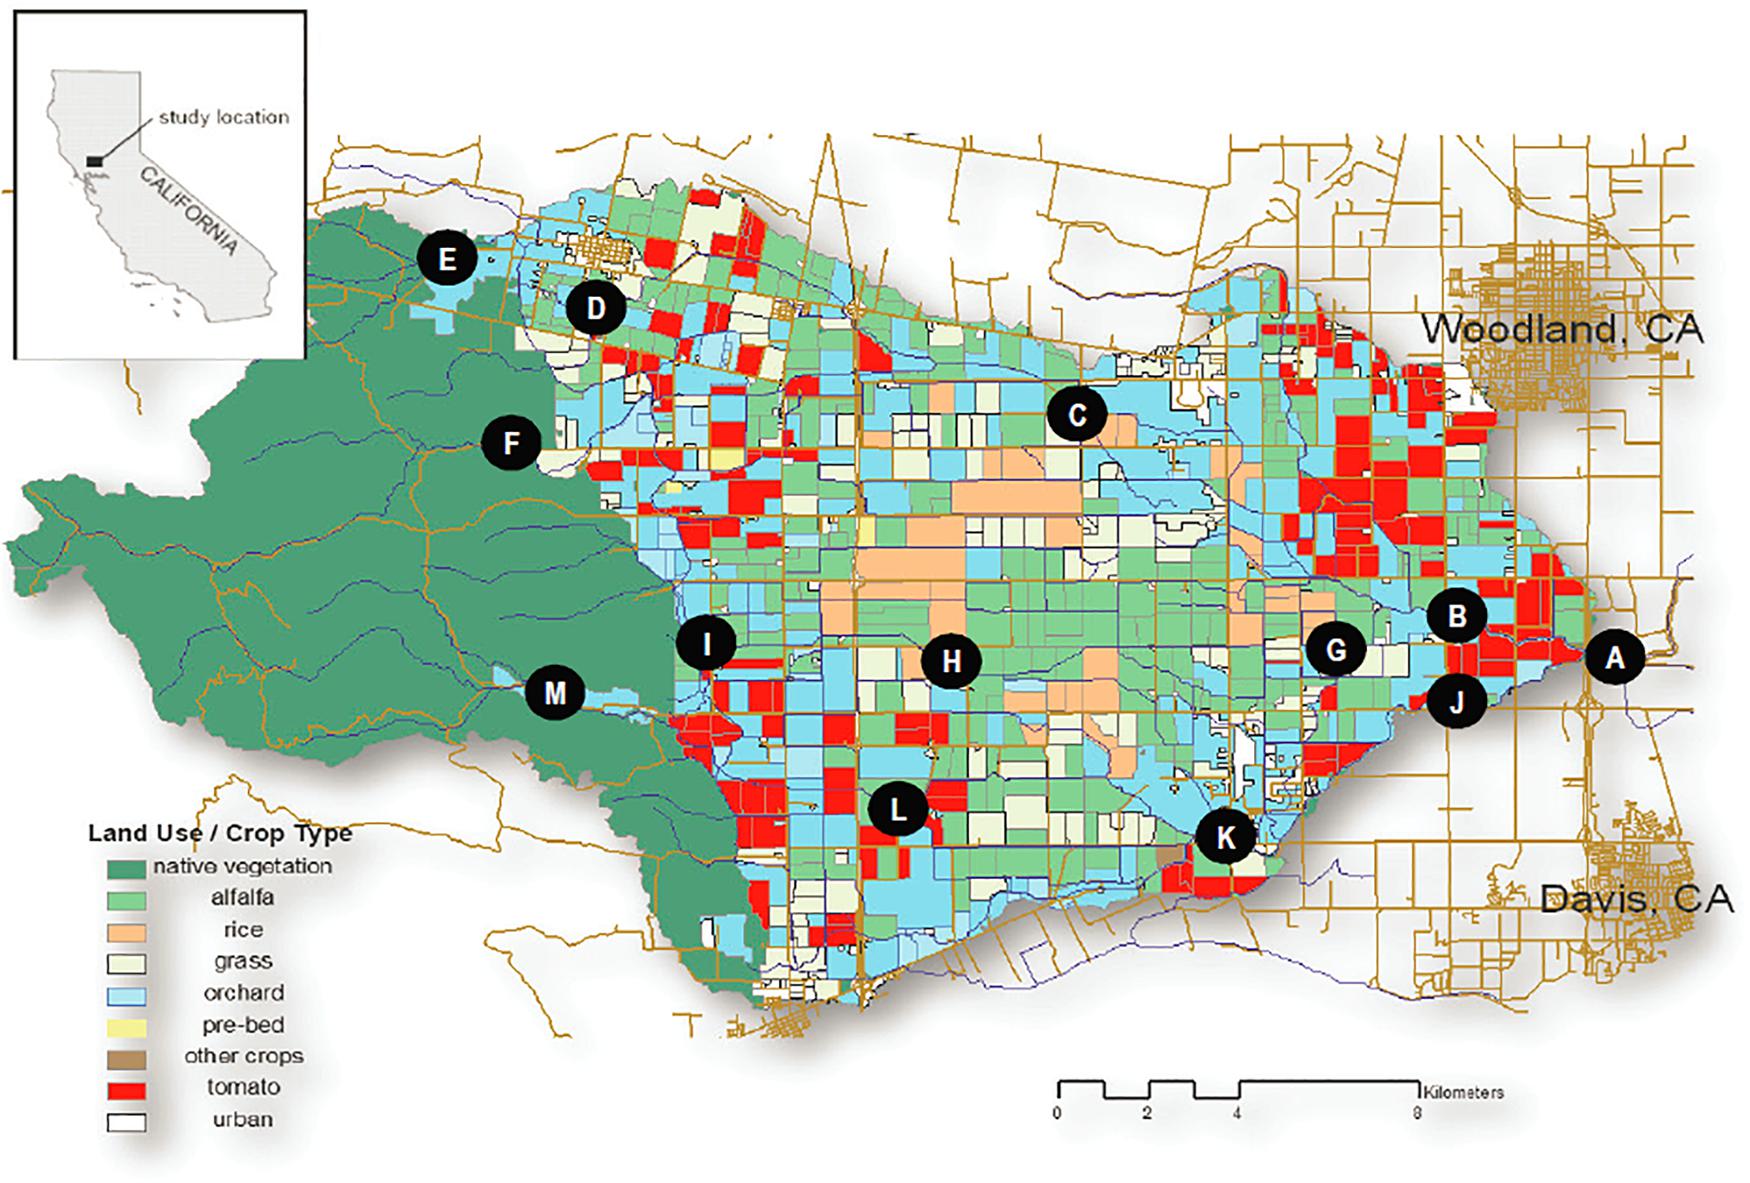
Figure 1. Willow Slough Watershed and Sampling Sites by Subwatershed. Willow Slough Mainstem: (A) WS6 (Willow Slough mouth), (B) WS5, (C) WS3, (D) WS1, (E) PA0, (F) CO0. Union School Slough Subwatershed: (G) USS4, (H) USS2, (I) USS1. Chickahominy/Dry Slough Subwatershed: (J) CH4, (K) CH2, (L) CH1, (M) CH0. Note that sampling sites shown on the figure are referenced throughout the text in brackets, i.e., [C].
Samples were collected in March, May, July, and November of 2006 at up to 13 sampling sites (Figure 1). Sampling sites were arranged along three subwatersheds, including the Willow Slough mainstem subwatershed (CO0 [F], PA0 [E], WS1 [D], WS3 [C], WS5 [B], and WS6 [A]), the Union School Slough subwatershed (USS1 [I], USS2 [H], USS4 [G]) which flows into the Willow Slough mainstem 1.5 km upstream of WS5 [B], and the Chickahominy/Dry Slough subwatershed (CH0 [M], CH1 [L], CH2 [K], CH4 [J]) which flows into the Willow Slough mainstem 1.1 km upstream of WS6 [A]. Samples were collected manually from the stream thalweg using pre-combusted (450°C > 4h) amber glass bottles during a single day for each sampling event. Collected samples were transported to the laboratory on ice, immediately filtered through pre-combusted (450°C > 4h) 0.3 μm glass fiber filters (Advantec MFS, Dublin, CA, United States), and refrigerated at 4°C in the dark until analysis. DOC samples were acidified prior to refrigeration. Lignin samples were frozen until analysis. Hydrologic stage data were collected throughout the study using pressure transducers (at WS3 [C], WS5 [B], WS6 [A], CH0 [M], CH4 [J], and USS4 [G]); data were converted to flow using stage-discharge relationships developed with standard USGS methods (Turnipseed and Sauer, 2010), for each sampling point. Longitudinal distances along the waterway from the Willow Slough mouth to each sampling point were measured, in km, using map-based GIS. Contact distances between the waterway and a given reach or land use were calculated in the same way.
Analytical Methods
Dissolved organic carbon concentrations were measured on acidified samples (pH ∼ 2, HCl) with a Shimadzu TOC-V CHS analyzer with TNM-1 for total nitrogen analysis (Shimadzu Scientific Instruments, MD, United States) using the mean value over 3 to 5 injections of 100 μL each. Precision was equivalent to 0.1 mg L–1 for replicate injections; accuracy was quantified using reference standard caffeine within 20% concentration of sample DOC in every sample run. Lignin phenols, which provide information on vascular plant derived carbon, were analyzed by alkaline CuO oxidation as described by Hernes et al. (2013). Optical absorbance and fluorescence, as well as excitation-emission spectra were measured as follows. Briefly, optical absorbance between 200 and 750 nm was measured using filtered samples in a 1 cm quartz cuvette. Within 48h of collection, all samples were measured at room temperature (25°C) using a Cary-300 spectrophotometer. Spectra for all samples were referenced to a blank spectrum of 18 μΩ water that had been deionized and UV oxidized, corrected by subtracting the average absorbance between 700 and 750 nm, then expressed as the absorption coefficients in units of m–1. Fluorescence excitation-emission spectra were also measured on room temperature (25°C), filtered samples, but using a Fluoromax-4 spectrophotometer (Horiba Jobin Yvon, France) using a 150 W Xenon lamp. Fluorescence intensity was measured for wavelengths ranging from 250 to 440 (5 cm band pass) while emission wavelengths were measured from 300 to 600 (10 cm band pass). All samples were measured in a 1 cm quartz cell. All fluorescence intensity data are reported as normalized to the water Raman area in relative units. Additional detail regarding measurement of absorbance and fluorescence, and excitation emission spectra, is available in Eckard et al. (2017).
EEMDOC and the Relative Proportion of Optically Active Organic Matter
To quantify the relative proportion of optically active organic matter present in a sample (see Discussion section “Optical Parameters and Seasonal Change in Optically Active Carbon Using EEMDOC” for justification), we define the following parameter, which normalizes total EEM response to DOC concentration for individual samples:
as a yield proxy for the relative fraction of DOC that is optically active.
The EEMDOC parameter most comprehensively represents the relative yield of optically active DOM when samples are related or otherwise contain similar fluorophores. Wide variability in the optically active molecules present in a sample could reduce EEMDOC’s accuracy as a yield proxy, because, for example, certain disruptive fluorophores might respond more intensely than others. Therefore, we recommend constraining use of the EEMDOC parameter to sample sets collected within a given geographic area, from related biomes, or to sample sets that otherwise carry similar organic matter composition. We suggest quantifying EEM variability in a sample set to help understand whether highly variable fluorophores could skew EEMDOC results. PARAFAC components provide a convenient basis for measuring variability: PARAFAC modeling identifies components that characterize portions of EEMs that contain the greatest fluorophore response. Comparing samples, if the individual PARAFAC peaks each represent a similar proportion of total PARAFAC response for each sample, then it is unlikely that disruptive fluorophores (those that carry an especially high response intensity) are present, where such fluorophores could disproportionately affect total EEMs response and therefore skew EEMDOC.
Calculating the coefficient of variation of the percentage of total response from each PARAFAC component (Figure 2) yields coefficients of variation that are reasonably low for C1 through C4 (Table 1). For these four PARAFAC components, one standard deviation is equivalent to < 30 percent of the mean for each (i.e., the coefficient of variation is less than 0.3), rendering presence of disruptive fluorophores unlikely. The coefficient of variation for C5 was more variable, at 1.45, suggesting that disruptive fluorophores may affect component C5. However, C5 represents only a very small fraction of total response – less than 1 percent on average, and no more than 4.8 percent of total response in any one sample across the entire sample set. Therefore, even if disruptive fluorophores are present in C5, they are unlikely to meaningfully affect the EEMDOC parameter due to their limited response overall.
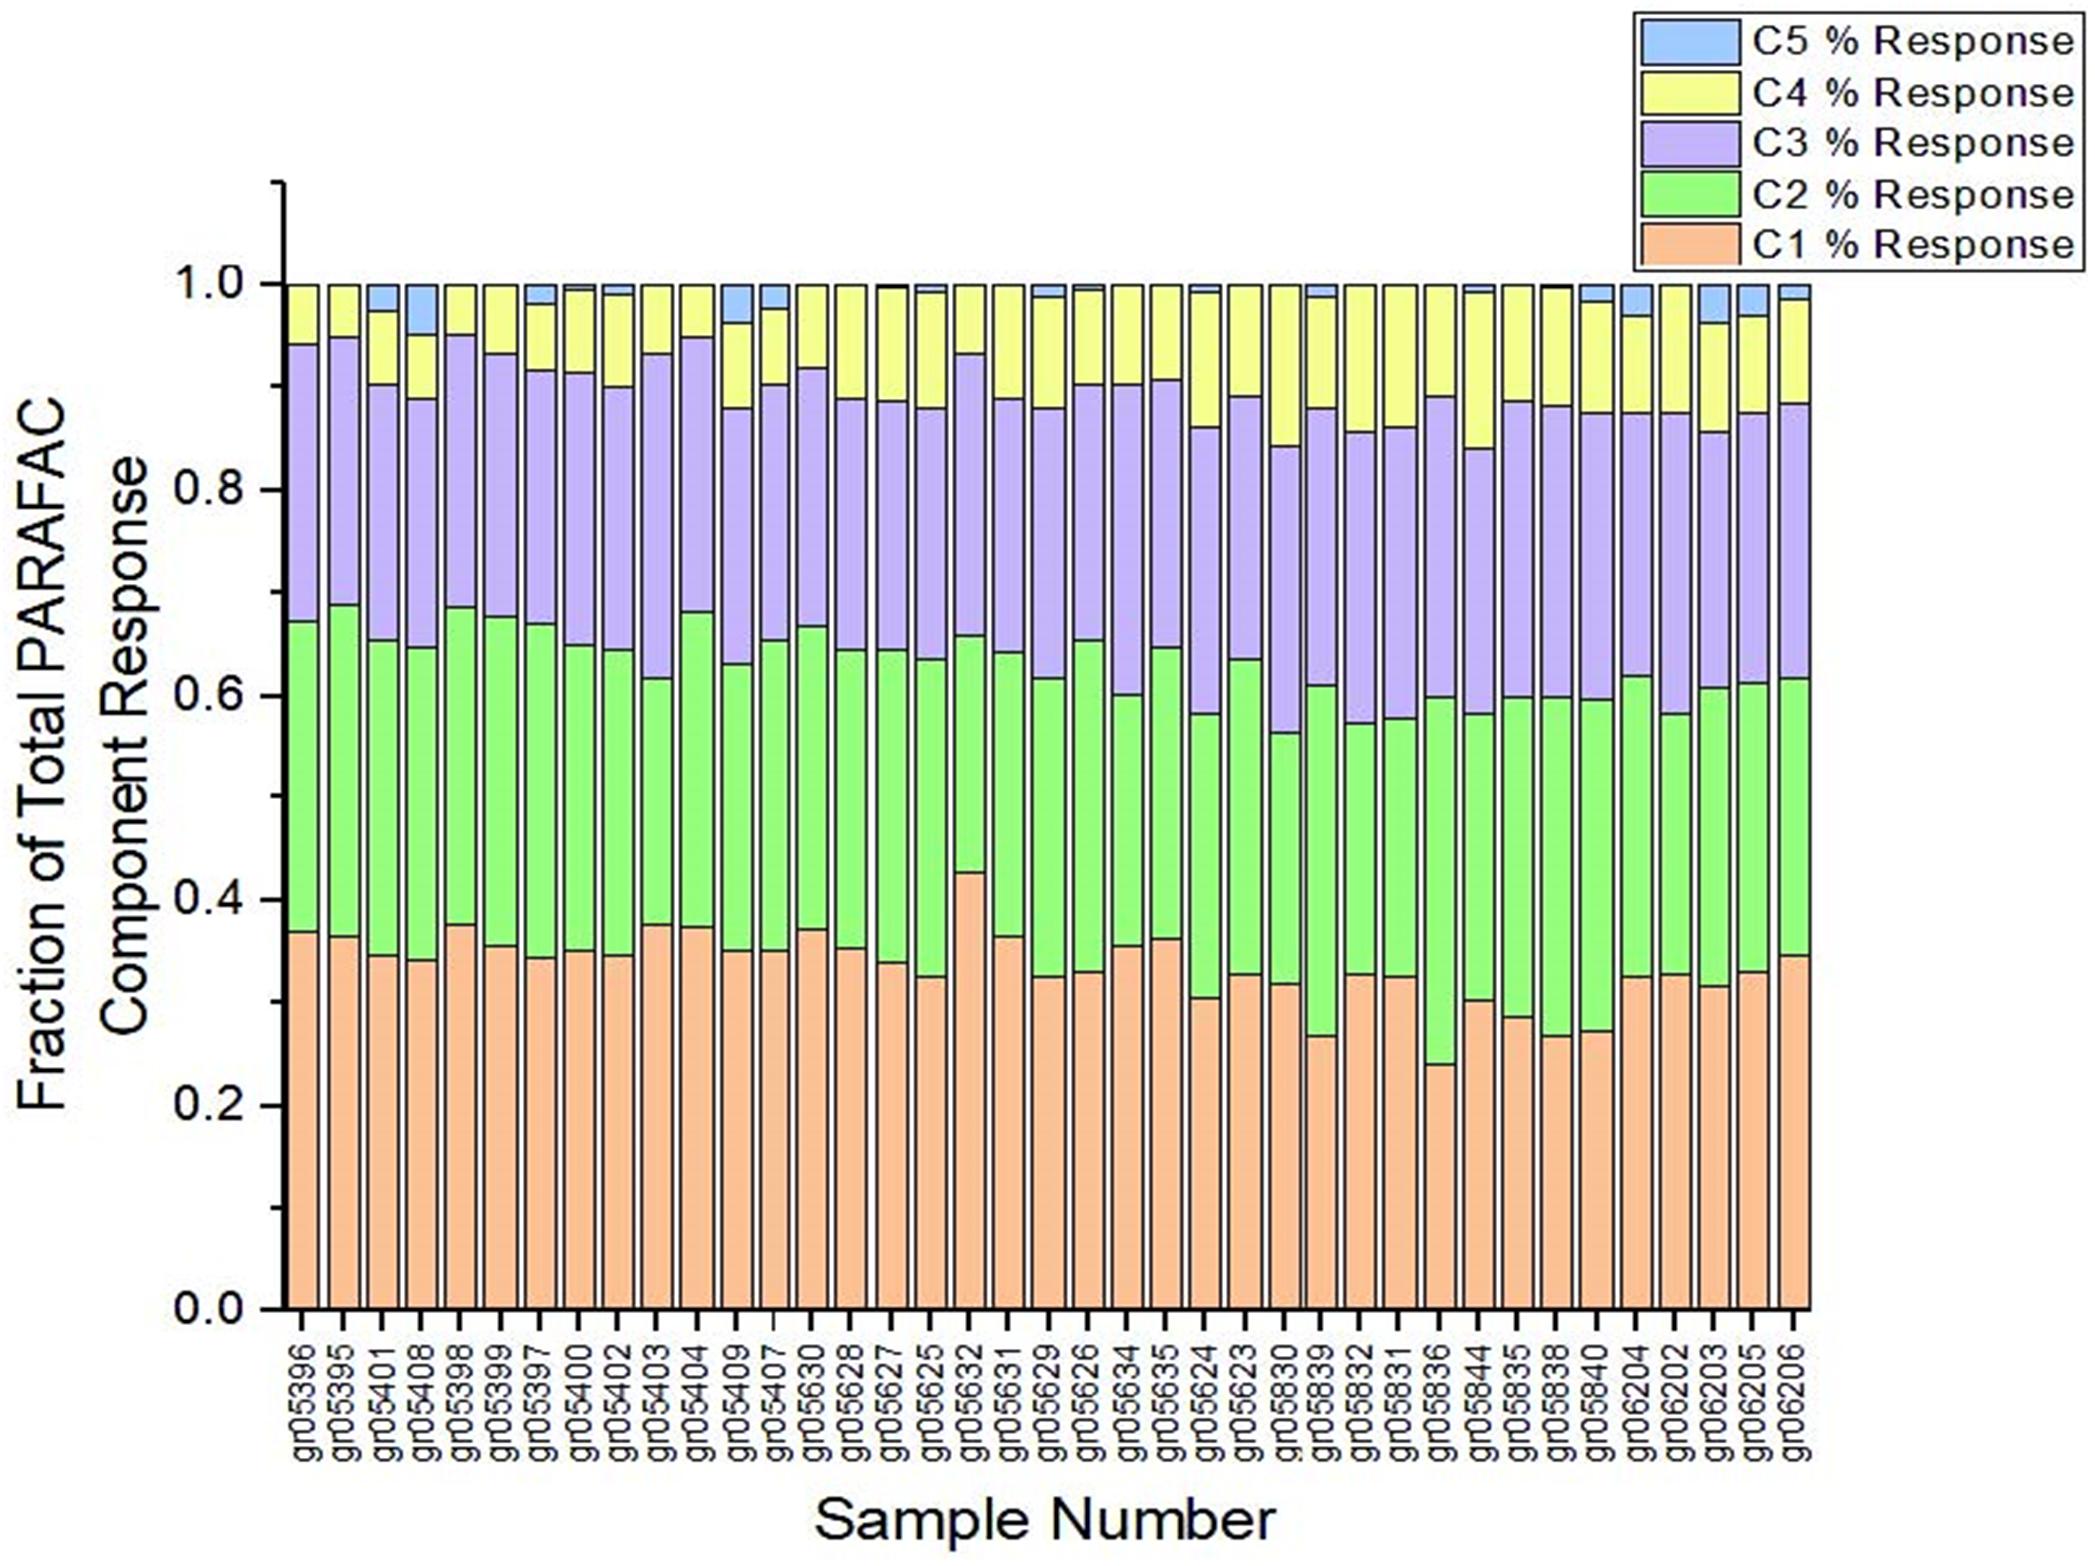
Figure 2. Percent of total response by PARAFAC component. As shown, samples maintained a similar proportion of each of the five PARAFAC components, suggesting that presence of disruptive fluorophores—that is, fluorophores that could disproportionately affect total EEMs response—is unlikely.
Table 1. Variability in the percentage of total PARAFAC component response.
Data Analysis
Statistical tests were completed using R software, version 3.2.2. Non-parametric tests were used to compare data with non-normal distributions: Spearman Rank test for rank-order correlation between two variables, the Kruskal-Wallis test for differences in value between multiple groups, and the Man-Whitney U test for differences between two groups. Pearson Product Moment correlations were used where observed distributions met required base statistical assumptions for parametric statistics. Note that Spearman Rank correlation coefficients are reported as ρ and Pearson correlation coefficients as r2. Principal component analysis and principal component regression were used as initial/exploratory data analysis to identify trends and relationships within the overall data structure, and to identify outliers, using The Unscrambler software (version 10.3). PARAFAC was completed as described in Eckard et al. (2017). All data used and displayed in this article can be found in the Supplementary Material.
Results
We tested for incremental, directional change in organic matter concentration and composition across the Willow Slough system using multiple parameters. Most parameters were measured for the full sample set (n = 39). However, due to sample matrix interference (rotary evaporation of samples caused elevated mineral concentrations during analysis, causing interference) in July and November, lignin analysis is reported on a subset of 23 samples, during March and May only.
Organic Carbon Concentration
Synoptic DOC concentrations allow estimation of addition, loss, or mixing of organic carbon along subwatersheds in the study area. Reviewing DOC concentrations and how they change along the watershed helps to better identify the magnitude of potential transformation of organic matter as it passes through the watershed. The lower Willow Slough watershed was a net source of DOC, with concentrations ranging from 0.78 to 12.80 mg L–1 (median 2.93 mg L–1) overall, but increasing from a median of 1.99 mg L–1 at least 30 km upstream of the mouth, to higher concentrations (p < 0.05) at the watershed mouth (median 3.33 mg L–1) (Figure 3A and Supplementary Table S1). DOC concentrations were in line with other studies in the Willow Slough watershed (Hernes et al., 2008; Saraceno et al., 2009; Oh et al., 2013). From headwaters to the mouth, as water flowed along the watershed, DOC concentrations increased continuously (p < 0.001), rather than as a simple function of converging tributaries. DOC concentrations also differed among sampling events (p < 0.05), with median values highest in July during peak irrigation (median 6.05 mg L–1) and lowest in May near the start of the irrigation season (median 2.01 mg L–1).
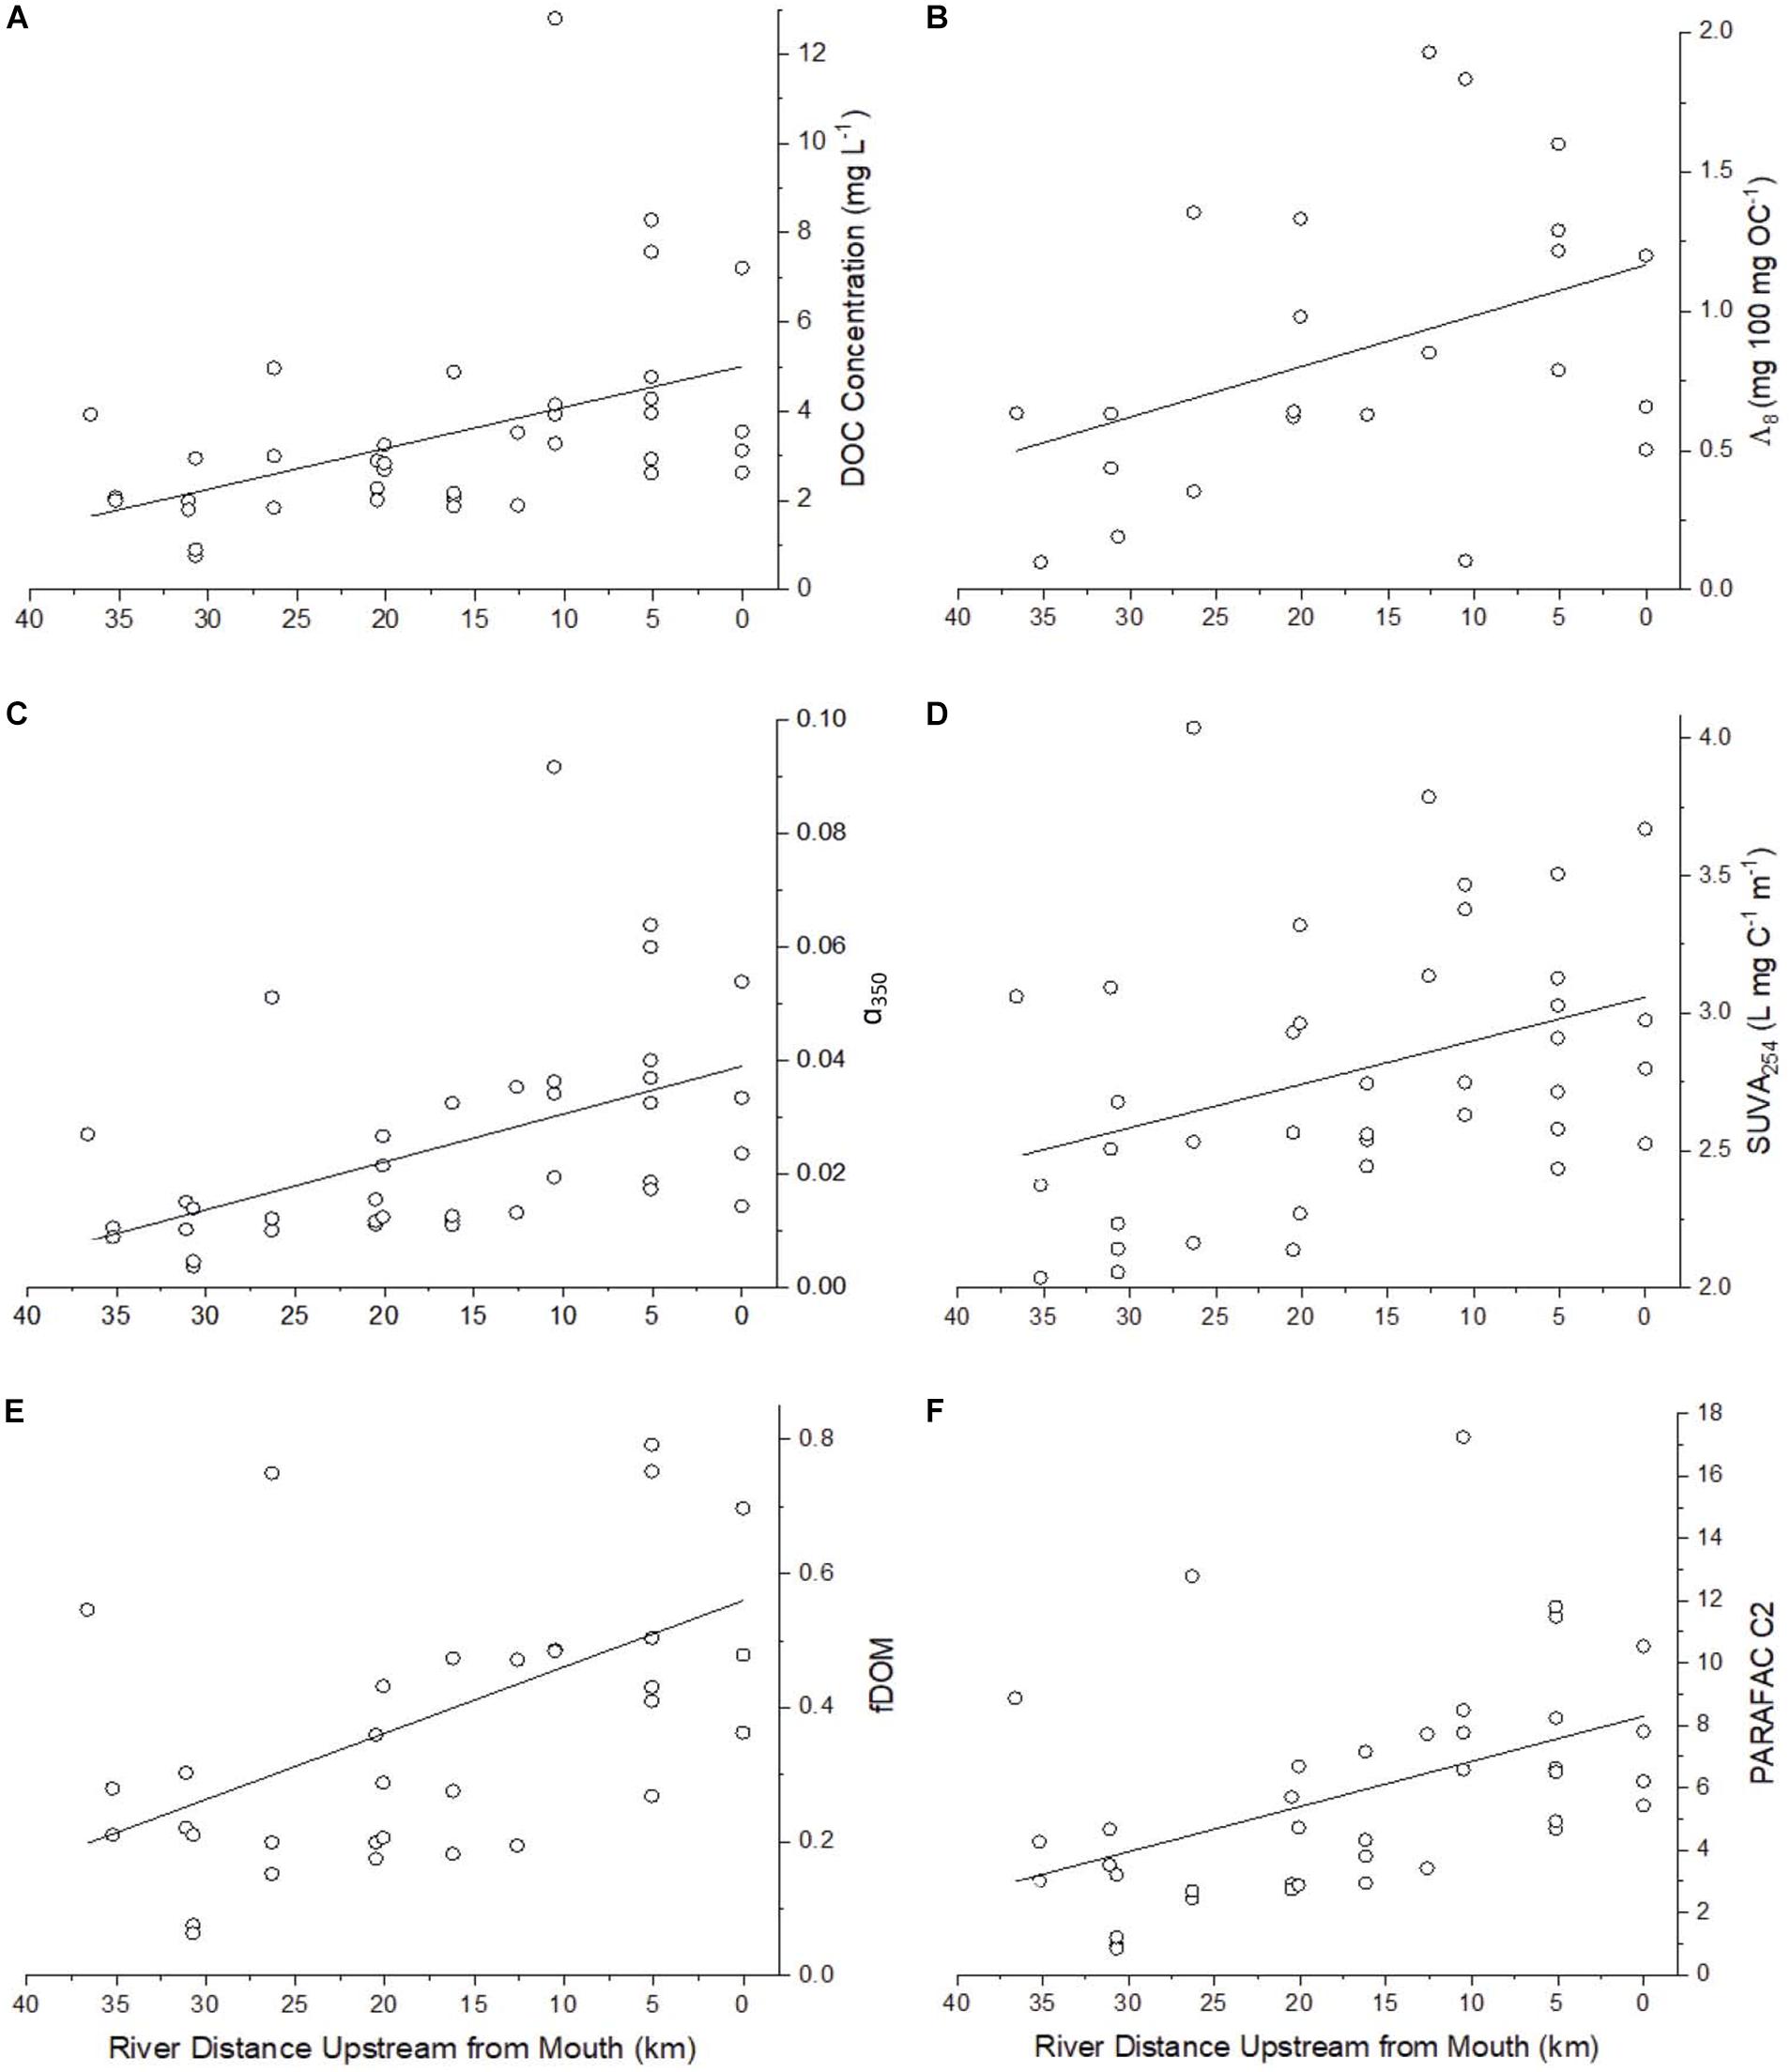
Figure 3. Select parameters showing incremental increases and decreases longitudinally along the Willow Slough Watershed including (A) DOC (n = 39, ρ = −0.56, p < 0.001), (B) Lignin Λ8 (n = 23, ρ = −0.42, p < 0.05) (C) α350 (n = 39, ρ = −0.64, p < 0.001) which correlates strongly with lignin Σ8 (Figure 3B), (D) SUVA254 (n = 39, ρ = −0.41, p < 0.05), (E) fDOM (n = 34, ρ = −0.50, p < 0.05), and (F) PARAFAC C2 (n = 39, ρ = −0.54, p < 0.001). See Table 4 for a list of significance p values and Spearman rank correlation coefficients (ρ) for many additional parameters that also showed incremental increases and decreases along the watershed.
Lignin Concentration and Composition
Lignin is derived solely from vascular plants (Hedges and Mann, 1979); its concentration and composition provide information on the prevalence of terrestrially sourced organic matter, its vascular plant source, and its degradation state (Hedges and Mann, 1979; Hedges et al., 1988). Review of lignin concentration and composition helps to identify how terrestrial source signatures, as an element of total DOC, transform as water passes through the watershed. During March and May, lignin concentration (Σ8) in the study area increased (p < 0.05) incrementally downstream from the headwaters to the lower watershed (Supplementary Table S1). Lignin concentrations varied from 1.45 μg L–1 to 82.2 μg L–1 overall, with a median value of 25.0 μg L–1. These concentrations span a larger range than the river channels of the Sacramento-San Joaquin Delta (3.0 to 14.2 μg L–1 range; median 7.3 μg L–1), downstream of Willow Slough, but still lie within range of Delta lignin concentrations when discharges from peaty agricultural islands are considered (14.9 to 111 μg L–1 range; median 53.7 μg L–1) (Eckard et al., 2007). Observed concentrations are also in line with prior studies in Willow Slough (range of 2.6 to 125.3 μg L–1) (Hernes et al., 2008, 2013).
Lignin carbon normalized yields (Λ8) provide information about the relative proportion of DOC that is derived from vascular plants, with higher values indicating a stronger vascular plant source signature. Lignin Λ8 values also increased (p < 0.05) as water flowed downstream through the watershed (Figure 3B). Overall, Λ8 ranged from 0.10 to 1.93 mg 100 mg DOC–1 (median 0.66 mg 100 mg DOC–1), a range that was larger and higher than that identified downstream in the Delta (range of 0.07 to 0.85, median 0.36 mg 100 mg DOC–1) (Eckard et al., 2007), yet similar to Λ8 values previously reported in Willow Slough (range of 0.12 to 2.29 mg 100 mg DOC–1) (Hernes et al., 2013).
Lignin phenol ratios of syringyl to vanillyl (S:V) and cinnamyl to vanillyl (C:V) phenols can resolve vascular plant organic matter from gymnosperm or angiosperm, and woody or non-woody sources, respectively (Hedges and Mann, 1979). Ratios of S:V across the study area spanned from 0.62 to 2.21 (median 1.09), while C:V ranged from 0.08 to 0.97 (median 0.57) (Supplementary Table S1). These values are largely consistent with non-woody angiosperm vegetation (Hedges and Mann, 1979). Values of C:V increased (p < 0.01) downstream along the watershed, wherein high C:V values indicate that new cinnamyl lignin is coming from monocots (grasses), consistent with major lower watershed crops. No consistent trend in S:V values was identified. Observed ratios of lignin phenolic acids to aldehydes, which function as diagenetic indicators for terrestrial biomass (Hedges et al., 1988), showed no consistent trends, but ranged from 0.73 to 3.16 (median 1.49) for (Ad:Al)v and from 0.80 to 2.10 (median 1.33) across the study.
Optical Parameters
Absorbance of ultraviolet light, when normalized to DOC concentration, positively correlates with aromaticity, and aromaticity is useful in understanding the composition of organic matter, and especially organic matter derived from vascular plants (Traina et al., 1990; Weishaar et al., 2003). SUVA254 values ranged from 2.04 to 4.04 L mg–1 m–1 (median 2.71 L mg–1 m–1), indicating high aromaticity in the watershed. SUVA254 increased (p < 0.05) from the upper watershed to the mouth, indicating a net increase in aromaticity as water passed through the watershed (Figure 3D). Values of SUVA254 also varied among sampling events (p < 0.01), with highest median values during the March sampling event (median 3.13 L mg–1 m–1), when the watershed was more heavily influenced by storm runoff. Median SUVA254 values were lower during the other three sampling periods, at 2.39 L mg–1 m–1 (May), 2.64 L mg–1 m–1 (July), and 2.52 L mg–1 m–1 (November).
Organic matter molecular weight has been shown to vary (inversely) with spectral slope, where higher organic matter tends to reflect a stronger vascular plant source (Helms et al., 2008; Spencer et al., 2009). Fluorescence index (FI) is useful for discerning whether organic matter is more predominantly terrestrial (lower values) or more predominantly aquatic (higher values) (McKnight et al., 2001). The spectral slope between 275-295 nm (S275–295) ranged from 0.010 to 0.018 (median 0.015), while the spectral slope between 350-400 nm (S350–400) ranged from 0.010 to 0.021 (median 0.016) over the watershed, in line with values previously reported at the Willow Slough mouth (Hernes et al., 2008; Saraceno et al., 2009) (Supplementary Table S1). No further trends were evident for spectral slope. With a range of 1.27 to 1.57 (median 1.40), FI values did not show a trend toward increase or decrease across the watershed, indicating little systematic change in the relative contributions of terrestrial or aquatic-derived organic matter in the watershed.
Parallel factor analysis -based mathematical deconstruction of EEMs into individual components can discern humic-like and protein-like (phenylpropyl) organic matter, and can also potentially be correlated to other organic chemical parameters, such as bulk DOC (Ohno and Bro, 2006; Fellman et al., 2010b; Kothawala et al., 2014). The PARAFAC analysis completed here optimally identified five component fluorophores (Figure 4) (see Table 2 for component descriptions). PARAFAC peaks can be compared to traditionally defined peaks in the same region of the EEM, to help shed light on their meaning. The five identified PARAFAC peaks were analogous to either traditionally defined humic-like peaks (C1 to peak A, C2 to peaks A and C, and C3 to peak M) or protein-like peaks (C4 to peak T, C5 to peak B), although the latter may more generally represent phenylpropyl compounds such as vascular plant-derived phenolics (Maie et al., 2007; Hernes et al., 2009; Eckard et al., 2017).
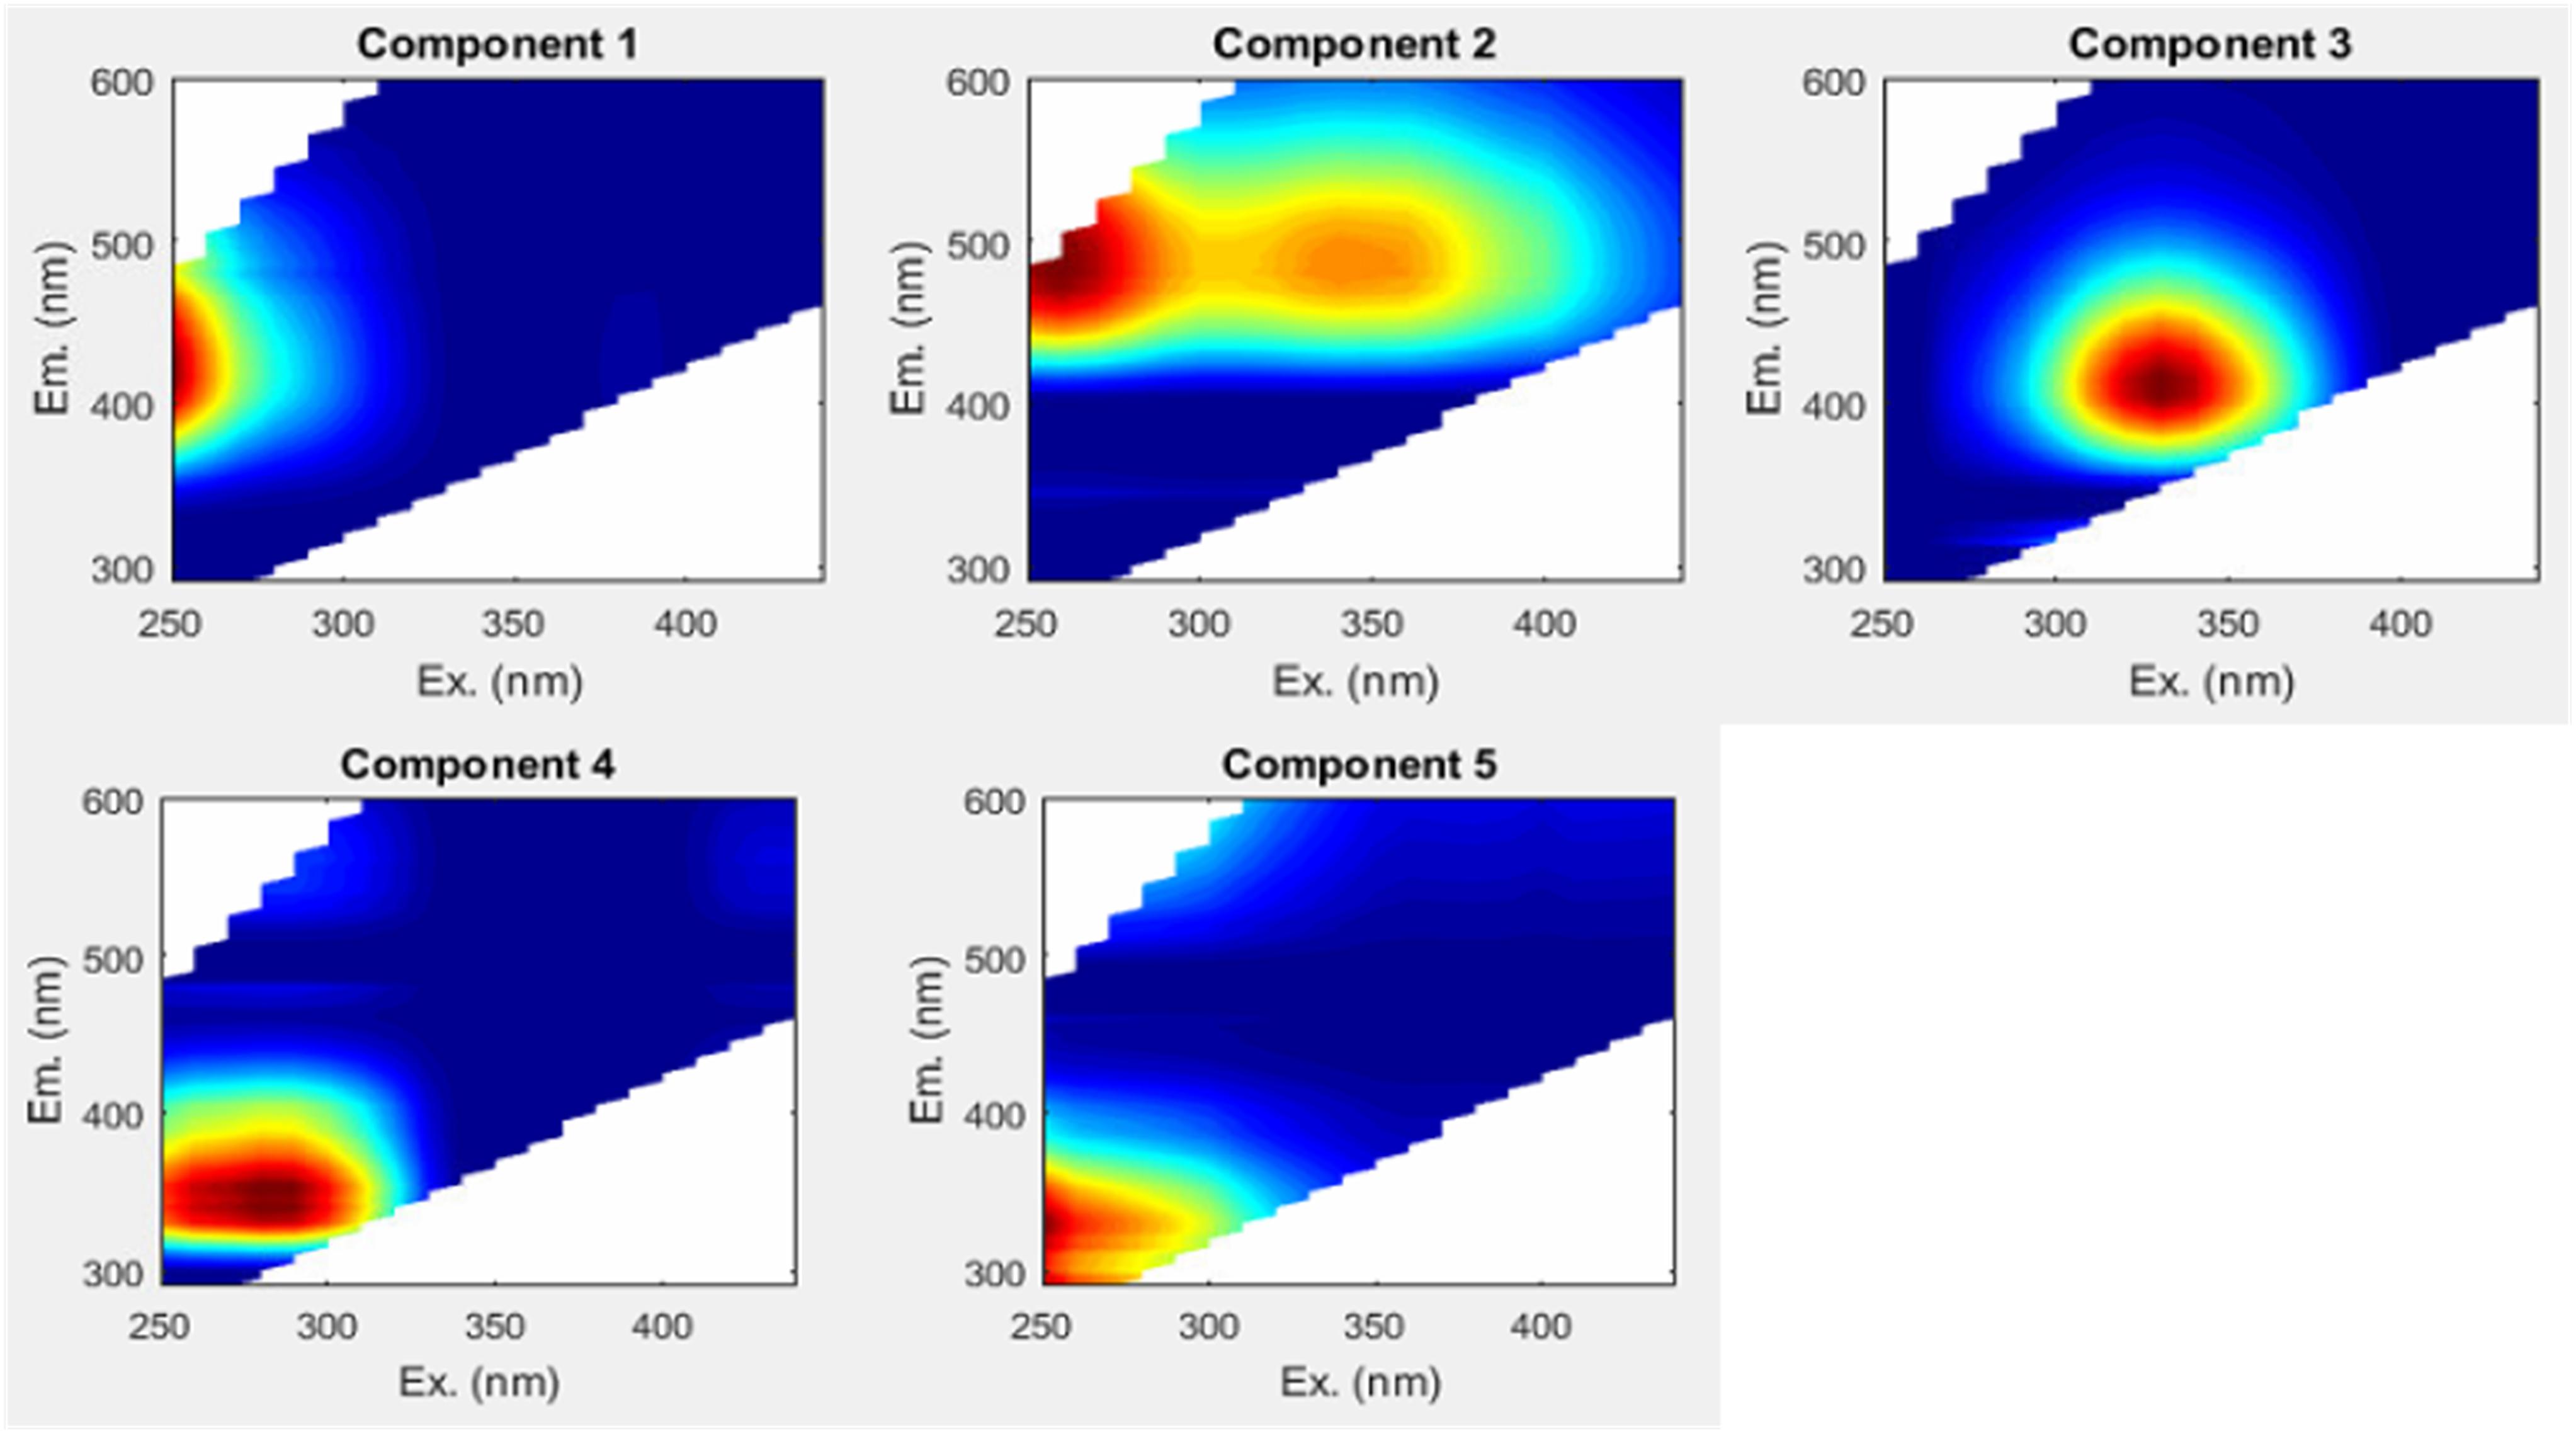
Figure 4. Five PARAFAC components were optimally identified.
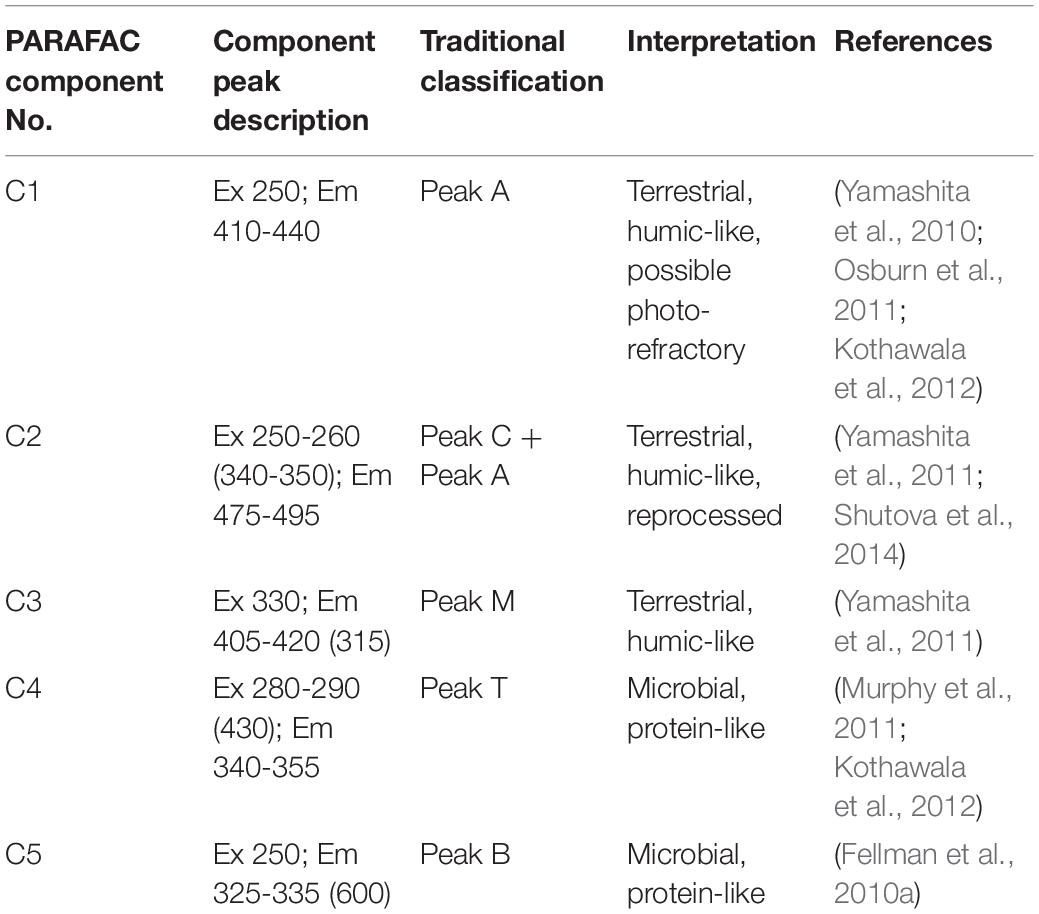
Table 2. PARAFAC component summary. EEMs data were deconstructed into 5 discrete components.
Humic-like PARAFAC component response values were consistently higher than those of the phenylpropyl components. Humic-like A, C, and M peak regions (C1, C2, and C3) carried median response values of 5.75, 4.92, and 4.56, respectively, whereas phenylpropyl T and B peak regions (C4 and C5) had median response values of only 1.74 and 0.03, respectively, underscoring a strong predominance of terrestrially derived, humic-like FDOM in the Willow Slough watershed (Supplementary Table S1). Additionally, prior studies have correlated polyphenolics to the T peak region (i.e., similar to C4) (Maie et al., 2007; Hernes et al., 2009). Therefore, the observed incremental increases in the T peak region (C4) along the watershed may also reflect increases in polyphenolic content, rather than protein-like organic matter. Evidence for a terrestrial source is corroborated by high aromaticity indicated by high SUVA254 values, high molecular weight indicated by low spectral slope, and by relatively high carbon normalized lignin values (see above). Prior Willow Slough watershed investigations also identified strong terrestrial organic matter source signatures (Hernes et al., 2013). All five PARAFAC components showed a statistically significant increasing trend (p < 0.01) from the headwater stations to the Willow Slough mouth. For example, median values over all sampling periods for the peak A region (C1) increased from 4.4 at the headwaters to 7.8 at the Willow Slough mouth, with similar trends observed for other PARAFAC components (Figure 3F).
Optical Parameter Relationships
Concentration of DOC was strongly correlated to several optical parameters. Absorbance at 350 nm (α350) strongly correlated with increasing DOC concentration, as did fluorescent DOM (fDOM; Figure 3E), and humic-like PARAFAC components C2, C3, and C4 (e.g., see Figure 5A). Mirroring prior comparisons of optical measurements to lignin parameters (Hernes and Benner, 2003; Hernes et al., 2008), the present study identified the strongest correlation between a350 and lignin Σ8 (Figure 5B). Although the relationship was weaker, a nonetheless statistically significant relationship between lignin Λ8 and absorbance at 440 nm (a440) further underscores the utility of UV-VIS parameters in estimating lignin concentration and composition (Table 3).
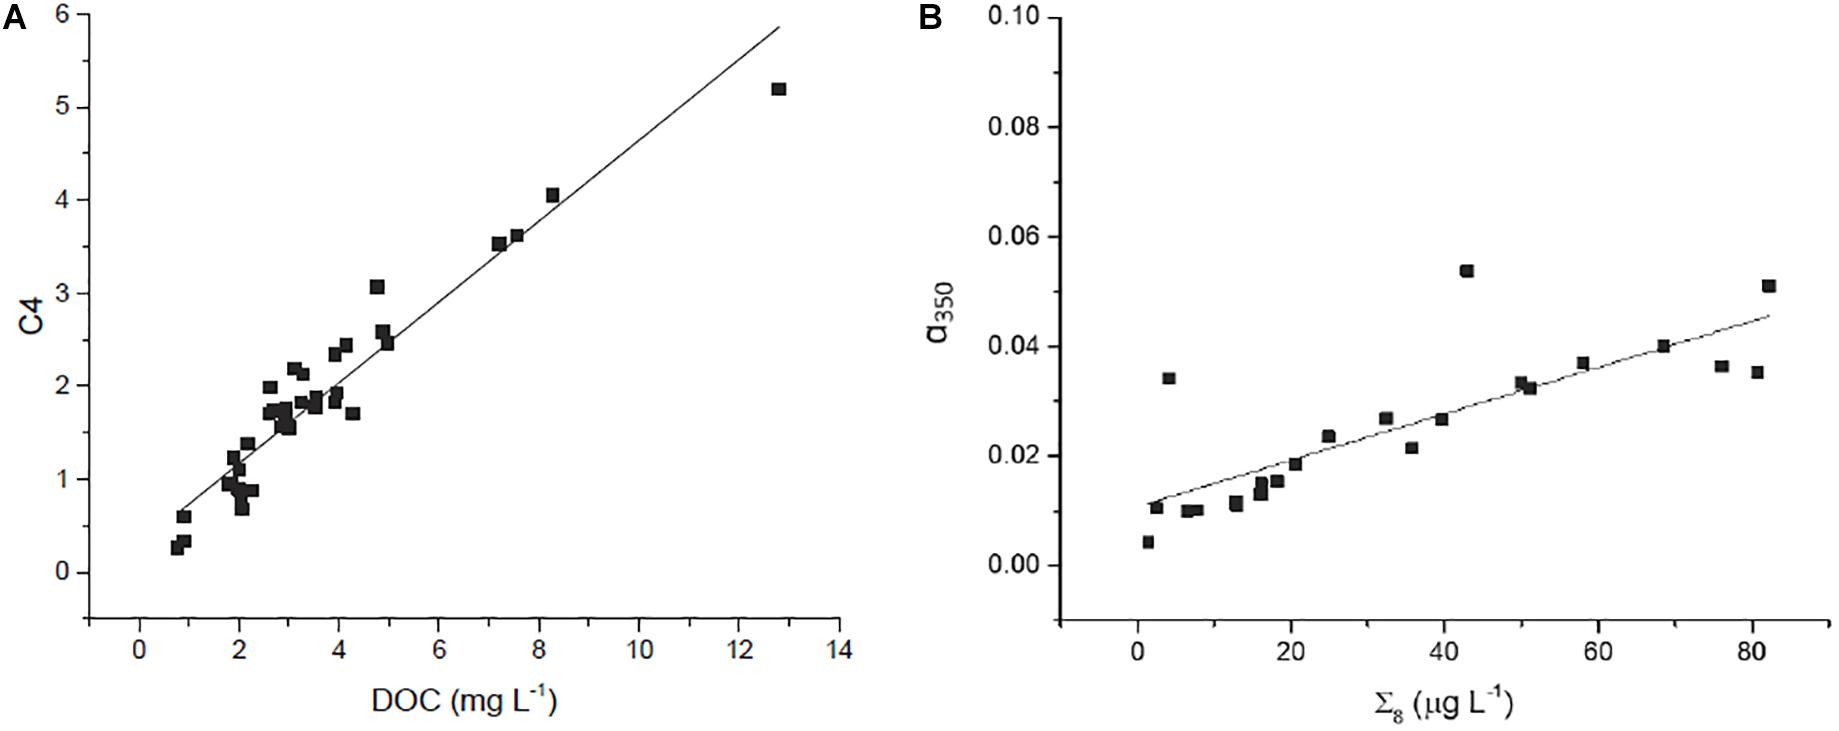
Figure 5. Relationship between (A) T peak region EEM (C4) and DOC (r2 = 0.91, p < 0.001, n = 39) and (B) Σ8 and α350 (r2 = 0.65; p < 0.001, n = 23).
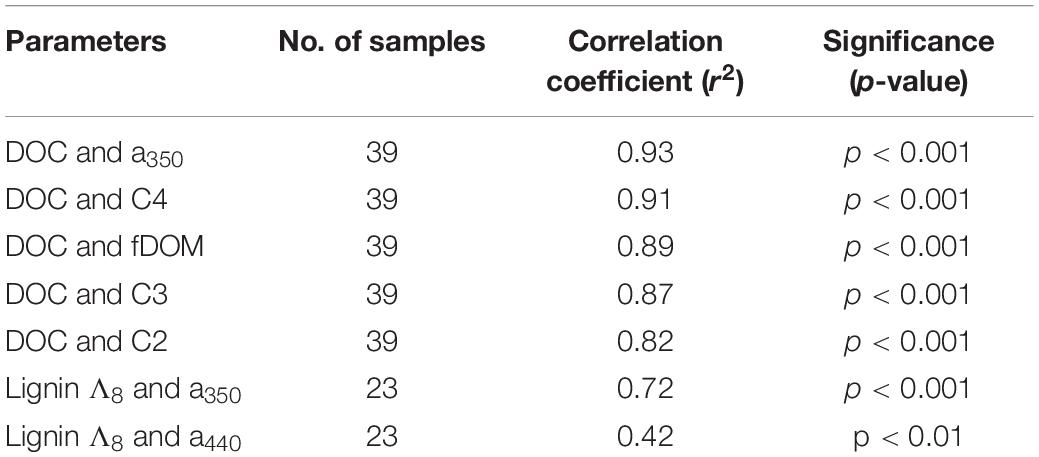
Table 3. Optical parameter relationships to DOC concentration and lignin carbon normalized yield (Λ8).
Discussion
Integration of Local Carbon Into the Willow Slough Waterway
Changes in the concentration and composition of terrestrially derived organic matter as water flows downstream along watersheds are widely reported (Vannote et al., 1980; Hedges et al., 2000; Spencer et al., 2016). Yet it can be difficult to isolate changes in organic matter character caused by a waterway’s interaction with one specific land use or another, when organic matter from multiple land uses is mixed and integrated together. One key benefit of studying a highly managed agricultural area – like the Willow Slough watershed – is its nearly ubiquitous agricultural land use in the lower watershed. The study area contained almost no wetland, riparian, or other native habitat (Oh et al., 2013; Figure 1). Although various crops (alfalfa, tomato, forage, orchards, and rice) are present, their hydrologic regime, level of land disturbance, soil carbon storage, and other key variables all reflect agricultural use. Thus, terrestrial DOM inputs in Willow Slough’s lower watershed can be attributed almost exclusively to agricultural land use.
Building on the observation that many watersheds exhibit unidirectional downstream change in DOM concentration and composition (Dalzell et al., 2011; Ward et al., 2015; Hernes et al., 2017), we sought to evaluate the hypothesis that agricultural land use in the Willow Slough watershed alters aquatic DOM concentration and composition incrementally, in proportion to contact distance between the waterway and adjacent land use. To this end, we employed a rank order correlation approach to our statistical analysis of study data, to evaluate the consistency of increase or decrease in a given parameter while also managing skewed data. Results highlight unidirectional change along the lower Willow Slough watershed. DOC concentration, for example, increased as water flowed downstream (p < 0.001), from a median value of 1.99 mg L–1 at least 30 km upstream of the river mouth, to higher concentrations (p < 0.05) at the watershed mouth (median 3.3 mg L–1) (Figure 3A).
Other parameters followed similar trends. Lignin Σ8 increased incrementally (p < 0.05) in proportion to contact distance as water flowed downstream, from 7.9 μg L–1 above 30 km to 43 μg L–1 at the mouth. While available lignin samples were limited, Σ8 was found to correlate to a350 (r2 = 0.65, p < 0.001, Figure 5B), where a350 also increased incrementally downstream (r2 = 0.41, p < 0.001; Figure 3C). Similar results for many other parameters also suggested that agricultural land use exerted a unidirectional influence on Willow Slough DOM and on its biogeochemistry generally. Examples included increases in absorbance at 440 nm, PARAFAC components, aromaticity, and many others. In total, 26 out of 36 measured parameters—almost three-quarters of those tested—significantly (i.e., with a p-value of 0.05 or smaller) incrementally increased or decreased from sampling station to sampling station downstream along the watershed (Table 4). Notably, changes observed in these parameters as water flows downstream do not appear to be characterized by large, stepwise spikes caused by discrete hot spots. To the contrary, this concept appropriates a framework that is already present in conceptual models for non-point source water pollution. Thus, with the exception of a few outliers, biogeochemical change primarily correlates to contact distance along the watershed, suggesting that the integration of land-derived DOM and other constituents into a waterway can be quantified as a function of contact distance with a given land use.
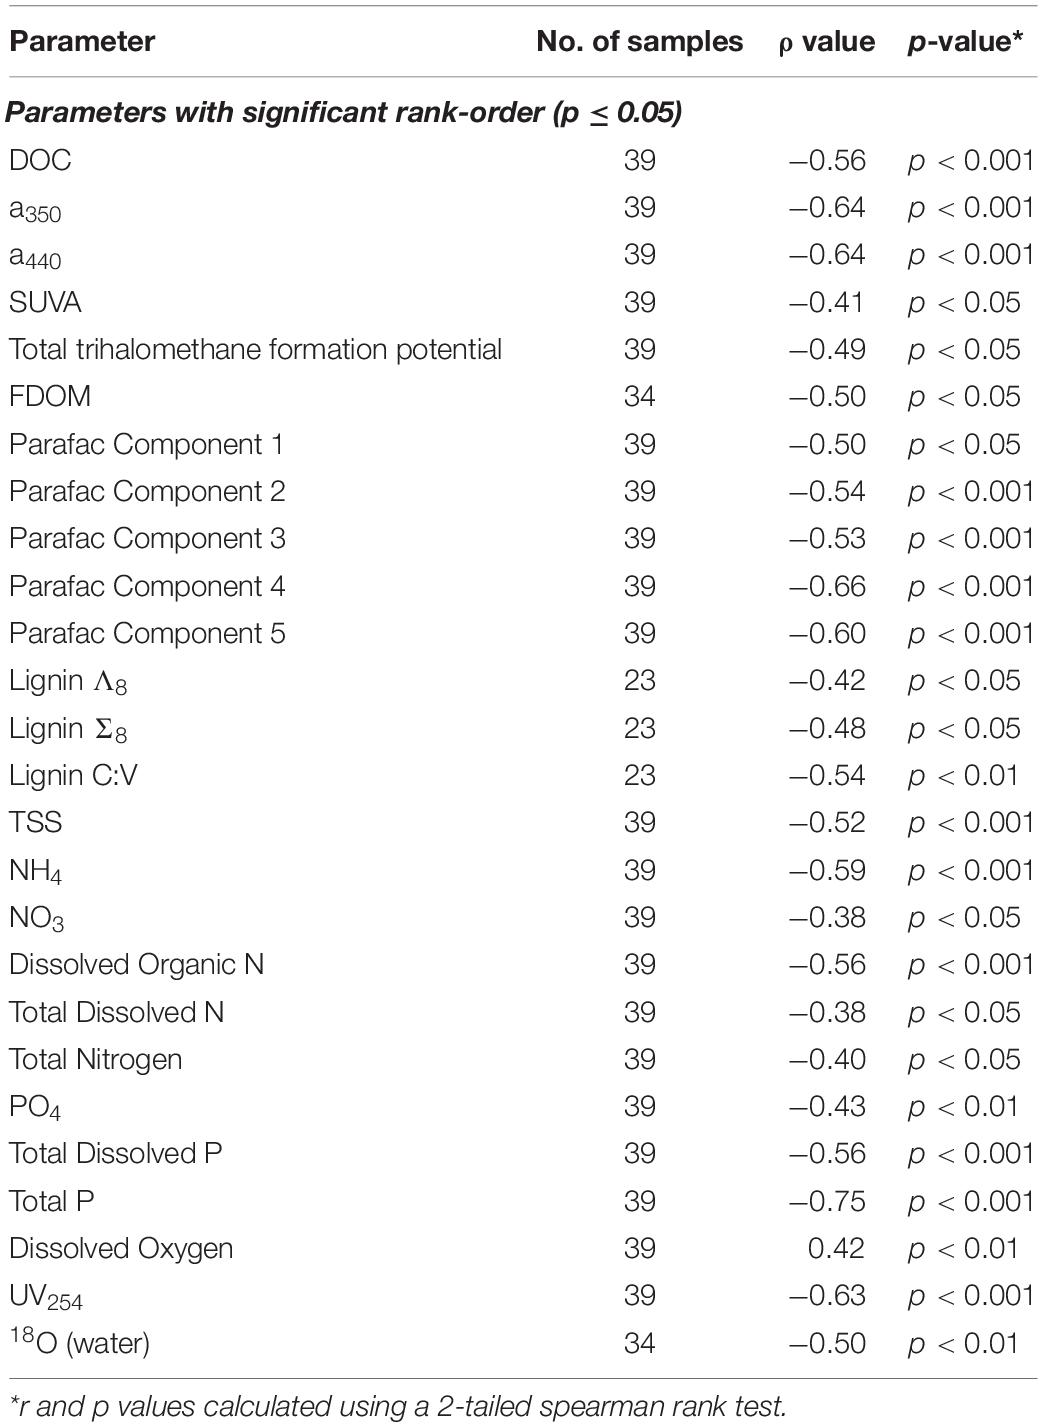
Table 4. List of measured parameters showing statistically significant rank order correlation in the Willow Slough watershed.
Overprinting Distance: A Measure of Riverine Biogeochemical Integration
Agricultural land use more or less continuously supplements Willow Slough with additional organic matter, in proportion to contact distance with terrestrial land use. This process proceeds to a point where DOC imported from upstream sources is substantially overprinted by DOC from local sources derived from the adjacent watershed. We term the watercourse length over which this effect occurs the “overprinting distance.” It is useful to consider that when the concentration of DOC (or other constituent) in a parcel of water has doubled, no more than 50% of the total DOC (or other constituent) can be derived from the initial, upstream source. In reality, in-river processing of upstream DOC could mean that significantly more than 50% of the doubled DOC is local. Conservatively, then, overprinting distance is quantified as the longitudinal distance along a waterway required for DOC from local sources to overwhelm DOC from upstream sources—that is, the distance along a stream over which DOC concentration doubles.
Dissolved organic carbon overprinting distance along the Willow Slough mainstem provides insight into the rate at which local, strongly terrestrial (see Section “Lignin Concentration and Composition”) organic matter is integrated into the waterway. Willow Slough DOC overprinting distance was seasonally variable and sensitive to both initial DOC concentration and to addition (or removal) rates along the watershed. Median DOC overprinting distance across the entire watershed during the study period was 13 km (note that smaller numbers reflect stronger influence, larger numbers reflect reduced influence), or about 40% of the maximum longitudinal distance encompassed by Willow Slough’s lower watershed (i.e., 30.7 km) (Figure 6). Seasonally, winter storm hydrologic connectivity and wetted-up surface sediments, which facilitate DOC export (Eckard et al., 2017), appear to drive the strongest terrestrial influence and highest terrestrial organic matter export rates. For example, late in the winter rainy season (March sampling event), mainstem overprinting distance was 8 km, indicating rapid overprinting. Two months later during the initial ramp-up of the irrigation season, May overprinting distance lengthened to 13 km. Then, during peak irrigation season, July overprinting distance reached 21 km, before dropping to 16 km in early November during the dry period after irrigation had ceased but before winter storms. Thus, DOM exports from the watershed’s terrestrial systems more rapidly influence waterway organic matter during the rainy season when hydrologic connectivity to the watershed is highest. Longer summer DOC overprinting distance reflected, in part, an elevated upstream DOC concentration of 3.0 mg L–1; larger terrestrial organic matter contributions were needed to overprint this higher initial concentration of organic matter, in comparison to winter months. This seasonal effect generated longer overprinting distances despite elevated hydrologic connectivity from irrigation return flows. Thus, this study suggests that overprinting distance is closely tied to watershed-specific processes that change seasonally.
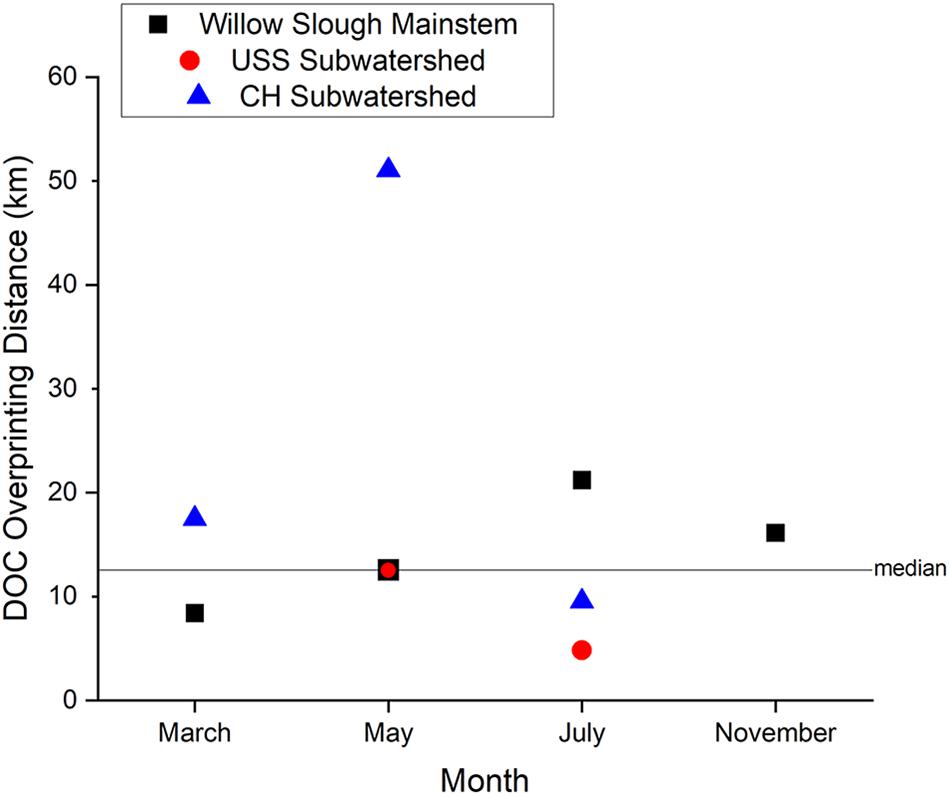
Figure 6. Dissolved Organic Carbon (DOC) concentration overprinting distance for the Willow Slough watershed and for the Union School Slough and Chickahominy/Dry Slough subwatersheds. Horizontal line shows watershed median overprinting distance during the entire study. Positive overprinting distances indicate gain of DOC downstream, while the single negative value reflects DOC loss. Note that overprinting distance values closer to zero indicate stronger watershed influence on DOC concentrations, whereas larger numbers reveal weaker influence of a watershed on its passing waters.
Further underscoring terrestrial contributions to overprinting in Willow Slough, the watershed exhibited especially rapid change in the vascular plant fraction of DOM. Lignin Σ8 overprinting distance (data available for March samples only) was highly efficient at only 1 km for Willow Slough overall, causing lignin concentrations to increase from 1.5 to 50.4 μg L–1 along a distance of only 31 km. For comparison, a separate study quantified overprinting based on lignin composition, and found complete turnover of lignin signatures in an oak woodland to be much slower, occurring over a river distance of 35 km (Hernes et al., 2017). Thus, the present study suggests that agricultural land use has the potential to rapidly overprint terrestrial DOM and terrestrial source signatures, even with comparatively limited contact distance between agriculture and the passing water body.
Viewing the system at a finer scale, increased variability in DOC overprinting distance suggests that smaller water volumes integrate terrestrial sources more rapidly, and that upstream tributaries carry less capacity to buffer terrestrial organic matter fluxes. Overprinting distances in certain study area subwatersheds, for example, were much more variable than the mainstem. Overprinting distances were very strong in the Union School Slough subwatershed (5 km, July sampling event; Figure 6) but were considerably weaker in the Chickahominy/Dry Slough subwatershed (51 km, May sampling event) than those observed along Willow Slough (Figure 6). The short, strong overprinting distance observed along the Union School Slough subwatershed (5% to 15% of total watershed flow) reflects a single hot moment during peak irrigation season in July. Here, despite a relatively high upstream DOC concentration of 3.0 mg L–1, DOC concentration reached 12.8 mg L–1 just 15.8 km downstream. This watershed carries the highest density of flood-irrigated agriculture in the study area, with large areas of rice and alfalfa that discharge high concentrations of DOC (up to 38.1 mg L–1). In contrast, limited terrestrial influence was observed along the Chickahominy/Dry Slough subwatershed (25 to 35% of total watershed flow) during May, when DOC concentrations increased from 2.0 to 2.6 mg L–1. This large range in overprinting distance among tributaries may be a product of greater hydrologic variability characteristic of low-order waterways, acting to influence the intensity of terrestrial/aquatic interactions in low-order streams.
Overprinting as measured in the present study considers only the addition of new material (autochthonous and allochthonous) along the waterway. Hypothetically, overprinting could also happen even with no changes in DOC concentration if there were balanced DOC sources and sinks. In this system, however, in-stream DOC losses or changes in organic matter composition as organic matter passes downstream—caused by biotic degradation, photodegradation, sorption, and other riverine degradation—are conservatively excluded from our calculations. These exclusions are reasonable for the present watershed because it has a low residence time of approximately 12 to 36 h, which is short in comparison to the amount of time needed to observe substantial changes due to many of these loss processes. Furthermore, increases in DOC and lignin concentration as water flowed downstream highlight that gaining factors outweighed loss factors across the watershed overall.
We were, however, able to observe one instance of in-stream DOC loss along a single subwatershed. During the March sampling event, DOC concentrations from the headwaters of the USS subwatershed were especially high, at 5.0 mg L–1. Over a distance of 15.8 km downstream, DOC concentrations decreased to 3.9 mg L–1, at an average rate of 0.07 mg L–1 loss in DOC concentration for every kilometer passed along the waterway. This finding underscores the conservative nature of overprinting distance as a measure of the rate of change in DOM composition along a waterway. This finding also provides at least an initial estimate of potential loss rates that may be occurring across the watershed, due to biotic degradation, photodegradation, sorption, and other degradation. The observed 0.07 mg L–1 kg–1 loss rate is equivalent to a 1.3% reduction of DOC concentration per kilometer passed along the waterway. As a preliminary initial estimate, we can assume that this loss rate is also applicable to the other sites in this study, which results in a similar 1.3% reduction in overprinting distance when accounting for in-stream losses.
To gain a better understanding of the accuracy of the DOC overprinting analysis considered here, we consider these loss factors along with the degree of variability inherent in the overall analysis. Precision of the DOC measurements was equivalent to 0.1 mg L–1, as noted previously, resulting in a 0.8% to 13.1% error overall (median 3.4%). To further improve accuracy and precision of the analysis, future investigations should seek to collect a larger number of samples across the target area to increase statistical predictive power. A detailed consideration and measurement of loss terms in future study design would further constrain the role of organic matter degradation, sorption, and other in-stream loss factors along the watershed. Generally, at higher river orders downstream, and as degradation increases over longer distances and greater residence times, we expect overprinting distance—as we have calculated it—to become increasingly conservative (i.e., further underpredict the rate at which new carbon is added). In such cases, organic matter would have more opportunity to degrade, be consumed, or otherwise lost from the system. Especially for larger order rivers, then, overprinting distance should be interpreted as a conservative lower bound on the rate at which geochemical change occurs along a watershed segment.
Optical Parameters and Seasonal Change in Optically Active Carbon Using EEMDOC
Absorption and emission spectra from the optically active fraction of DOM relate to DOM biochemistry, and are widely used to estimate DOM composition (Stedmon et al., 2003; Hernes et al., 2009; Fellman et al., 2010a). Analyzing EEMs to discern biochemical characteristics carries distinct advantages: measurements are inexpensive, rapid, and sensitive, with capacity for large throughput. However, only a fraction of total DOM is optically active, rendering much of DOM impossible to directly characterize using optical measurements. Correlations between EEM PARAFAC components and Fourier transform ion cyclotron resonance mass spectrometer (FTICR-MS) peak intensities indicate that up to 39% of identified compounds (including optically active and inactive compounds) covaried with at least one PARAFAC component for DOM in boreal Canadian waterways (Stubbins et al., 2014). Nonetheless, no available metric or established method exists to easily discern the relative fraction of DOM that is optically active (Stedmon and Nelson, 2015; Wünsch et al., 2015). It is therefore difficult to determine how representative EEMs data are in their ability to predict overall DOM composition or biogeochemistry. This limitation constrains the process of EEMs interpretation, especially when attempting to extrapolate to bulk DOM composition. There is no established way, for example, to quantify whether optically active DOM represents a comparatively small or large fraction of the total DOM in a sample.
We propose normalizing total response for each EEM to DOC concentration to quantify the relative representativeness of EEMs spectra as a proxy for bulk DOM composition (see Section “EEMDOC and the Relative Proportion of Optically Active Organic Matter”). Carbon normalization is a well-established tool for investigating organic chemical composition; it is widely used to quantify the relative proportion of a single compound (i.e., glucose) or a class of compounds (i.e., neutral sugars, lignin, lipids, amino acids, etc.) as a fraction of bulk DOC (Hedges and Parker, 1976; Wakeham et al., 1984; Cowie and Hedges, 1994; Aufdenkampe et al., 2001). There is even past precedent for carbon-normalized optical measurements, as several have used carbon-normalized UV absorbance at various wavelengths as a proxy for DOC aromaticity (Traina et al., 1990; Chin et al., 1994; Weishaar et al., 2003). In place of absorbance at a single wavelength, Guillemette et al. (2017) normalized individual PARAFAC components to DOC concentration to quantify the strength of the target fluorophores, as a subset of total DOC. Combining many EEMs peaks or PARAFAC components together—or comprehensively total optical response—and normalizing to DOC concentration thereby quantifies the strength of all measured optical activity collectively. Where fluorophore composition is sufficiently similar among samples (see Section “Materials and Methods”), the resulting carbon normalized optical response provides a relative measure of the yield of optically active organic matter per unit DOC.
Observed variability in EEMDOC suggests that optical measurements in Willow Slough characterized a greater or lesser proportion of bulk DOC, corresponding to seasonal temperature and hydrologic changes in the study area (Figures 7, 8). EEMDOC parameter values correlated inversely with water temperature (r2 = 0.73; p < 0.001; Figure 8), increasing in value during cool winter periods, and decreasing in value when water was warmer during the summer. EEMDOC also varied significantly (p < 0.001) among sampling dates, with the highest median values of 7.0 ΣR.U. L μmol C–1 observed in March, during cooler temperatures when four runoff-producing storm events reached the watershed. During summer irrigation flows, EEMDOC was most depleted, with a median value of 3.9 ΣR.U. L μmol C–1. This finding implies that although irrigation flows release high concentrations of soil-derived organic matter into the watershed (Hernes et al., 2008), this organic matter was less optically active, perhaps as a result of an underlying physical factor such as system hydrology, photodegradation, or preferential sorption to mineral soils of lignin versus bulk carbon (Hernes et al., 2007). It is notable that longer (weaker) mainstem DOC overprinting corresponded to relatively less optically active DOC, while shorter (stronger) mainstem DOC overprinting in March coincided with relatively more optically active DOC. This finding highlights a potential connection between optically active organic matter and the rate of terrestrial influence on waterway biogeochemistry: the watershed most strongly influences its waterway when optically active organic matter signatures are the strongest.
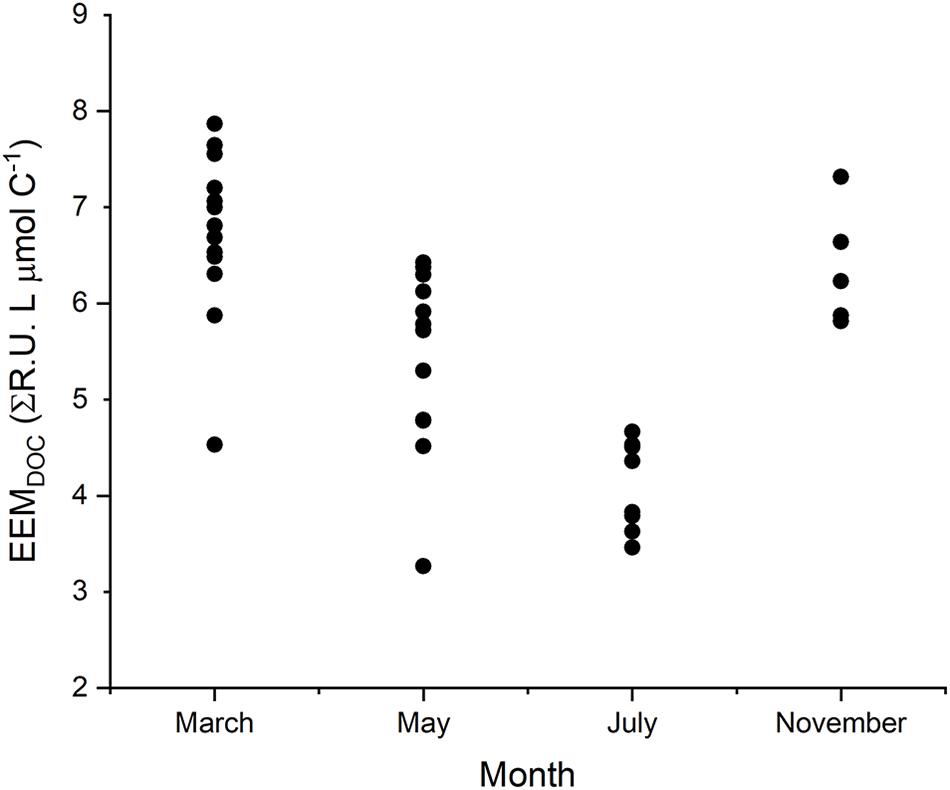
Figure 7. The EEMDOC parameter (n = 39) integrates the total response volume for each EEM; normalized to DOC concentration, it provides a relative estimate of the amount of fluorescent DOC present, in proportion to total DOC concentration, thus reflecting the proportion of DOC that can be resolved by using optical measurements.
Figure 8. Relationship observed between EEMDOC and temperature (r2 = 0.73; p < 0.001, n = 39).
Toward a Modeling Basis for River Integration of DOM
Our findings on overprinting distance are analogous to a prior study in the Sacramento-San Joaquin Delta, downstream of Willow Slough, where wetland and agricultural land use overprinted DOM as water passed through the system (Eckard et al., 2007), and to a more recent study of oak woodlands where organic matter from numerous small streams overprinted DOM signatures of a much larger river over short distances (Hernes et al., 2017). Both of these studies dealt with overprinting of lignin specifically, whereas the present study also generalizes the concept to bulk DOC, suggesting that overprinting distance could be applied to other parameters as well. Therefore, analogous to nutrient spiraling as a unifying method for quantifying and comparing nutrient dynamics along diverse waters (Webster, 1975; Newbold et al., 1981; Ensign and Doyle, 2006), quantifying river integration of terrestrial organic matter represents a critical pivot point beyond traditional qualitative evaluations. Specifically, overprinting distance provides a base metric for numerical modeling to predict the integration of organic matter from local, terrestrial sources into adjacent waterways. Within a single watershed, predictive modeling could incorporate overprinting values from various land uses and watershed types to estimate DOM integration along complex and patchy, spatially heterogeneous watersheds. The effects of land use change or climate change on river integration of organic matter could also be estimated at this scale. When compared across multiple watersheds, overprinting distances could be used to make one-to-one comparisons across rivers of different sizes and with different geomorphic, hydrologic, and geochemical characteristics.
Data Availability Statement
All datasets generated for this study are included in the article/Supplementary Material.
Author Contributions
RE, BB, BP, RS, and PH performed the substantial contributions to work conception and design, drafted and revised the manuscript critically for important intellectual content, and provided the approval for publication of content. RE, BB, BP, RS, RD, and PH did the acquisition, analysis or interpretation of data for the work and agreed to be accountable for all aspects of the work in ensuring that questions related to the accuracy or integrity of any part of the work are appropriately investigated and resolved.
Funding
Funding for the project was provided through California Bay Delta Authority Drinking Water Program, Agreement #: 04-173-555-0.
Conflict of Interest
The authors declare that the research was conducted in the absence of any commercial or financial relationships that could be construed as a potential conflict of interest.
Acknowledgments
We would like to thank: California Bay Delta Authority Ecosystem Program and Drinking Water Program for their support; Miranda Fram, Timothy Ingrum, Will Kerlin, Kathryn Crepeau, Frank Anderson, Travis von Dessonneck, Angela Hansen, and Tamara Kraus for data management and analytical/field support; Tim Delany, Travis Pritchard, and Sam Prentice, for their hydrologic work, data collection, and field support; and the two reviewers for their comments and suggestions that improved this manuscript. Any use of trade, firm, or product names is for description purposes only and does not imply endorsement by the U.S. Government.
Supplementary Material
The Supplementary Material for this article can be found online at: https://www.frontiersin.org/articles/10.3389/feart.2020.00067/full#supplementary-material
Abbreviations
(Ad:Al)v, Ratio of lignin vanillyl phenol acids to aldehydes; a350, Absorbance at 350 nm; a440, Absorbance at 440 nm; C:V, Ratio of cinnamyl to vanillyl lignin phenols; DOC, Dissolved organic carbon; DOM, Dissolved organic matter; EEM, Excitation emission spectra; EEMDOC, Relative fraction of optically active DOM; fDOM, Fluorescent dissolved organic matter; FI, Fluorescence index; OM, Organic matter; PARAFAC, Parallel factor analysis; S:V, Ratio of syringyl to vanillyl lignin phenols; S275–295, Spectral slope; S350–400, Spectral slope; SUVA254, Standard UV absorbance at 254 nm; Λ8, Lignin carbon normalized yields; Σ8, Lignin concentration.
References
Aufdenkampe, A. K., Hedges, J. I., Richey, J. E., Krusche, A. V., and Llerena, C. A. (2001). Sorptive fractionation of dissolved organic nitrogen and amino acids onto fine sediments within the Amazon Basin. Limnol. Oceanogr. 46, 1921–1935.
Blough, N. V., and Del Vecchio, R. (2002). “Chromophoric DOM in the coastal environment,” in Biogeochemistry of Marine Dissolved Organic Matter, eds D. A. Hansell and C. A. Carlson, (San Diego, CA: Academic Press).
Boss, E., and Zaneveld, J. R. V. (2003). The effect of bottom substrate on inherent optical properties: evidence of biogeochemical processes. Limnol. Oceanogr. 48, 346–354.
Chin, Y.-P., Aiken, G., and O’loughlin, E. (1994). Molecular weight, polydispersity, and spectroscopic properties of aquatic humic substances. Environ. Sci. Technol. 28, 1853–1858.
Cole, J. J., Prairie, Y. T., Caraco, N. F., Mcdowell, W. H., Tranvik, L. J., Striegl, R. G., et al. (2007). Plumbing the global carbon cycle: integrating inland waters into the terrestrial carbon budget. Ecosystems 10, 171–184. doi: 10.1016/j.envpol.2019.03.014
Cowie, G. L., and Hedges, J. I. (1994). Biochemical indicators of diagenetic alteration in natural organic matter mixtures. Nature 369, 304–307.
Dalzell, B. J., King, J. Y., Mulla, D. J., Finlay, J. C., and Sands, G. R. (2011). Influence of subsurface drainage on quantity and quality of dissolved organic matter export from agricultural landscapes. J. Geophys. Res. Biogeosci. 116:G02023.
Eckard, R. S., Hernes, P. J., Bergamaschi, B. A., Stepanauskas, R., and Kendall, C. (2007). Landscape scale controls on the vascular plant component of dissolved organic carbon across a freshwater delta. Geochim. Cosmochim. Acta 71, 5968–5984.
Eckard, R. S., Pellerin, B. A., Bergamaschi, B. A., Bachand, P. A., Bachand, S. M., Spencer, R. G., et al. (2017). Dissolved organic matter compositional change and biolability during two storm runoff events in a small agricultural watershed. J. Geophys. Res. Biogeosci. 122, 2634–2650.
Ensign, S. H., and Doyle, M. W. (2006). Nutrient spiraling in streams and river networks. J. Geophys. Res. Biogeosci. 111:G04009.
Ertel, J. R., Hedges, J. I., Devol, A. H., Richey, J. E., and Ribeiro, M. D. G. (1986). Dissolved humic substances of the Amazon river system. Limnol. Oceanogr. 31, 739–754.
Fellman, J. B., Hood, E., and Spencer, R. G. M. (2010a). Fluorescence spectroscopy opens new windows into dissolved organic matter dynamics in freshwater ecosystems: a review. Limnol. Oceanogr. 55, 2452–2462.
Fellman, J. B., Spencer, R. G. M., Hernes, P. J., Edwards, R. T., D’amore, D. V., and Hood, E. (2010b). The impact of glacier runoff on the biodegradability and biochemical composition of terrigenous dissolved organic matter in near-shore marine ecosystems. Mar. Chem. 121, 112–122.
Gladyshev, M. I., Kolmakova, O. V., Tolomeev, A. P., Anishchenko, O. V., Makhutova, O. N., Kolmakova, A. A., et al. (2015). Differences in organic matter and bacterioplankton between sections of the largest Arctic river: mosaic or continuum? Limnol. Oceanogr. 60, 1314–1331.
Guillemette, F., Wachenfeldt, E., Kothawala, D. N., Bastviken, D., and Tranvik, L. J. (2017). Preferential sequestration of terrestrial organic matter in boreal lake sediments. J. Geophys. Res. Biogeosci. 122, 863–874.
Hedges, I. (1981). Flux of Organic Carbon by Rivers to the Ocean: Report of a Workshop, Woods Hole, MA, 21-25 September, 1980. Washington, DC: United States Department of Energy, 109.
Hedges, J. I., Blanchette, R. A., Weliky, K., and Devol, A. H. (1988). Effects of fungal degradation on the CuO oxidation products of lignin: a controlled laboratory study. Geochim. Cosmochim. Acta 52, 2717–2726.
Hedges, J. I., and Mann, D. C. (1979). Characterization of plant-tissues by their lignin oxidation-products. Geochim. Cosmochim. Acta 43, 1803–1807.
Hedges, J. I., Mayorga, E., Tsamakis, E., Mcclain, M. E., Aufdenkampe, A., Quay, P., et al. (2000). Organic matter in Bolivian tributaries of the Amazon river: a comparison to the lower mainstream. Limnol. Oceanogr. 45, 1449–1466.
Hedges, J. I., and Parker, P. L. (1976). Land-derived organic matter in surface sediments from the Gulf of Mexico. Geochim. Cosmochim. Acta 40, 1019–1029. doi: 10.1016/j.marpolbul.2017.04.042
Helms, J. R., Stubbins, A., Ritchie, J. D., Minor, E. C., Kieber, D. J., and Mopper, K. (2008). Absorption spectral slopes and slope ratios as indicators of molecular weight, source, and photobleaching of chromophoric dissolved organic matter. Limnol. Oceanogr. 53, 955–969.
Hernes, P. J., and Benner, R. (2003). Photochemical and microbial degradation of dissolved lignin phenols: implications for the fate of terrigenous dissolved organic matter in marine environments. J. Geophys. Res. Oceans 108:3291.
Hernes, P. J., Bergamaschi, B. A., Eckard, R. S., and Spencer, R. G. M. (2009). Fluorescence-based proxies for lignin in freshwater dissolved organic matter. J. Geophys. Res. Biogeosci. 114, 1–10.
Hernes, P. J., Robinson, A. C., and Aufdenkampe, A. K. (2007). Fractionation of lignin during leaching and sorption and implications for organic matter “freshness”. Geophys. Res. Lett. 34:L17401.
Hernes, P. J., Spencer, R. G., Dyda, R. Y., O’geen, A. T., and Dahlgren, R. A. (2017). The genesis and exodus of vascular plant DOM from an oak woodland landscape. Front. Earth Sci. 5:9. doi: 10.3389/feart.2017.00009
Hernes, P. J., Spencer, R. G. M., Dyda, R. Y., Pellerin, B. A., Bachand, P. A. M., and Bergamaschi, B. A. (2008). The role of hydrologic regimes on dissolved organic carbon composition in an agricultural watershed. Geochim. Cosmochim. Acta 72, 5266–5277.
Hernes, P. J., Spencer, R. G. M., Dyda, R. Y., Pellerin, B. A., Bachand, P. A. M., and Bergamaschi, B. A. (2013). DOM composition in an agricultural watershed: assessing patterns and variability in the context of spatial scales. Geochim. Cosmochim. Acta 121, 599–610.
Junk, J. W., Bayley, P. B., and Sparks, R. E. (1989). “The flood pulse concept in river-floodplain systems,” in Proceedings of the International Large River Symposium: Canadian Journal Fisheries and Aquatic Sciences Special Publication (Ottawa, ON: NRC Research Press), 110–127.
Kothawala, D. N., Stedmon, C. A., Muller, R. A., Weyhenmeyer, G. A., Kohler, S. J., and Tranvik, L. J. (2014). Controls of dissolved organic matter quality: evidence from a large-scale boreal lake survey. Glob. Chang. Biol. 20, 1101–1114. doi: 10.1111/gcb.12488
Kothawala, D. N., Von Wachenfeldt, E., Koehler, B., and Tranvik, L. J. (2012). Selective loss and preservation of lake water dissolved organic matter fluorescence during long-term dark incubations. Sci. Total Environ. 433, 238–246. doi: 10.1016/j.scitotenv.2012.06.029
Lambert, T., Darchambeau, F., Bouillon, S., Alhou, B., Mbega, J. D., Teodoru, C. R., et al. (2015). Landscape control on the spatial and temporal variability of chromophoric dissolved organic matter and dissolved organic carbon in large African rivers. Ecosystems 18, 1224–1239.
Maie, N., Scully, N. M., Pisani, O., and Jaffé, R. (2007). Composition of a protein-like fluorophore of dissolved organic matter in coastal wetland and estuarine ecosystems. Water Res. 41, 563–570.
Mann, P. J., Spencer, R. G., Hernes, P. J., Six, J., Aiken, G. R., Tank, S. E., et al. (2016). Pan-arctic trends in terrestrial dissolved organic matter from optical measurements. Front. Earth Sci. 4:25. doi: 10.3389/feart.2016.00025
McClain, M. E., Boyer, E. W., Dent, C. L., Gergel, S. E., Grimm, N. B., Groffman, P. M., et al. (2003). Biogeochemical hot spots and hot moments at the interface of terrestrial and aquatic ecosystems. Ecosystems 6, 301–312.
McKnight, D. M., Boyer, E. W., Westerhoff, P. K., Doran, P. T., Kulbe, T., and Andersen, D. T. (2001). Spectrofluorometric characterization of dissolved organic matter for indication of precursor organic material and aromaticity. Limnol. Oceanogr. 46, 38–48.
Murphy, K. R., Hambly, A., Singh, S., Henderson, R. K., Baker, A., Stuetz, R., et al. (2011). Organic matter fluorescence in municipal water recycling schemes: toward a unified PARAFAC model. Environ. Sci. Technol. 45, 2909–2916. doi: 10.1021/es103015e
Newbold, J. D., Elwood, J. W., O’neill, R. V., and Winkle, W. V. (1981). Measuring nutrient spiralling in streams. Can. J. Fish. Aquat. Sci. 38, 860–863.
Oh, N. H., Pellerin, B. A., Bachand, P. A. M., Hernes, P. J., Bachand, S. M., Ohara, N., et al. (2013). The role of irrigation runoff and winter rainfall on dissolved organic carbon loads in an agricultural watershed. Agric. Ecosyst. Environ. 179, 1–10.
Ohno, T., and Bro, R. (2006). Dissolved organic matter characterization using multiway spectral decomposition of fluorescence landscapes. Soil Sci. Soc. Am. J. 70, 2028–2037.
Osburn, C. L., Wigdahl, C. R., Fritz, S. C., and Saros, J. E. (2011). Dissolved organic matter composition and photoreactivity in prairie lakes of the U.S. Great plains. Limnol. Oceanogr. 56, 2371–2390.
Saraceno, J. F., Pellerin, B. A., Downing, B. D., Boss, E., Bachand, P. A. M., and Bergamaschi, B. A. (2009). High-frequency in situ optical measurements during a storm event: assessing relationships between dissolved organic matter, sediment concentrations, and hydrologic processes. J. Geophys. Res. Biogeosci. 114:G00F09.
Shutova, Y., Baker, A., Bridgeman, J., and Henderson, R. K. (2014). Spectroscopic characterisation of dissolved organic matter changes in drinking water treatment: from PARAFAC analysis to online monitoring wavelengths. Water Res. 54, 159–169. doi: 10.1016/j.watres.2014.01.053
Spencer, R. G., Hernes, P. J., Dinga, B., Wabakanghanzi, J. N., Drake, T. W., and Six, J. (2016). Origins, seasonality, and fluxes of organic matter in the Congo River. Global Biogeochem. Cycles 30, 1105–1121.
Spencer, R. G. M., Aiken, G. R., Butler, K. D., Dornblaser, M. M., Striegl, R. G., and Hernes, P. J. (2009). Utilizing chromophoric dissolved organic matter measurements to derive export and reactivity of dissolved organic carbon exported to the Arctic Ocean: a case study of the Yukon River, Alaska. Geophys. Res. Lett. 36:L06401.
Stedmon, C., and Nelson, N. (2015). “The optical properties of DOM in the ocean,” in Biogeochemistry of Marine Dissolved Organic Matter, eds D. A. Hansell and C. A. Carlson, (Amsterdam: Elsevier Science), 481–508.
Stedmon, C. A., Markager, S., and Bro, R. (2003). Tracing dissolved organic matter in aquatic environments using a new approach to fluorescence spectroscopy. Mar. Chem. 82, 239–254. doi: 10.1021/acs.est.8b02648
Stedmon, C. A., Thomas, D. N., Granskog, M., Kaartokallio, H., Papadimitriou, S., and Kuosa, H. (2007). Characteristics of dissolved organic matter in Baltic coastal sea ice: allochthonous or autochthonous origins? Environ. Sci. Technol. 41, 7273–7279.
Stubbins, A., Lapierre, J.-F., Berggren, M., Prairie, Y. T., Dittmar, T., and Del Giorgio, P. A. (2014). What’s in an EEM? Molecular signatures associated with dissolved organic fluorescence in boreal Canada. Environ. Sci. Technol. 48, 10598–10606.
Thorp, J. H., Thoms, M. C., and Delong, M. D. (2006). The riverine ecosystem synthesis: biocomplexity in river networks across space and time. River Res. Appl. 22, 123–147.
Traina, S. J., Novak, J., and Smeck, N. E. (1990). An ultraviolet absorbance method of estimating the percent aromatic carbon content of humic acids. J. Environ. Qual. 19, 151–153.
Turnipseed, D. P., and Sauer, V. B. (2010). Discharge Measurements at Gaging Stations. Reston, VA: United States Geological Survey.
Vannote, R. L., Minshall, G. W., Cummins, K. W., Sedell, J. R., and Cushing, C. E. (1980). The river continuum concept. Can. J. Fish. Aquat. Sci. 37, 130–137.
Wakeham, S. G., Farrington, J. W., and Gagosian, R. B. (1984). Variability in lipid flux and composition of particulate matter in the Peru upwelling region. Org. Geochem. 6, 203–215.
Walker, S. A., Amon, R. M. W., Stedmon, C., Duan, S., and Louchouarn, P. (2009). The use of PARAFAC modeling to trace terrestrial dissolved organic matter and fingerprint water masses in coastal Canadian Arctic surface waters. J. Geophys. Res. Biogeosci. 114:G00F06.
Ward, N. D., Krusche, A. V., Sawakuchi, H. O., Brito, D. C., Cunha, A. C., Moura, J. M. S., et al. (2015). The compositional evolution of dissolved and particulate organic matter along the lower Amazon River-Obidos to the ocean. Mar. Chem. 177, 244–256.
Webster, J. (1975). Analysis of Potassium and Calcium Dynamics in Stream Ecosystems on Three Southern Apalachian Watersheds of Contrasting Vegetation. Ph.D. thesis, University of Georgia, Athens.
Weishaar, J. L., Aiken, G. R., Bergamaschi, B. A., Fram, M. S., Fujii, R., and Mopper, K. (2003). Evaluation of specific ultraviolet absorbance as an indicator of the chemical composition and reactivity of dissolved organic carbon. Environ. Sci. Technol. 37, 4702–4708.
Wünsch, U. J., Murphy, K. R., and Stedmon, C. A. (2015). Fluorescence quantum yields of natural organic matter and organic compounds: implications for the fluorescence-based interpretation of organic matter composition. Front. Mar. Sci. 2:98. doi: 10.3389/fmars.2015.00098
Yamashita, Y., Kloeppel, B. D., Knoepp, J., Zausen, G. L., and Jaffe, R. (2011). Effects of watershed history on dissolved organic matter characteristics in headwater streams. Ecosystems 14, 1110–1122.
Keywords: overprinting distance, river integration, DOC, DOM, EEMDOC
Citation: Eckard RS, Bergamaschi BA, Pellerin B, Spencer RG, Dyda R and Hernes PJ (2020) Organic Matter Integration, Overprinting, and the Relative Fraction of Optically Active Organic Carbon in a Human-Impacted Watershed. Front. Earth Sci. 8:67. doi: 10.3389/feart.2020.00067
Received: 02 September 2019; Accepted: 24 February 2020;
Published: 31 March 2020.
Edited by:
Moritz Felix Lehmann, University of Basel, SwitzerlandCopyright © 2020 Eckard, Bergamaschi, Pellerin, Spencer, Dyda and Hernes. This is an open-access article distributed under the terms of the Creative Commons Attribution License (CC BY). The use, distribution or reproduction in other forums is permitted, provided the original author(s) and the copyright owner(s) are credited and that the original publication in this journal is cited, in accordance with accepted academic practice. No use, distribution or reproduction is permitted which does not comply with these terms.
*Correspondence: Robert S. Eckard, cnNlY2thcmRAdWNkYXZpcy5lZHU=