- 1US Army Corps of Engineers Cold Regions Research and Engineering Laboratory, Hanover, NH, United States
- 2Vermont Technical College, Randolph Center, VT, United States
- 3School of Earth and Sustainability, Northern Arizona University, Flagstaff, AZ, United States
Acoustic signals interact with the physical structure of porous media, are particularly sensitive to porosity and tortuosity, and can be used to measure physical properties in a non-destructive manner. Given the fragile nature of freshly fallen snow, non-contact, non-destructive characterization methods made possible via acoustic signals, are desirable. High frequency wave propagation methods can be used to determine in-situ, near-surface, micro-pore geometry parameters in snow using methods demonstrated on cohesive porous materials, including manufactured foams, porous metals, and sintered glass beads. High frequency (90 kHz), oblique-angle and near vertical reflection measurements were conducted on snow samples in a cold room to demonstrate the feasibility of acoustic characterization. A nonlinear least squares regression to the theoretical reflection response was used to derive the best-fitting values for the porosity and tortuosity. We compared the acoustically-derived snow physical parameters, including porosity and tortuosity, with values determined from X-ray micro-computed tomography (μCT) for different snow types. The μCT-measured and acoustically-derived methods demonstrated strong agreement for porosity with differences averaging 8% for all samples. Tortuosity values, however, had average differences of roughly 20% for all samples. The different error rates might be caused by the stronger dependence of the acoustic reflection on porosity than on tortuosity. For both parameters, the small grain snow and large grain firn samples had errors much larger than the fresh or 1 day samples. Fresh snow has the lowest reflection coefficients and demonstrates a steady decrease from <0.1 at normal incidence as the angle increases. Aging fresh snow for 1 day caused detectable changes in acoustic response, from slight decreases in porosity, and slight increases in tortuosity that occurred from sintering.
Introduction
In the 1950s, Maurice Biot published a comprehensive mathematical theory of wave propagation in porous materials (Biot, 1956). The theory predicted that two compressional waves and one shear wave would propagate in the bulk media. While the motion of all three waves are coupled to the motion of both the solid frame and the fluid in the pores, the first compressional wave (P1) traveled mainly in the solid frame, and the second (P2) mainly in the pore fluid. The first experimental measurements to confirm the existence of the two compressional waves were published in 1980 (Plona, 1980; Smeulders, 2005), and since then, many modifications have been made to the theory (e.g., Allard and Atalla, 2009). Perhaps the earliest application of Biot's theory to snow was Johnson (1982), followed by many other studies that have used this theory (Albert et al., 2009; Maysenhölder et al., 2012; Sidler, 2015) for predictions and analysis of snow measurements.
Properties of specific porous materials can be determined from reflected or transmitted acoustic waves using a classical inverse scattering mathematical approach (Horoshenkov, 2017). For example, the interaction of sound energy with the ground is an important effect in understanding sound propagation in a natural setting, and is governed in part by the porous properties of the surface materials (Attenborough et al., 2011). Previous experimental work to determine soil and ground conditions was typically performed in the audio frequency range of 100–10,000 Hz, with wavelengths of 3 m−3 cm (e.g., Nagy et al., 1990; Hickey and Sabatier, 1997; Iversen et al., 2001; Attenborough et al., 2011, 2014). Continuous waves are broadcast with a loudspeaker and recorded by microphones located a few meters away to determine the ground impedance as a function of frequency. Other ground properties that can be determined using this method are effective flow resistivity, permeability, porosity and shallow layer depth. Pulses produced by firearms or explosives can be used to extend the surface area sampled to tens or hundreds of meters (Cramond and Don, 1984; Don and Cramond, 1987; Albert M. R., et al., 2008).
Standard acoustic analysis methods frequently depend on a rigid-porous theoretical treatment of the ground to interpret the results and derive porous medium parameters from the acoustic measurements. In the case of air-filled porous materials, the theory is considerably simplified by assuming that the solid frame is rigid (that is, without motion), an approach used for many applications, including the ground effect on outdoor sound propagation (e.g., Albert, 2001; Allard and Atalla, 2009; Attenborough et al., 2011; Horoshenkov, 2017). These analyses do not include vibration and seismic wave effects.
In the ultrasonic range, pore waves become non-dispersive and simple relationships exist between reflection coefficients and porous material properties, including tortuosity and permeability (Fellah et al., 2003a,b; Allard and Atalla, 2009). Previous studies (e.g., Fellah et al., 2003a,b, 2006; Allard and Atalla, 2009) have applied high frequency, rigid porous theory to cohesive porous materials, including sintered glass beads, porous metals, and fused manufactured foams. Most of the measurements were conducted at normal incidence, but oblique high frequency (200 kHz) measurements have also been reported (Fellah et al., 2003b). In these studies, a physical scattering process is generally modeled first, which results in a synthetic response for initially assigned parameters. These parameters are then adjusted so that the modeled output agrees well with the observed measurement data. Two important parameters that are therefore generally evaluated and often appear in studies of sound propagation in porous materials (e.g., Fellah et al., 2003a) are porosity (a measure of volume of the pore space to the volume of the solid frame material) and tortuosity (the ratio of the shortest distance through the pore space to the straight line distance).
Fresh natural snow is a difficult material to characterize, even with special techniques (Shimizu, 1970), as any mechanical interaction is likely to damage the fragile pores and grain bonds. Because acoustic waves are sensitive to the microstructural properties of porous materials, they can be used to measure snow properties in a non-destructive manner. The acoustic properties of snow have been investigated in the past for a variety of applications, including understanding the attenuation of snow covered ground (Oura, 1952; Ishida, 1965; Yamada et al., 1974), understanding the acoustic response of snow to explosives used in avalanche mitigation (Gubler, 1977), predicting the stability of a natural snowpack (Sommerfeld and Gubler, 1983), monitoring the location of avalanches (Suriñach et al., 2001; Van Herwijnen and Schweizer, 2011; Lacroix et al., 2012), and estimating snow water equivalent (SWE) (Kinar and Pomeroy, 2009). Low frequency acoustic waves can be used to determine snow depth and effective flow resistivity (air permeability) over distances of tens of meters (Albert, 2001; Albert D. G., et al., 2008).
There have been limited ultrasonic or high frequency measurements reported on real geological materials, including snow. Air-coupled transmission measurements through thin (1–2 mm thick) sintered glass beads and sandstone samples at high frequencies (100–500 kHz) at normal incidence have been reported (Nagy et al., 1990). Past work on the acoustic response of snow in the ultrasonic range has employed contact sensors buried in snow samples and natural snowpacks using a range of waveguides and coupling materials (Kapil et al., 2014; Reiweger et al., 2015; Capelli et al., 2016) or on ice cores in the laboratory (Bennet, 1972; Kohnen and Gow, 1979; Herron et al., 1985).
An in situ method to determine the characteristics of extremely fragile porous materials would be very helpful for studies of fragile natural snow covers. For this purpose, we examine the potential of ultrasonic reflections and avoid the use of wave transmission techniques suitable for stronger materials (Umnova et al., 2005). A newly-designed test apparatus was used to conduct ultrasonic reflection measurements in a cold room to derive the porosity and tortuosity of various snow samples. The ultrasonic measurements were validated by comparison with standard laboratory techniques (that may disturb the sample), with parameters derived from X-ray micro-computed tomography (μCT) scanning, and with previous laboratory measurements reported in the literature. These measurements are intended to validate the ultrasonic method and to provide insight for the development of a new, non-destructive, and field-portable device for providing real-time in situ measurements of pore characteristics and properties of snow. Such a device will also allow for better modeling of outdoor sound propagation, provide an opportunity to apply the methods to other fragile real-Earth materials, including sand, soil, and leaf litter, and would be of great interest for a wide range of potential applications in cold environments for the analysis and characterization of numerous snow, firn, and ice physical properties. While acoustic transmission measurements can improve the determination of porous material properties, they were not employed here because of the desire to develop a non-destructive, surface method.
For clarity, we define the porosity of a porous material as the ratio of the pore volume to the total volume. Tortuosity is a parameter to describe the increased path length between two points within the pores of a porous material compared to the straight-line path in open air. However, two definitions of tortuosity appear in the acoustic literature. One is the average point to point path length through the porous medium divided by the straight line path (in open air) (Lpore/Lstraight). The other is the path length ratio squared (Lpore/Lstraight)2. We use the latter definition in this paper (e.g., Fellah et al., 2003b; Allard and Atalla, 2009), so care is needed in comparing values from different techniques or references. In the next sections, we describe the methods and equipment used to prepare the snow samples, perform μCT scanning, and conduct the acoustic measurements. A discussion and conclusions follows.
Methods
Snow Sample Preparation
Four distinct types of snow samples were prepared from (1) artificial snow, synthesized in a laboratory cold-room with small, relatively homogeneous rounded snow grains, designated SGA and SGB; (2) polar firn with large grains sieved so that grain sizes were between 0.85 and 1.2 mm, designated LGA and LGB; (3) freshly fallen natural snow with decomposing particles, very low density collected as fallen, designated FSA, FSB, FSC; and (4) the same freshly fallen snow, but allowed to age for 1 day, designated ASA and ASC. Samples sizes of 25 × 30 × 10 cm were prepared from each sample within an aluminum tray.
μCT Methods
Samples used for all μCT measurements were centrally-cut from the larger prepared snow samples noted above. Samples were trimmed into cylindrical shapes and were subsequently scanned using a Bruker SkyScan 1173 desktop μCT scanner. The SkyScan 1173 is equipped with a Hamamatsu 130/300 tungsten X-ray source that produces a fixed conical, polychromatic beam with a spot size of <5 μm and a flat panel sensor camera detector with 2240 × 2,240 pixels. We set the maximum accelerating voltage of the X-ray beam at 40 kV with a current of 200 μA. Samples were rotated 180° in 0.3° steps, with 4-frame averaged attenuation images captured at each step using a camera exposure of 310–360 msec. We used a 2 × 2 binning protocol to create X-ray radiographs 1120 × 1120 pixels. We completed reconstruction of the resulting radiographs using Bruker SkyScan's NRECON software that uses a modified Feldkamp cone-beam algorithm to produce a vertical stack of gray-scale cross-section images. As part of image post-processing, we performed ring artifact reduction, post-alignment correction, beam hardening correction, and a two-pixel Gaussian kernel smoothing to reduce noise. The resulting images had a spatial resolution of 15 μm per voxel, except for samples SGA and FSA that had 20-μm voxels, and a 16-bit gray-scale dynamic range. The final scanned volume was 1.7 cm in diameter × 1.7 cm high (2.2 cm × 2.2 cm for SGA and FSA).
We selected a cylindrical internal volume of interest (VOI) measuring 1.6 cm in diameter from each sample to eliminate edge effects and gaps. Using a histogram shape-based approach, we set critical thresholds to segment the air/void phase from the snow phase. We performed three-dimensional analysis on the resulting segmented images using Skycan's CTAn software to calculate the object total porosity and surface to volume ratio, which is inversely related to grain size. We then calculated the structure thickness, a metric used for measuring the size of an object (Lieb-Lappen et al., 2017). First, the medial axes of all structures of a given phase were identified. For each point along this axis, a sphere was fit such that it was both entirely inscribed within the phase of interest and encompassed the given starting point. The structure thickness was then calculated as the mean diameter of all spheres over the entire volume. Similarly, the structure separation calculated the average size of pores by performing the same analysis on the inverse phase (i.e., pore space).
The tortuosity of a porous medium can be defined geometrically as the tortuous path through a sample vs. a straight-line path, or in terms of the relative transport of some phenomenon (e.g., electrical current, heat transfer, or mass transport) through the medium vs. open air. 2D and 3D tortuosity are often determined through subjective estimation or empirically, although means to quantify tortuosity have been more recently developed. In this work, the air-phase tortuosity of the samples was calculated from the μCT data using TauFactor (Cooper et al., 2016), an open source, MATLAB-based application. The application determines tortuosity quantitatively from the modeled reduction in steady state diffusive transport caused by the geometry of heterogeneous media, as defined by the μCT image data. The tortuosity factor, τ is defined by where ε is the volume fraction of the conductive phase, D is the diffusivity of the conductive phase in open air, and Deff is the diffusivity through the porous volume. The TauFactor application simulates diffusion through the μCT reconstructed image using the voxels from the image as the mesh elements in order to avoid errors produced by smoothing or imposing other geometric distortions that can be caused by meshing (Cooper et al., 2016). Tortuosity in × (horizontal), y (horizontal) and z (vertical) directions was calculated as tortuosity is not typically isotropic; the reported value for tortuosity was the average of these directional tortuosities. On average, the directional tortuosities calculated were within 2% (an average of 1.7% for the entire sample set) of one another because these particular samples were mostly isotropic, composed of new snow and artificial snow with rounded grains.
Ultrasonic Acoustic Theory and Methods
The measurements were analyzed using a high-frequency, rigid-frame simplification of Biot's acoustic propagation model (Fellah et al., 2003a), in which the acoustic P2 wave traveling in the pore space is decoupled from the wave traveling in the skeleton frame of the porous material (i.e., seismic motion is ignored). The simplified theory allows the acoustic properties of the snow samples to be determined in a relatively straightforward way when compared to the full Biot's theory, a physical model that would require many more material properties to be known. Previous laboratory (Buser, 1986) and field measurements (Albert, 2001) have shown that a simplified rigid-porous model is sufficient to accurately characterize airborne acoustic waves interacting with snow.
We have adapted the experimental methods of Fellah et al. (2003a) to determine the porosity and tortuosity of cohesive porous materials from reflection measurements at two (or more) oblique angles of incidence. At low frequencies, the propagation of the P2 (pore) wave in air is highly dependent on frequency, but becomes constant above a certain approximate critical frequency
where ϕ is the porosity, kperm the permeability of the snow [m2], and v is the kinematic viscosity of cold −8°C air (1.23 × 10⁻⁵m2/s) with a speed of sound c = 326 m/s. To calculate a rough example we assume that ϕ = 0.45, and the acoustic tortuosity . Snow permeability is quite variable, so we use three values typical of temperate snow covers, m2. These parameters were used to calculate the approximate behavior of a P2 pore wave and Figure 1 shows the resulting P2 wave velocity as a function of frequency. The velocity becomes constant above about 10 kHz, and the theoretical asymptotic wave speed m/s. We use a frequency of 90 kHz for our measurements, well into the frequency band where the acoustic behavior of the P2 wave (and reflections from the porous surface) become constant and independent of frequency.
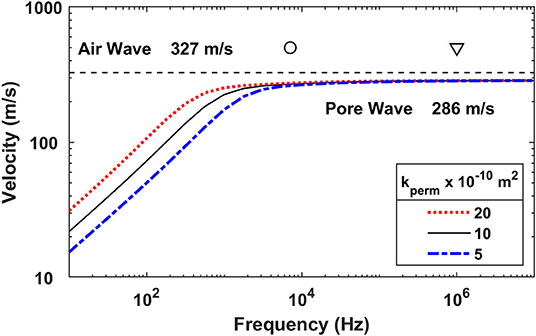
Figure 1. Theoretical behavior of the Biot pore wave, showing the lack of frequency dependence above a critical frequency given by Equation (1), and indicated by the circle at 754 Hz. The calculations assumed a porosity of 0.45 and a tortuosity of 1.30. The three lines show the calculated velocity of the pore wave for different values of the snow permeability (5 × 10⁻¹⁰ m2, 10 × 10−10 m2, and 20 × 10−10 m2). Our measurements were conducted at 90 kHz (indicated by the triangle), well above the frequency dependent band for any snow type.
For these very high frequency ultrasonic waves, Fellah et al. (2003a,b) have shown that the porosity and tortuosity can be calculated from a series of oblique reflection measurements, i = 1…n, where ri(Θ) is the reflection coefficient, θ is the angle of incidence, ϕ is the porosity, and α∞ is the tortuosity.
At normal incidence, the reflection coefficient Equation (2) reduces to (1 – B)/(1 + B) where B = ϕ/. The above equation can be rearranged to isolate the porosity ϕ:
If two reflections at two different angles (θi and θj) are measured, Equation (3) for reflection 1(ri) can be divided by Equation (3) for reflection 2 (rj) and the result solved for the tortuosity α∞
The tortuosity can be obtained from Equations (4) and (5) since they depend only on the measured angles and reflection amplitudes. The tortuosity value can then be substituted into Equation (3) to obtain the porosity. This is the method used by Fellah et al. (2003a,b) to deduce the porous parameters from two reflection coefficients at two oblique angles.
We used a more robust data reduction method to obtain the acoustic parameters. Instead of substituting pairs of measured reflection coefficients into Equations (2–5) to obtain individual parameter estimates, we used a non-linear, least squares method to directly fit Equation (2) to all of the measured reflection coefficients for a particular snow sample. The numerical method constrained the porosity in the range from 0 to 1, and the tortuosity to the region ≥1. This method produced parameter estimates along with confidence intervals for the parameters based on the goodness-of-fit.
Figure 2 illustrates the theoretical reflection coefficient calculated using Equation (2) for parameter values of porosity ϕ = 0.80 and tortuosity α = 1.20. This calculation and others show that variations in porosity have a larger effect on the normal reflection coefficient than similar variations in the tortuosity. The tortuosity lines also “cross-over” at some point as the incident angle increases; for this example at an angle of about 50°. The theory also predicts that at normal incidence, a decrease in porosity or increase in tortuosity results in a higher reflection coefficient.
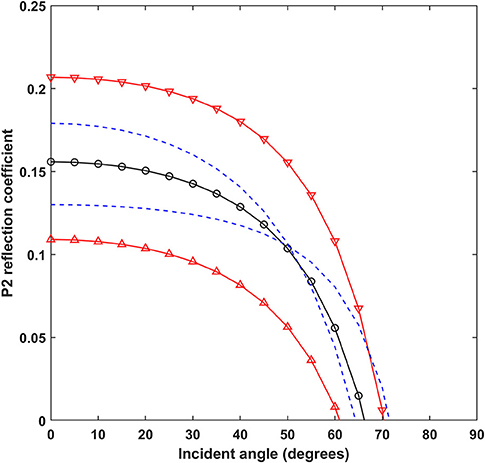
Figure 2. Theoretical reflection coefficient calculated using Equation (2). The black line with circles is the reflection coefficient calculated as a function of angle for parameter values of porosity ϕ = 0.80 and tortuosity α = 1.20. Red solid lines with triangles pointing up/down have porosity values increased/decreased by 10% (0.80, 0.72). Blue dashed lines have modified tortuosity values of (1.32, 1.08).
Two non-contact (air coupled) Ultran Model NGC100-D25 transducers were used, one as a source and the other as a receiver. These transducers are designed to work in air, and have a diameter of 25 mm and a measured resonant frequency of 90 kHz. An Agilent Model 33120A function generator was programmed to continuously output three 90 kHz square wave pulses at a rate of 1 kHz and a peak-to-peak amplitude of 10 volts to drive the source transducer. The function generator also sent a synchronized pulse to the digital oscilloscope, a Tektronix Model DPO 2014, that recorded the signal detected by the receiver transducer after reflection from the snow surface. The received signals were on the order of tens of millivolts, so 512 repeated ultrasonic pulses were summed by the oscilloscope to improve the signal quality. The digital waveforms and peak-to-peak signals were saved for later analysis.
Following Pialucha and Cawley (1994), a mechanical rig was constructed to position the two ultrasonic transducers at various angles (measured with a Wixey digital angle gauge) as shown in Figure 3. The distance from the transducer to the snow surface was fixed for each sample measurement at 20 cm for each ray of the reflection path. Before the snow samples were measured, a direct measurement was conducted through the air to align the transducers and to determine the direct wave amplitude. We found that although signal could be detected off-axis laterally, the best alignment of the transducers was within a small deviation on the order of 0.5 cm or smaller. Reflection measurements were made in a cold room with a temperature of −8°C at 15 specific angles from 7.5° (the smallest measurable angle due to geometric limitations with the experimental set-up—namely the thickness of the transducers themselves), nominally at 5° increments to 75°. For each angle, the total peak voltage of the transmitted and reflected waveform were recorded. A representative series of reflected waveforms for angles of 7.5°-60° is shown in Figure 4 for a fresh snow sample FSC. The reflection coefficients are defined as the reflected signal amplitude divided by the direct horizontal path signal amplitude. The porosities and tortuosities were calculated from the reflected wave peak-to-peak voltage values measured at oblique incidences using the non-linear regression of Equation (2) as discussed above.
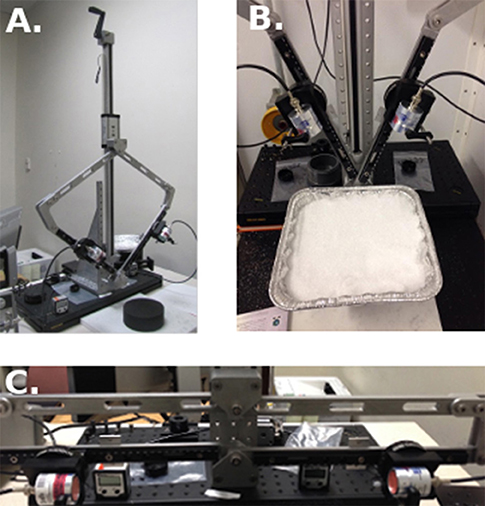
Figure 3. (A) Ultrasonic transducer positioning rig following the methods of Pialucha and Cawley (1994). (B) Photo of ultrasonic transducer positioning rig being used to record reflections in a cold room. (C) Ultrasonic transducer positioning rig with transducers in horizontal position.
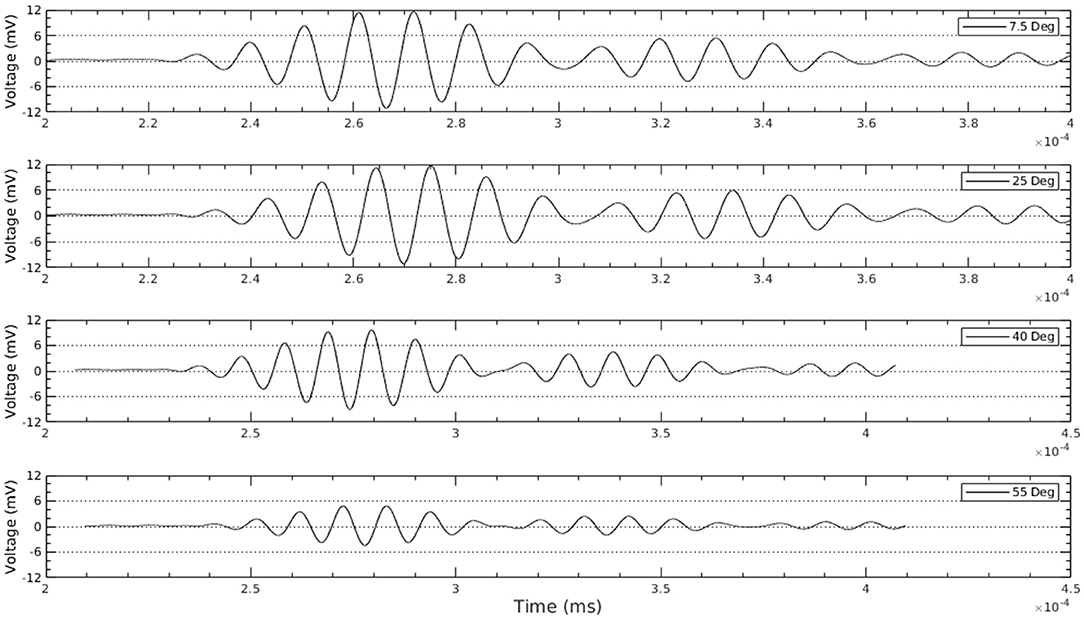
Figure 4. Representative series of reflected acoustic waveforms ranging from angles 7.5° to 60°. The series shown is for fresh snow sample FSC.
Results and Discussion
μCT Characterization and Determination of Snow Type
Three-dimensional (3D) binary (black and white) reconstructions of representative examples for each of the four general classes of snow are shown in Figure 5 in order of age of snow (fresh snow, snow aged 1 day, small grained artificial snow and large grained firn). The fresh and 1-day-old snow samples had needle-like grains, while the other samples were much more rounded and compact.
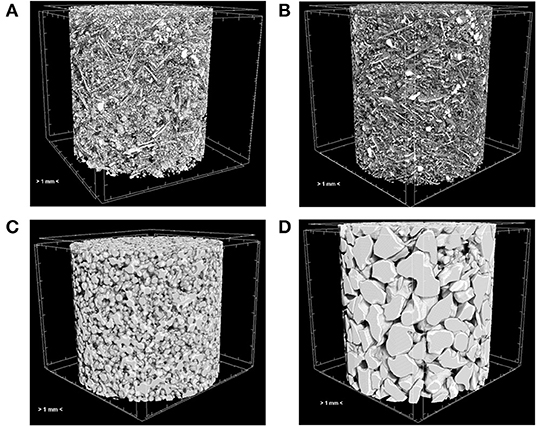
Figure 5. 3D binary reconstructions of μCT data for (A) fresh snow (FSB), (B) snow aged 1 day (ASA), (C) small grained artificial snow (SGB), and (D) large grained firn (LGA). Samples (A,B) are 170 mm in height and diameter; samples (C,D) are 220 mm.
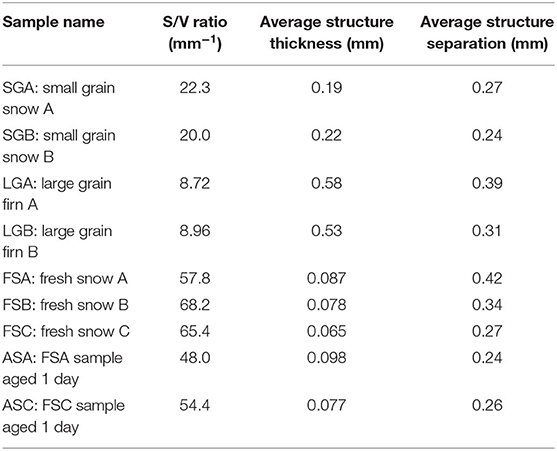
We completed a 3D morphometric analysis on the binary images for all samples. The surface to volume (S/V) ratio, average structure thickness, and average structure separation are recorded in Table 1. As would be expected, the large grain firn had the smallest S/V ratio with an average of 8.8 mm−1 ± 0.2 mm−1, while fresh snow had the highest S/V ratio with an average of 63.8 mm−1 ± 5.4 mm−1. Aging of fresh snow over 1 day resulted in reduced S/V ratios by roughly 17%.
The software calculates structure thickness by first creating a skeletonization of the binarized snow phase to identify the medial axes of all structures. As described above, at each point along the axes, it then fits the maximal sphere fitting entirely within the object and records the diameter of the sphere. This results in a distribution of thicknesses shown in Figure 6 with an average value for each sample recorded in Table 1. We note that the thickness distributions fall into three distinct classes: (1) Very thin “needles” with most structures <0.1 mm thick for fresh snow (0.08 mm ± 0.01 mm) and snow aged 1 day (0.09 mm ± 0.01 mm), (2) structures having Gaussian distribution of thicknesses centered roughly around 0.2 mm for small grain snow (0.21 mm ± 0.02 mm), and 3) large structures with a wide range of thicknesses with a peak roughly around 0.6 mm for large grain firn (0.56 mm ± 0.04 mm).
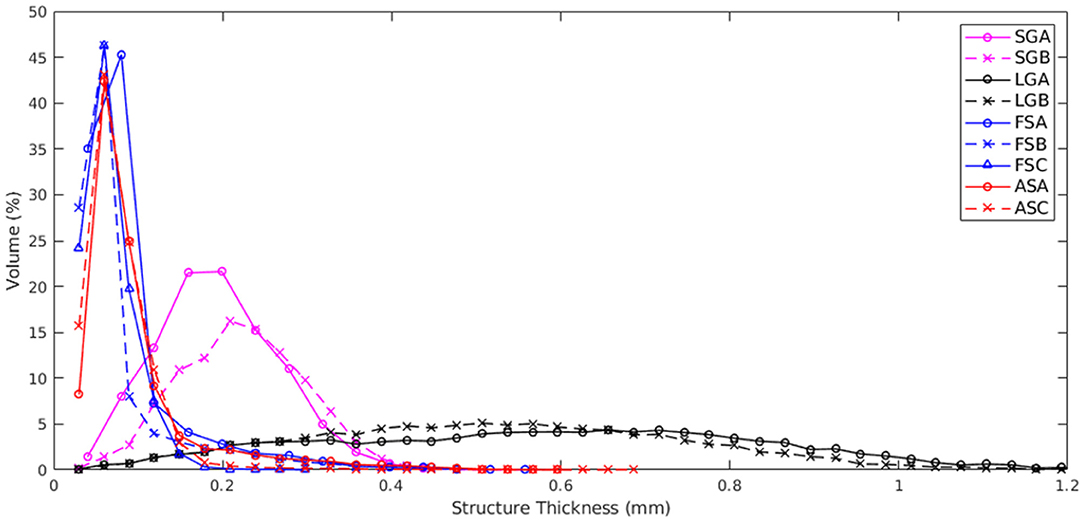
Figure 6. Structure thickness distributions for all samples. We note that samples fall into three classes: (1) fresh snow and snow aged 1 day, (2) small grained snow, and (3) large grain firn.
A similar structure separation was calculated for each sample by running the same analysis but for the air/void phase. The distribution of separations is shown in Figure 7 and the average values for each sample are recorded in Table 1. We observe that there appears to be distinct classes separating the snow types again, but they are different from the structure thicknesses. The small grain snow (0. 26 mm ± 0.01 mm) generally has the same separation distributions as the snow aged 1 day (0.25 mm ± 0.01 mm), while the large grain snow (0.35 mm ± 0.06 mm) generally has the same separation distributions as the fresh snow (0.34 mm ± 0.08 mm) with FSC being an outlier.
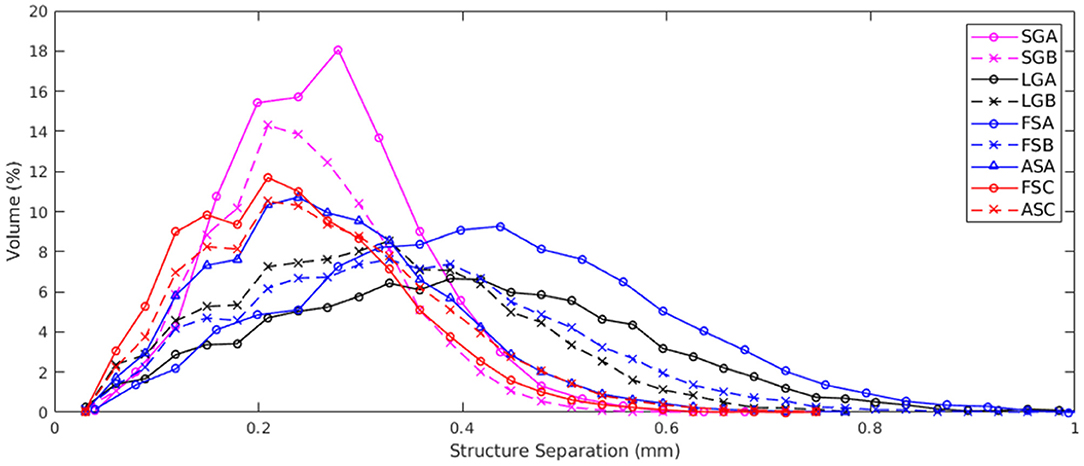
Figure 7. Structure separation distributions for all samples. We note that samples generally fall into two classes: (1) fresh snow and large grain firn and (2) small grained snow and snow aged 1 day.
Ultrasonic Wave Determination of Porosity and Tortuosity
The angular dependence of the reflection coefficient according to snow type is shown in Figure 8. The shape of the curves roughly falls into the four classes of snow types. Large grain snow has the highest reflection coefficients (>0.20) for low angles and falls dramatically for oblique angles >45°. Small grain snow actually shows an increase in reflection angle up to roughly 50° before plummeting to zero around 70°. Fresh snow has the lowest reflection coefficients and demonstrates a steady decrease from <0.1 at normal incidence as the angle increases. Aging the fresh snow 1 day significantly increases the reflection coefficient for all angles. Using the points from these curves, we determined the porosity and tortuosity values of the samples by fitting Equation (2) to the measurements as discussed above. Figure 9 shows the results for the fresh snow sample FSC2. The smooth theoretical line fits the measurements reasonably well, and the method also provides confidence intervals for the fitting parameters. In this case the derived porosity is 0.89 ± 0.02 and tortuosity 1.23 ± 0.05. Acoustically-derived parameter values for the other samples are listed in Table 2. The confidence width on the mean porosity for all the samples is 2% (with the worst error 7% for LGB) and for the tortuosity 4% with 11% maximum error bounds. The μCT-measured porosity and tortuosity values are also listed in Table 2. In addition, the square root of the μCT tortuosity is also given; it is this value that is compared to the acoustic tortuosity. The square root is needed because the μCT is based on diffusion, where the temperature disturbance travels a distance proportional to the square root of time, rather than directly proportional to time as for acoustic propagation. This difference in time dependence leads to μCT tortuosity values that are squared compared to acoustic values.
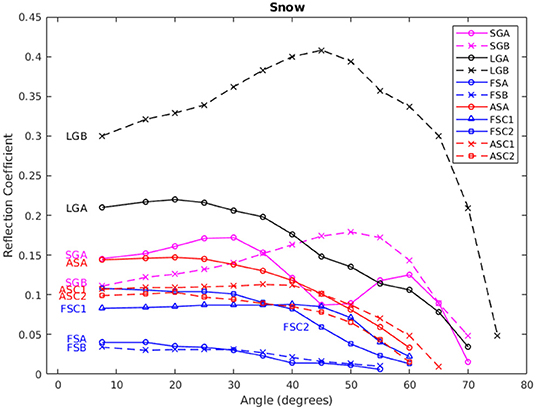
Figure 8. Measured ultrasonic reflection coefficients as a function of incident angle for a variety of snow samples.
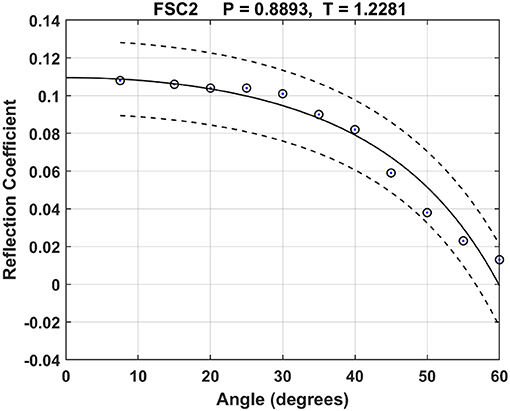
Figure 9. Results of a nonlinear least squares fit of theoretical Equation (2) to the FSC2 snow sample reflection data. The best fit (solid line) is obtained for a porosity of 0.89 and a tortuosity of 1.23. Confidence intervals are shown as dashed lines.
Porosity and tortuosity values calculated from the acoustic measurements are shown in Figure 10. The μCT-measured porosity and tortuosity values are plotted shown as red triangles and the acoustic estimates as circles with the confidence interval indicated for each snow sample. Insets for each graph show a scatter plot of μCT-measured values vs. acoustically-derived values, along with the 1:1 line. The two techniques, μCT-measured and acoustically-derived, demonstrated strong agreement for porosity with differences averaging 8% for all samples. Tortuosity values, however, had average differences of roughly 20% for all samples. For both parameters, the small grain snow and large grain firn samples had errors much larger than the fresh or 1 day samples. For the LG and SG samples, the acoustic porosity was higher and the acoustic tortuosity lower than the μCT results. The techniques had better agreement for fresh snow and snow aged 1 day with differences below 5% for porosity, but as much as 17% for tortuosity. This suggests that both techniques can detect which samples have more tortuous paths, but the accuracy of the methods is moderate. Bonfiglio and Pompoli (2013) reported similar relative tortuosity errors of 13–41% for measurements on porous foam and other materials. The porosity and tortuosity values measured with acoustics and μCT are summarized in Table 2.
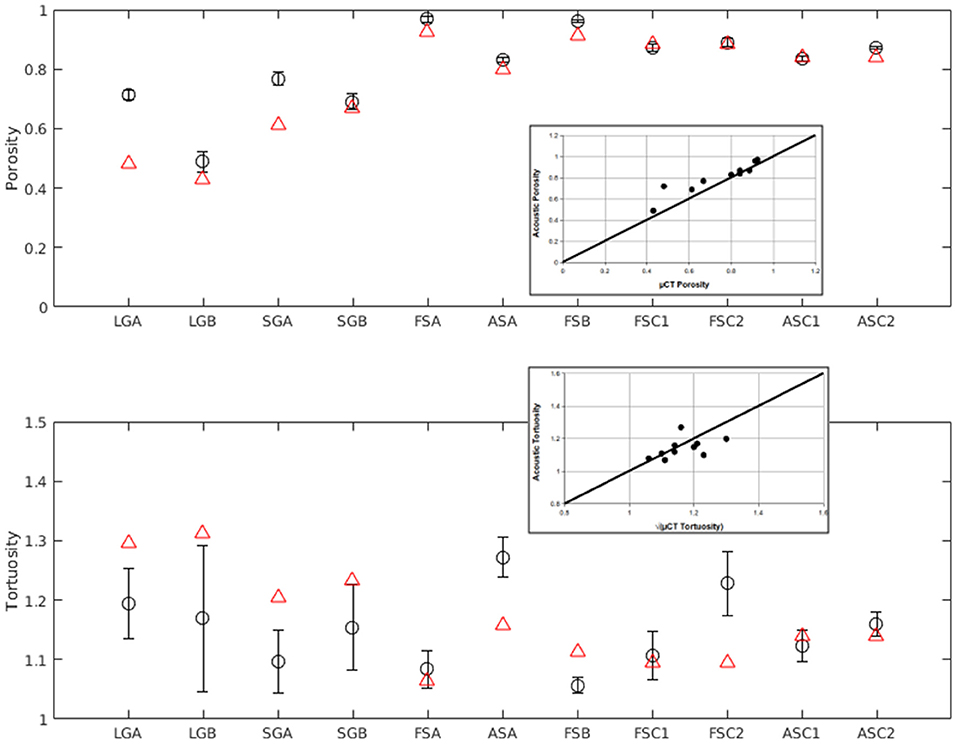
Figure 10. Comparison of porosity and tortuosity values calculated from the acoustic measurements relative to μCT-measured values. For each graph, acoustic estimates are shown as black circles with the confidence interval indicated for each snow sample. μCT-measured values are plotted as red triangles. Insets for each graph show a scatter plot of μCT-measured values vs. acoustically-derived values, along with the 1:1 line.
Many of the field experiments on snow reported in the literature were conducted at low frequencies; however in recent years a few higher frequency laboratory measurements have been published. These studies were often centered on determining the absorption coefficient of various snow types, and so are not easily compared to our present work. Capelli et al. (2016) show in their Figure 1 pore wave velocity measurements in the literature as a function of snow density. However, unless the measurements were made at frequencies above about 10 kHz (depending on snow properties), the pore wave velocity has a very strong frequency dependence as shown in our Figure 1. At high frequencies, the pore wave velocity will be given by as mentioned earlier.
Maysenhölder et al. (2012) measured and modeled the absorption coefficient of snow using measurements in an impedance tube over a frequency band of 125–1,600 Hz, but this band is likely within the frequency-dependent regime as shown in our Figure 1, so it is difficult to compare with the measurements reported here. For high porosity snow (ϕ > 0.8), they report tortuosities of 1.36–1.56 that are higher than our determinations of 1.07–1.27, and their pore wave speeds would be lower. Datt et al. (2016) also reported on impedance tube measurements over a higher frequency range from 63 to 6,300 Hz. Their samples were generally lower porosity (with one exception) but most of their tortuosities were near 1.0, with two samples at 1.2 and 1.7. Capelli et al. (2016) did make measurements of attenuation at high frequencies, using a pencil-lead-fracture as an impulsive acoustic source. Their measurements were in the 10–35 kHz band, but they reported only on the attenuation behavior of these waves.
All of these studies were done in containers or with contact transducers, while the method reported here used non-contact transducers and propagation, leaving the samples completely undisturbed. We have only found one other paper (Gudra and Najwer, 2011) using a similar approach, and also at high frequencies. These researchers made vertical reflection measurements on snow samples at 40 kHz, recording the reflection from the snow surface and from the bottom of the container. They report reflection values of 0.2–0.5 for snow porosities from 0.89 to 0.5. Their values are higher than our measurements of 0.11 and 0.3 at the same endpoints, but tortuosity also plays a role [see the equation immediately after Equation (2)] and could be responsible for some of the differences.
Conclusion
The angular dependence of the reflection coefficient for various distinct snow types was shown to have a large, measurable signal that varied considerably with type of snow and porosity. A regression procedure on the set of reflection coefficients at all of the oblique angles of incidence produced porosity and tortuosity values with confidence intervals. The measurements showed that aging snow (sintering) 1 day causes detectable changes in acoustic response, slight decrease in porosity, and slight increase in tortuosity.
Porosity values determined from acoustic measurements were within 5% of porosity values determined from μCT data, overall. Tortuosities determined from acoustic waveforms shows the same trend as tortuosities calculated based on μCT data, but absolute values different by 8–30%, with best agreement found in fresh snow. Normal reflection has stronger dependence on porosity than on tortuosity.
These measurements show the potential utility of ultrasonic measurements as a method to determine fragile snow cover properties in situ. To do so, the acoustic positioning rig could be simplified and constructed as a metal half-arc capable of holding two transducers. Indentations could be made along the arc to “snap” the transducers into position at a few predetermined angles for measurement. A provision to make a vertical reflection should also be included, and a separate measurement at normal incidence with a metal plate on the ground could be used to determine the source transducer output. We were able to obtain reflection measurements from highly porous snow surfaces using only a 10 V PP output from a standard function generator, in contrast to most other studies that used hundreds of volts to excite the ultrasonic transducer, something we are too cowardly to try outdoors in wet snow!
Data Availability Statement
The raw data supporting the conclusions of this article will be made available by the authors without undue reservation, to any qualified researcher upon request.
Author Contributions
DA designed the project and contributed to the acoustic analysis. ZC prepared snow samples and wrote the introduction. JF conducted the ultrasonic acoustic experiments, prepared corresponding graphs, and wrote corresponding sections. RL conducted the μCT measurements, prepared corresponding graphs, wrote corresponding sections, and compiled all components of project. All authors edited and gave feedback on the manuscript.
Funding
This research was supported by the ERDC basic research program. DA and RL were supported in part by an appointment to the Environmental Management Participation Program at the U. S. Army Engineer Research and Development Center–Cold Regions Research and Engineering Laboratory (ERDC-CRREL) administered by the Oak Ridge Institute for Science and Education through an interagency agreement between the U. S. Department of Energy and ERDC. Permission to publish was granted by the Director of the Cold Region Research and Engineering Laboratory.
Conflict of Interest
The authors declare that the research was conducted in the absence of any commercial or financial relationships that could be construed as a potential conflict of interest.
Acknowledgments
The authors thank the two reviewers for many helpful comments which substantially improved the manuscript.
References
Albert, D. G. (2001). Acoustic waveform inversion with application to seasonal snow covers. J. Acoust. Soc. Am. 109, 91–101. doi: 10.1121/1.1328793
Albert, D. G., Decato, S. N., and Carbee, D. L. (2008). Snow cover effects on acoustic sensors. Cold Reg. Sci. Technol. 52, 132–145. doi: 10.1016/j.coldregions.2007.05.009
Albert, D. G., Decato, S. N., and Perron, F. E. (2009). “Experimental measurements of the Biot slow wave in natural snow covers,” Paper Presented at Proceedings of the Fourth Biot Conference on Poromechanics (New York, NY).
Albert, M. R., Albert, D. G., Perron, F. E., and Ramos, I. (2008). Acoustic Determination of Near-Surface Soil Properties. US Army Cold Regions Research and Engineering Laboratory. Techincal Report.
Allard, J. F., and Atalla, N. (2009). Propagation of Sound in Porous Media: Modelling Sound Absorbing Materials 2e. Chichester: John Wiley & Sons.
Attenborough, K., Bashir, I., and Taherzadeh, S. (2011). Outdoor ground impedance models. J. Acoust. Soc. Am. 129, 2806–2819. doi: 10.1121/1.3569740
Attenborough, K., Li, K. M., and Horoshenkov, K. (2014). Predicting Outdoor Sound. New York, NY: Taylor and Francis.
Bennet, H. F. (1972). Measurments of Ultrasonic Wave Velocities in Ice Cores From Greenland and Antarctica. US Army cold regions research and engineering laboratory. Research Report 237.
Biot, M. (1956). The theory of propagation of elastic waves in a fluid-saturated porous solid, I. Low-frequency range, II. Higher frequency range. J. Acoust. Soc. Am. 28, 168–191. doi: 10.1121/1.1908239
Bonfiglio, P., and Pompoli, F. (2013). Inversion problems for determining physicial parameters of porous materials: overview and comparison between different methods. Acta Acust. United Ac., 99, 341–351. doi: 10.3813/AAA.918616
Buser, O. (1986). A rigid frame model of porous media for the acoustic impedance of snow. J. Sound Vib. 111, 71–92. doi: 10.1016/S0022-460X(86)81424-9
Capelli, A., Kapil, J. C., Reiweger, I., Or, D., and Schweizer, J. (2016). Speed and attenuation of acoustic waves in snow: laboratory experiments and modeling with Biot's theory. Cold Reg. Sci. Technol. 125, 1–11. doi: 10.1016/j.coldregions.2016.01.004
Cooper, S. J., Bertei, A., Shearing, P. R., Kilner, J. A., and Brandon, N. P. (2016). TauFactor: an open-source application for calculating tortuosity factors from tomographic data. SoftwareX. 5, 203–210. doi: 10.1016/j.softx.2016.09.002
Cramond, A. J., and Don, C. G. (1984). Reflection of impulses as a method of determining acoustic impedance. J. Acoust. Soc. Am. 75, 382–389. doi: 10.1121/1.390482
Datt, P., Kapil, J. C., Kumar, A., and Srivastava, P. K. (2016). Experimental measurements of acoustical properties of snow and inverse characterization of its geometrical parameters. Appl. Acoust. 101, 15–23. doi: 10.1016/j.apacoust.2015.07.015
Don, C. G., and Cramond, A. J. (1987). Impulse propagation in a neutral atmosphere. J. Acoust. Soc. Am. 81, 1341–1349. doi: 10.1121/1.394540
Fellah, Z. E. A., Berger, S., Lauriks, W., Depollier, C., Aristegui, C., and Chapelon, J. (2003a). Measuring the porosity and the tortuosity of porous materials via reflected waves at oblique incidence. J. Acoust. Soc. Am. 113, 2424–2433. doi: 10.1121/1.1567275
Fellah, Z. E. A., Berger, S., Lauriks, W., Depollier, C., Trompette, P., and Chapelon, J. (2003b). Ultrasonic measurement of the porosity and tortuosity of air-saturated random packings of beads. J. Appl. Phys. 93, 9352–9359. doi: 10.1063/1.1572191
Fellah, Z. E. A., Fellah, M., Sebaa, N., Lauriks, W., and Depollier, C. (2006). Measuring flow resistivity of porous materials at low frequencies range via acoustic transmitted waves. J. Acoust. Soc. Am. 119, 1926–1928. doi: 10.1121/1.2179749
Gubler, H. (1977). Artificial release of avalanches by explosives. J. Glaciol. 19, 419–429. doi: 10.3189/S0022143000029440
Gudra, T., and Najwer, L. (2011). Ultrasonic investigation of snow and ice parameters. Acta Phys. Pol. A 120, 625–629. doi: 10.12693/APhysPolA.120.625
Herron, S. L., Langway, C. C., and Brugger, K. A. (1985). Ultrasonic velocities and crystalline anisotropy in the ice core from Dye 3, Greenland. Greenland Ice Core Geophys. Geochem. Environ. 33, 23–31. doi: 10.1029/GM033p0023
Hickey, C. J., and Sabatier, J. M. (1997). Measurements of two types of dilatational waves in an air-filled unconsolidated sand. J. Acoust. Soc. Am. 102, 128–136. doi: 10.1121/1.419770
Horoshenkov, K. V. (2017). A review of acoustical methods for porous material characterization. Int. J. Acoust. Vib. 22, 92–103. doi: 10.20855/ijav.2017.22.1455
Iversen, B. V., Schjonning, P., Poulsen, T. G., and Moldrup, P. (2001). In-situ, on-site and laboratory measurements of soil air permeability: boundary conditions and measurement scale. Soil Sci. 166, 97–106. doi: 10.1097/00010694-200102000-00003
Johnson, J. B. (1982). On the application of biot's theory to acoustic wave propagation in snow. Cold Reg. Sci. Technol. 6, 49–60. doi: 10.1016/0165-232X(82)90044-1
Kapil, J., Datt, P., Kumar, A., Singh, K., Kumar, V., and Satyawali, P. (2014). Multi-sensor couplers and waveguides for efficient detection of acoustic emission behavior of snow. Cold Reg. Sci. Technol. 101, 1–13. doi: 10.1016/j.coldregions.2014.01.003
Kinar, N. J., and Pomeroy, J. W. (2009). Automated determination of snow water equivalent by acoustic reflectometry. IEEE T. Geosci. Remote. 47, 3161–3167. doi: 10.1109/TGRS.2009.2019730
Kohnen, H., and Gow, A. J. (1979). Ultrasonic velocity investigations of crystal anisotropy in deep ice cores from Antarctica. J. Geophys. Res. 84, 4865–4874. doi: 10.1029/JC084iC08p04865
Lacroix, P., Grasso, J. R., Roulle, J., Giraud, G., Goetz, D., Morin, S., et al. (2012). Monitoring of snow avalanches using a seismic array: location, speed estimation, and relationships to meteorological variables. J. Geophys. Res. Earth. 117:F01034. doi: 10.1029/2011JF002106
Lieb-Lappen, R. M., Golden, E. J., and Obbard, R. W. (2017). Metrics for interpreting the microstructure of sea ice using X-ray micro-computed tomography. Cold Reg. Sci. Technol. 138, 24–35. doi: 10.1016/j.coldregions.2017.03.001
Maysenhölder, W., Heggli, M., Zhou, X., Zhang, T., Frei, E., and Schneebeli, M. (2012). Microstructure and sound absorption of snow. Cold Reg. Sci. Technol. 83, 3–12. doi: 10.1016/j.coldregions.2012.05.001
Nagy, P. B., Adler, L., and Bonner, B. P. (1990). Slow wave propagation in air-filled porous materials and natural rocks. Appl. Phys. Lett. 56, 2504–2506. doi: 10.1063/1.102872
Pialucha, T., and Cawley, P. (1994). The detection of thin embedded layers using normal incidence ultrasound. Ultrasonics 32, 431–440. doi: 10.1016/0041-624X(94)90062-0
Plona, T. J. (1980). Observation of a second bulk compressional wave in a porous medium at ultrasonic frequencies. Appl. Phys. Lett. 36, 259–261. doi: 10.1063/1.91445
Reiweger, I., Mayer, K., Steiner, K., Dual, J., and Schweizer, J. (2015). Measuring and localizing acoustic emission events in snow prior to fracture. Cold Reg. Sci. Technol. 110, 160–169. doi: 10.1016/j.coldregions.2014.12.002
Shimizu, H. (1970). Air permeability of deposited snow. Contrib. Inst. Low Temp. Sci. Ser. A 22, 1–32.
Sidler, R. (2015). A porosity-based Biot model for acoustic waves in snow. J. Glaciol. 61, 789–798. doi: 10.3189/2015JoG15J040
Smeulders, D. M. (2005). Experimental evidence for slow compressional waves. J. Eng. Mech. 131, 908–917. doi: 10.1061/(ASCE)0733-9399(2005)131:9(908)
Sommerfeld, R., and Gubler, H. (1983). Snow avalanches and acoustic emissions. Ann. Glaciol. 4, 271–276. doi: 10.3189/S0260305500005590
Suriñach, E., Furdada, G., Sabot, F., Biesca, B., and Vilaplana, J. (2001). On the characterization of seismic signals generated by snow avalanches for monitoring purposes. Ann. Glaciol. 32, 268–274. doi: 10.3189/172756401781819634
Umnova, O., Attenborough, K., Shin, H. C., and Cummings, A. (2005). Deduction of tortuosity and porosity from acoustic reflection and transmission measurements on thick samples of rigid-porous materials. Appl. Acoust. 66, 607–624. doi: 10.1016/j.apacoust.2004.02.005
Van Herwijnen, A., and Schweizer, J. (2011). Monitoring avalanche activity using a seismic sensor. Cold Reg. Sci. Technol. 69, 165–176. doi: 10.1016/j.coldregions.2011.06.008
Keywords: snow, microstructure, ultrasonic acoustic waves, micro-computed tomography, porosity, tortuosity
Citation: Lieblappen R, Fegyveresi JM, Courville Z and Albert DG (2020) Using Ultrasonic Waves to Determine the Microstructure of Snow. Front. Earth Sci. 8:34. doi: 10.3389/feart.2020.00034
Received: 29 July 2019; Accepted: 31 January 2020;
Published: 19 February 2020.
Edited by:
Pascal Hagenmuller, UMR3589 Centre National de Recherches Météorologiques (CNRM), FranceReviewed by:
Henning Löwe, WSL Institute for Snow and Avalanche Research SLF, SwitzerlandAmaelle Adeline Landais, Centre National de la Recherche Scientifique (CNRS), France
Copyright © 2020 Lieblappen, Fegyveresi, Courville and Albert. This is an open-access article distributed under the terms of the Creative Commons Attribution License (CC BY). The use, distribution or reproduction in other forums is permitted, provided the original author(s) and the copyright owner(s) are credited and that the original publication in this journal is cited, in accordance with accepted academic practice. No use, distribution or reproduction is permitted which does not comply with these terms.
*Correspondence: Ross Lieblappen, cm9zcy5saWVibGFwcGVuQHZ0Yy5lZHU=
 Ross Lieblappen
 John M. Fegyveresi
 Zoe Courville
 Donald G. Albert