- 1Himalayan Cryosphere, Climate and Disaster Research Center (HiCCDRC), Department of Environmental Science and Engineering, School of Science, Kathmandu University, Dhulikhel, Nepal
- 2Department of Earth and Atmospheric Sciences, The City College of New York, The City University of New York, New York, NY, United States
- 3Argonne National Laboratory, Lemont, IL, United States
- 4Earth and Environmental Sciences Program, The Graduate Center, The City University of New York, New York, NY, United States
An assessment of the water supply and its seasonal and annual changes over the century in the High Mountain Asia (HMA) region is of increasing interest due to its potential impact on one-sixth of the global population. In order to understand the changing hydrology and snow and ice melt, we used remotely sensed Advanced Scatterometer (ASCAT) observations of glacier melt (GM) and a distributed and gridded Glacio-hydrological Degree-day Model (GDM) in three river basins: Tamor, Trishuli and Marsyangdi. The GDM-estimated contribution of snowmelt, icemelt, rainfall and baseflow in river flows is found to be most accurate in the Trishuli River basin, with Nash-Sutcliffe efficiency (NSE) between the estimated and observed discharges of 0.81 and volume differences of −0.5%, and reasonably accurate in the Tamor River basin, with NSE of 0.69 and volume difference of −7.51%. Similarly, NSE of 0.81 and volume difference of 4.64% in Marsyangdi River basin. We find strong similarities in the timing of glacier melting using the GDM and from observations from the ASCAT GM, determining the seasonal start of glacier melting to within 6 days on average. In all basins ASCAT GM observes melting at higher elevations relative to GDM, average of 5,328 m a.s.l. Systematic differences in glacier melting area determined by modeling and satellite observations indicate ASCAT may have suboptimal resolution, view geometry and/or polarimetry for delineating glacier melting at the process-scale in complex topography, especially in the ablation zone. This is the first step in examining the remote sensing products that could potentially be incorporated into hydrologic models to increase the accuracy of the hydrologic flow as well as the ability to estimate river discharge in other basins with limited data.
Introduction
An assessment of the water resources and the seasonal and annual changes over the century in the High Mountain Asia (HMA) region is of increasing interest to scientists of multiple disciplines. The water supply in the upper reaches of the HMA is particularly sensitive to climate change (Wagnon et al., 2007; Immerzeel et al., 2010) and it share high percentage contribution from snow and glacier melt in river discharge (Koppes et al., 2015). The water supply in the upper reaches of the HMA is particularly sensitive to climate change because of the high share of river discharge contributed by snow and glacier melt. HMA contains the largest deposit of glacier ice outside of the North and South Pole regions; hence it is sometimes called the “Third Pole.” The Himalayan range encompasses about 15,000 glaciers, which store about 12,000 km3 of fresh water (IPCC, 2007). Many authors have suggested that the shrinking of glaciers in response to climate change might change the hydrological regime in these regions (Bolch et al., 2012; Immerzeel et al., 2012; Kääb et al., 2012). A decrease in glacier volume and area tends to influence the intensity of the seasons and the inter-annual variation on runoff (Juen et al., 2007). Glacier melt’s contribution is projected to increase until 2050 and then decrease in the sub-basins (Immerzeel et al., 2013). Regionally, it is expected to increase discharge until 2050 and then decrease (Lutz et al., 2016). In western Himalaya, glacier melt’s contribution to runoff is projected to increase by 16–50%, with a 1–3°C increase in temperature (Singh and Kumar, 1997; Tahir et al., 2011; Sam et al., 2016). While about 53 million people inhabit the 2400 km of the Himalayas, more than one billion people living downstream depends on the water from HMA, for the food and energy production (Apollo, 2017). The changes in river flow are expected to directly affect the availability of water for hydropower generation, drinking, irrigation, industrial and other purposes affecting one-sixth of the global population.
Hydrologists and glaciologists started to use snowmelt and glacio-hydrological models in the 1990s to estimate river flows as well as the contribution of snow and glacier melt to the flows in the HMA region. The two melt-modeling approaches currently used to calculate the discharge of glacierized river basins are the energy balance model and the temperature index model. The energy balance approach explicitly models melt as a residual in the surface-energy-balance equation when accounting for sums of energy fluxes within the atmosphere and glacier boundary (Reid and Brock, 2010). The temperature-index-model, on the other hand, derives melt from the empirical relationship between air temperatures and melt rates (Braithwaite, 1995; Hock, 2003).
Although the energy balance approach best describes melt totals (Hock, 1999, 2003), this approach is not always feasible for remote Himalayan glaciers, where input data availability is a major constraint (Kayastha et al., 2000). Several studies have used temperature index models in data-scarce Himalayan basins (Takeuchi et al., 1996; Kayastha et al., 2000, 2005; Kayastha and Shrestha, 2019) to estimate river discharge at different temporal scales. Four main reasons for using the model are: (1) the wide availability of air temperature data, (2) the relatively easy interpolation and forecasting possibilities of air temperature, (3) generally good model performance despite its simplicity, and (4) computational simplicity (Hock, 2003).
On the other hand, several studies have modified the simple temperature index model by incorporating different parameters, such as albedo, shortwave radiation and melt factors, to improve the model’s performance (Cazorzi and Fontana, 1996; Hock, 1999). Wortmann et al. (2016) incorporate glacier extents, volume and ice flow into the eco-hydrological soil and water integrated (SWIM) model (SWIM-G) to perform glacio-hydrological modeling of the Upper Aksu catchment in Central Asia. Similarly, Douglas et al. (2016) modified a glacier evolution and runoff model (GERM) to incorporate debris cover and thickness and to redistribute mass losses according to observed surface elevation changes and used it to study the upper Khumbu catchment in Nepal. Ren and Su (2018) coupled an energy-balance glacier-melt scheme with the variable infiltration capacity hydrology model (VIC-glacier) and applied the model in a catchment in eastern Pamir. This model provided a tool for sensitivity tests and for quantifying the response of glacier melt and discharge, enabling estimates of the impact of climate variability with a physically based method.
We examined a range of remotely sensed products that could potentially be incorporated into the Glacio-hydrological Degree-day Model (GDM) to increase the accuracy of the model as well as the ability to estimate river discharge in other basins with limited data. In this study, we made the first step toward incorporating remotely sensed data on glaciers melt estimation, and compare the model-based freeze, thaw, and melt in three river basins of HMA region with Advanced Scatterometer (ASCAT)-derived freeze, thaw, and melt.
Realizing the need for models at a higher spatial resolution to accurately represent the rugged topography of the HMA region, we present the recently developed gridded GDM, which is capable of providing melt data at 4.5 km × 4.5 km grid level. GDM is used to derive the sources of melt – icemelt (debris-covered ice, clean ice), snowmelt, rain and baseflow – in the river discharge. We then compared the results of glacier icemelt from GDM with icemelt estimated using ASCAT data in three basins in the HMA region.
Materials and Methods
Study Area
We compared GDM results with ASCAT in three river basins of Central Himalaya: Tamor, Trishuli, and Marsyangdi River basins (Figure 1), which are sub-basins of the Koshi and Narayani River basins in the Himalaya. While the climate of all three basins is dominated mostly by the Indian summer monsoon from June to September and occasionally by the westerly disturbance post monsoon (October–January), the basins differ in the location and the aspect (facing north or south) of the glaciated area at various elevation ranges and are exposed to different orographic effects. The part of Trishuli River basin that lies in Nepal (40%) is influenced by the Indian summer monsoon and orographic effects, while leeward phenomena prevail in the rest of the basin, which lies on the Tibetan plateau. Most of the Tamor River basin lies on the southern flanks of the Central Himalayas and is much influenced by the Indian summer monsoon. Most of the Marsyangdi River basin also lies on the southern flanks of Central Himalayas, and the northwestern part of this basin lies on the leeward side of Annapurna massif.
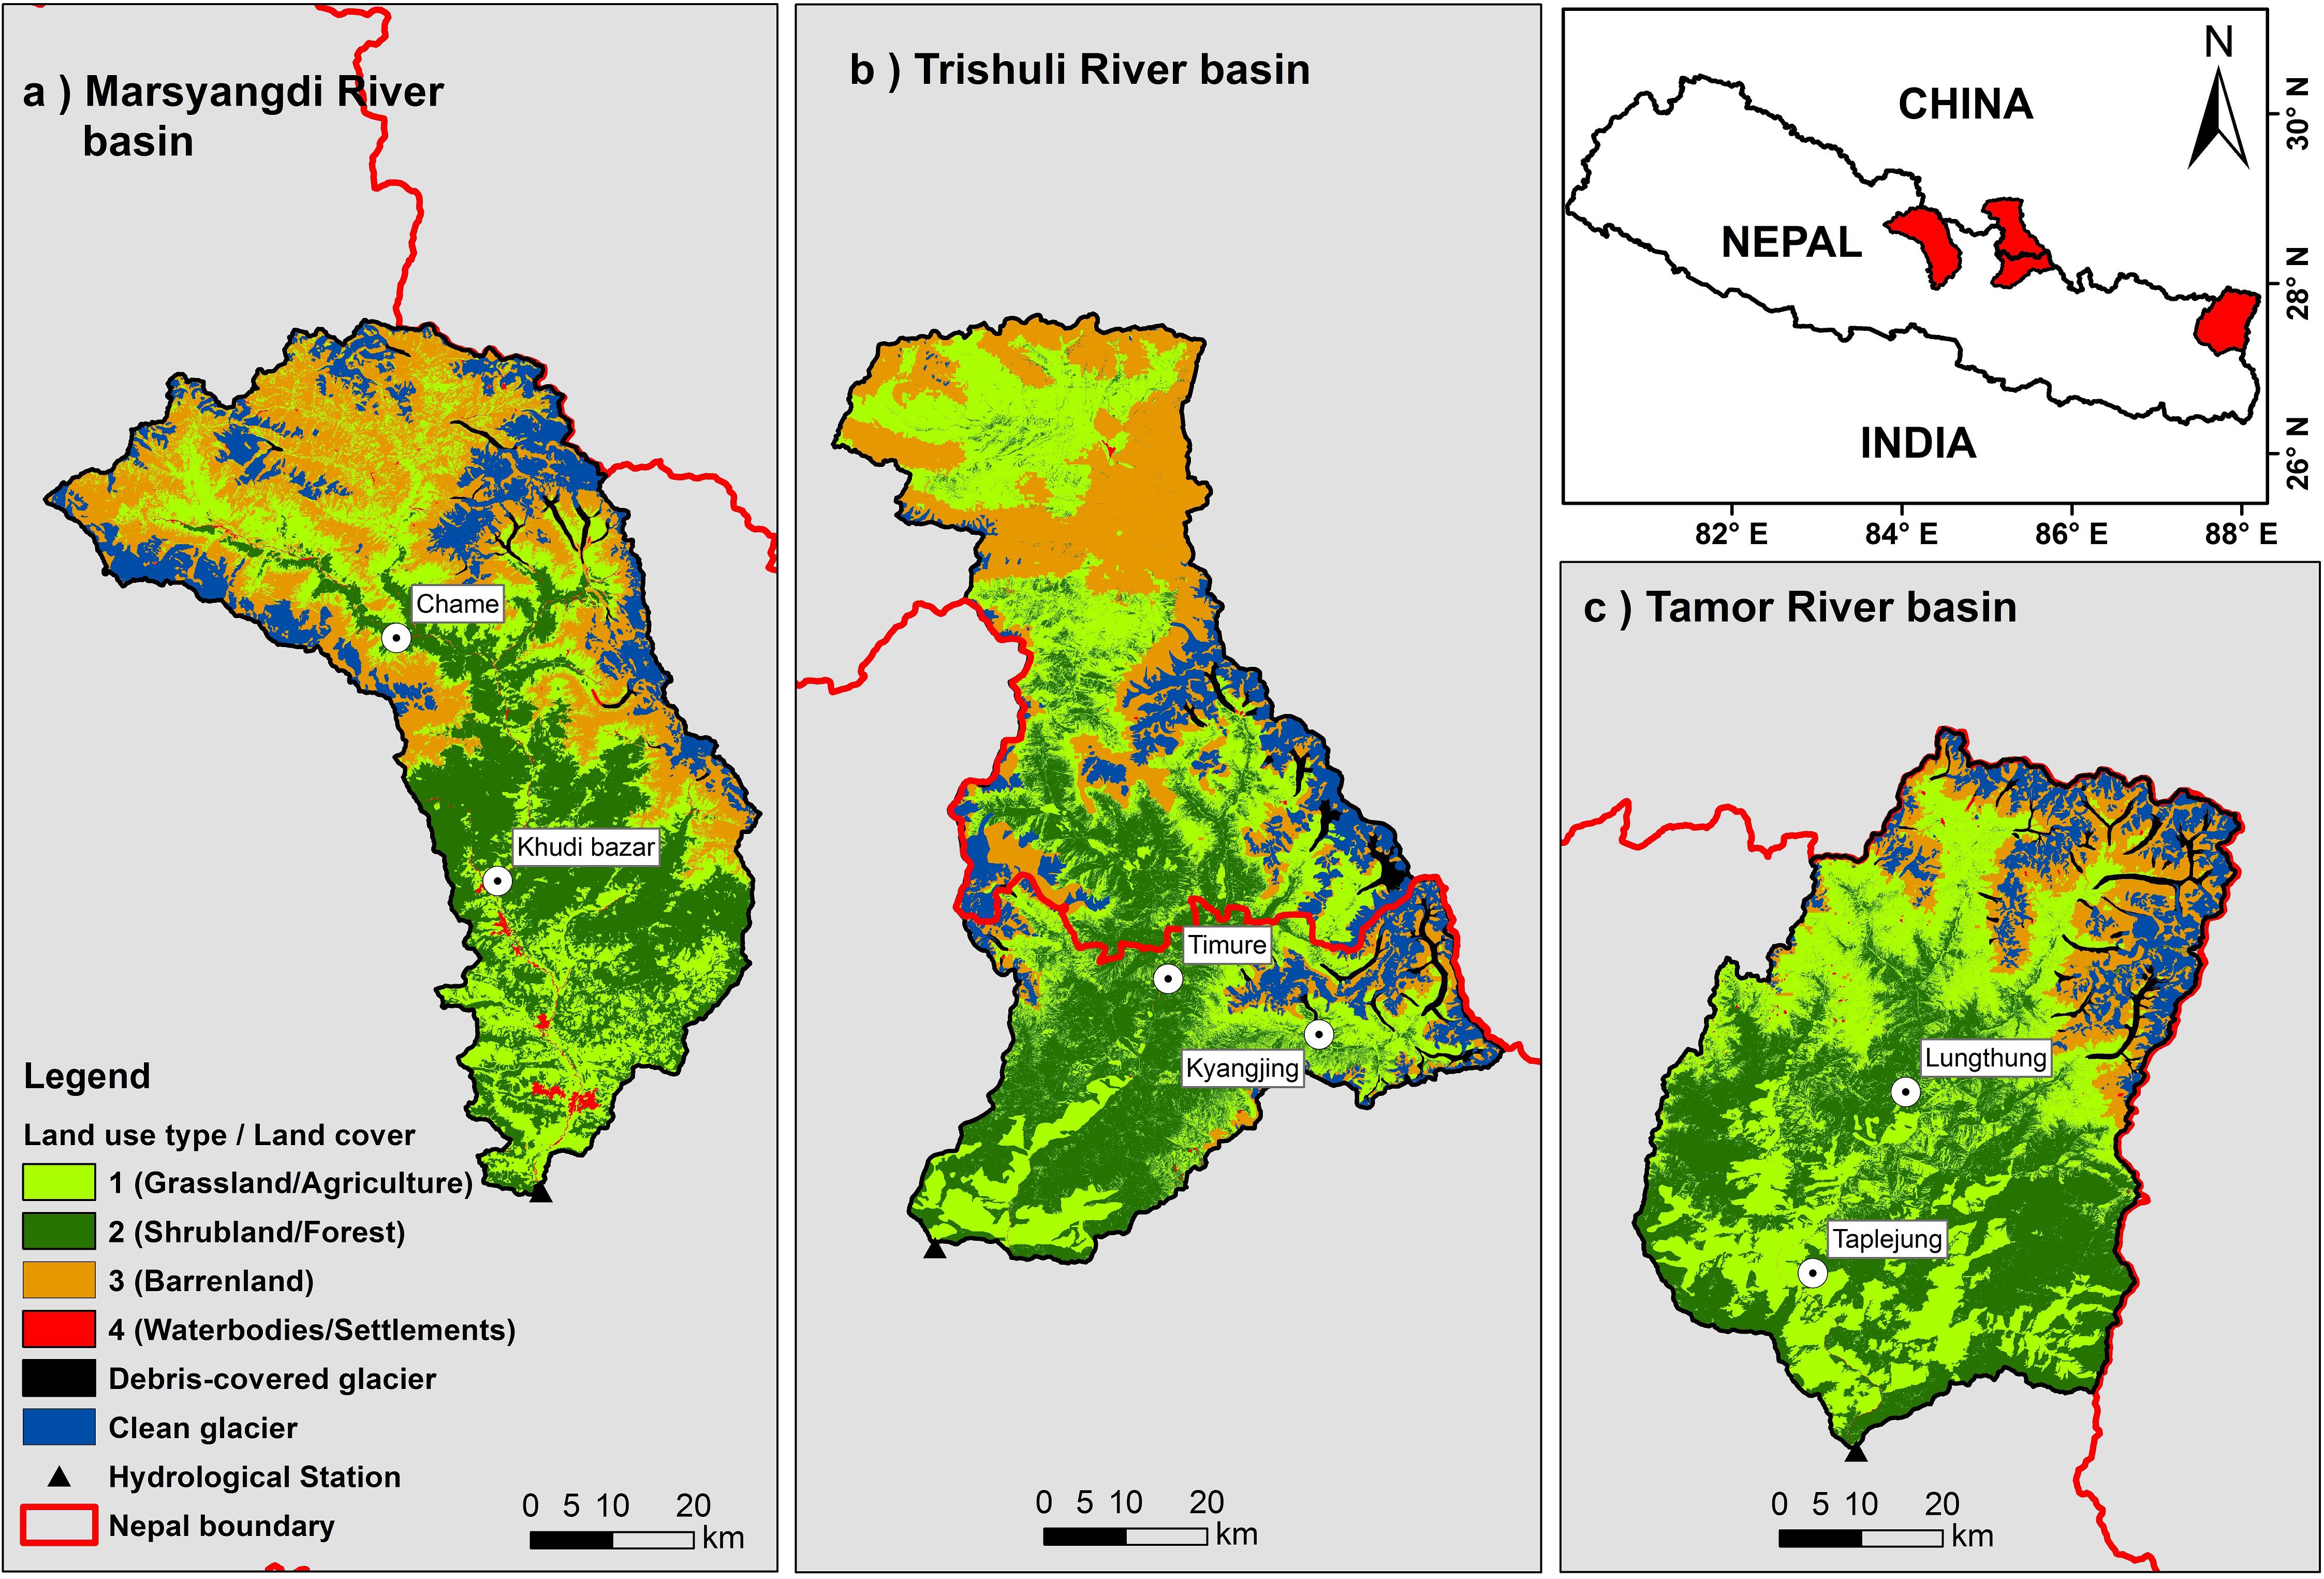
Figure 1. Location map of (a) Marsyangdi, (b) Trishuli, and (c) Tamor River basins in Nepal (map of Nepal in the inset). The map showing land use types with clean and debris-covered glaciers.
Setup of the GDM
The GDM, Version 1.0 is a gridded and distributed glacio- hydrological model capable of simulating the contribution of hydrological components in river discharge. GDM simulates four different runoff components in total discharge: snowmelt, glacier icemelt, rainfall and baseflow at daily time steps. A melt module is based on the degree-day approach, a simplification of a complex process (Braithwaite and Olesen, 1989) to estimate glacier ice and snow melts with minimal data requirements (Kayastha et al., 2005). The two-reservoir based modeling approach of the soil and water assessment tool (SWAT) (Luo et al., 2012) is adopted to simulate the hydrological response of the baseflow and rainfall runoff contribution to river discharge. In the case of the Trishuli River basin, the basin is divided into 4.5 × 4.5 km grids, and classified land class information from GlobeLand30 is extracted to each grid in order to match the grid size of the ASCAT data. Daily temperature and precipitation are extrapolated to each grid from the reference station for the discharge simulation. The threshold temperature (TT) determines whether the precipitation is in the form of snow or rain in each grid in the respective time step:
where T is the extrapolated daily air temperature for the grids and TT is threshold temperature, both in°C.
In each grid, daily ice melt from debris-free and debris-covered ice and snow melt from glaciated and glacier free areas is calculated as:
where M is the ice or snow melt in mm day–1 in each grid, T is daily air temperature in°C, and Kd, Ks, and Kb are the degree-day factors for debris-covered ice, snow and clean glacier ice in mm°C–1 day–1. The model takes into account the multilayer melting of the snow above clean ice and debris-covered ice.
Baseflow is calculated using a baseflow simulation approach, as in SWAT (Luo et al., 2012). The surface runoff (QG) in the model does not consider sub daily precipitation; the surface runoff consists of runoff from rainfall and snowmelt from each grid. The surface runoff component is calculated grid-wise based on the following equation:
where Qr is discharge from rain and Qs is discharge from snowmelt and icemelt in m3 s–1, Cr, and Cs are the rain and snow runoff coefficients, and QG is surface runoff component from each grid in m3 s–1. The total surface runoff contribution QR from all grids and the total baseflow contributions QB from all grids are expressed as:
where Qb is the baseflow contribution from each grid and n is the number of grids. Total surface discharge QR is then routed with the baseflow contribution QB toward the outlet through the following equation:
where k is the recession coefficient, Qd is total discharge in m3 s–1 and d is the dth day. The recession coefficient k is obtained by solving Eq. 7 given by Martinec and Rango (1986). The constants x and y computed from this equation are 0.95 and 0.002, respectively, for all river basins.
Input Data
Daily air temperature, precipitation and stream flow data, which are the main input data of respective river basins to the model, are obtained from Department of Hydrology and Meteorology, Government of Nepal (Table 1). Air temperature and precipitation measured at the climatological station in Taplejung, which is 1732 m above sea level (a.s.l.) is used as input data set for Tamor River basin, together with the hydrological station at Majhitar at an elevation of 533 m a.s.l. Likewise, data from the Khudi Bazar (823 m a.s.l.) and Chame (2680 m a.s.l.) climatological stations are used to derive temperature lapse rate and precipitation gradient in the MRB. Similarly, the Timure (1900 m a.s.l.) and Kyangjing (3862 m a.s.l.) climatological station datasets are used to derive temperature lapse rate and precipitation gradient in Trishuli River basin.
For the geo-spatial dataset, the Advanced Spaceborne Thermal Emission and Reflection Radiometer (ASTER) global digital elevation model version 2, with 30 m spatial resolution, available from the United States Geological Survey1, is used for the grid elevation information. GlobeLand30 with 30-m resolution2 is used for land cover. Ten different land cover classes from the GlobeLand 30 dataset are merged with similar topology character and surface runoff behavior to create six land classes for similar ranges of rainfall runoff coefficient, as shown in Table 2. In this study, land use type is classified into six classes (land use types 1, 2, 3, 4, debris-covered glacier and clean glacier ice). The shape files from the International Centre for Integrated Mountain Development Glaciers Inventory (2010) are used for clean and debris-covered glacier information. The land use types and hypsometry of all three river basins are shown in Figure 2.

Table 2. Re-classification of land cover classes from GlobeLand30 dataset in Tamor, Trishuli, and Marsyangdi River basins.
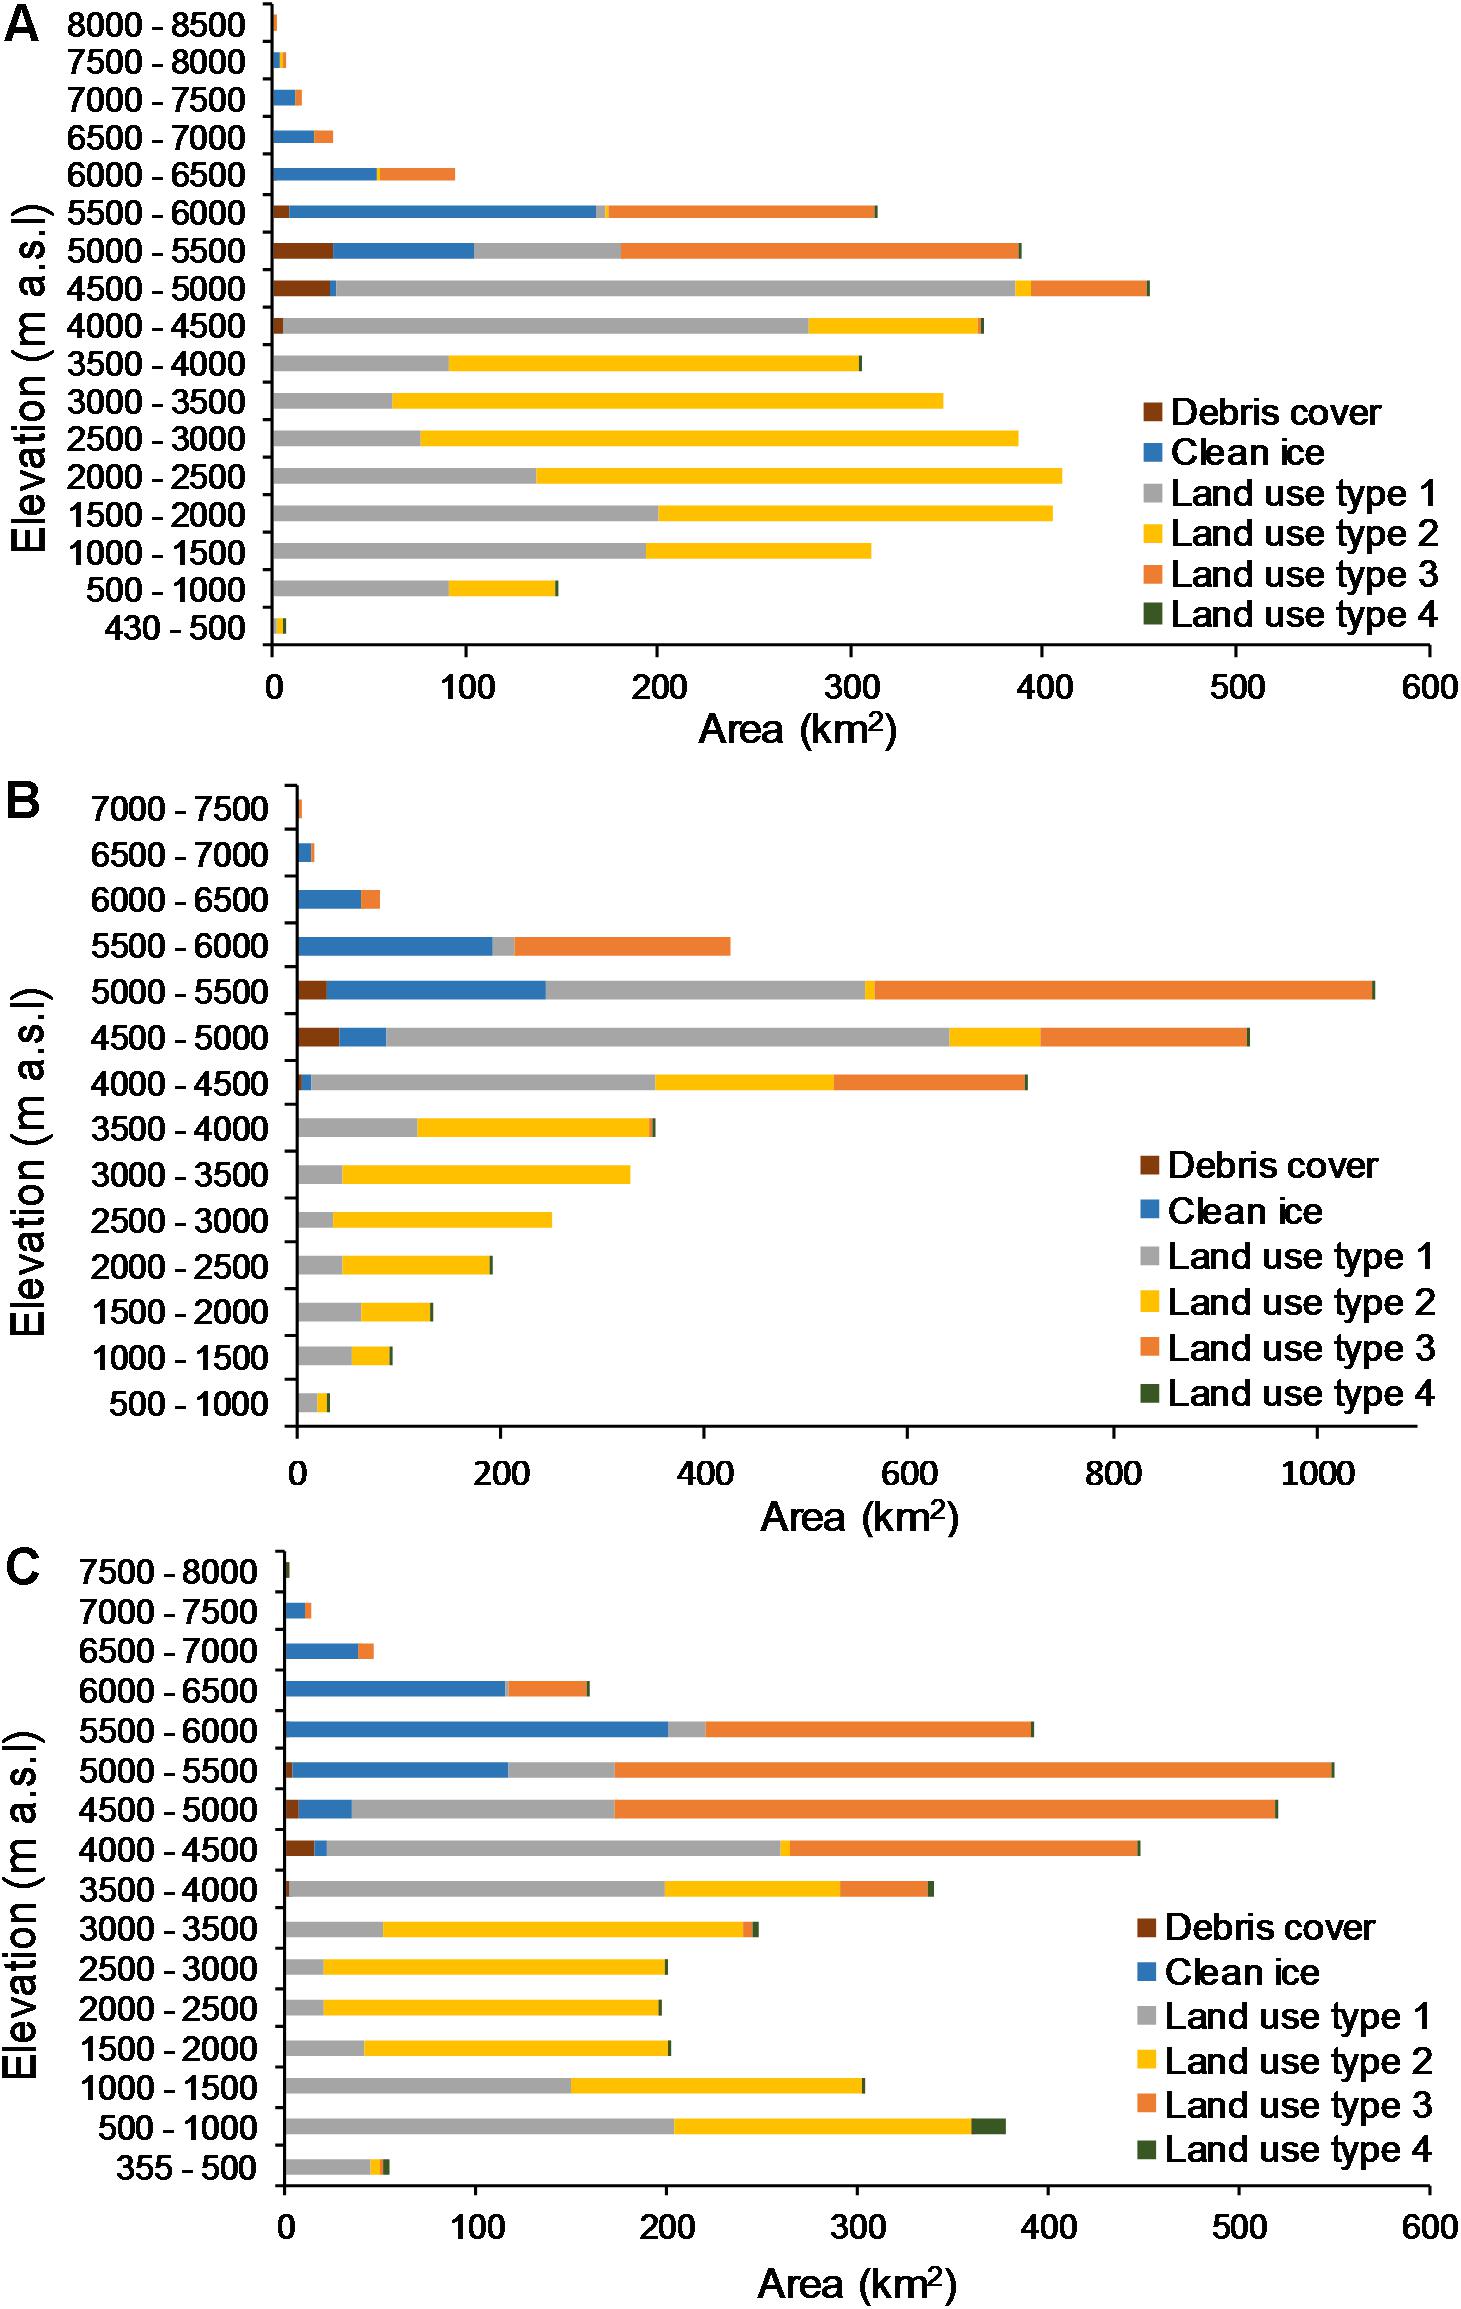
Figure 2. Area-altitude distribution of debris-covered and clean ice along with other land use types in (A) Tamor, (B) Trishuli, and (C) Marsyangdi River basins based on the ASTER GDEM of 30 m resolution, GlobeLand30 and ICIMOD Glacier Inventory (2010).
Hydrologic Simulation Experiment Design
The performance of GDM is first calibrated in all three river basins by comparing the simulated discharge with the respective observed discharge from 2000–2010 in Tamor River basin, 2007–2013 in Trishuli River basin and 2004–2010 in Marsyangdi River basin at respective hydrological stations of the basins. The melt module parameters, such as degree-day factors for snow and ice melt, are based on field observations in the Nepal Himalayas carried out by Kayastha et al. (2000) and Kayastha et al. (2003). The degree-day factor for ice melt under a debris layer is assumed to be around half than that of clean ice, based on the field observation on Khumbu and Lirung Glaciers in the Nepal Himalayas.
Performance Indices
To assess the model’s performance efficiency, we compared the daily time-series observed and simulated discharges. The Nash-Sutcliffe efficiency (NSE) index (Nash and Sutcliffe, 1970) is used to assess the model’s simulated discharge against the observed discharge, as shown in equation 8.
where n is the number of days, Qobs is the daily observed discharge, Qsim is the daily simulated discharge, and Qavg is the average observed discharge.
Similarly, volume differences are used to determine the model’s accuracy and calculated by using the following equation:
where VR and V’R are the measured and the simulated discharge, respectively.
A prediction from such a model is associate with a certain degree of uncertainty due to errors during the calibration of parameters, the design of the model and measurements of input data. In this study we assume that the model has higher degree of accuracy and certainty if the NSE index higher than 0.7 and volume difference up to ± 10%.
Glacier Melting Based on Satellite Observation
We used radar observations from ASCAT, on EUMETSAT satellites MetOp-A and -B, to detect glacier melting in mountain basins at a daily time-step (Steiner and McDonald, 2018). The ASCAT Scatterometer is a six-beam radar instrument that measures normalized backscatter at microwave frequencies (C-band, 5.255 GHz) with vertically polarized antennae. These observations are not sensitive to clouds and provide a temporally dense time-series of surface observations. The full-resolution ASCAT swath is normalized to an incident viewing angle of 40° and spatially enhanced using the Scatterometer image reconstruction algorithm (SIR) (Early and Long, 2001). The ASCAT normalized SIR backscatter observations have an effective spatial resolution between 15 and 20 km and are gridded to 4.45 km (Lindsey and Long, 2012).
In glaciated high mountain landscapes, radar backscatter signatures are dominated by scattering from deep snow and firn (Drinkwater et al., 2001). Snowfields in the accumulation zone of mountain glaciers are distinguishable in imaging radar mapping by large-magnitude backscatter caused by volume scattering from subsurface structures (Rignot, 1995). During melting conditions, volume scattering at microwave frequencies is greatly reduced because of increased absorptivity caused by wet snow and ice (Nghiem et al., 2001). Associated time-series changes in backscatter are abrupt as melt onset occurs and lead to discontinuous step-changes in the backscatter time-series that can be detected numerically (Steiner and Tedesco, 2014). We determined the timing of glacier melting events from these radar signatures over the entire Himalayas, from 2007 to 2018, similar to Steiner and Tedesco (2014), using a multiscale analysis to detect negative (melting) and positive (refreeze) changes in backscatter (Mallat, 1999). To isolate glacier-dominated backscatter we apply a criterion to ensure that the frozen season is separable from periods of melting, as detected using wavelet classification. To identify melting conditions, the associated backscatter must be separated from the frozen state backscatter by at least two standard deviation (σ) of the frozen season backscatter variability. These data are stored at the National Snow and Ice Data Center, as part of the ASCAT freeze/thaw and glacier-melt product (ASCAT FTGM) (Steiner and McDonald, 2018). We spatially harmonized the ASCAT FTGM product with output from the GDM model using nearest-neighbor interpolation.
Results
Model Calibration
The positive degree-day factors, snow and rain coefficients, and recession coefficient are the main calibrating parameters of the GDM. The model is calibrated with different positive degree-day factors, and a set of degree-day factors is adopted for different months, within the range of estimated degree-day factors on different glaciers of the Nepal Himalayas. Two sets of degree-day factors for snowmelt and icemelt; lower degree-day factors at altitudes lower than 5000 m and higher degree-day factors at higher than 5000 m altitudes are used. Again higher degree-day factors are used in non-monsoon months and lower degree-day factors are used in monsoon months; June to September. Similarly, the model is also calibrated with snowmelt and rain runoff coefficients and recession coefficients. Snowmelt and rain runoff coefficients are also used higher in monsoon months (from 0.4 to 0.9). All the calibrated parameters and coefficients used in the study are listed in Table 3. The degree-day factors, snow and rain runoff coefficients, recession coefficients, and other input parameters used in the 5-year calibration period were fixed and used for flow simulations for the whole period in all river basins.
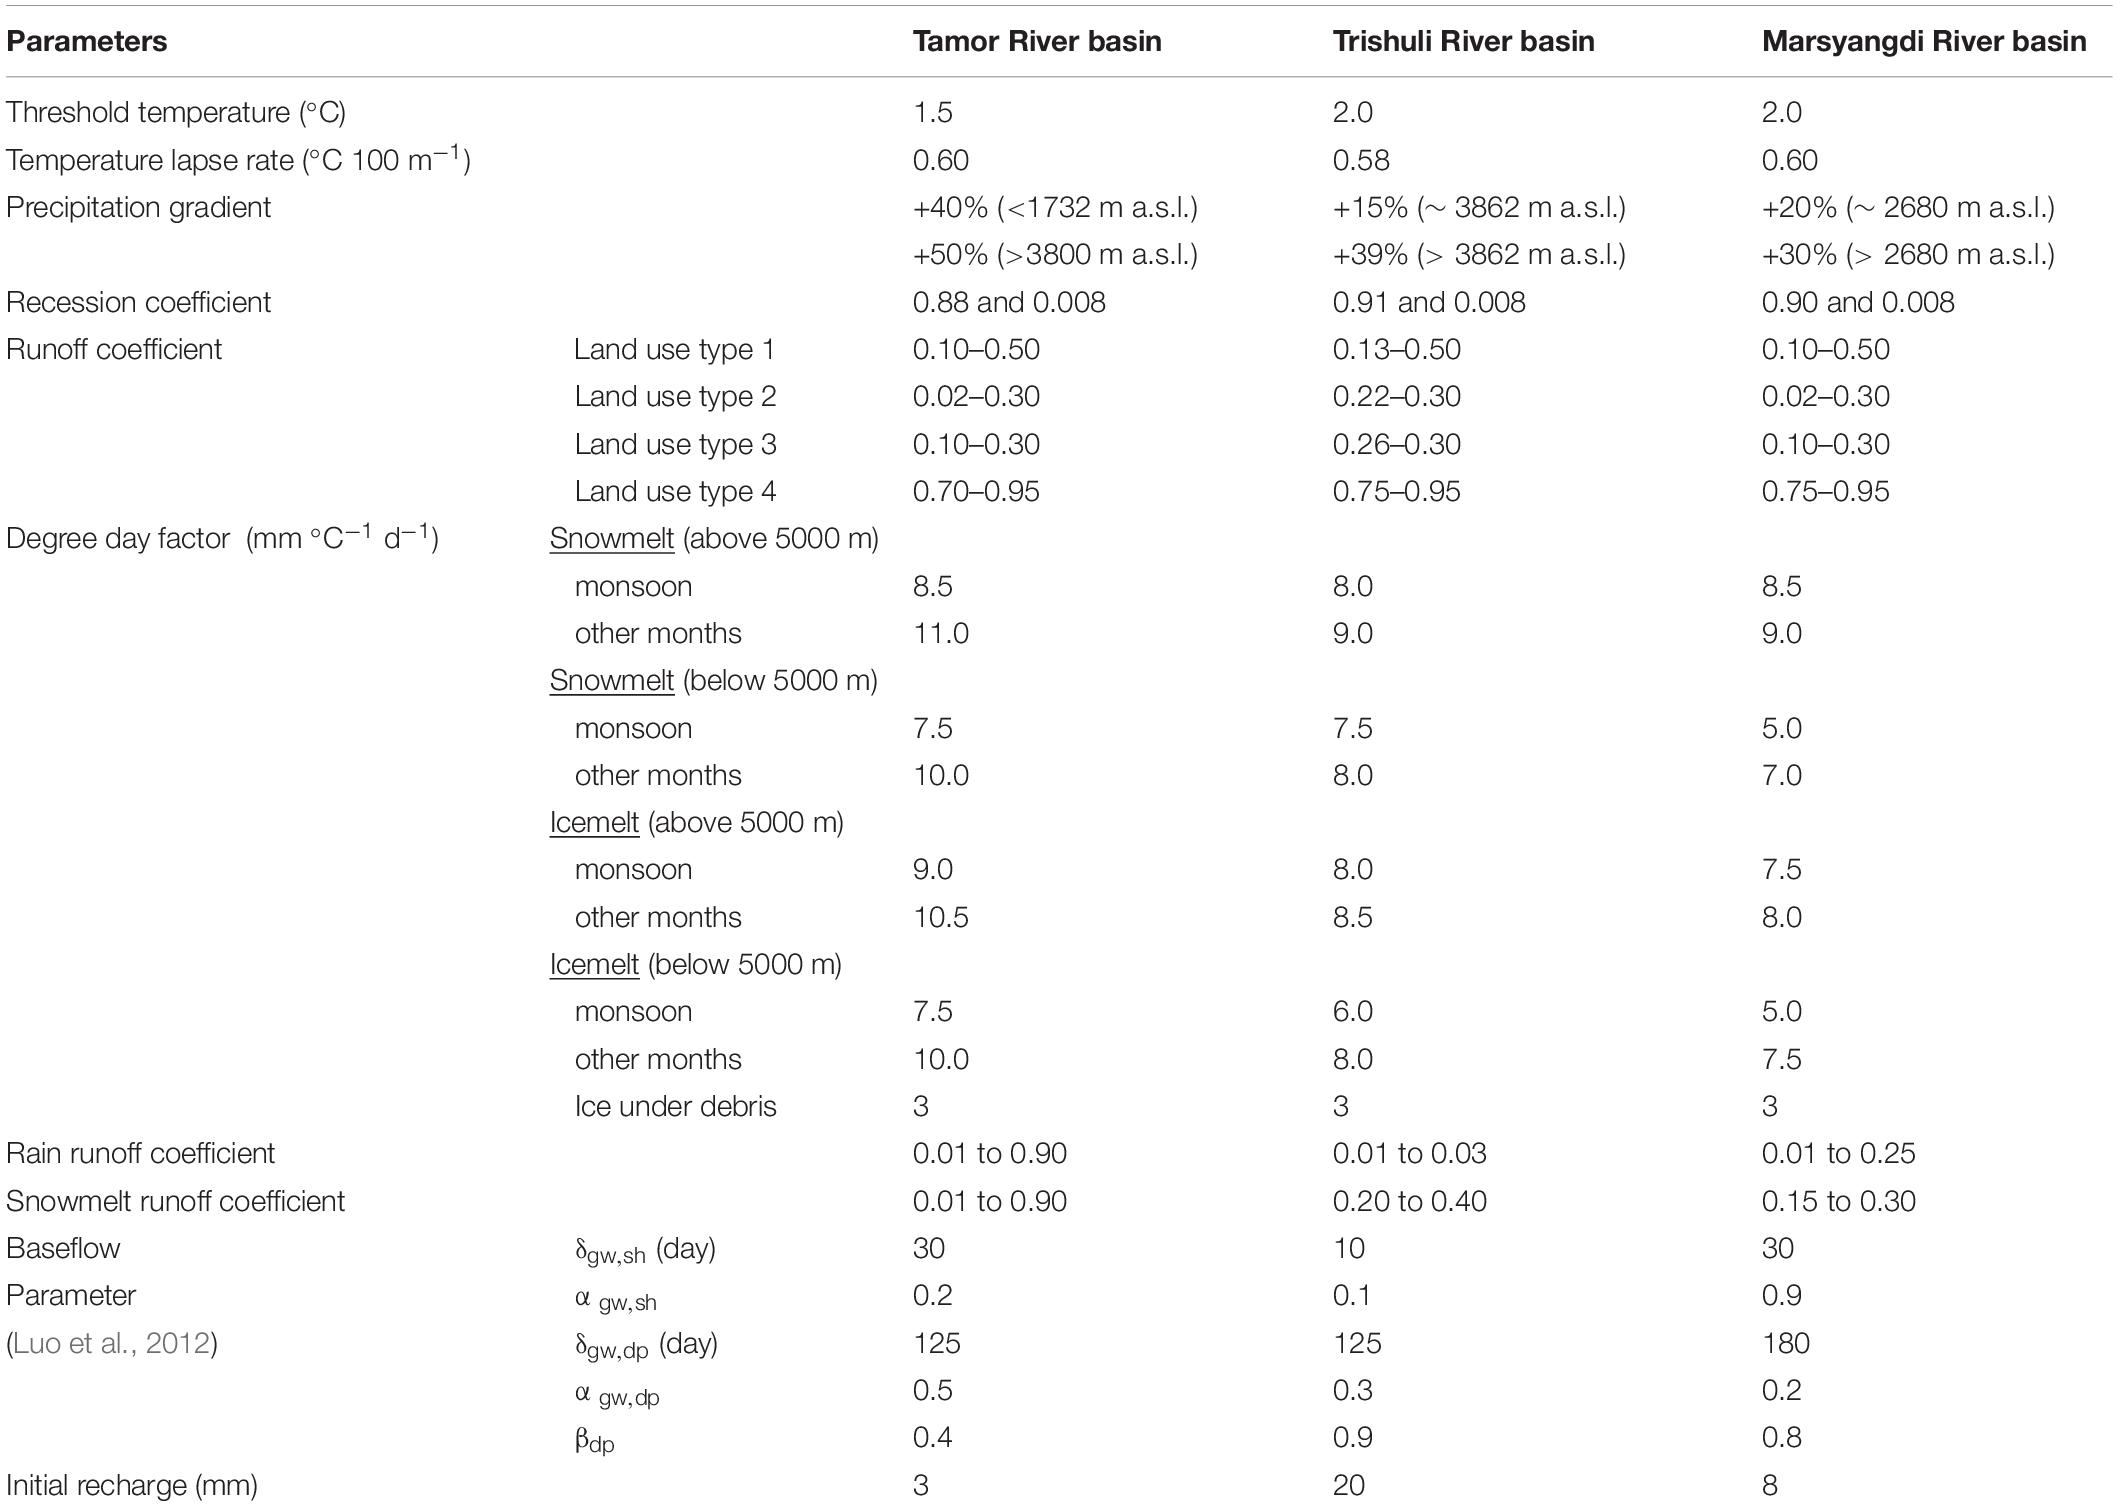
Table 3. Parameter and coefficients used for calibrating the model in Tamor, Trishuli, and Marsyangdi River basins.
Daily simulated discharge is compared with the observed hydrographs of all three river basins Tamor, Trishuli and Marsyangdi River basins as shown in Figure 3. Both high and low simulated discharge were consistent with the observed discharge in the river basins, except in few cases. The model also caught pre-monsoon low flows reasonably accurately. The model could not catch few peaks in the graphs, which may be due to underestimation of the precipitation at high altitudes. Barry (2012) and Baral et al. (2014) reported that the precipitation gradient in the mountainous environment is considered to vary vertically and horizontally. The high Himalayan region, with complex topography within the basin, also affects the spatial and temporal distribution of precipitation, which might be a constraint on representing the precipitation pattern or distribution. In this study, climatological stations within each respective basin were used to derive the precipitation gradient and distribution. Even with such limitations, the model simulated the daily discharge with good NSE values and within 10% of the actual volume, in spite of limited input data (Table 4).
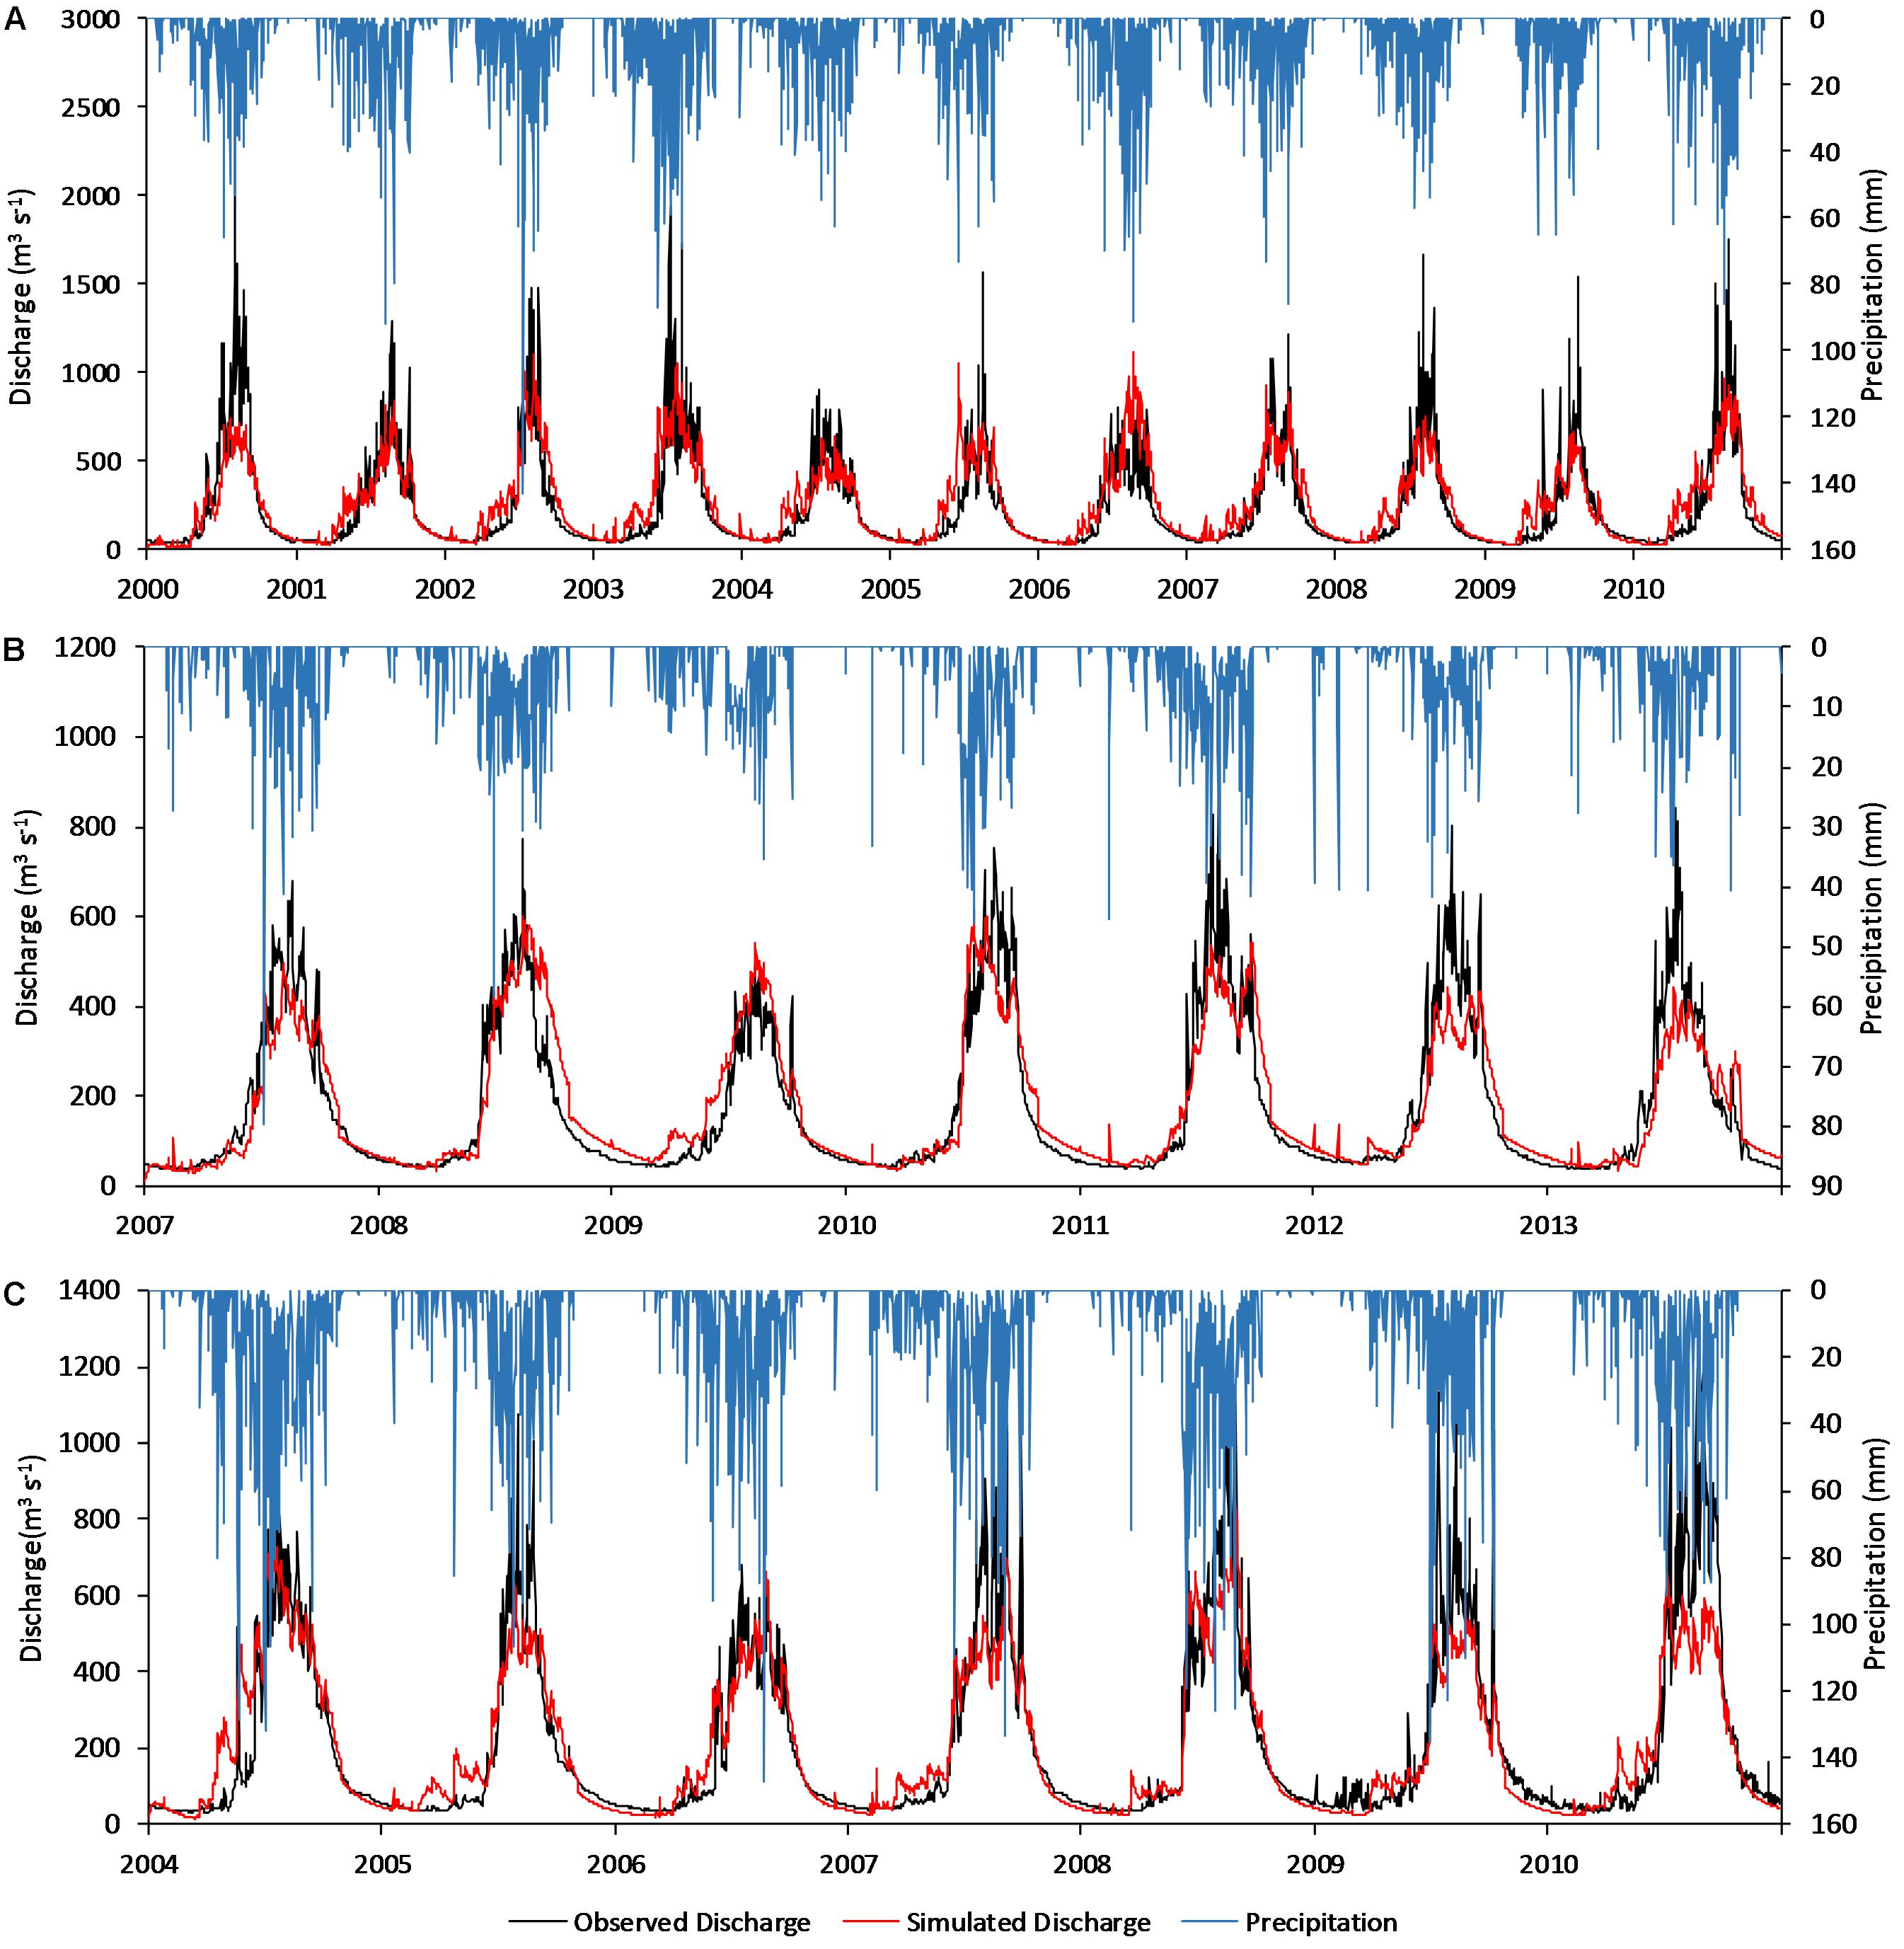
Figure 3. Observed precipitation and discharge with simulated discharge from GDM in (A) Tamor River basin from 2000 to 2010, (B) Trishuli River basin from 2007 to 2013, and (C) Marsyangdi River basin from 2004 to 2010.
Contributions of Snowmelt, Icemelt, Rainfall, and Baseflow
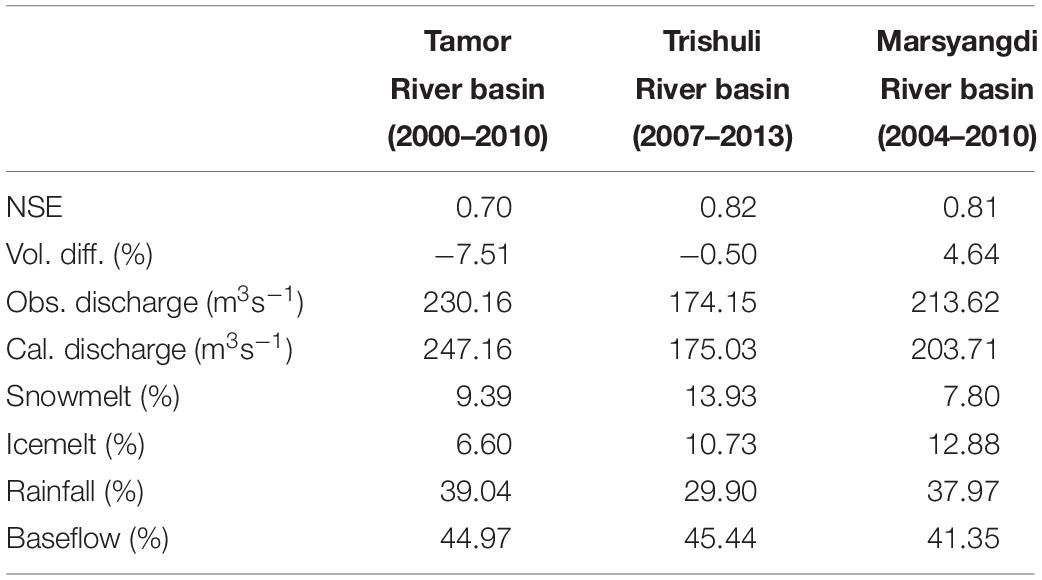
Glacio-hydrological Degree-day Model also estimates the contributions of snowmelt, icemelt, rainfall, and baseflow to river flows. Figure 4 and Table 4 show the mean annual contributions of snowmelt, icemelt (clean and debris-covered), rainfall, and baseflow for in all three river basins of this study. The contribution of snowmelt ranges from 7.8% in the Marsyangdi River basin to 13.93% in the Trishuli River basin. The contribution of icemelt in river flow ranges from 6.6% in the Tamor River basin to 12.88% in the Marsyangdi River basin. Rainfall contribution to river flow is 29.9% in Trishuli River basin and 39.04% in the Tamor River basin, and baseflow varies from 41.35% in Marsyangdi River basin to 45.44% in the Trishuli River basin. This range of contributions to river flow is consistent with the area covered by glaciers and the climatological condition of the river basins.
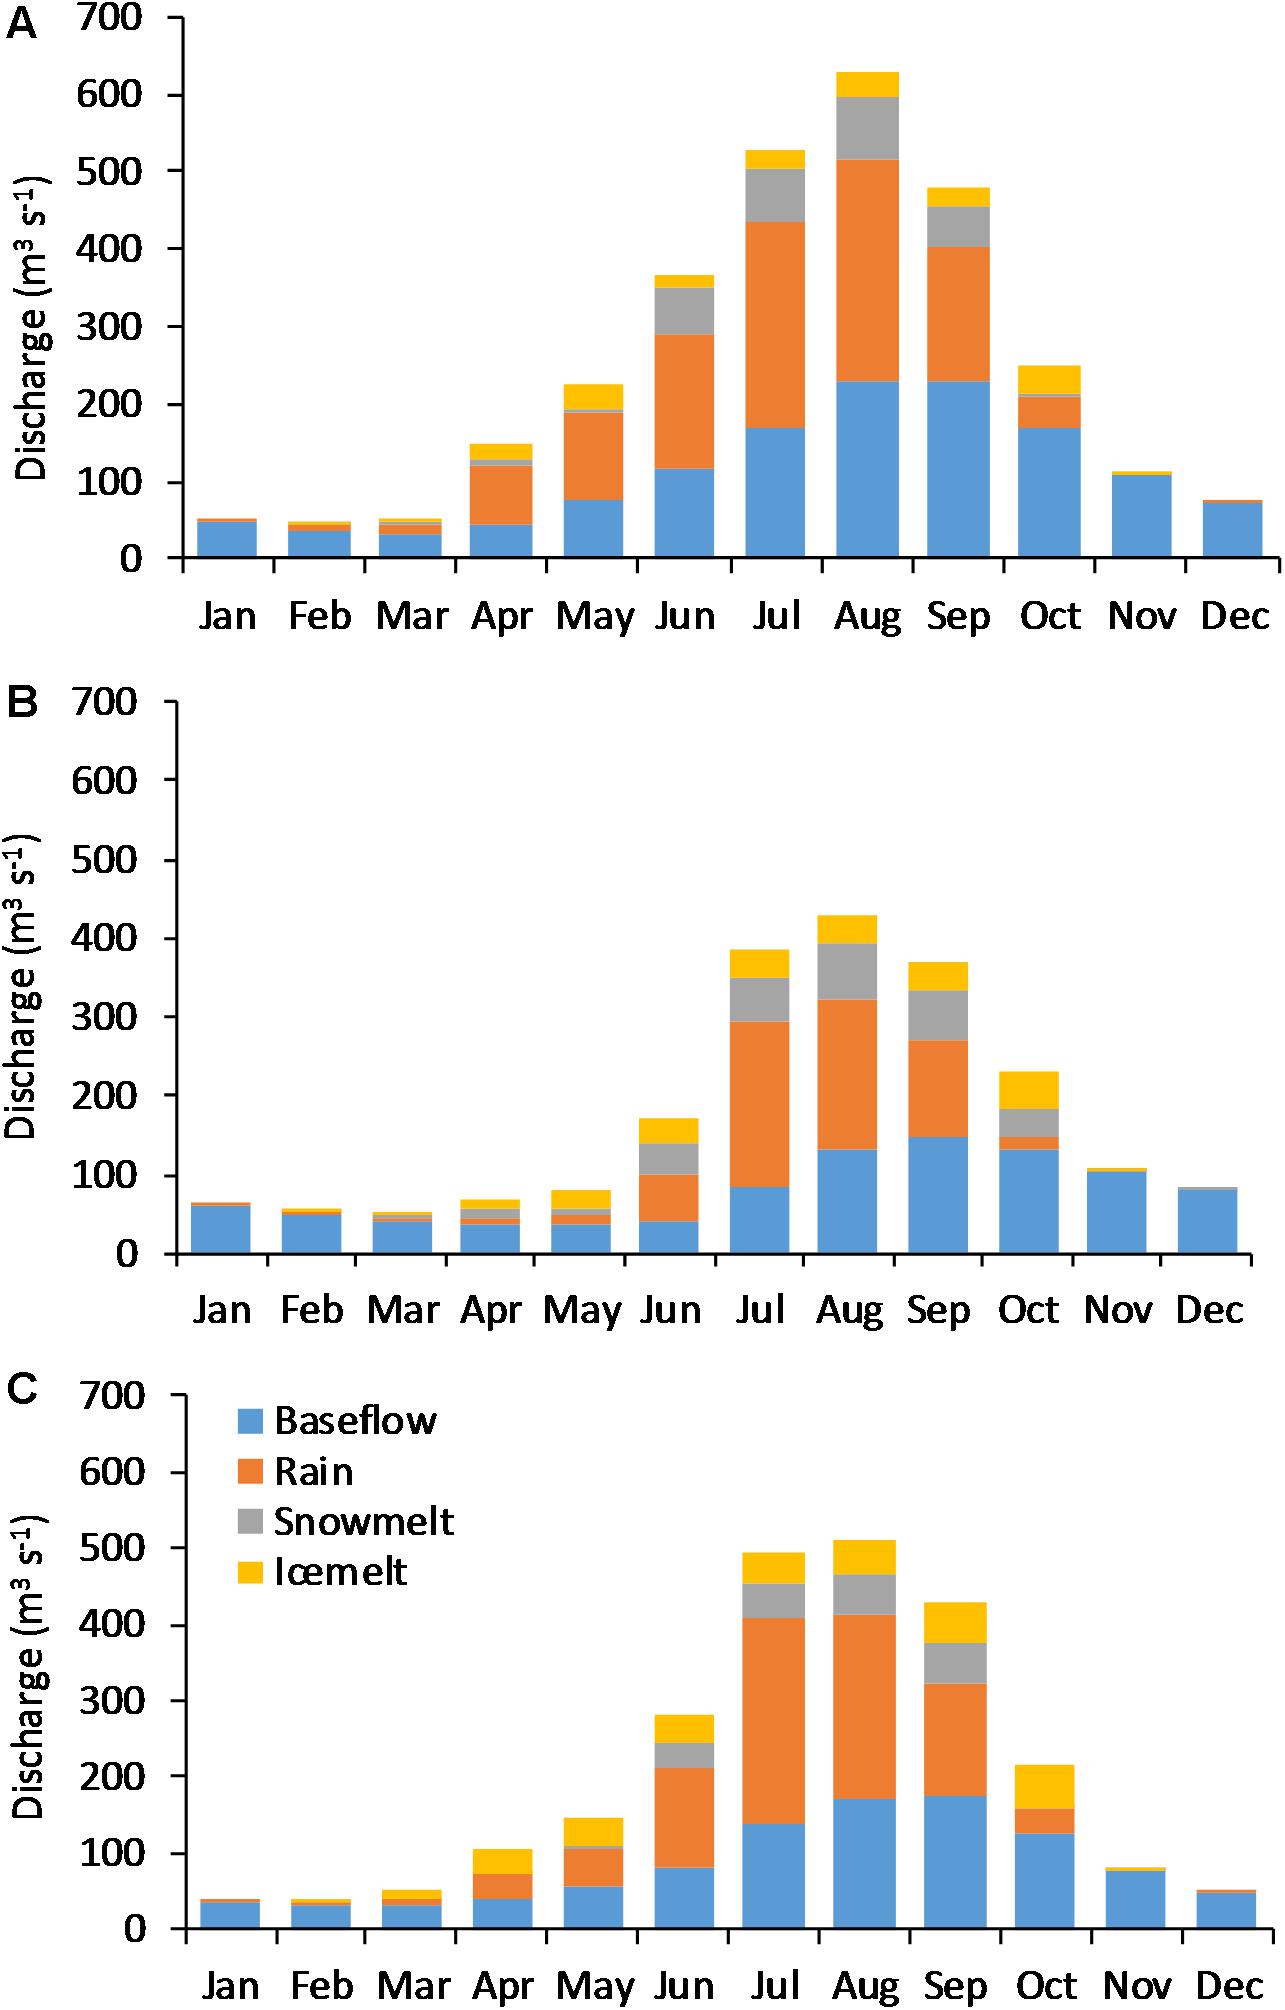
Figure 4. Monthly partition of snowmelt, icemelt, rain and baseflow contributions in (A) Tamor, (B) Trishuli, and (C) Marsyangdi River basins.
Comparison of Snow and Icemelt From GDM and ASCAT Product
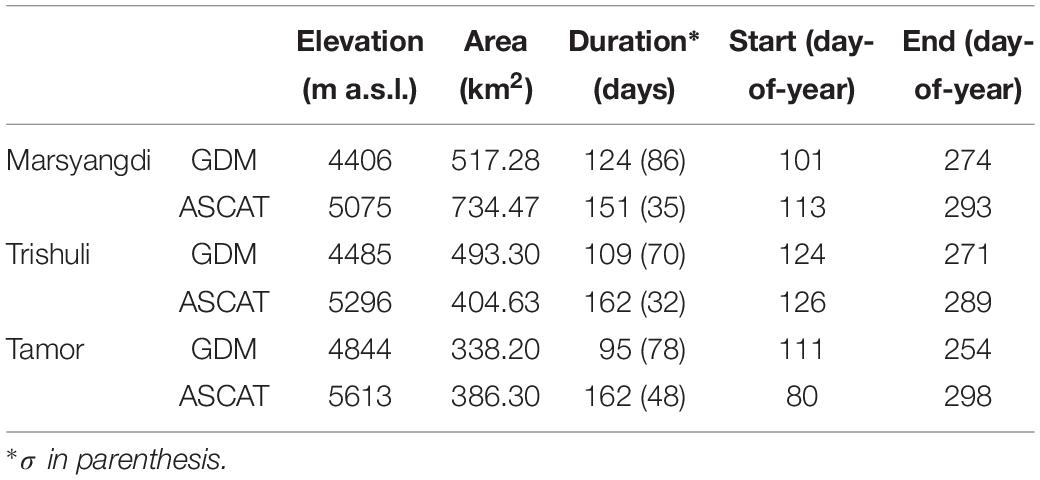
Icemelt derived from GDM is compared with the ASCAT FTGM dataset to investigate the differences in melt extent and duration. With this comparison we also evaluate the utility of the ASCAT satellite record in providing observations that can be used to inform, complement, or validate hydrological modeling. Table 5 summarizes some spatial and temporal statistics of observed icemelt during 2007-2010. For all basins ASCAT detects melting extent at substantially higher elevations and over larger areas, on average, than GDM, with exception of the Trishuli River basin. We find that the melt duration detected by ASCAT is longer than the melt duration estimated using GDM. This is especially true in the Trishuli River basin and Tamor River basin where ASCAT-observed melting is 20 and 26% longer, respectively, than modeling suggests. There is also a lesser degree of spatial variability in the duration of melting observed by ASCAT. The longer melting duration observed by ASCAT is largely related to melt persisting later into the season, as ASCAT observes Marsyangdi River basin as having later icemelt start than does GDM whereas Tamor River basin has earlier icemelt starts than GDM.
Summations of annual glacier melt duration derived after running the GDM by increasing and decreasing one σ of the air temperature and precipitation over the Tamor, Trishuli and Marsyangdi River basins compared with the ASCAT observation are shown for water-year 2007 in Figure 5.
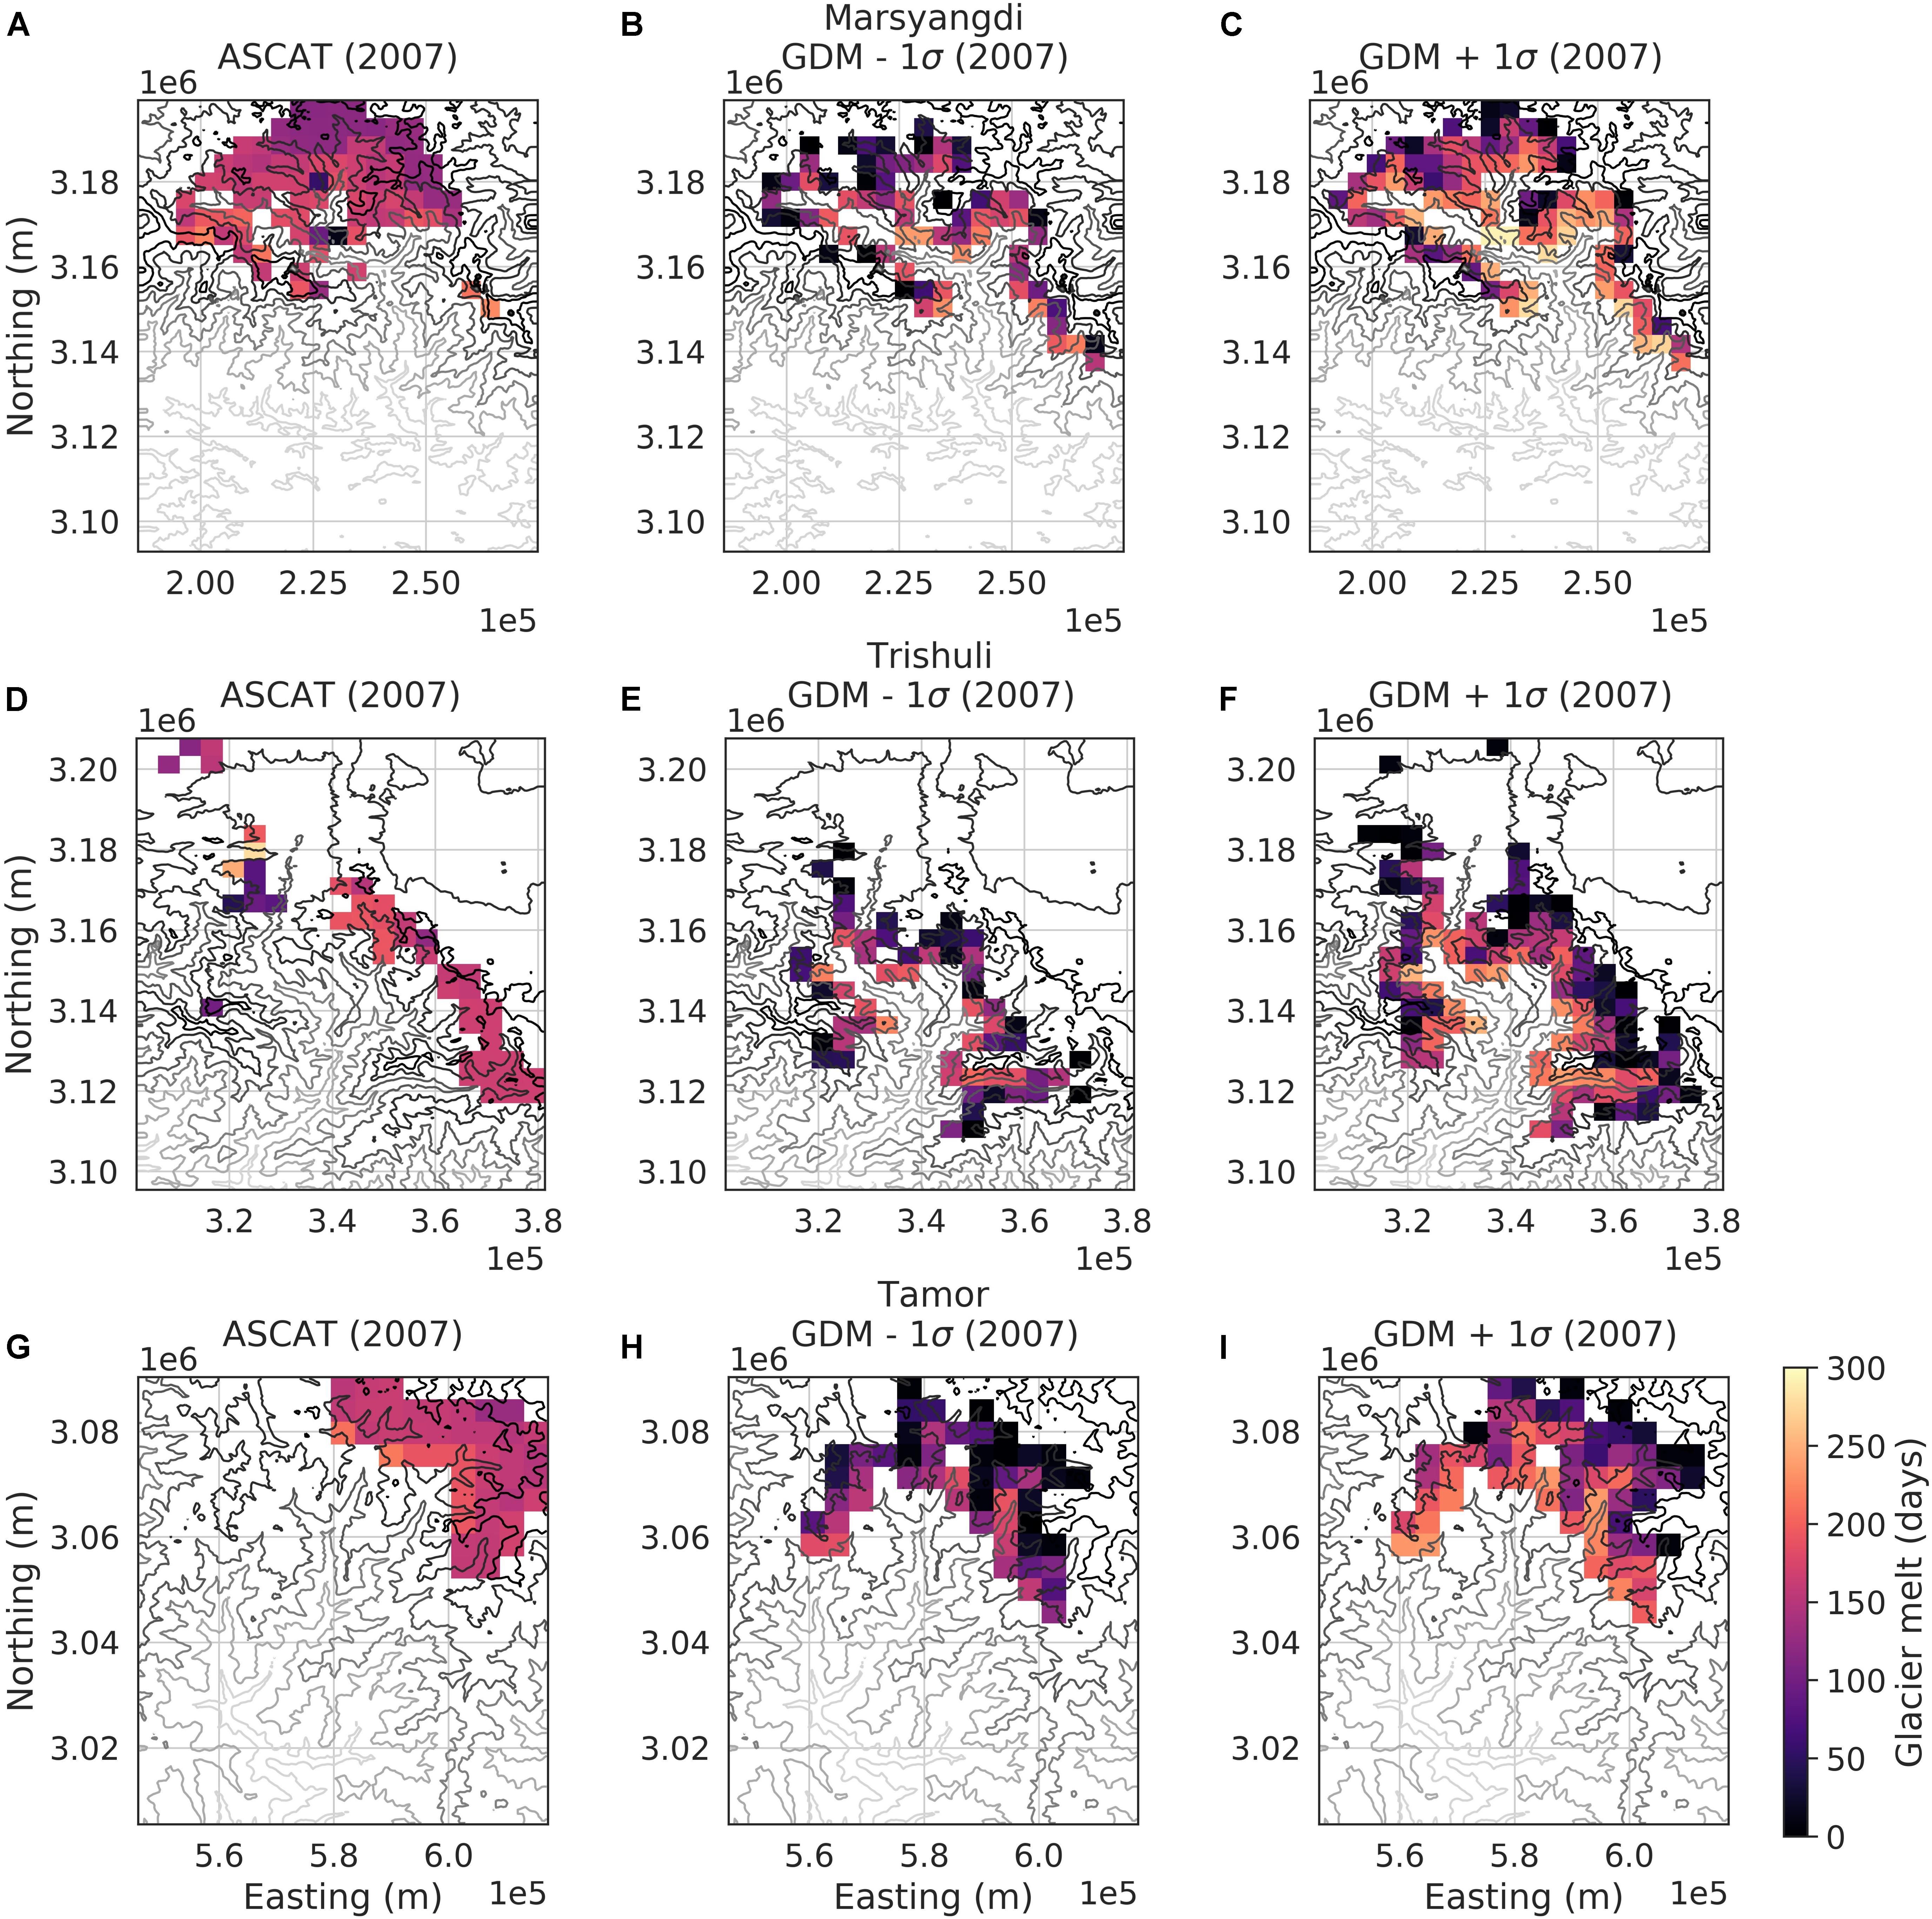
Figure 5. The spatial distribution of glacier melting duration during 2007 for the ASCAT Scatterometer are overlain onto contours of elevation, in m a.s.l., for Marsyangdi, Trishuli, and Tamor River basins along with the GDM. The range of melting illustrated for each basin is resultant from a variation of standard deviation (σ) below and above the air temperature and precipitation. The (A) ASCAT observations of melting days for Marsyangdi are shown along with (B) −1σ and (C) +1σ. For the Trishuli River basin, we illustrate (D) ASCAT, (E) −1σ, and (F) +1σ. For the Tamor River basin, we illustrate (G) ASCAT, (H) −1σ, and (I) +1σ.
For the Marsyangdi River basin, the ASCAT FTGM product (Figure 5A) covers a larger area than the GDM at -1σ (Figure 5B) as well as that of +1σ (Figure 5C). Compared to the GDM, the ASCAT product shows less spatial variability at the 4.5 km grid-size. Larger melt extents observed by ASCAT are a result of apparent spatial continuity in surface melt introduced by ASCAT spatial resolution limitations over discontinuous glacier land-cover as well as ASCAT observations of icemelt at higher elevations. There is little variability in melt duration with elevation. For the Trishuli River basin, the ASCAT FTGM dataset shows melting over a lesser area (Figure 5D) than the GDM at −1σ (Figure 5E) as well as +1σ (Figure 5F). Similar to the Marsyangdi River basin, ASCAT FTGM shows melting at higher elevations with little variability in melt duration compared to the GDM. In the Trishuli the ASCAT product does not detect melting over areas where GDM predicts a majority of the melting, at elevations below 5000 m a.s.l. Over the Tamor River basin, the ASCAT FTGM product (Figure 5G) and the GDM maximum ice melting extents are within the −1σ (Figure 5H) and +1σ (Figure 5I) of GDM extents and the satellite observes melting at higher elevations. In the Tamor River basin, both estimates found a similar degree of spatial heterogeneity with a less pronounced elevational gradient from the ASCAT FTGM product. This ±1σ analysis is done to check the elevation dependent of ASCAT melt. Even with +1σ temperatures we are seeing more melting at higher elevations with the ASCAT product. This is due to radiation-driven melting at high elevations. Most of the melt-water will be refrozen in-place, therefore not contributing to runoff. This makes sense as refrozen ice structures are though to drive the radar brightness especially at C-Band. This indicates that ASCAT (C-Band, VV-pol) is not the ideal type of radar to look at hydrological modeling for river flow. There are some places where it will overlap with temperature driven melting but the signal will be dominated by accumulation zone melting.
A comparison of glacier melt with elevation from modeling and radar observations during 2007–2010 finds clear and systematic differences in distribution in the melting magnitude, i.e., melt area over time, with elevation (Figure 6). For the Marsyangdi River basin (Figure 6A) glacier melting has similar magnitude below 5000 m a.s.l. Over 5000 m a.s.l. we find ASCAT observes substantially larger glacier melting occurrences persisting to very high elevations, greater than 6500 m a.s.l. For the Trishuli (Figure 6B) and Tamor River basins (Figure 6C) we find melting distributions with elevations to be translated, relative to the GDM, toward higher elevations with 5000 m a.s.l. being the elevation where these distributions find similar magnitudes of melting.
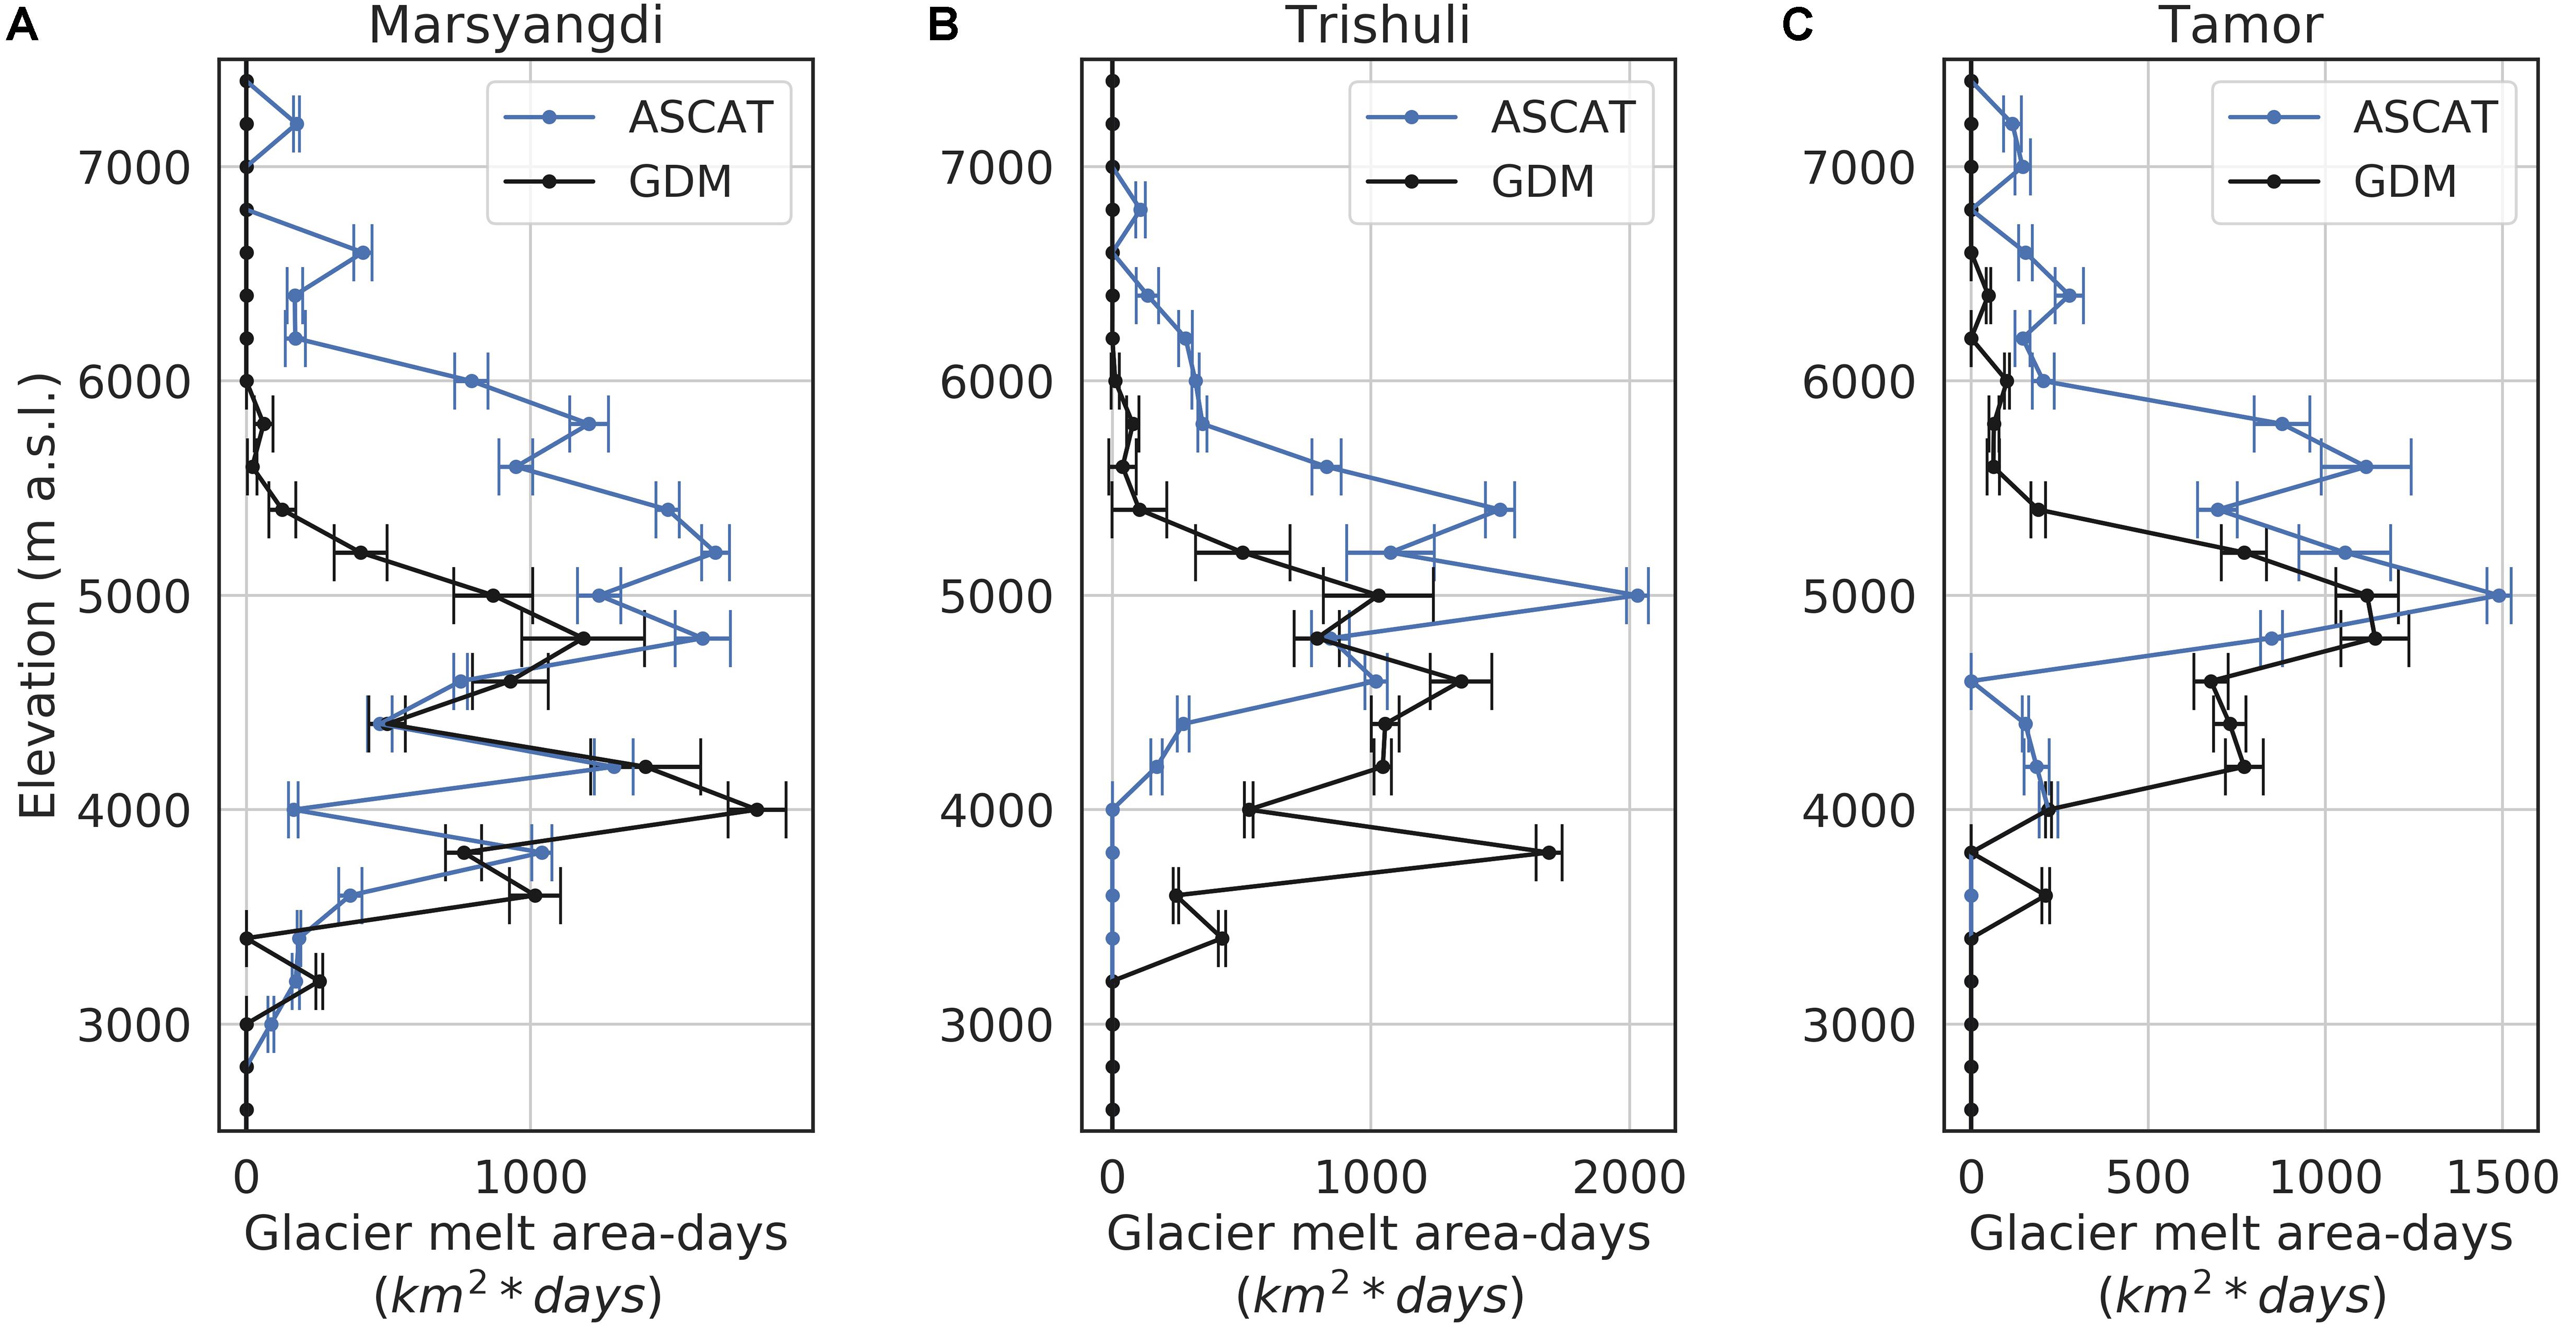
Figure 6. The number of glacier melt-area days with elevation averaged over the years 2007-2010, with one standard deviation indicated with error bars, as estimated by the GDM and observed with the ASCAT Scatterometer for the (A) Marsyangdi, (B) Trishuli, and (C) Tamor River basins.
Discussion
Using remote sensing datasets to understand processes more accurately in the data-scarce HMA region may support both science and water resource management. We used C-band radar backscatter observations from ASCAT, spatially enhanced and posted to a 4.5 km grid, to examine glacier melting in mountain basins at a daily time-step, and compared that with GDM results. A comparison of the extent of glacier melting in the Tamor, R Marsyangdi and Trishuli River basins indicates systematic differences in GDM estimates and ASCAT observations of melting. ASCAT generally observes melting over longer durations, at higher elevations, and with less spatial variability than GDM predicts.
C-band radar backscatter such as that provided by ASCAT is especially sensitive to melting over snow-fields and glacier firn as occurs over percolation zones (König et al., 2002) because these areas exhibit a strong volume scattering contribution to the radar signature from the complex snow and ice stratigraphy (e.g., Parry et al., 2007). This sensitivity to dry firn gives rise to C-band radar backscatter sensitivity to small changes in the amount of liquid water contained in the upper 1 m of glacier firn even when buried under refrozen snow (Bevan et al., 2018). The persistence of buried liquid water under frozen snow while frozen surface temperatures persist will lengthen the melting season observed by radar. Models that do not account for 2D surface energy balance affecting snow and firn may not account this phenomenon.
Accumulation zone melt-area is likely overestimated by ASCAT because of the coarse spatial resolution of the sensor. The complex terrain of and surrounding mountain glaciers also limits determining the source of the melt signal using coarse resolution remote sensing datasets. It is likely that the subpixel glacier fraction within the ASCAT footprint has a large influence on the radar backscatter response to melt events. The Marsyangdi and Tamor River basins have ASCAT melting areas greater than that predicted by the GDM; here ASCAT is likely attributing melting over areas where glaciers are regularly distributed over mountainous terrain. In the Trishuli River basin, where glaciers are not spatially dense, we find ASCAT observing less melt area than GDM.
Since the ASCAT response to melt onset is strong over much of the glacier accumulation zone, it likely indicates that melting does occur over glaciated areas even though modeling predicts frozen conditions. Accounting for variability in GDM melting (Figure 5) we find that ASCAT observes melting at elevations exceeding that modeled by GDM. Melting driven by shortwave radiation is likely to occur these high elevations in the HMA although surface temperatures are below zero (Litt et al., 2019). With this reason the onset date of ASCAT melting is 31 days earlier and end date of melting is 44 days delayed in Tamor River basin. Very few days are differ in other two river basins; Trishuli and Marsyangdi River basins. It has been demonstrated that much of the water generated from melting over snow and firn is frozen in place and does not contribute to run-off (Meyer and Ian Hewitt, 2017).
Observations of barren landscape and glacier surfaces in the ablation zone are expected to have a lower radar return at C-band frequencies (e.g., König et al., 2002). Without fully polarimetric observations, appreciable signal change with surface melting can be difficult to detect. ASCAT is likely underestimating melting over areas large at elevations below 5000 m a.s.l. because of this limited sensitivity. However, at the basin scale, the ASCAT FTGM dataset and the GDM model results show agreement in seasonal timing of melt onset and freeze-up. It is likely that pronounced variability in slope-aspect effects on the radar backscatter signatures is introduced in the resolution enhancement technique applied to the ASCAT native resolution data thereby affecting observation consistency in complex terrain. Use of high resolution datasets such as provided by Synthetic Aperture Radar may improve characterization of spatial extent and variability and in identifying location of glacier melt.
The contribution of icemelt in river flow estimated by the GDM is comparable to the results obtained by earlier studies. Racoviteanu et al. (2013) used a simple elevation-dependent ice ablation model based on glacier areas from ASTER and IKONOS remote-sensing data combined with hypsometry from the Shuttle Radar Topography Mission to estimate icemelt contribution at 9.5%, which is close to our result of 10.73%, at Betrawati. Using the HBV light model, Bhattarai et al. (2018) found that the contribution of snow and icemelt in river flow was from 27.5 to 33.7% at the Betrawati hydrological station in the Trishuli River basin from 1995 to 2005. When we added snowmelt and icemelt percentages in the river flow at the same station, it was 24.66%, which is also very near to their results. Panday et al. (2013) used the snowmelt runoff model and found that the average contribution of snowmelt in flow in the Tamor River basin at the Majhitar hydrological station from 2002–2006 was 29.7 ± 2.9% (including 4.2 ± 0.9% from snowfall that promptly melts), whereas 70.3 ± 2.6% is attributed to contributions from rainfall. However, the present study using the GDM from 2002 to 2006 showed 9.64% snowmelt and 5.86% icemelt. Such a difference in snowmelt and icemelt may be due to the fact that GDM separately calculates the snowmelt, icemelt, rainfall and baseflow components of river flows rather than considering just two components as the snowmelt runoff model does.
Conclusion
The GDM has been successfully used in three glacierized river basins, Tamor, Trishuli and Marsyangdi in Nepal. The calculated discharges from GDM match the observed discharges from the respective rivers: NSE ranges from 0.69 to 0.81 and volume difference from −7.51% to 4.64%. The maximum snowmelt contribution in river flow is 13.93% in Trishuli River and the minimum 7.8% in Marsyangdi River basin; maximum icemelt contribution is 12.88% in Marsyangdi River basin and the minimum 6.6% in Tamor River basin. The maximum and minimum icemelt contribution in Marsyangdi and Tamor River basin, respectively, is consistent with the maximum and minimum permanent ice cover area in those basins. Similarly, the highest rainfall contribution in river flow is found in Tamor (39.04%) and the lowest in Trishuli (29.9%), and the highest baseflow contribution is in Trishuli River basin (45.44%) and the lowest in Marsyangdi River basin (41.35%). The higher contribution of rainfall in Tamor and Marsyangdi River basins is also consistent with the higher precipitation areas within Nepal. Usually, precipitation is higher in east Nepal and Pokhara area near Marsyangdi River basin. About 62% of Trishuli River basin lies in Tibet, China, in a very low precipitation area, and so rainfall contribution is comparatively lower than in the other two basins.
Comparisons between the GDM icemelt and ASCAT FTGM observations find disparities between the spatial extent areas where ASCAT is sensitive to melting and where GDM is predicting melt. Generally, the ASCAT product is more sensitive to melting over ice-fields in the accumulation zone and less sensitive to melting occurring over barren landscape areas and glacier surfaces in the ablation zone. This difference in sensitivity can lead to spatial mismatch between the GDM model and radar estimates of melting area. Glaciers that are spatially dense, like the Tamor River basin, create better agreement. The timings of glacier-melt in the ASCAT FTGM product match increment predictions from GDM.
Data Availability Statement
The datasets for this manuscript are not publicly available. Requests to access the datasets should be directed to Saket Kumar Karn at aW5mb0BkaG0uZ292Lm5w.
Author Contributions
RK, NS, and SM designed and carried out the research. All co-authors conducted the analyses and wrote the manuscript.
Funding
This work was enabled by the funds provided by the National Aeronautical and Space Administration Earth Science Division’s High Mountain Asia Program. Argonne National Laboratory’s work was supported under interagency agreement, through United States Department of Energy contract DE-AC02-06CH11357. The City College of New York was supported by NASA Award Number NNX16AQ83. Kathmandu University worked as an international collaborator on the NASA project on a no-exchange-of-funds basis.
Conflict of Interest
The authors declare that the research was conducted in the absence of any commercial or financial relationships that could be construed as a potential conflict of interest.
Acknowledgments
The authors thank the Department of Hydrology and Meteorology (DHM), Government of Nepal for providing the hydro-meteorological data for this study. Resolution enhanced ASCAT data were obtained from the NASA sponsored Scatterometer Climate Record Pathfinder at Brigham Young University courtesy of David G. Long.
Footnotes
References
Apollo, M. (ed.) (2017). “The population of Himalayan regions – by the numbers: past, present and future,” in Contemporary Studies in Environment and Tourism, eds R. Efe, and M. Öztürk (Cambridge: Cambridge Scholars Publishing), 143–159.
Baral, P., Kayastha, R. B., Immerzeel, W. W., Pradhananga, N. S., Bhattarai, B. C., et al. (2014). Preliminary results of mass-balance observations of Yala Glacier and analysis of temperature and precipitation gradients in Langtang Valley, Nepal. Ann. Glaciol. 55:2014. doi: 10.3189/2014AoG66A106
Barry, R. G. (2012). Recent advances in mountain climate research. Theoret. Appl. Climatol. 110, 549–553. doi: 10.1007/s00704-012-0695-x
Bevan, S. L., Luckman, A. J., Kuipers, M. P., Hubbard, B., Kulessa, B., and Ashmore, D. W. (2018). Decline in surface melt duration on Larsen C ice shelf revealed by the advanced scatterometer (ASCAT). Earth Space Sci. 5, 578–591. doi: 10.1029/2018ea000421
Bhattarai, S., Zhou, Y., Shakya, N. M., and Zhao, C. (2018). Hydrological modeling and climate change impact assessment using HBV light model: a case study of Narayani River Basin, Nepal. Nat. Environ. Pollut. Technol. 17, 691–702.
Bolch, T., Kulkarni, A., Kääb, A., Huggel, C., Paul, F., Cogley, J. G., et al. (2012). The state and fate of Himalayan Glaciers. Science 336, 310–314. doi: 10.1126/science.1215828
Braithwaite, R. J. (1995). Positive degree-day factors for ablation on the greenland ice sheet studied by energy-balance modelling. J. Glaciol. 41, 153–160. doi: 10.1017/S0022143000017846
Braithwaite, R. J., and Olesen, O. B. (1989). “Calculation of glacier ablation from air temperature, West Greenland,” in Glacier Fluctuations and Climalic Change, ed. J. Oerlemans (Dordrecht: Kluwer Academic Publishers), 219–233. doi: 10.1007/978-94-015-7823-3_15
Cazorzi, F., and Fontana, G. D. (1996). Snowmelt modelling by combining air temperature and a distributed radiation index. J. Hydrol. 181, 169–187. doi: 10.1016/0022-1694(95)02913-3
Douglas, J. S., Huss, M., Swift, D. A., Jones, J. M., and Salerno, F. (2016). Incorporating distributed debris thickness in a glacio-hydrological model: khumbu himalaya, Nepal. Cryosphere Discuss. 1–35. doi: 10.5194/tc-2016-116
Drinkwater, M. R., Long, D. G., and Bingham, A. W. (2001). Greenland snow accumulation estimates from satellite radar scatterometer data. J. Geophys. Res. Atmos. 106, 33935–33950. doi: 10.1029/2001jd900107
Early, D. S., and Long, D. G. (2001). “Image reconstruction and enhanced resolution imaging from irregular samples,” in Proceedings of the IEEE Transactions on Geoscience and Remote Sensing, Piscataway, NJ.
Hock, R. (1999). A distributed temperature-index ice- and snowmelt model including potential direct solar radiation. J. Glaciol. 45, 101–111. doi: 10.1111/j.0435-3676.1999.00089.x
Hock, R. (2003). Temperature index melt modelling in mountain areas. J. Hydrol. 282, 104–115. doi: 10.1016/S0022-1694(03)00257-9
Immerzeel, W. W., Pellicciotti, F., and Bierkens, M. F. P. (2013). Rising river flows throughout the twenty-first century in two Himalayan glacierized watersheds. Nat. Geosci. 6, 742–745. doi: 10.1038/ngeo1896
Immerzeel, W. W., Van Beek, L. P., and Bierkens, M. F. P. (2010). Climate change will affect the Asian water towers. Science 328, 1382–1385. doi: 10.1126/science.1183188
Immerzeel, W. W., van Beek, L. P. H., Konz, M., Shrestha, A. B., and Bierkens, M. F. P. (2012). Hydrological response to climate change in a glacierized catchment in the Himalayas. Clim. Chang. 110, 721–736. doi: 10.1007/s10584-011-0143-4
IPCC, (2007). Summary of Policy Makers, Climate Change 2007. The Physical Science Basis. Contribution of Working Group I to the Fourth Assessment Report of the Intergovernmental Panel on Climate Change. Cambridg: Cambridge University Press.
Juen, I., Kaser, G., and Georges, C. (2007). Modelling observed and future runoff from a glacierized tropical catchment (Cordillera Blanca, Perú). Glob. Planet. Chang. 59, 37–48. doi: 10.1016/j.gloplacha.2006.11.038
Kääb, A., Etienne, B., Nuth, C., Gardelle, J., and Yves, A. (2012). Contrasting patterns of early twenty-first-century glacier mass change in the Himalayas. Nature 488, 495–498. doi: 10.1038/nature11324
Kayastha, R. B., Ageta, Y., and Fujita, K. (2005). Climate and Hydrology in Mountain Areas, eds C. de Jong, D. Collins, and R. Ranzi. Chichester: John Wiley, 7–14.
Kayastha, R. B., Ageta, Y., Nakawo, M., Fujita, K., Sakai, A., and Matsuda, Y. (2003). Positive degree-day factors for ice ablation on four glaciers in the nepalese himalayas and qinghai-tibetan plateau. Bull. Glaciol. Res. 17, 1–10.
Kayastha, R. B., and Shrestha, A. (2019). “Snow and ice melt contribution in the daily discharge of Langtang and Modi Rivers, Nepal,” in Environmental Change in the Himalayan Region, Twelve case Studies, eds A. Saikia, and P. Thapa (Berlin: Springer), doi: 10.1007/978-3-030-03362-0-1
Kayastha, R. B., Takeuchi, Y., Nakawo, M., and Ageta, Y. (2000). “Practical prediction of ice melting beneath various thickness of debris cover on khumbu glacier, nepal, using a positive degree-day factor,” in Proceedings of the International Workshop for Debris-Covered Glaciers, Washington, DC.
König, M., Wadham, J., Winther, J. G., Kohler, J., and Nuttall, A. M. (2002). Detection of superimposed ice on the glaciers Kongsvegen and midre Lovénbreen, Svalbard, using SAR satellite imagery. Ann. Glaciol. 34, 335–342. doi: 10.3189/172756402781817617
Koppes, M., Rupper, S., Asay, M., and Winter-Billington, A. (2015). Sensitivity of glacier runoff projections to baseline climate data in the Indus River Basin. Special Issue on Climate Change Impacts on Water Resources. Front. Earth Sci. 3:59. doi: 10.3389/feart.2015.00059
Lindsey, R. D., and Long, D. G. (2012). “Mapping surface oil extent from the deepwater horizon oil spill using ASCAT backscatter,” in Proceedings of the IEEE Transactions on Geoscience and Remote Sensing, Piscataway, NJ.
Litt, M., Wagnon, J. S. P., Koch, J. S. I., Stigter, E., and Immerzeel, W. (2019). Glacier ablation and temperature indexed melt models in the Nepalese Himalaya. Sci. Rep. 9:5264. doi: 10.1038/s41598-019-41657-5
Luo, Y., Arnold, J., Allen, P., and Chen, X. (2012). Baseflow simulation using SWAT model in an inland river basin in Tianshan Mountains, Northwest China. Hydrol. Earth Syst. Sci. 16, 1259–1267. doi: 10.5194/hess-16-1259-2012
Lutz, A. F., Immerzeel, W. W., Kraaijenbrink, P. D., Shrestha, A. B., and Bierkens, M. F. (2016). Climate change impacts on the upper indus hydrology: sources, shifts and extremes. PLoS One 11:e0165630. doi: 10.1371/journal.pone.0165630
Martinec, J., and Rango, A. (1986). Parameter values for snowmelt runoff modelling. J. Hydrol. 84, 197–219. doi: 10.1016/0022-1694(86)90123-x
Meyer, C. R., and Ian Hewitt, J. (2017). A continuum model for meltwater flow through compacting snow. Cryosphere 11, 2799–2813. doi: 10.5194/tc-11-2799-2017
Nash, J. E., and Sutcliffe, J. V. (1970). River flow forecasting through conceptual models part I — A discussion of principles. J. Hydrol. 10, 282–290. doi: 10.1016/0022-1694(70)90255-6
Nghiem, S. V., Steffen, K., Kwok, R., and Tsai, W. Y. (2001). Detection of snowmelt regions on the Greenland ice sheet using diurnal backscatter change. J. Glaciol. 47, 539–547. doi: 10.3189/172756501781831738
Panday, P. K., Williams, C. A., Frey, K. E., and Brown, M. E. (2013). Application and evaluation of a snowmelt runoff model in the Tamor River basin, Eastern Himalaya using a Markov Chain Monte Carlo (MCMC) data assimilation approach. Hydrol. Process. 28, 5337–5353. doi: 10.1002/hyp.10005
Parry, V., Nienow, P., Mair, D., Scott, J., Hubbard, B., Steffen, K., et al. (2007). Investigations of meltwater refreezing and density variations in the snowpack and firn within the percolation zone of the Greenland ice sheet. Ann. Glaciol. 46, 61–68. doi: 10.3189/172756407782871332
Racoviteanu, A. E., Armstrong, R., and Williams, M. W. (2013). Evaluation of an ice ablation model to estimate the contribution of melting glacier ice to annual discharge in the Nepal Himalaya. Water Resour. Res. 49, 5117–5133. doi: 10.1002/wrcr.20370
Reid, T. D., and Brock, B. W. (2010). An energy-balance model for debris-covered glaciers including heat conduction through the debris layer. J. Glaciol. 56, 903–916. doi: 10.3189/002214310794457218
Ren, Z., and Su, F. (2018). A coupled glacier-hydrology model and its application in eastern pamir. J. Geophys. Res. 123, 692–713. doi: 10.1029/2018JD028572
Rignot, E. (1995). Backscatter model for the unusual radar properties of the Greenland ice sheet. J. Geophys. Res. Planet 100, 9389–9400.
Sam, L., Bhardwaj, A., Singh, S., and Kumar, R. (2016). Remote sensing flow velocity of debris-covered glaciers using Landsat 8 data. Prog. Phys. Geogr. 40, 305–321. doi: 10.1177/0309133315593894
Singh, P., and Kumar, N. (1997). Impact assessment of climate change on the hydrological response of a snow and glacier melt runoff dominated Himalayan river. J. Hydrol. 193, 316–350. doi: 10.1016/S0022-1694(96)03142-3
Steiner, N., and McDonald, K. C. (2018). High Mountain Asia ASCAT Freeze/Thaw/Melt Status, Version 1. [Indicate Subset Used]. Boulder, CO: NASA National Snow and Ice Data Center Distributed Active Archive Center.
Steiner, N., and Tedesco, M. (2014). A wavelet melt detection algorithm applied to enhanced resolution scatterometer data over Antarctica (2000-2009). Cryosphere 8, 25–40. doi: 10.5194/tc-8-25-2014
Tahir, A. A., Chevallier, P., Arnaud, Y., and Ahmad, B. (2011). Snow cover dynamics and hydrological regime of the hunza river basin, karakoram range, Northern Pakistan. Hydrol. Earth Syst. Sci. 15, 2275–2290. doi: 10.5194/hess-15-2275-2011
Takeuchi, Y., Renji, N., and Pedro, S. (1996). Annual air-temperature measurement and ablation estimate at moreno glacier, Patagonia. Bull. Glacier Res. 14, 23–28.
Wagnon, P., Linda, A., Arnaud, Y., Kumar, R., Sharma, P., Vincent, C., et al. (2007). Four Years of Mass Balance on Chhota Shigri Glacier, Himachal Pradesh, India, a new benchmark glacier in the western Himalaya. J. Glaciol. 53, 603–611. doi: 10.3189/002214307784409306
Keywords: glacio-hydrological model, degree-day factor, snow and ice melt, discharge, advanced scatterometer
Citation: Kayastha RB, Steiner N, Kayastha R, Mishra SK and McDonald K (2020) Comparative Study of Hydrology and Icemelt in Three Nepal River Basins Using the Glacio-Hydrological Degree-Day Model (GDM) and Observations From the Advanced Scatterometer (ASCAT). Front. Earth Sci. 7:354. doi: 10.3389/feart.2019.00354
Received: 30 April 2019; Accepted: 19 December 2019;
Published: 21 January 2020.
Edited by:
Summer Rupper, The University of Utah, United StatesReviewed by:
Richard Robert Forster, The University of Utah, United StatesArthur Lutz, FutureWater, Netherlands
Copyright © 2020 Kayastha, Steiner, Kayastha, Mishra and McDonald. This is an open-access article distributed under the terms of the Creative Commons Attribution License (CC BY). The use, distribution or reproduction in other forums is permitted, provided the original author(s) and the copyright owner(s) are credited and that the original publication in this journal is cited, in accordance with accepted academic practice. No use, distribution or reproduction is permitted which does not comply with these terms.
*Correspondence: Rijan Bhakta Kayastha, cmlqYW5Aa3UuZWR1Lm5w
 Rijan Bhakta Kayastha
 Nicholas Steiner
 Rakesh Kayastha
 Shruti K. Mishra
 Kyle McDonald
