- 1Geology Division, School of Science and Technology, University of Camerino, Camerino, Italy
- 2Reservoir Characterization Project (www.rechproject.com), Camerino, Italy
- 3GeoMore s.r.l., Camerino, Italy
- 4Elettra-Sincrotrone Trieste S.C.p.A., Trieste, Italy
- 5The ‘Abdus Salam’ International Centre for Theoretical Physics, Trieste, Italy
- 6Forman Christian College University, Physics Department, Lahore, Pakistan
- 7Laboratory for Neutron Scattering and Imaging, Paul Scherrer Institut, Villigen, Switzerland
The textural and geometrical properties of the pore networks (i.e., such as pore size distribution, pore shape, connectivity, and tortuosity) provides a primary control on the fluid storage and migration of geofluids within porous carbonate reservoirs. These properties are highly variable because of primary depositional conditions, diagenetic processes and deformation. This issue represents an important challenge for the characterization and exploitation plan in this type of reservoirs. In this study, the complementary properties of neutrons and X-ray experiments are carried out to better understand the effects of pore network properties on the hydraulic behavior of porous carbonates. Neutrons have unique properties and are particularly suitable for this study due to the sensitivity of neutrons to hydrogen-based fluids. The used methodology combines dynamic neutron radiography (NR), integrated X-ray and neutron tomography (XCT, NCT), and computational fluid dynamics simulations (lattice-Boltzmann method) of porous carbonate reservoir analogs from central and southern Italy. Dynamic 2D NR images provide information regarding the fluid transport and the wetting front dynamics related to the effect of heterogeneities (e.g., fractures and deformation bands) at the microscale. The combination of NCT (dry and wet samples) and XCT (dry), generates more information regarding the effective pore space contribution to fluid flow. The fluid flow simulations generate information about the connected pore network and the permeability evaluated rock sample at saturated condition.
Introduction
Porous carbonate rocks constitute important reservoirs for water and hydrocarbons. The characterization in terms of fluid storage and migration of these reservoirs is challenging because of their petrophysical variability related to both depositional environment and subsequent diagenetic processes (e.g., dissolution, cementation, mineral replacement, deformation). A microstructural analysis of the rocks provides a better understanding of reservoir quality, decreasing both uncertainty and risk.
In general, the microscale assessment of rocks is based on two-dimensional (2D) microscopy techniques (e.g., Tondi et al., 2006; Tondi, 2007), however three-dimensional (3D) approaches such as X-ray and neutron tomography (XCT and NCT, respectively) are becoming more popular for evaluation in the oil industry due to their non-destructive nature. Recent investigations of carbonate rocks have focused on evaluating the internal architecture and their impact on fluid flow in porous samples at the microscale by the integration of X-ray microtomography image analysis (Blunt et al., 2013; Cilona et al., 2014; Ji et al., 2015; Arzilli et al., 2016; Baud et al., 2017; Voltolini et al., 2017; Zambrano et al., 2017; Kaminskaite et al., 2019; Riegel et al., 2019) and computational fluid dynamics (Zambrano et al., 2018).
Neutrons with their peculiar properties (such as ability to penetrate metals) and sensitivity to hydrogen (Schillinger et al., 2000), offer a valuable tool for such studies related to flow problems like capillarity-driven (e.g., Cnudde et al., 2008) or pressure-driven flow (e.g., Yehya et al., 2018). Several studies have used Neutron radiation images to characterize the porosity, moisture, and water absorption in different materials such as concrete (De Beer et al., 2005; Kanematsu et al., 2009; Zhang et al., 2010, 2011; Yehya et al., 2018), steel (Zawisky et al., 2010), building stones (Hameed et al., 2006, 2009; Cnudde et al., 2008; Zawisky et al., 2010; Dewanckele et al., 2014), porous asphalt (Lal et al., 2014), sandstones (De Beer and Middleton, 2006; Hall, 2013), clay-rock (Stavropoulou et al., 2019), dehydration of molding sand (Schillinger et al., 2011), and cultural heritage artifacts (Fedrigo et al., 2018; Schillinger et al., 2018).
X-rays being electromagnetic in nature, interact mainly with the electrons of an atom and their interaction with matter depends on the atomic number and density. Therefore, information on the elemental or chemical composition of the studied sample is not directly obtained using X-ray CT. In the case of fluid content, X-ray requires a contrast agent (e.g., iodine or bromine solutions) that may modify the rock under investigation (Cnudde et al., 2008). On the other hand, the use of Neutron radiations permits to use a less reactive fluid (e.g., deionized water). In contrast to X-rays, neutrons are neutral particles and therefore interact with the atomic nucleus. Neutron interaction thus does not have any relationship with the atomic number. The main advantages of neutrons are their high penetration and also their sensitivity to isotopes of the same element (Anderson et al., 2009).
Concerning the physics behind the methods, the XCT method is based on the attenuation of X-rays passing through a material (Bultreys et al., 2016), expressed by the Lambert–Beer law:
here, the transmitted X-ray intensity I is a function of the incident intensity I0 and the linear attenuation coefficient μ(s) along the raypaths. Neutron imaging is based on the interactions of neutrons with matter. Despite this is a quantum mechanical interaction, we can consider it as a classical particle interaction and express neutron attenuation with Eq. 2 (Anderson et al., 2009).
This equation is based on the assumption that a collimated beam of neutrons is incident on a thin sample of thickness x cm. Ii is the incident neutron flux, I(x) is the neutron flux transmitted after interaction with the sample. The units in both cases being cm–2s–1. n is the number density of atoms (in the sample) and units are atoms cm–3. σis the microscopic cross-section (the effective interaction area for the neutron with a nucleus), the units being cm2. A conventional unit for the microscopic cross-section is the barn 10–24 cm2. The product of n and σ gives the macroscopic cross-section Σ with units cm–1. Since samples can be composed of several elements and isotopes, a summation has to be performed over all the elements and isotopes as shown in Eq. 3.
Hence, the attenuation equation is now given by Eq. (4)
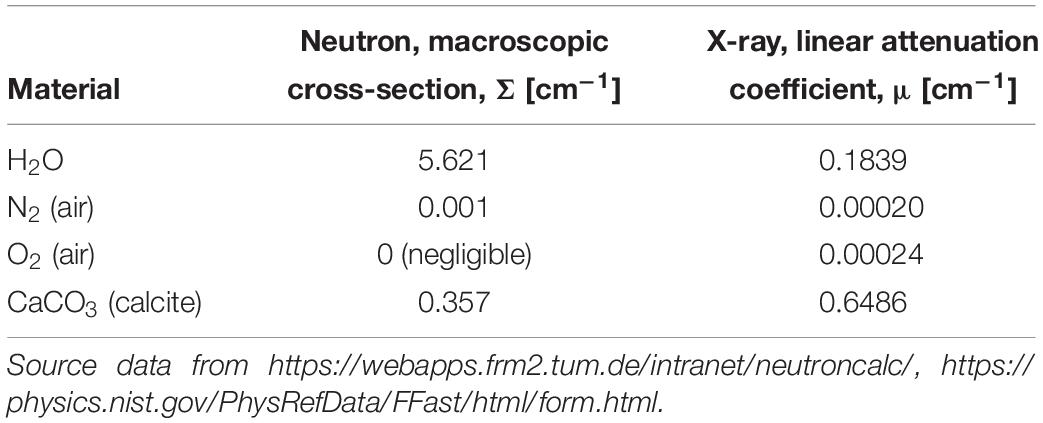
The sensibility (attenuation ratios) of both tomographic techniques, Neutron and X-ray, to the different phases (solid and fluid) involved in the study of carbonates are shown in terms of cross-sections of the studied materials (Table 1). The cross-section can be defined as the likelihood of the interaction of an incident particle beam (e.g., neutrons and X-rays) with a target object (e.g., sample). In this case the neutron cross-section is given by Σ (macroscopic cross-section), and the X-ray cross-section is given by the linear attenuation coefficient μ. In the case of Neutron, the attenuation contrast between the fluid phases (water and air) is more significant that for the X-rays. Similarly, the neutrons radiation can provide a better contrast between water and carbonate rock (mainly CaCO3).
The general aim of this work is to map imbibition and saturation during imposed constant flux experiments (forced imbibition) in porous carbonate rocks. In addition, single-phase flow is evaluated as a complement of the laboratory experiment to cover the saturated conditions. In order to do that, this work integrates four different experiments: (1) Constant-flux dynamic NR, (2) XCT at dry conditions, (3) NCT at dry and wet (water saturated) conditions, and (4) Single-phase Lattice-Boltzmann simulations at saturated conditions.
Studied samples correspond to the Orfento (Maiella Mountain, Italy) and Favignana (Sicily, Italy) grainstones, which are important reservoirs for water and oil in Central and Southern Italy and have been widely studied from the macro (e.g., Tondi et al., 2006, 2016; Tondi, 2007; Antonellini et al., 2014) to the microscale (e.g., Baud et al., 2009; Zhu et al., 2010; Cilona et al., 2012; Ji et al., 2015; Arzilli et al., 2016; Zambrano et al., 2017, 2018). According to these authors, the studied rocks can be affected by both deformation features (i.e., fractures and deformation bands) and diagenesis (i.e., dissolution and cementation of calcite) causing some heterogeneities in the pore network.
The first aim of this work is to map the wetting front as a function of time through the studied rocks by means of constant-flux dynamic NR. By fixing the flux rate, the experiment represents a forced imbibition where the saturation of the wetting phase (deionized water) will increase during the time replacing the non-wetting phase (air). Since samples are initially dry, a significant capillarity driven flow is expected. Capillary forces control the spontaneous absorption, migration and retention of fluids in porous materials. Since both capillary force and velocity of capillary rise are controlled by pore network properties (e.g., porosity, average pore radius, connectivity) in complex pore-network geometries, the implementation of dynamic image experiments may help to better understand these processes (e.g., Cnudde et al., 2008). The interaction of capillary forces with heterogeneities (different pore structure) produces local variation of the saturation during immiscible displacement experiments (Chang and Yortsos, 1992). This phenomenon is called capillary heterogeneity and it is evaluated by the spatial variability of the capillary pressure-saturation function (Chaouche et al., 1994; Huang et al., 1995; Hejazi et al., 2019). The capillarity heterogeneity has been a topic of recent investigation in heterogeneous carbonates by combining experimental and numerical characterization of the capillary pressure (Hejazi et al., 2019). Despite we did not provide measures of capillarity pressure, our results may provide information about the imbibition front velocity and relative wetting phase saturation during time.
It is expected that during imbibition process in a dry porous material some air/gas will be trapped and eventually diffused into the wetting fluid (Cnudde et al., 2008). Therefore, the second aim of this work is to investigate the distribution of pores and fluid phases (i.e., air, deionized water) after the imbibition experiments. To do that, neutrons and X-ray tomographic techniques are integrated benefiting from their complementary properties. The X-rays are suitable for the grain distribution and pores, whereas neutrons provide a good contrast among the different phases. The last aim of this work is to investigate the fluid flow at saturated conditions which have been covered by performing computational fluid dynamics experiments. Direct flow simulations are ordinarily used to investigate single phase flow and transport in complex porous media (e.g., Blunt et al., 2013; Bultreys et al., 2016, and references therein). As an alternative to classical computational fluid dynamics approaches (finite difference, finite element method, finite volume method), the lattice-Boltzmann method (LBM) is well-established for modeling flow in complex geometries without need of any simplification (e.g., De Rosis, 2014; Ren et al., 2016; Yang et al., 2016; Benioug et al., 2017; Xie et al., 2017). The LBM describes the flow of a large number of particles interacting with the medium and among themselves following the Navier-Stokes equation at the macroscopic scale (Ladd, 1994). The LBM has been used to investigate transport and to compute permeability using as input 3D X-ray micro-CT images of rocks and soft sediments (e.g., Degruyter et al., 2010; Khan et al., 2012; Andrä et al., 2013; Shah et al., 2016; Zambrano et al., 2018) showing a good agreement with laboratory measurements over a wide range of permeability values (e.g., Keehm et al., 2004; Zambrano et al., 2018). The simplest LBM is based on the Bhatnagar-Gross-Krook (BGK) collision operator, which consists of a single relaxation time approximation (Bhatnagar et al., 1954). A more accurate alternative is the implementation of multiple relaxation times (MRTs) methods, which are more stable and solve the drawbacks (e.g., results depends on viscosity) of the BGK method (e.g., d’Humières, 1992; d’Humières et al., 2002).
The main interest of this study is related to enhanced gas recovery by imbibition process and residual gas saturation. However, the methodology is also relevant to applications like moisture assessment in construction stones.
Materials and Methods
Samples
In this work, porous carbonate rocks from Maiella Mountain (Abruzzo, Italy) and Favignana Island (Sicily, Italy) were investigated. The Favignana grainstones (Early Pleistocene in age) consist of well-preserved bioclasts composed of Vermetus, Serpula, bivalves, echinoids, red algae, and corals ranging in size from submillimeter to centimeter (Tondi et al., 2012). The host rock is poorly cemented with the cement limited to the grain contacts, around echinoids, or within intragranular pores (Tondi et al., 2012). Its pore-network is mainly composed of well-connected intergranular pores characterized by a dominant diameter ranging between 100 and 400 μm (Tondi, 2007). In addition, isolated porosity is represented by intragranular space within the bioclast (Zambrano et al., 2017). The Favignana grainstones experienced a shallow burial depth of approximated 30 m (Tondi et al., 2012; Antonellini et al., 2014). The carbonate grainstones from the Maiella Mountain (Campanian to Maastrichtian in age), here after called Orfento grainstones, mainly consist of rudist fragments interpreted as a package of proximal bioclastic turbidites (Mutti, 1995). Detailed X-ray micro-CT analyses indicated that the pore space is characterized by both micro- and macro- pores (Tondi et al., 2006; Ji et al., 2015; Zambrano et al., 2017), however permeability is mainly controlled by pores with diameter larger than ca. 10 μm (Zambrano et al., 2018). These rocks experienced a maximum burial depth between 0.5 and 3 km (Ori et al., 1986; Graham et al., 2003; Rustichelli et al., 2016).
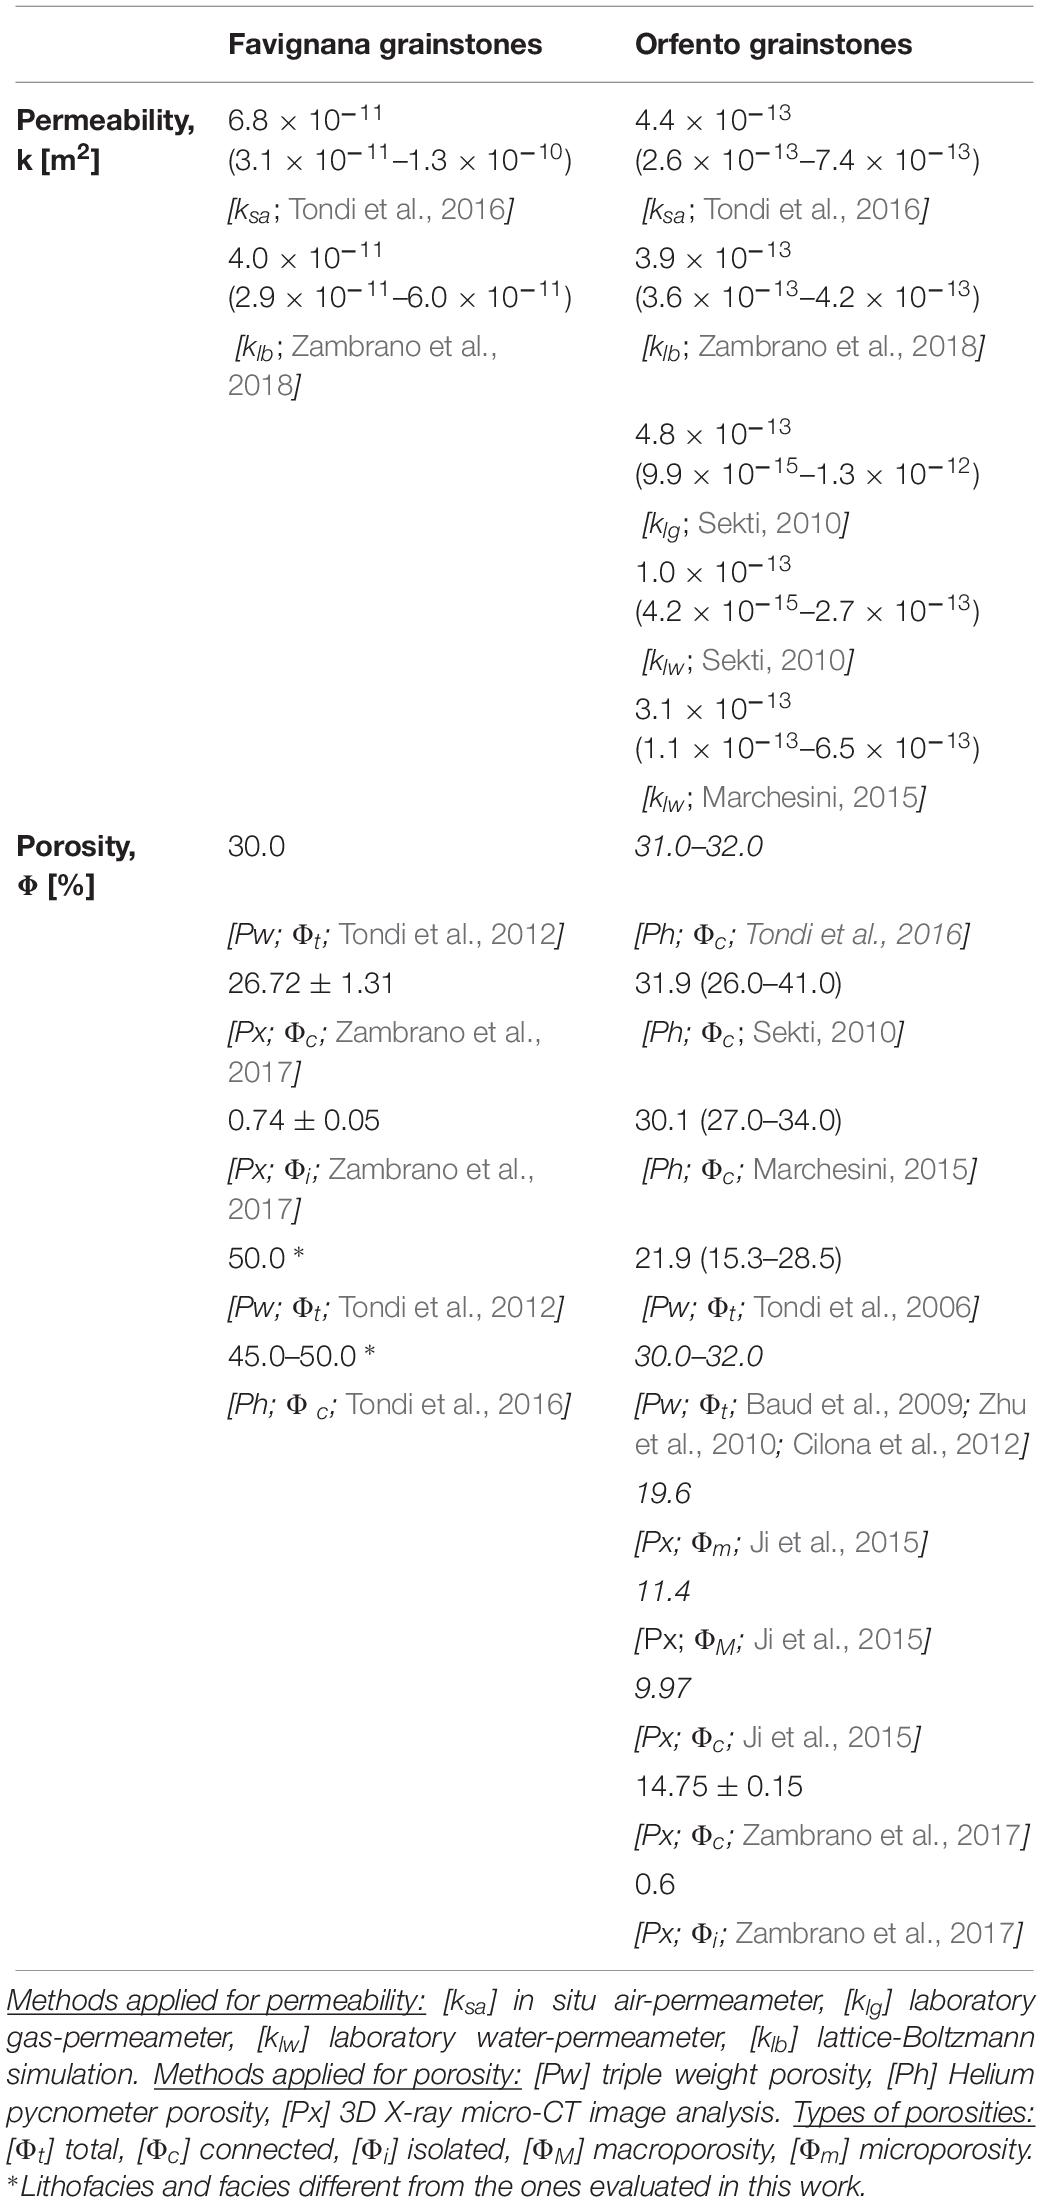
In general, both rocks have similar total porosity values (near 30%), however their permeability differs by two orders of magnitude (for details see Table 2). Zambrano et al. (2017, 2018) have explained these differences in permeability as related to diverse values of connected porosity, connectivity, pore size distribution, and tortuosity. In fact, the connected porosity observed by means of X-ray micro-CT (pixel size 9 μm) for the Favignana grainstones is near 27%, whereas the Orfento grainstones is less than 15% (Zambrano et al., 2017). Also, connectivity density (a value representing the number of redundant connections between pores) is higher for the Favignana grainstones. On the other hand, the specific surface area is greater (indicating a smaller grain size) for the Orfento grainstone (near 79.6 mm–2) in comparison to the Favignana one (18.1–38.1 mm–2). Moreover, the tortuosity is almost double for the Orfento grainstones in front of the Favignana one (Zambrano et al., 2018).
For the experiments, cylindrical samples were prepared with a diameter of 10 and 20 mm in height (Figure 1). These dimensions were chosen so that the cross-sectional water thickness would not be greater than 5 mm in order to get suitable neutron transmission. Considering the previous reported porosity (Table 2), it was estimated a maximum water thickness of 4.5 mm. Samples were placed in cylindrical holders made from Polytetrafluoroethylene (PTFE), commercially known as Teflon, with 12 mm of inner diameter closing the remaining space between sample and holder with Teflon tape. The choice of Teflon, for both sample holder and tape, was due to its suitability for both neutron and X-ray imaging (Domanus, 19921). The water container was attached to a rotation stage by means of an adapter that allows the connection of a pipe for water without interfering with the experiment.
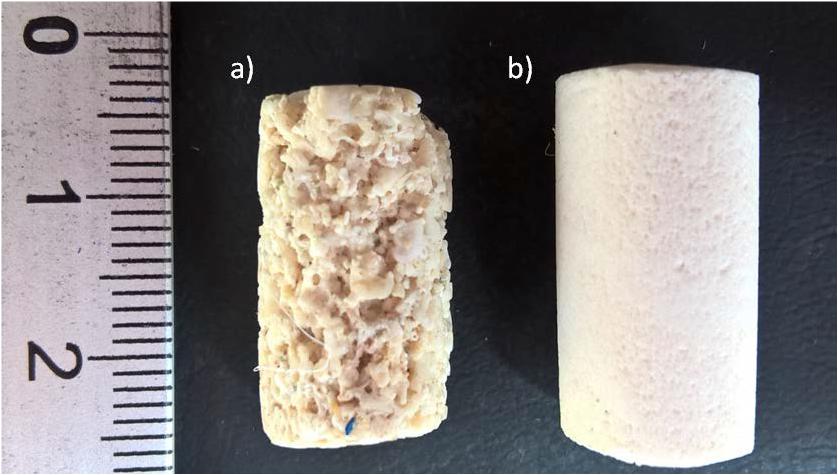
Figure 1. Studied samples are made of carbonate grainstones. (a) Favignana grainstones (b) Orfento Grainstones, characterized by different texture and permeability (Table 1). Samples have a diameter of about 10 mm with a height of about 20 mm.
Experimental Setup
The experiments were performed at the beamline for Imaging with COld Neutrons (ICON) at Swiss spallation neutron source (SINQ) of the Paul Scherrer Institut (PSI2) in Switzerland. Details of the ICON facilities and available instrumentations have been described by Kaestner et al. (2011). Bimodal imaging was performed using neutrons and X-rays, sequentially. The schematic layout is given in Figure 2a (Kaestner et al., 2017) and a photo of the setup is given in Figure 2b (Kaestner et al., 2016).
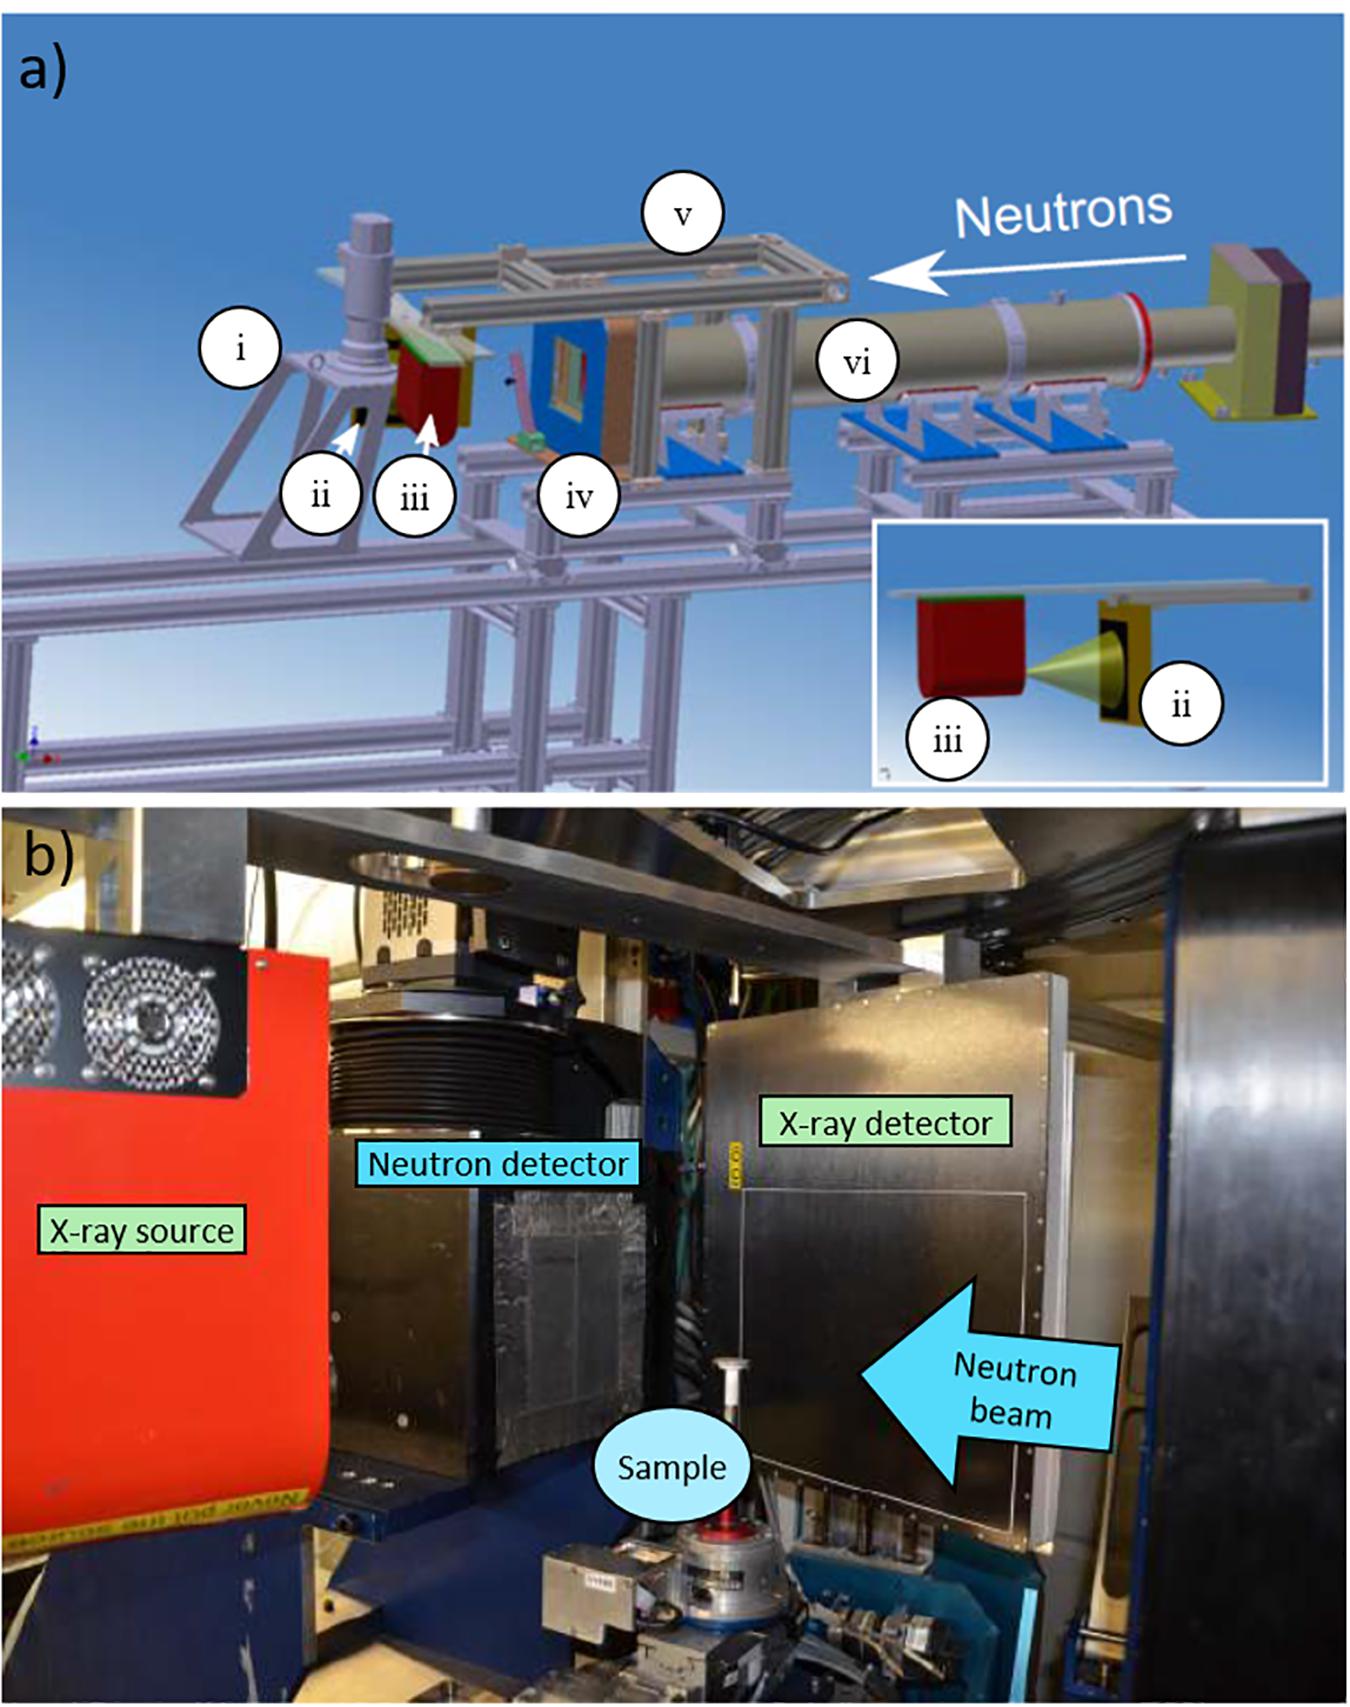
Figure 2. Experimental setup. (a) A view showing the arrangement of the neutron source and detector and also the X-ray source and detector used for bimodal imaging (Kaestner et al., 2017). In detail, (i) Neutron camera detector, (ii) Flat panel detector, (iii) X-ray source, (iv) Neutron beam limiter, (v) Frame for X-ray beamline, and (vi) Neutron flight tubes. (b) A photograph showing the arrangement that was used for neutron and X-ray imaging (Kaestner et al., 2016).
Neutron Imaging Experimental Setup
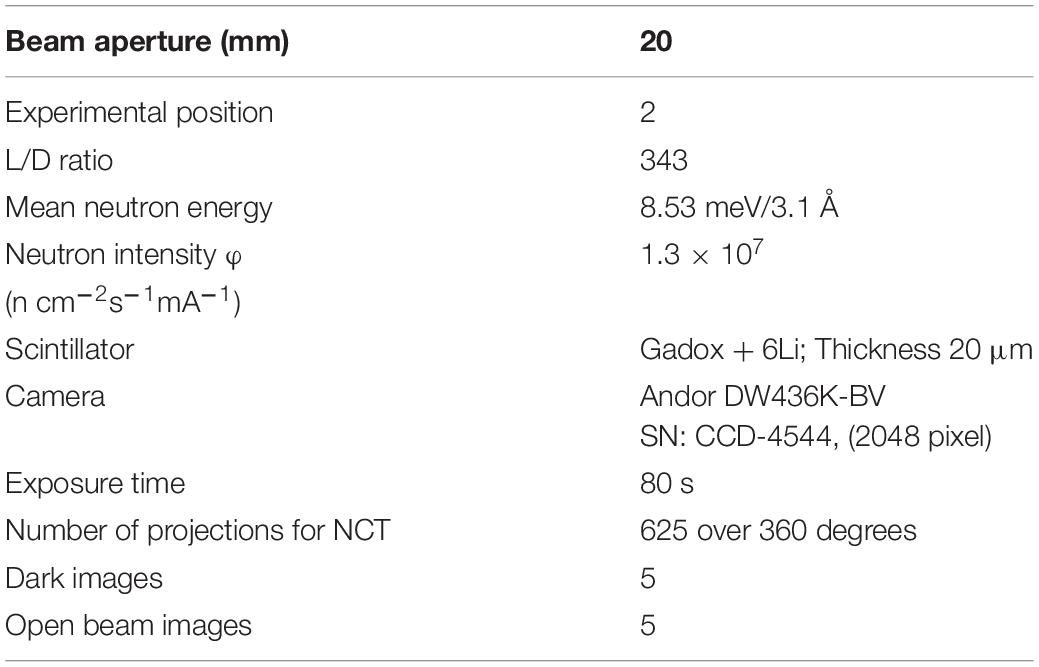
Neutrons were used for two-dimensional (2D) dynamic neutron radiography (NR) and three-dimensional (3D) neutron computed tomography (NCT measurements). These experiments were carried out at position number 2 at the ICON instrument (Kaestner et al., 2011). The parameters for these measurements are given reported in Table 3.
X-Ray Imaging Experimental Setup
Bimodal imaging was performed using neutrons and X-rays. Figures 2a,b illustrate the experimental setup. The X-ray source delivers a polychromatic cone-beam. The specifications of the X-ray source and detector are given in Table 4. In our case, XCT was performed at a voltage of 80 kV, a current of 200 μA and X-ray spot size was 5 μm. The detection system used for XCT in this case was the same as that used for the NCT. The source-to-detector distance was 185 mm while the source-to-object distance was 165 mm. A set of 625 projections over a total scan angle of 360° was acquired with an exposure time/projection of 40 s. A total of 10 dark-field and 10 flat-field images we acquired prior to the tomographic scan acquisition.
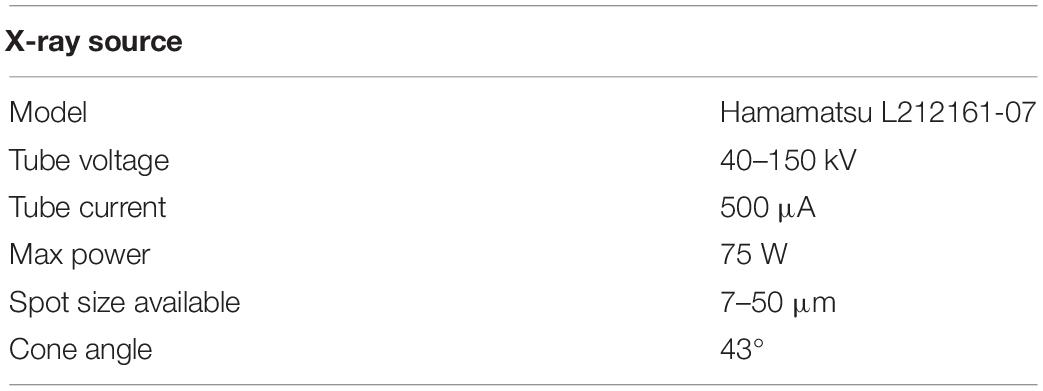
Table 4. X-ray imaging parameters for bimodal imaging at ICON (Kaestner et al., 2017).
Dynamic Neutron Radiography
Time-lapsed or dynamic NR was performed for two different samples pertaining to Favignana and Orfento grainstones. Similar to Cnudde et al. (2008), we have performed a dynamic NR experiments to investigate the position of the wetting front as a function of time. Our experiments differ from Cnudde et al. (2008) in that we did not use the gravity as force for triggering the flow, instead we used only constant flux rate (forced imbibition). In order to introduce deionized water into the system, a dual syringe pump (Pharmacia P-500) was used with a flow rate set to 1 ml/h. The pumping device can provide a maximum pressure of 5.0 MPa. Since the studied samples are highly porous and pervasive, it was expected (and tested) that the threshold pressure was not be reached during the experiments.
The output data consist of a time series of 2D NR images. With the aim to map the dynamic flow front in each sample, at the selected flow rate, about 26 neutron radiographs (one radiograph every 90 s) were acquired until the sample was filled with water. For corrections, 5 images of dark current, 5 flat field beam images, and a radiograph of the dry sample were taken before the experiment started. To indicate the presence of water, the original dry condition image is subtracted to radiograph to the n-time radiograph. During the processing, the noise was removed with a median filter by using the freeware ImageJ (Schneider et al., 2012).
For estimating a pseudo water saturation trough time, a series of profiles were made in each photograph. The first intention of this analysis is to roughly estimate the advancement of water flow and to distinguish important heterogeneities within the samples. The pseudo water saturation was estimated by processing the raw data Xawr voxel by voxel following the equation (partially modify) proposed by Riaz et al. (2007):
Where the subscripts ar and wr refer to air-filled and water-filled rock, respectively. The first case corresponds to images taken before the flow started (dry condition), whereas the water-filled stage was arbitrary selected as the time when the water started to spill out of the sample. The rate of water volume injected into the sample is given by the flux rate of the pump. In comparison, it was estimated the fraction of water within the invaded volume of rock a certain time. This data is useful to distinguish when the imbibition is dominated by capillarity forces or the constant flux rate.
Dual Modality XCT and NCT Imaging
For the static tomographic experiments, a single sample corresponding to Favignana grainstones was selected. This approach consists of three steps: (1) XCT of a sample in dry condition, (2) NCT of the same sample in dry, and (3) wet conditions (water-filled).
An XCT scan was recorded with a pixel size of 13.5 μm. A set of 375 projections were taken over 360 degrees with air on both sides of the sample. The exposure time per projection was 30 s. For the NCT at dry and wet conditions, the pixel size was also set to 13.5 μm. A total of 625 projections were planned over 360°; however, for the dry case the acquisition was stopped after about 280 degrees due to time limitations. The exposure time was 80 s per projection. Before every CT scan, 5 dark current and 5 open beam images were acquired.
The reconstruction was done by the Octopus 8.8 software (Vlassenbroeck et al., 2006). The beam was chosen as having a cone-beam geometry although it was nearly parallel, but this option was better as the beam is slightly divergent. Then, the noise was removed using a 3D Median filter in ImageJ. Ring artifacts on the reconstructed slices were removed using the modified Sijbers & Postonov algorithm (Brun et al., 2011) which is part of the Pore3D software library (Brun et al., 2010; Zandomeneghi et al., 2010). For the NCT with incomplete projections, the MuhRec tomographic reconstruction software was used (Kaestner, 2011). The filtering of the data was done using the ISS filter in KipTool (the in-house developed image processing tool at ICON).
For the segmentation of the X-ray images in dual components, voids, and solid phase (framework grains and cement), the automatic multiphase k-means clustering algorithm (Hartigan, 1975; Hartigan and Wong, 1979) was used. The algorithm was set to 4 classes and implemented twice in order to get most of the visible pores. Results are binary images composed of voids and grains. After this, the tool ‘Find Connected Structures’ of the open source Fiji software (Schindelin et al., 2012) was used for dividing the pore space into two components: (i) connected pores and (ii) isolated pores. For the simulations, only the connected pore networks were used for facilitating the computation.
Considering the attenuation factors for the different studied phases (water, air, and carbonate rock; Table 1), a rough indicator of the water content was founded by using the difference of NCT wet-dry images. In the gray color intensity scale, wet zones tend to have a more whitish color in comparison to air or carbonate rock. Therefore, warmer colors indicate a higher saturation of water.
Lattice-Boltzmann Method and Permeability Calculation
Since the laboratory experiments were performed on dry samples, Lattice-Boltzmann simulations were useful to investigate the flow at saturated condition. The simulations were executed by means of the open-source computational fluid dynamics software PALABOS (Latt, 2009) using the methodology introduced by Degruyter et al. (2010) and later modified by Zambrano et al. (2018). The methodology consists of imposing a single-phase fluid flow through the segmented 3D images by maintaining a fixed pressure gradient between the inlet and outlet faces of the volume, while the rest of the faces were padded. The interface pore-voids was converted to bounce-back boundary conditions. The main difference with the methodology proposed by Degruyter et al. (2010) is the replacement of the collisional operator BGK by an MRT (d’Humières et al., 2002) with a D3Q19 lattice, which guarantees results viscosity independent (Zambrano et al., 2018). The steady state condition of the simulation is considered after the standard deviation of the average energy falls blow 10–4 after 1000 time-steps, Degruyter et al., 2010). After that, the permeability component parallel to the imposed flow can be computed applying the Darcy’s law,
where, δP/δx is the pressure gradient, μ the fluid kinematic viscosity, and U the average fluid velocity per unit of area. All the variables are handled in lattice units before the permeability computation, results are transformed to SI units multiplying by the effective length of the voxel side in meters.
Results
Dynamic Neutron Radiography
The results of the experiment consist of a series of time lapse neutron radiographs obtained at a time interval of 90 s indicating the flow front trough time (Figures 3, 4). In addition, longitudinal profiles, flow front progression and water saturation graphs were plotted to show the results in a more quantitative manner (Figures 5, 6).
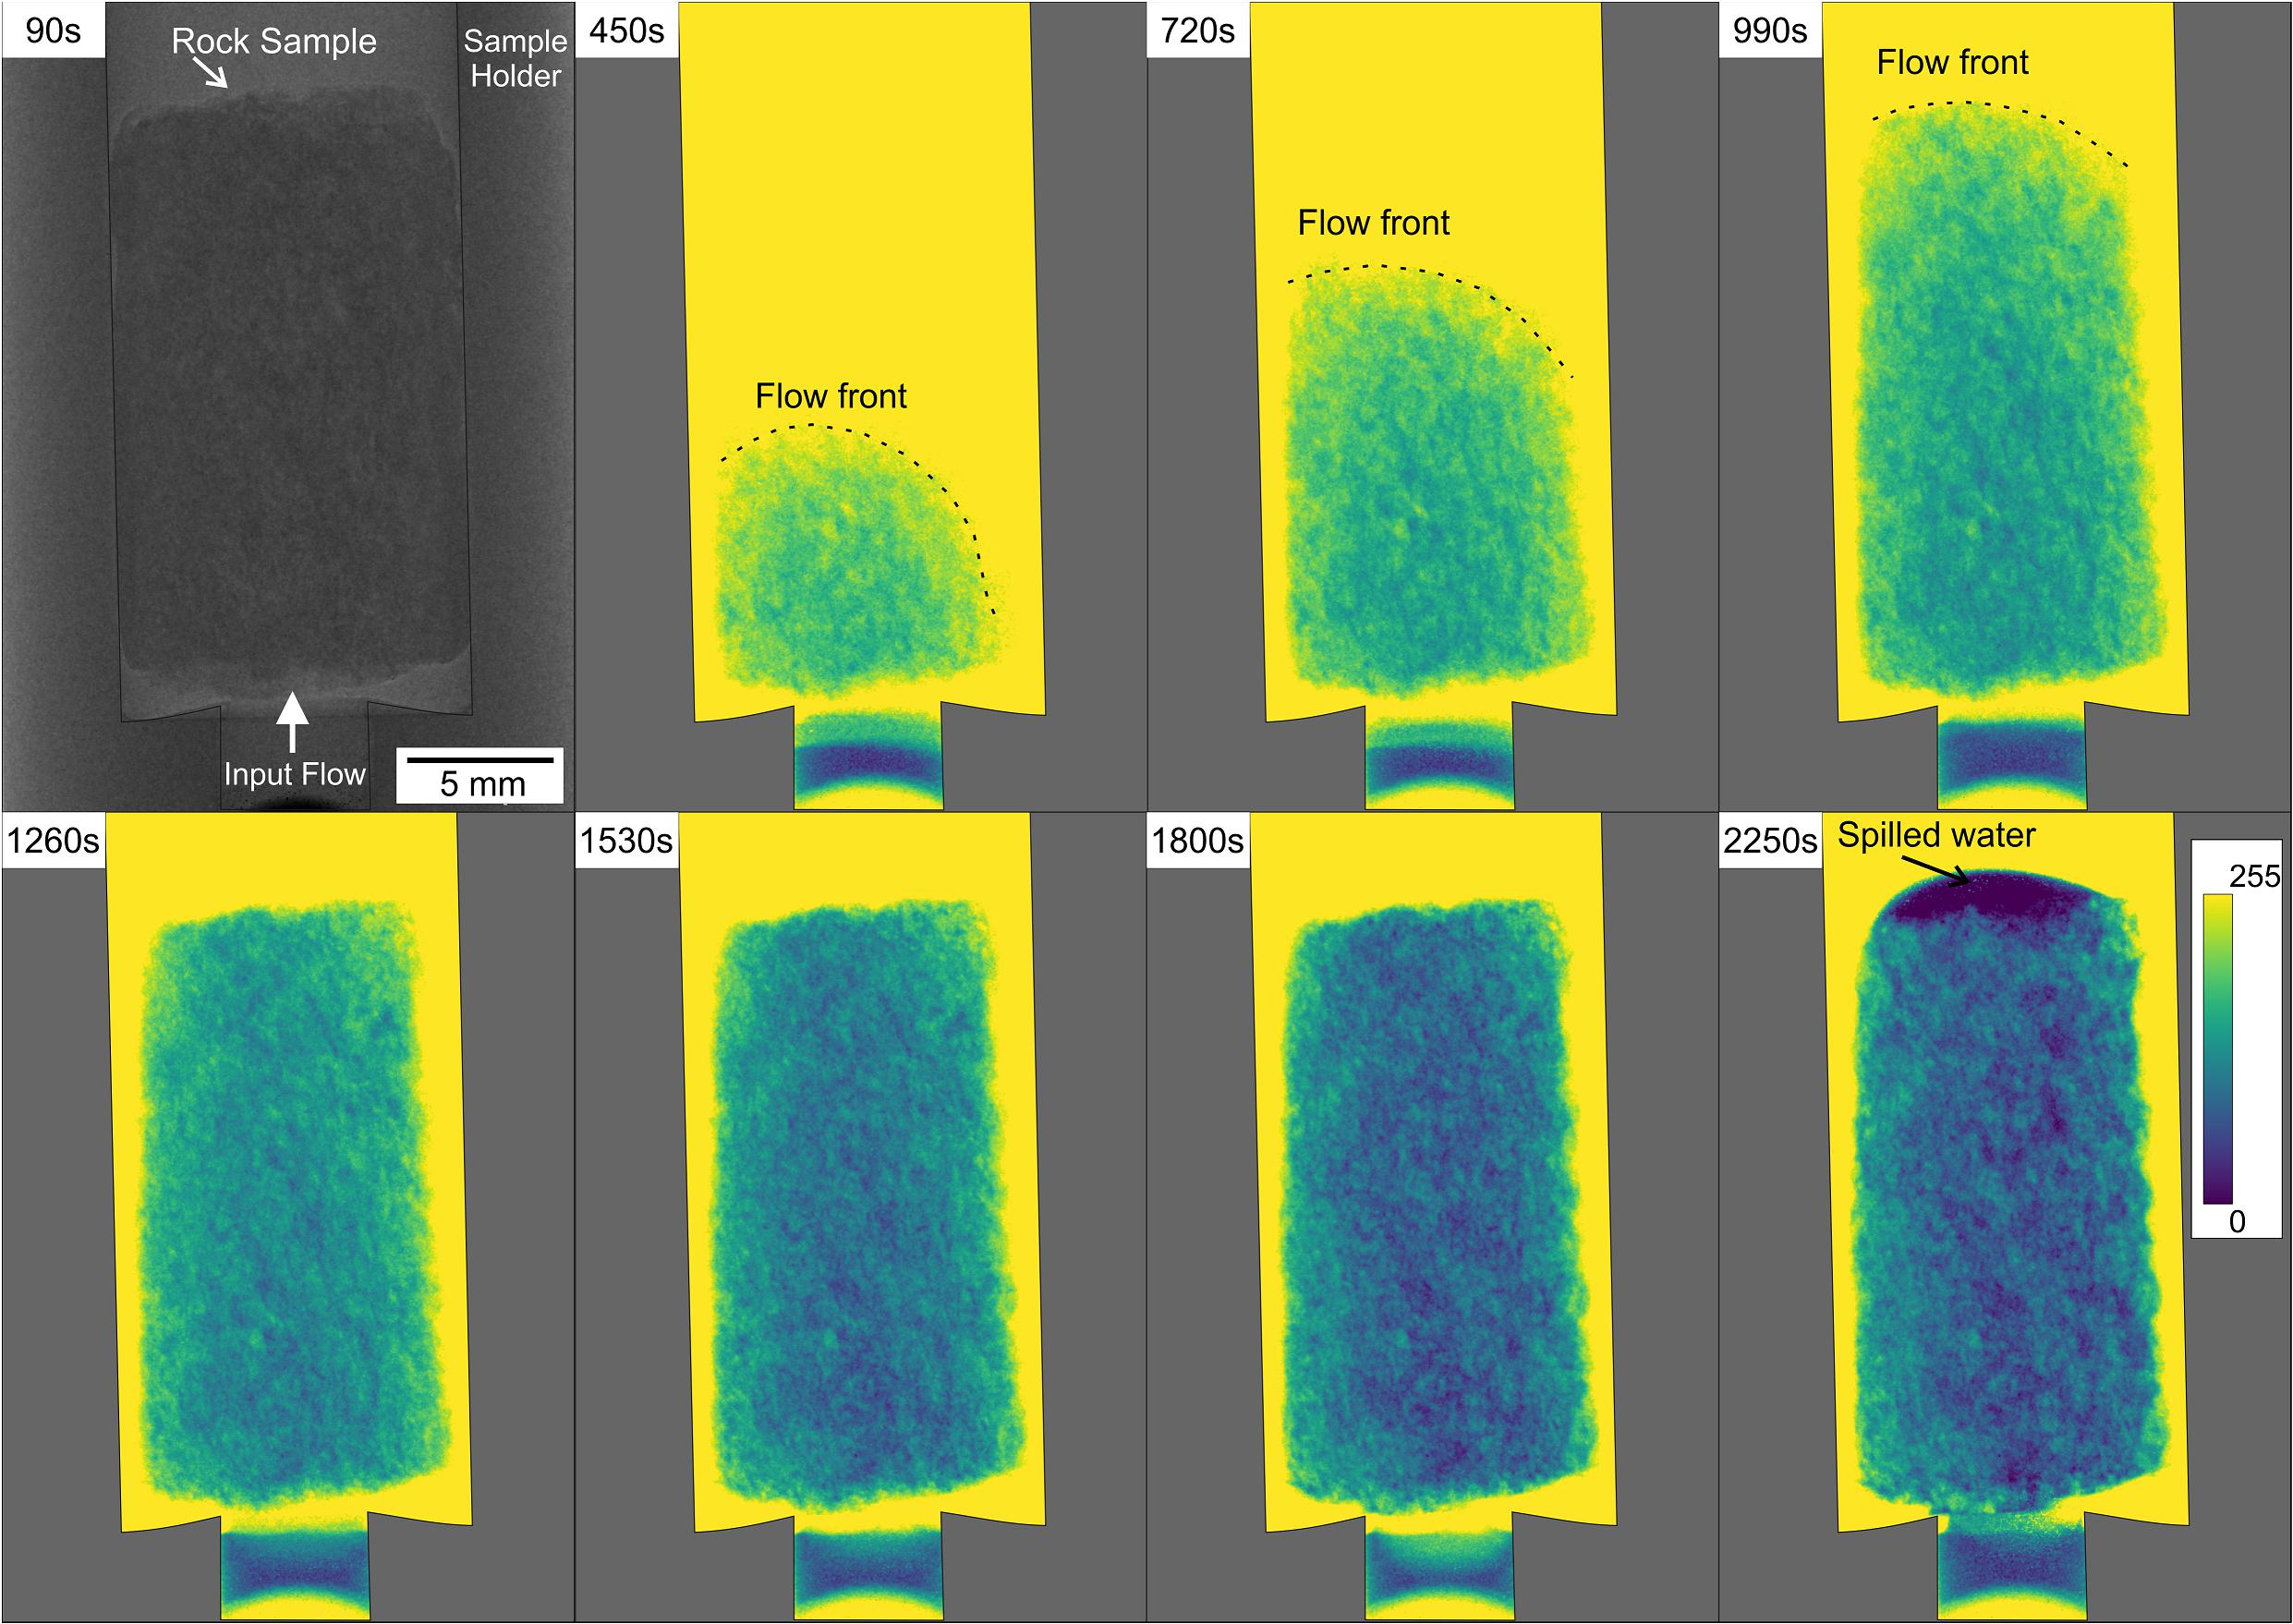
Figure 3. Time lapsed neutron radiographs showing the flow of deionized water for the sample corresponding to a Favignana grainstone. The image at 90 s (in original gray scale color) corresponds to a stage where the water still not entered into the rock sample. The rest of the images (in false color) correspond to input fluid into the sample obtained by subtracting the original dry condition (90 s) to radiograph to the n-time radiograph. The stages from 450 to 990 s show the fluid filling the rock sample. The stages from 1260 to 2250 s show an increment in the fluid saturation until the water is spilled due to oversaturation.
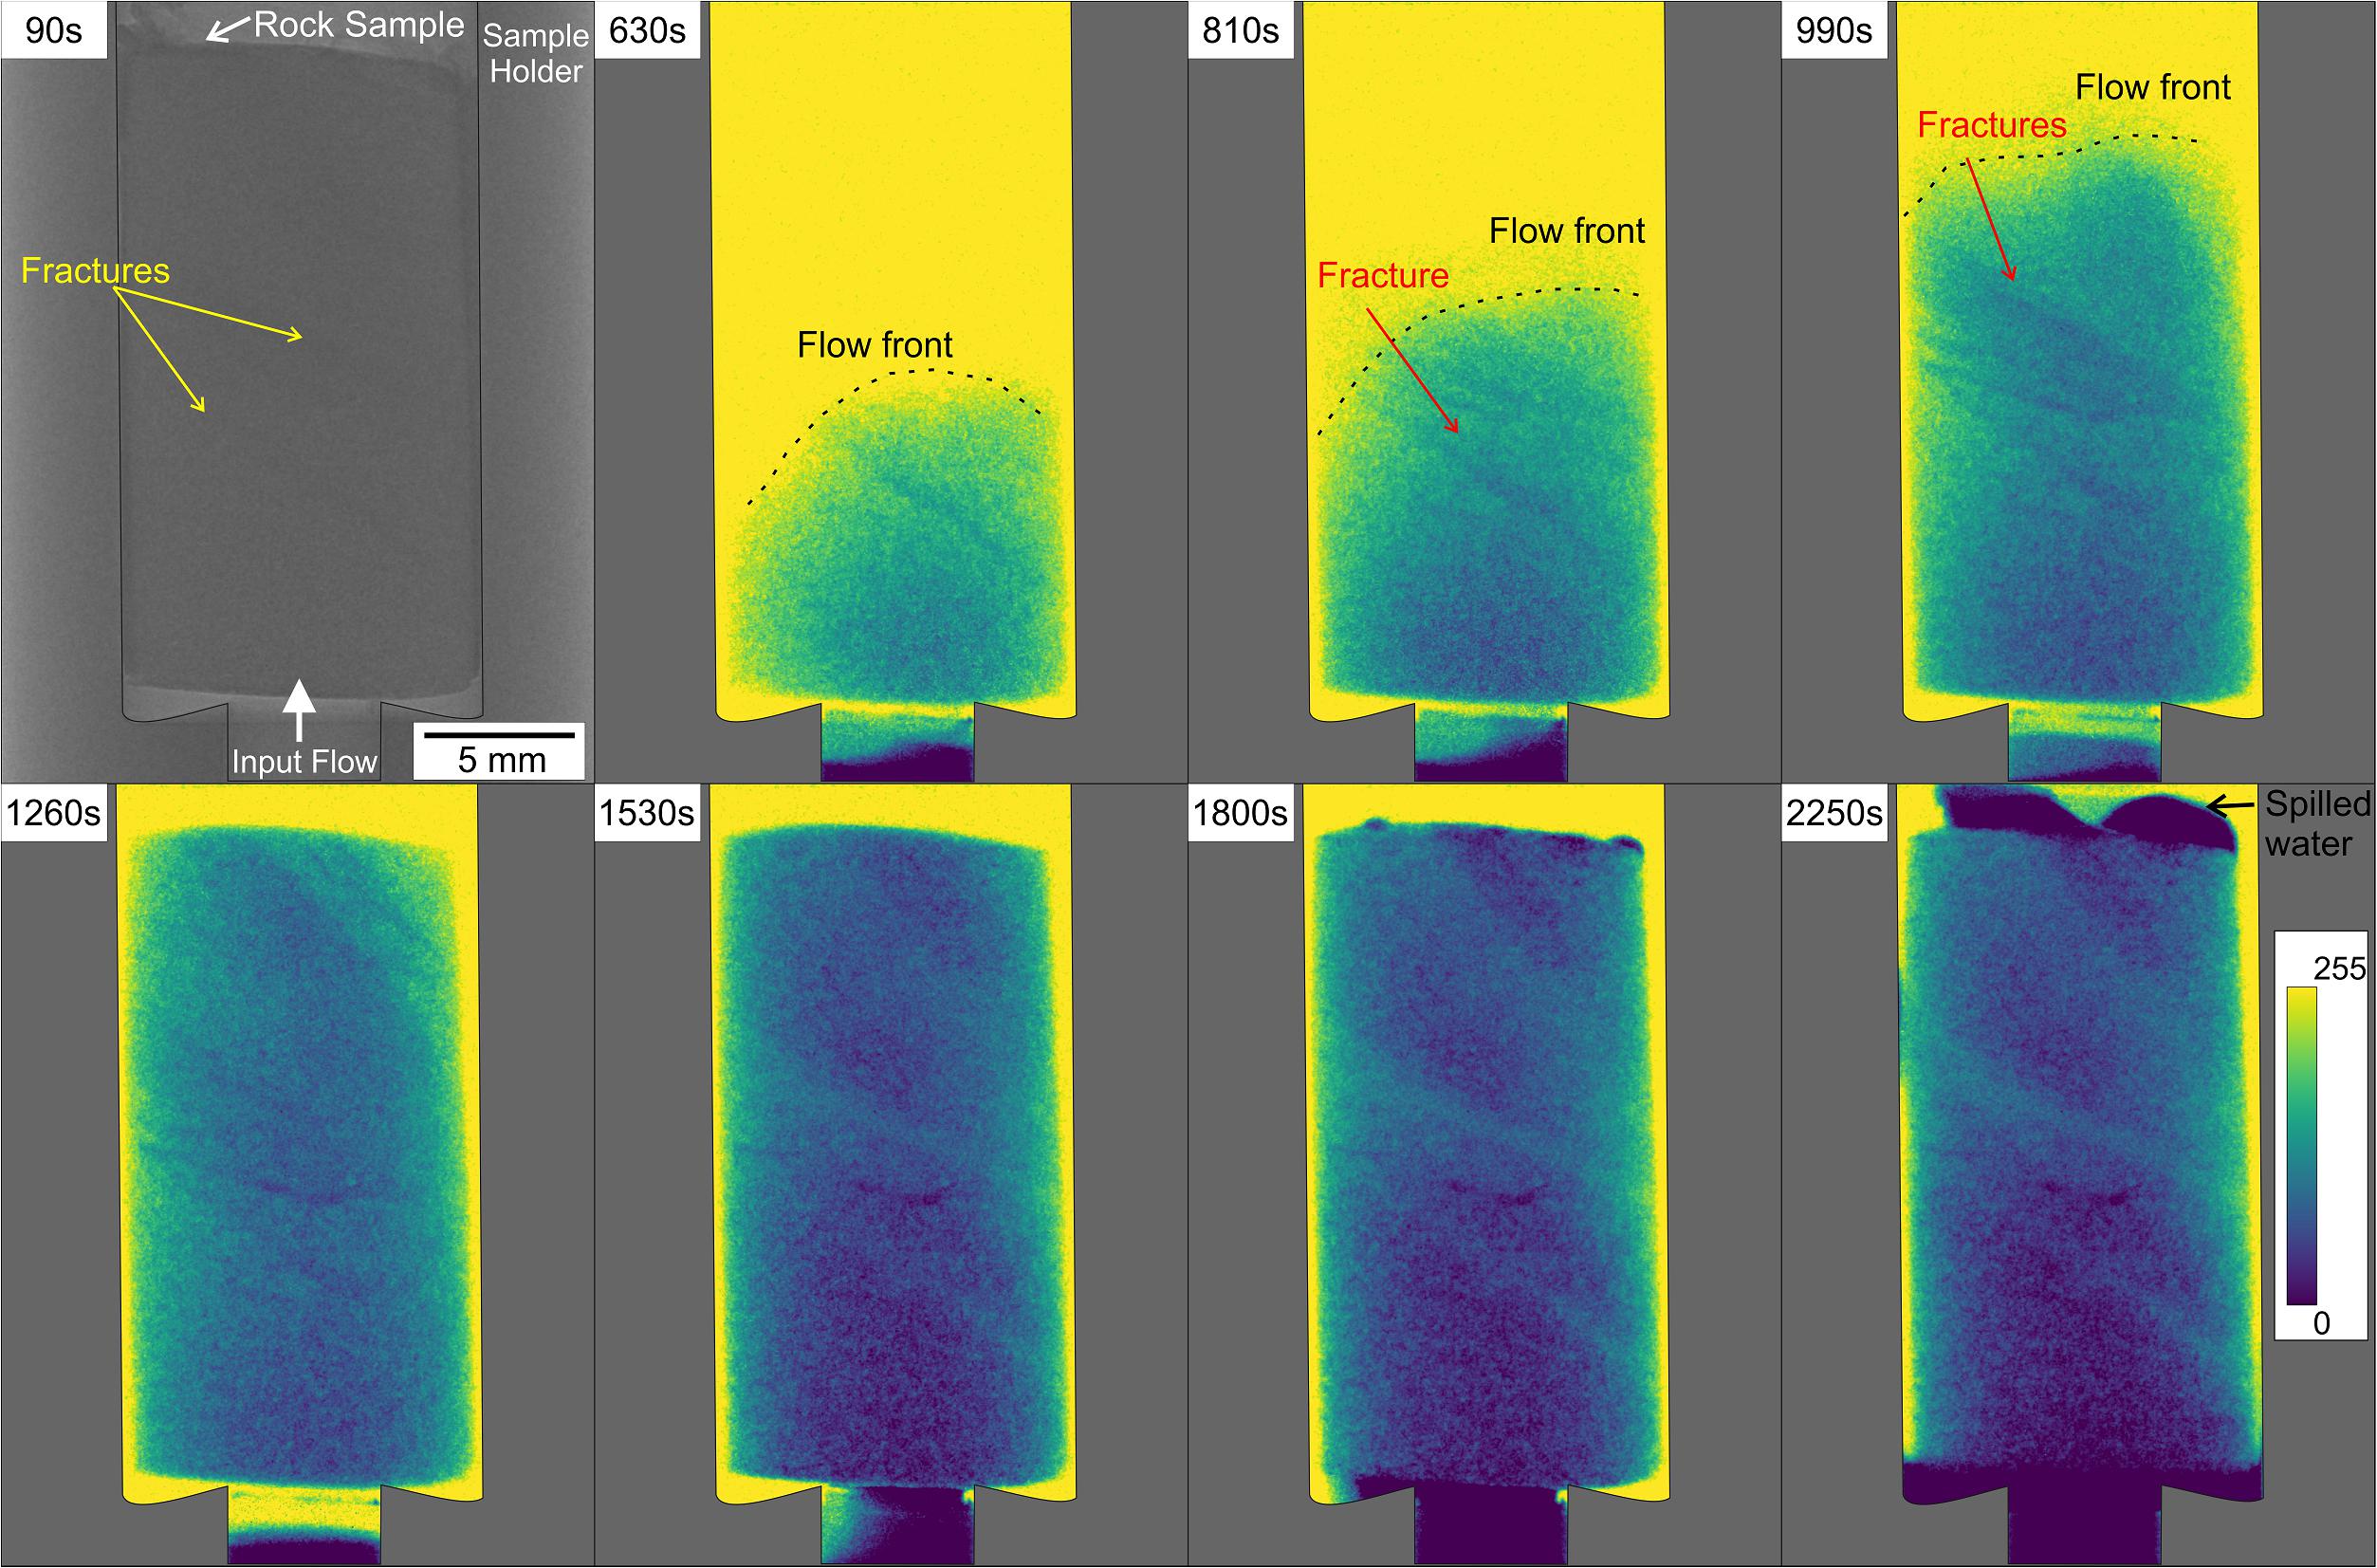
Figure 4. Time lapsed neutron radiographs showing the flow of deionized water for the sample corresponding to the Orfento grainstone containing fractures. The image at 90 s (in original gray scale color) corresponds to a stage where the water still not entered into the rock sample. The rest of the images (in false color) correspond to input fluid into the sample obtained by subtracting the original dry condition (90 s) to radiograph to the n-time radiograph. The stages from 630 to 1260 s show the fluid filling the rock sample. The stages from 1530 to 2250 s show an increment in the fluid saturation until the water is spilled due to oversaturation.
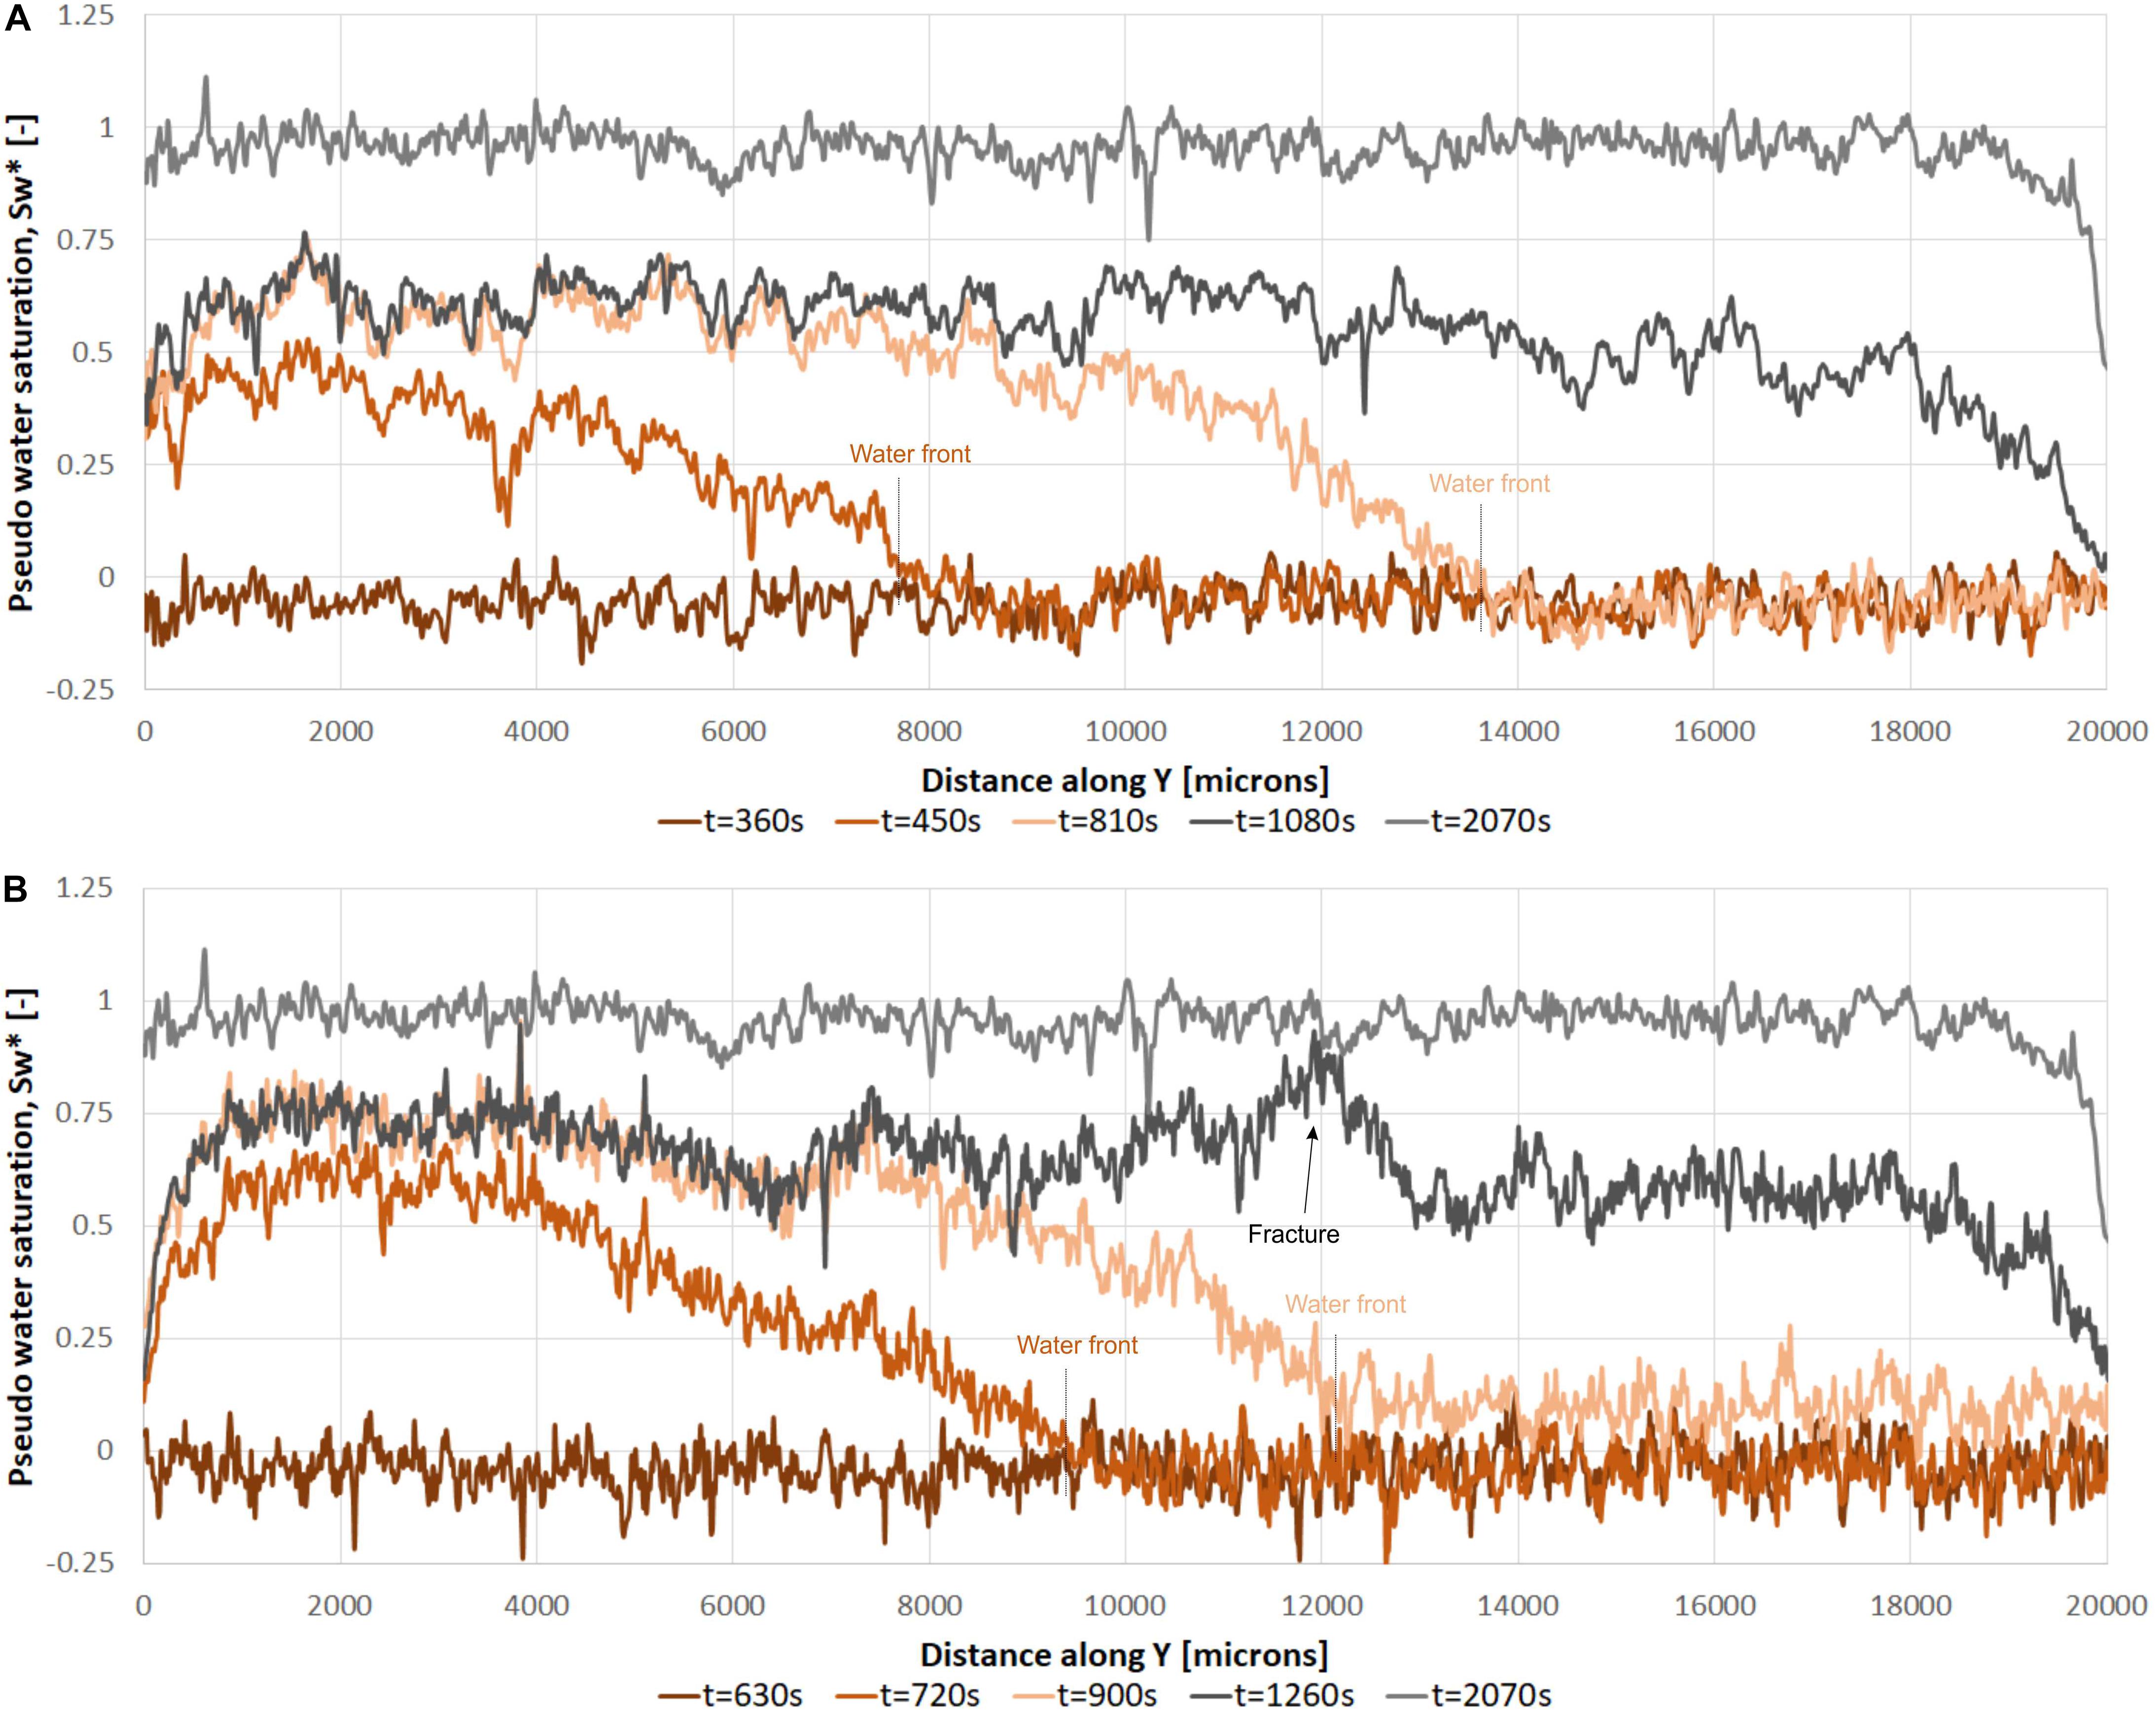
Figure 5. Longitudinal profiles indicating the migration of the flow front and the relative pseudo saturation of the (A) Favignana grainstones, and (B) Orfento grainstones samples, indicating and anomalous increase of the saturation due to fractures (t = 1260 s).
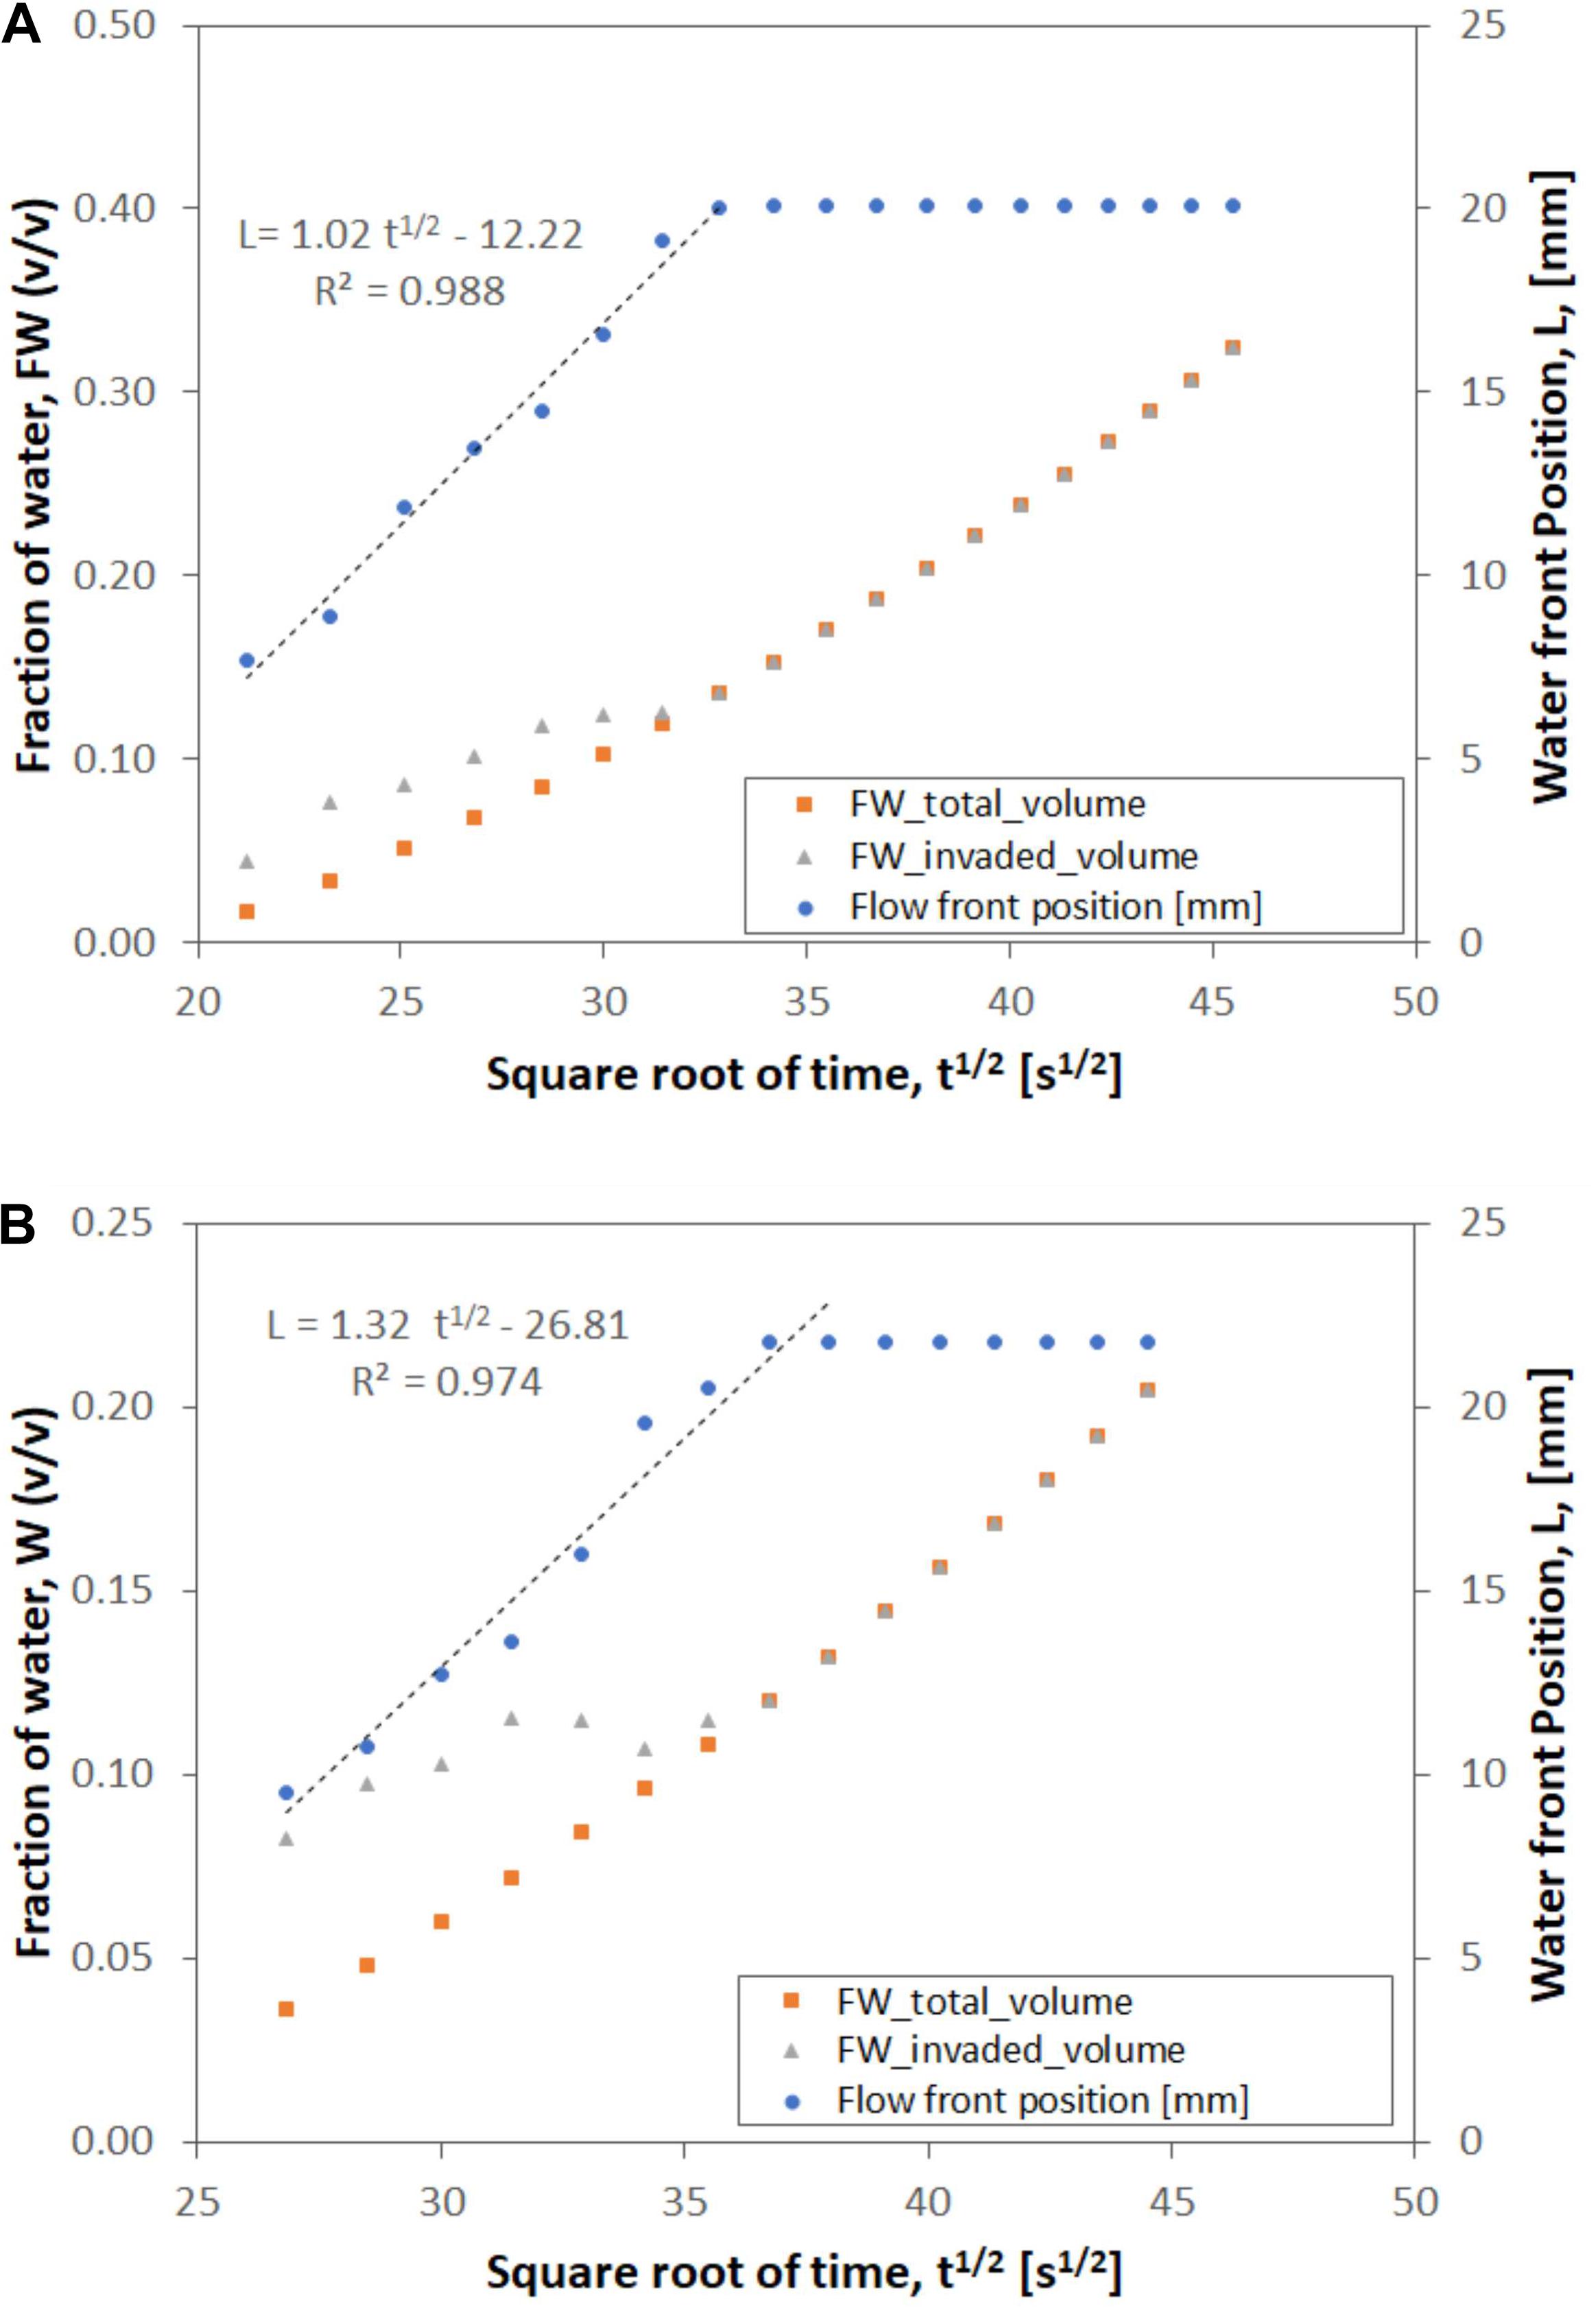
Figure 6. Water absorption in function of time described by the axial waterfront position, the fraction of water invading the whole sample and the fraction of water only in the invaded rock volume: (A) Favignana grainstone and (B) Orfento grainstones.
In the case of the Favignana grainstones, the studied sample seems homogeneous at initial dry conditions (NR 90s). However, the time-lapsed neutron radiographs (Figure 3) show that the flow front is slightly inclined (NR 90s -NR 990s). Initially the water invaded the rock sample rapidly, however the invaded volume is not highly saturated (NR 90s -NR 990s). The saturation increment is more evident in the Figures 5A, 6A. After the sample is totally invaded by water, the water saturation increases (NR 1290s – NR 1800s) until the water spilled out (NR 2250s). The profiles confirm both the initial rapid migration of the flow front and continuous saturation of the sample trough time until the water spilled out (Figures 5A, 6B). The profiles also indicate the heterogeneities in the sample associated with local porosity variation. In general, these heterogeneities are kept in time but their general intensity changes as an indicator of an increment of the water saturation.
In the case of the Orfento grainstone, the initial image in dry conditions (NR 90 s) shows a sample with smaller grain/pore size with respect to Favignana grainstone. Whereas, the time lapsed neutron radiographs, once the flow started (Figure 4), rapidly show the presence of lineations (fractures) characterized by an earlier saturation. These fractures could be created during the preparation of the sample or likely of natural origin. These features control an anisotropic distribution of the flow. The fractures are also recognized as important heterogeneities controlling the fluid flow in the longitudinal profiles (Figure 5B). In this graph, an ‘anomalous’ rapid increment in water saturation is observed at the time 1260s in correspondence to the presence of fractures. A similar migration of the flow front and increment of the relative saturation is showed by the profiles through time (Figure 6B).
We have observed that water saturation was driven by to mechanism: capillarity and constant flux rate. The limit between the two flows mechanism correspond to the time when the water reaches the top of the rock samples. After that, the saturation starts to increase uniformly according to the constant flux rate provided by the pump. This limit seems to be preceded by an inflection of the fraction of water curve. During the capillarity driven flow, the waterfront velocity for the Favignana samples is slightly lower (0.0202 mm/s) than for the Orfento sample (0.0208 mm/s). In the Figure 6, the flow front vs. square root of time presented some scattering and variability with the expected best fit line. This variability is more important for the Orfento grainstones, which is characterized by the presence of fractures.
The maximum fraction of water absorbed by the samples seems a good indicator of the connected porosity. In the case of Favignana sample, the fraction of water reached during the capillarity driven flow is near 12.53%, whereas the maximum, after the saturation of the sample, is near 32.4%. For the Orfento sample the fraction of water reached during the capillarity driven flow is near 11.5%, and the maximum at the end of the experiment is near 20.45%.
Integrated XCT an NCT Imaging
Imaged from both methods were aligned and presented with the same nominal resolution (pixel size equal to 13.5 μm) for comparing and integrating the results (Figure 7). The XCT data provides a good evaluation of rock components (framework grains, matrix, cement, and pores). Particularly the resolution of the images allows to distinguish and segment the macropores (diameters between 50 and 800 μm) contained in the sample (Figure 7A). It is expected that some pores below the nominal resolution (pixel size equal to 13.5 μm) are present in the sample.
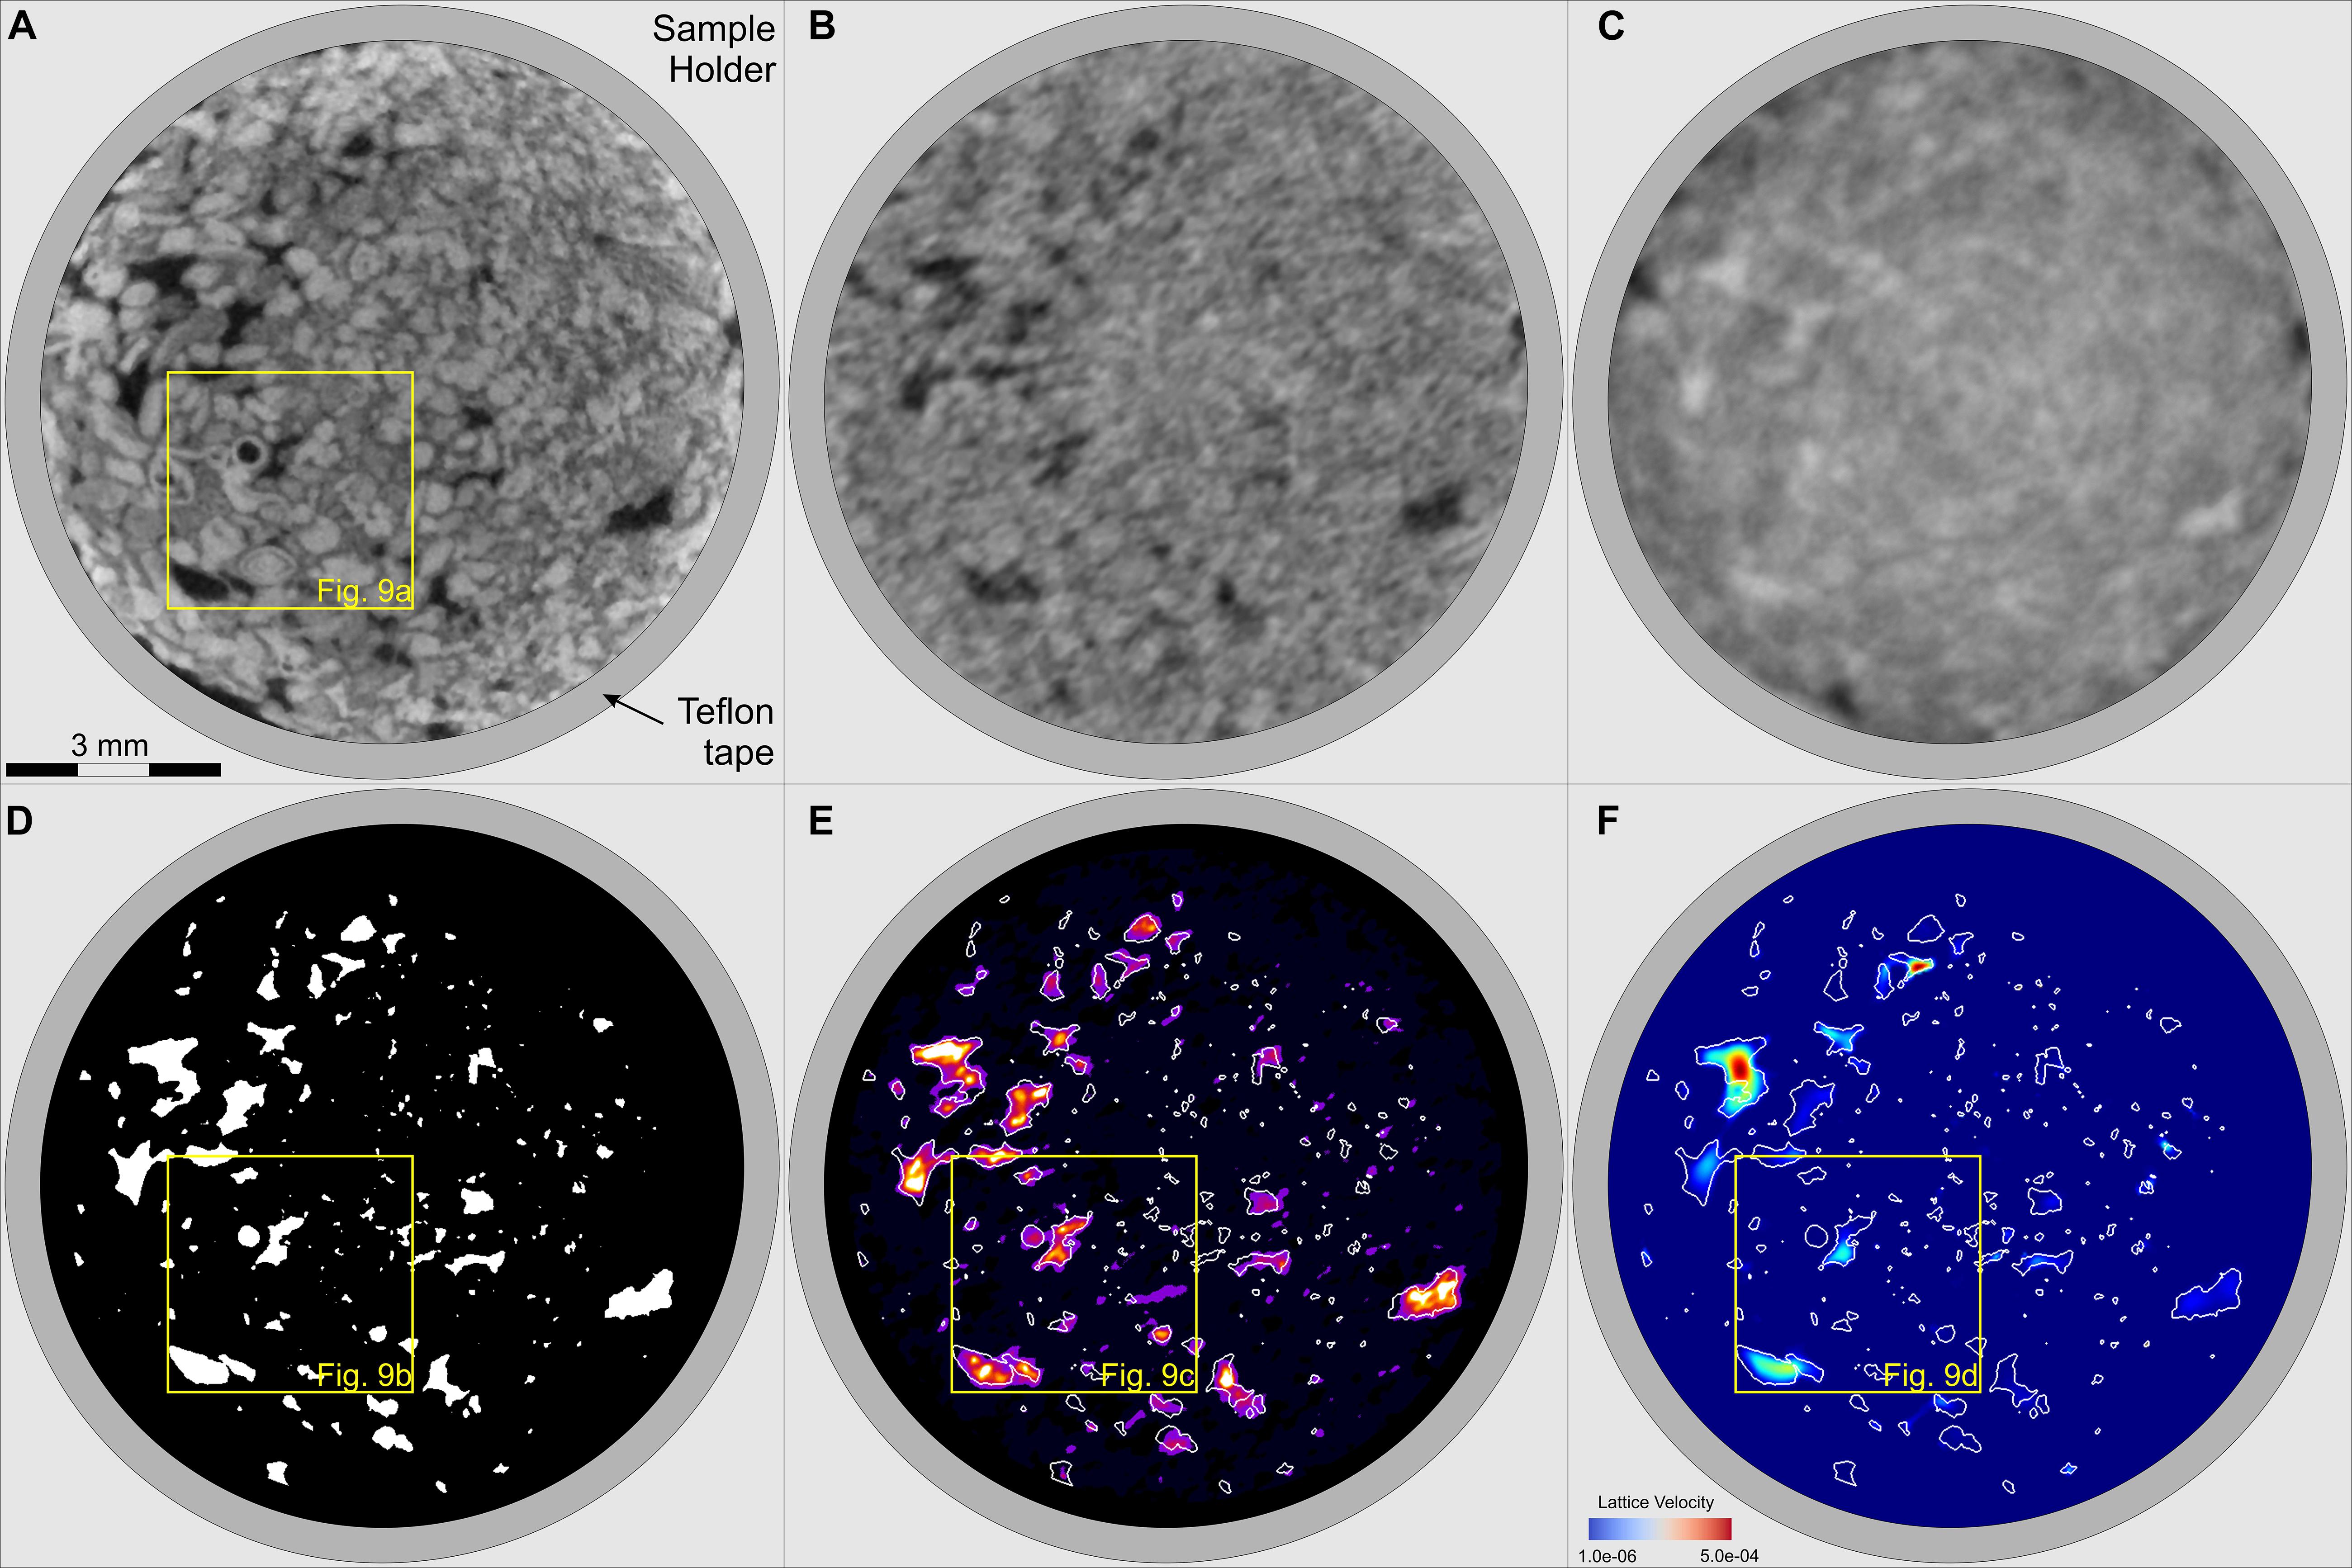
Figure 7. Comparison of resulting images near the middle of the sample. (A) XCT at dry conditions, (B) NCT at dry conditions, (C) NCT at wet conditions, (D) segmented pores from XCT, (E) Difference of NCT wet-dry images using as mask the segmented macropores from the XCT data, warmer colors indicate a higher saturation of water, (F) Lattice velocity images obtained by using LBM fluid flow simulation, warmer colors indicate a higher lattice velocity of the simulated flow. The pixel size is set to 13.5 μm for both NCT and XCT images.
The strength of neutron imaging is its sensitivity to hydrogen and hence to the fluid in the sample. As shown in the Table 1 neutrons give a very high contrast between the three main phases in the studied samples (i.e., water, air, and carbonate rock). The limitation of the neutron image is that the pores/grains are not very well-defined (images are blurry in comparison to XCT). However, the method proved useful for comparing the wetting-phase saturation after the inhibition experiment. In fact, NCT images at dry and wet conditions look very different (Figures 7B,C, respectively). In the use gray color bar, wet zones tend to have a more whitish color in comparison to air or carbonate rock. This is likely due to the sensitivity of NR to hydrogen and the different attenuation factors for the different studied phases (water, air, and carbonate rock). A rough estimation of the relative concentration of water considering the difference of NCT wet-dry images (Figure 7E). In this figure, warmer colors indicate a higher saturation of water.
Some differences between the pores extracted from X-ray images and the pores filled by water (differences of NCT wet-dry images) were observed (Figures 7, 8). The first case some detected pores are not filled by water, this could be related to the presence of isolated intragrain (e.g., bioclast) pores previously reported by Zambrano et al., 2017). Also, this could be attributed to the presence of air bubbles trapped due to a ‘rapid’ and low-pressure water flow. This fact may explain the presence of macropores partially filled with water. In addition, the water could have taken preferable pathways like the borders of the sample even though it was well-sealed by Teflon tape. Another important difference, correspond to apparent zones filled by water that do not correspond to the observed pores. This is more likely due to the presence of micropores (sub-resolvable pore by XCT) that are contributing to the water flow. The structure of these pores may be not clearly defined in the images, however the water presence within the pores can be mapped.
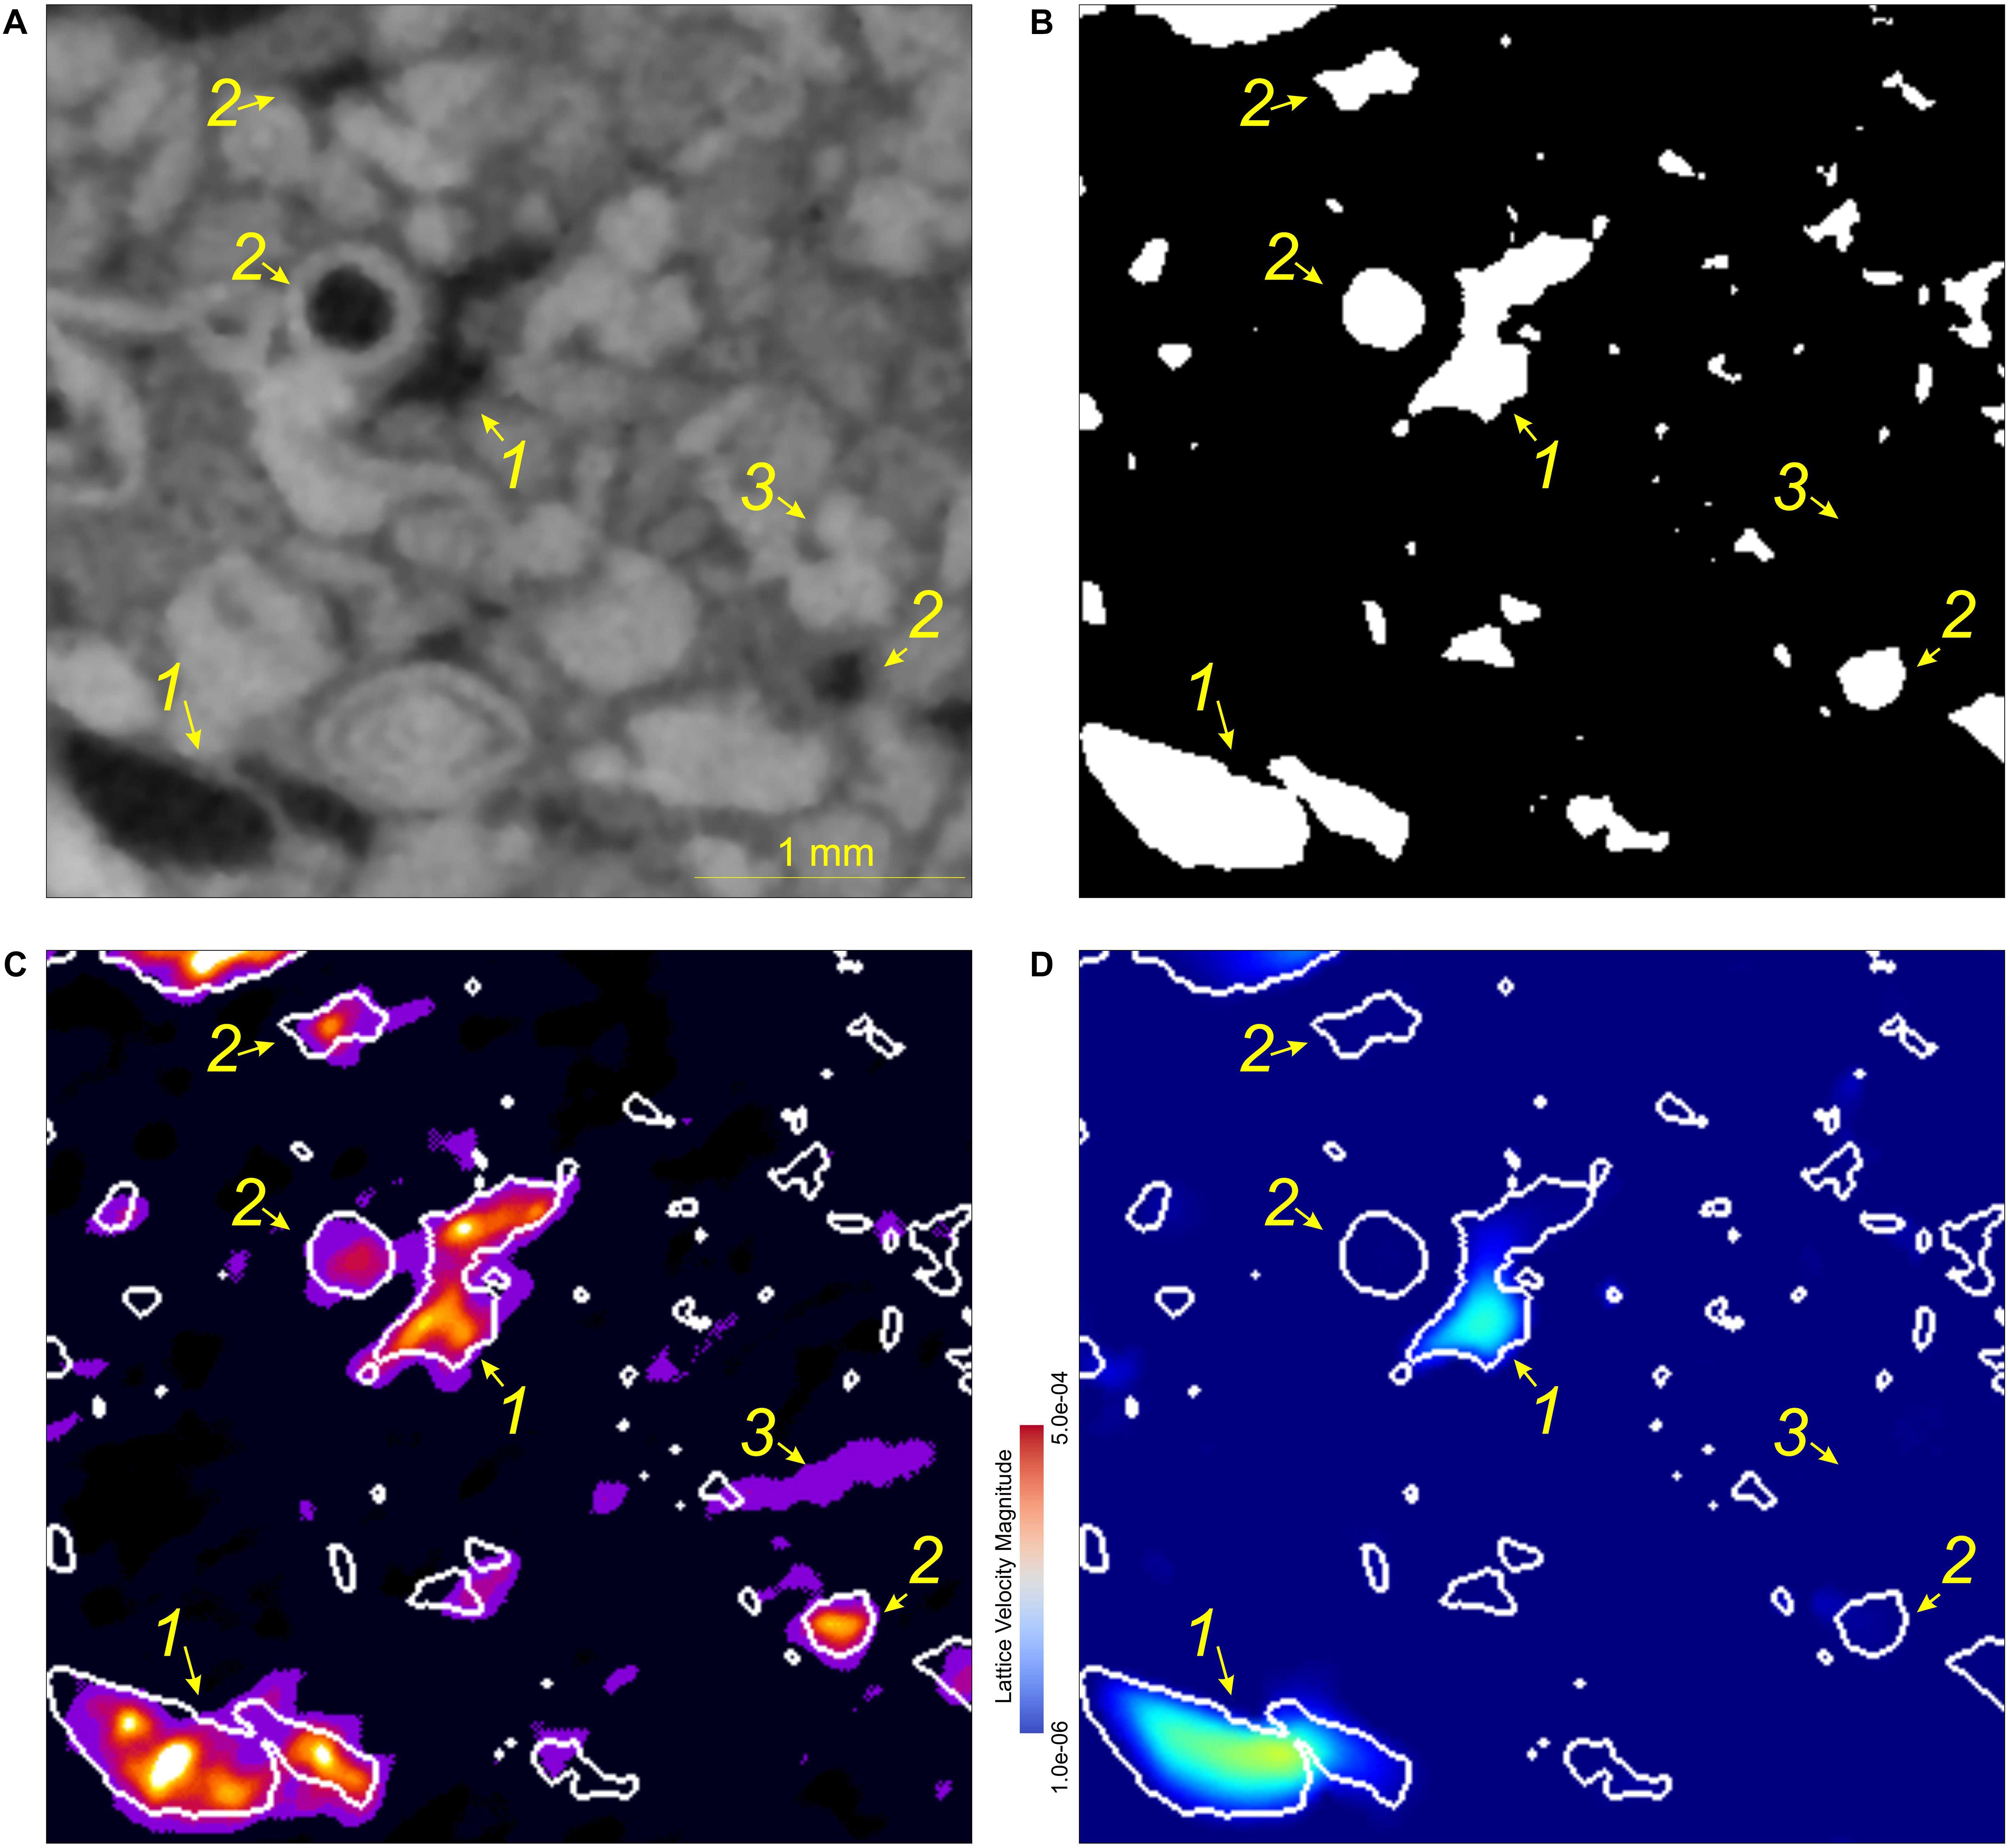
Figure 8. Detail of the comparison of resulting images (Figure 7). (A) XCT at dry conditions, (B) segmented pores from XCT, (C) Difference of NCT wet-dry images using as mask the segmented macropores from the XCT data, warmer colors indicate a higher saturation of water, (D) Lattice velocity images obtained by using LBM fluid flow simulation, warmer colors indicate a higher lattice velocity of the simulated flow. Three different cases are observed: (1) Macropores filled by water and connected according to LB simulation, (2) Macropores filled by water and poorly connected according to LB simulation, and (3) XCT sub-resolvable pores/throats filled by water only observed in Neutron experiments.
Fluid Flow Simulation
The fluid flow simulations provide information about the possible behavior of the flow through time after saturated conditions. In steady state conditions we compared the velocity field (Figure 7F) with the connected pore network (Figure 7D) extracted from the X-ray micro-CT images. Results indicate that some pores do not contribute to the flow in simulation; however, in reality these pores are connected (Figure 8, label 2). This is likely an issue of image resolution of the XCT. Similarly, some pores below the resolution (XCT) contributing to the flow (NCT) are not detected and therefore not included in the simulation (Figure 8, label 3). Also, pores located at the lateral edges could be excluded if they are not connected to the top and base of the sample. Therefore, the pores contributing to flow in the simulation are only macropores clearly connected (Figure 9). In these regards, the computed permeability (1.29×10⁻¹³ m2) is slightly lower than the values obtained by Zambrano et al. (2018) using X-ray micro-CT at higher resolution (see Table 2). In fact, the calculated permeability tends to be underestimated at low spatial resolution of pore network model (see Zambrano et al., 2018).
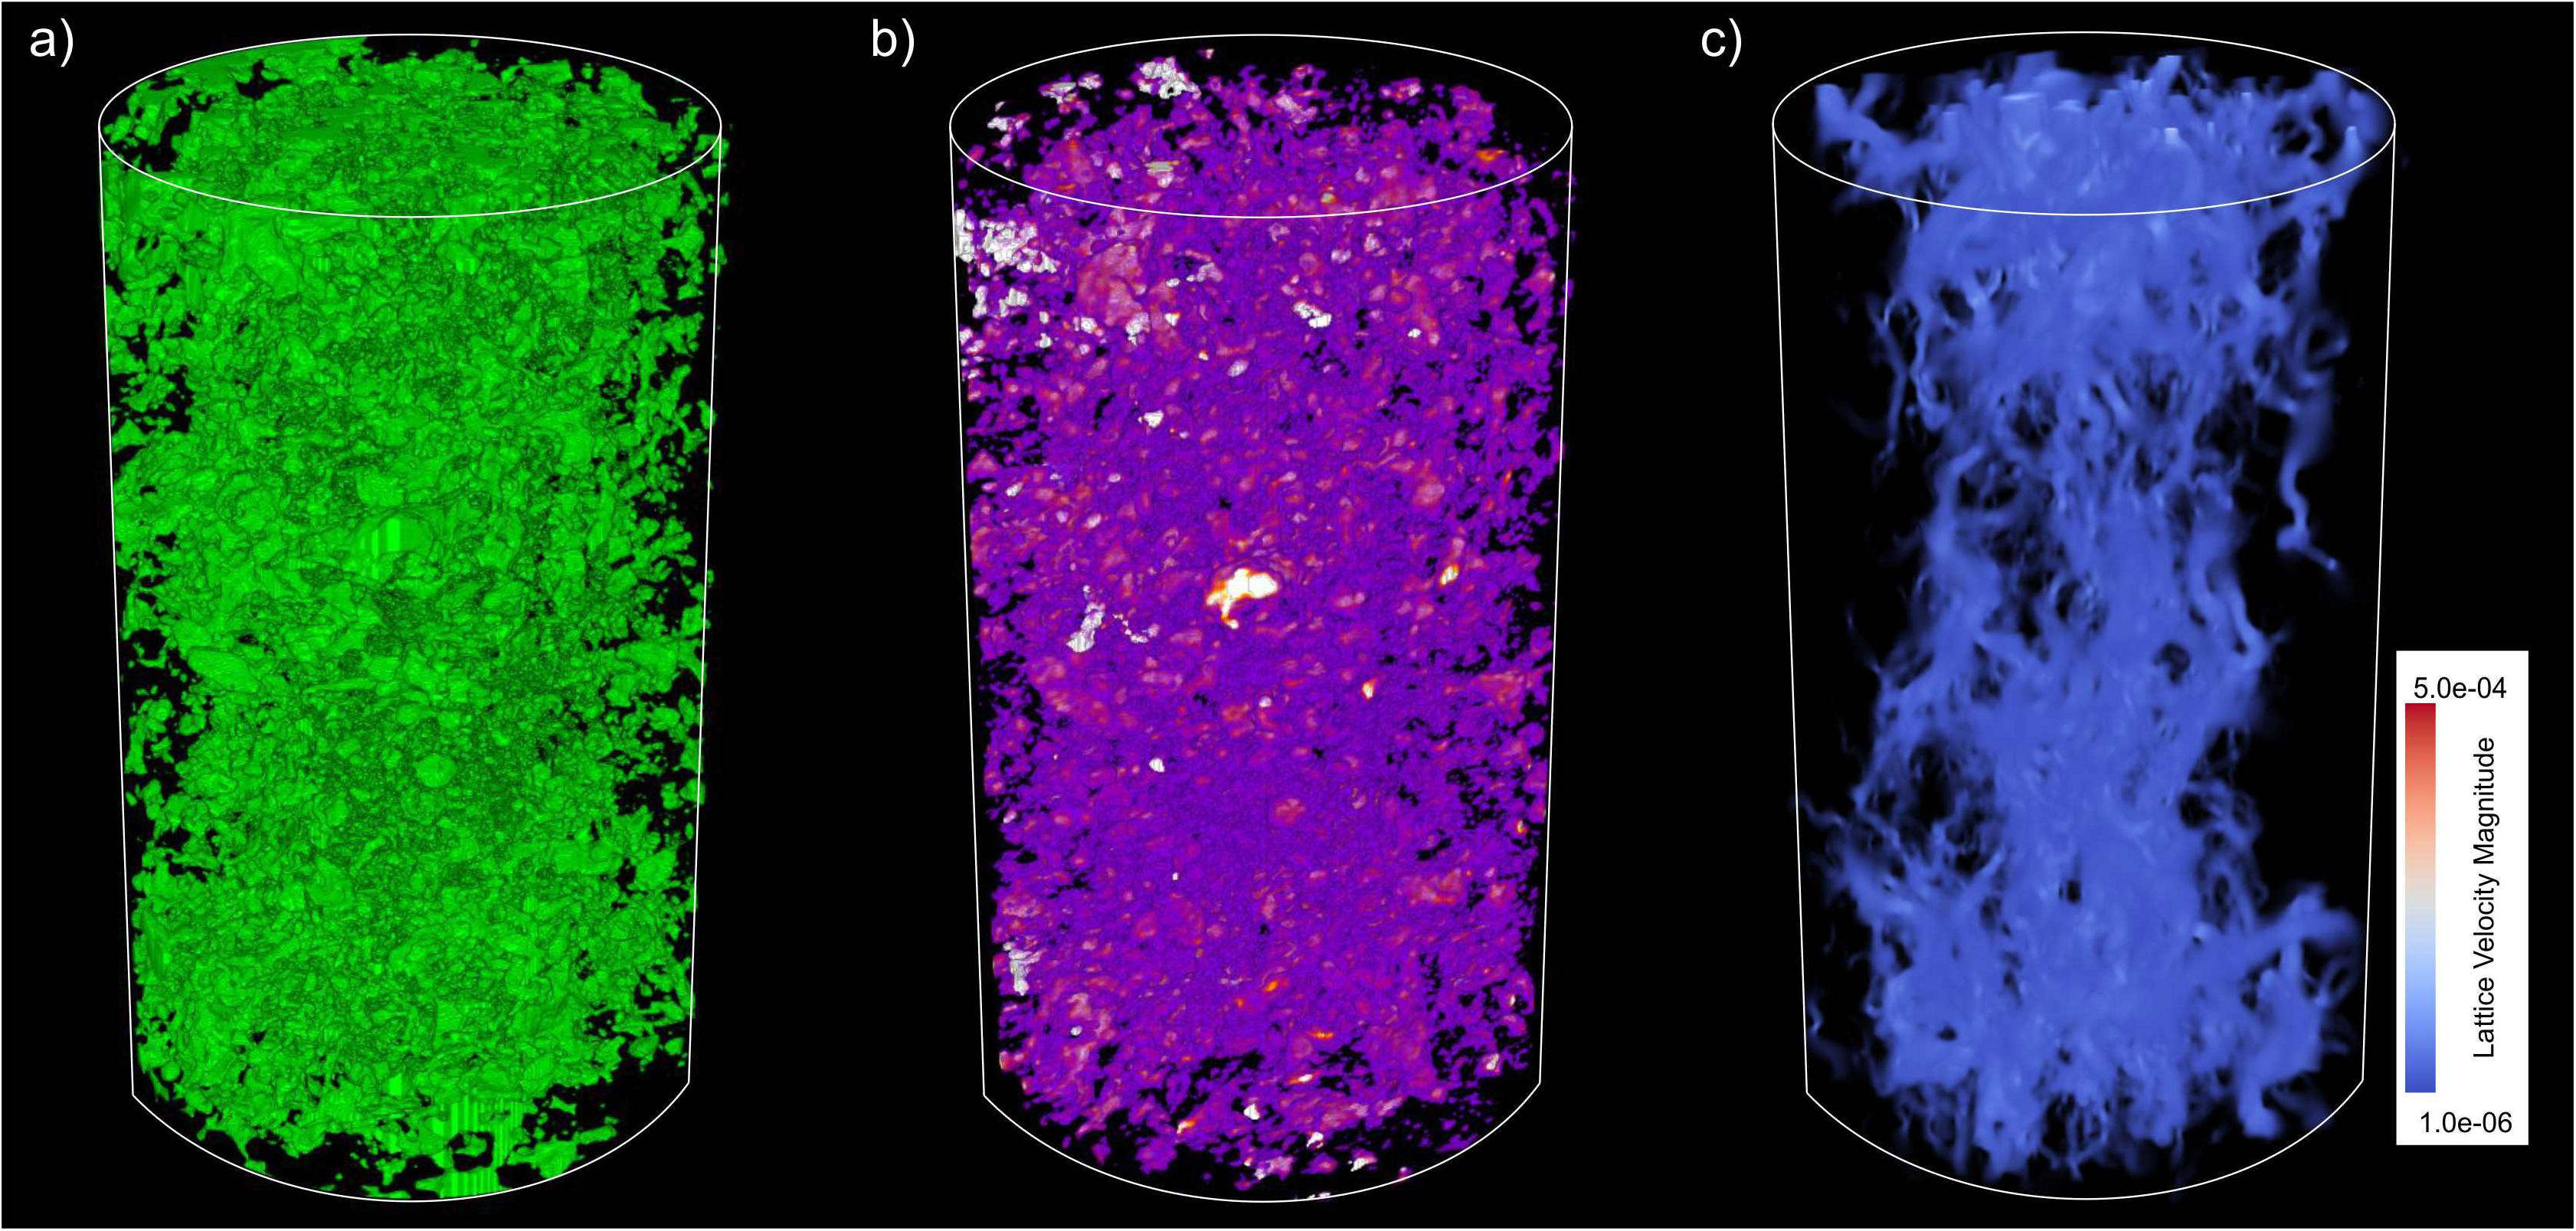
Figure 9. Comparison of resulting 3D renderings of (a) Segmented pores from XCT (in green), (b) Difference of wet-dry NCT images, (c) Lattice velocity images obtained by LBM fluid flow simulation. The sample size is ca. 10 mm × 20 mm (diameter × height), whereas the pixel size was set to 13.5 μm.
Discussion
Methodology Implications
The dynamic 2D NR permits the evaluation of the front of the fluid flow as a function of time. However, we detected an initial front likely driven by capillarity forces and later increment of the saturation on the wetting phase. The latter is likely driven by a forced imbibition caused by the constant flux rate. The limit of these domains is given by the time when the waterfront reaches the top of the sample. Also, it was possible to observe the influence of sample heterogeneities on the fluid flow. These heterogeneities can be the intergranular pores or fractures. Particularly, some fractures observed in the Orfento sample could be natural or related to the sample preparation. In contrast to some sandstone samples investigated by Cnudde et al. (2008) we did not observe any ‘abnormal’ dual-waterfront due to these heterogeneities. Nevertheless, the NR methodology provides information in two-dimensions resulting in a smooth boundary water/air. As a consequence, the detail control on the surface geometry and roughness (e.g., Alava et al., 2004) was not possible. This issue could be solved by implementing time-step NCT in further investigations. We found that final values of water absorbed by the samples are near and slightly higher that the reported values of connected porosity using XCT (Zambrano et al., 2017). Therefore, the reached water saturation in the experiments should be close to the available porosity. However, some air bubbles should remain trapped in the rock.
The dynamic 2D NR experiments showed differences regarding pore structure between the two evaluated rocks that have been reported by previous authors (Tondi et al., 2016; Zambrano et al., 2017, 2018). In the case of Favignana grainstones a high heterogeneity of the gray values in the image profiles was observed, whereas the Orfento grainstones were more regular and homogeneous. This is related to the huge differences in texture, grains and pores sizes being near 10 times larger in the Favignana grainstones in comparison to the Orfento ones. This difference in texture (specific surface area, connectivity, tortuosity) is responsible that Favignana grainstones have a permeability two orders of magnitude higher than the Orfento grainstones. Since both rocks have similar porosity, but different pore-throat sizes. The capillarity forces driving the flow at this first stage are expected to be very different. In fact, lithofacies with larger pore-throat sizes are expected to have small initial displacement pressures, and therefore the air phase can be easily displaced by the injected water. Major initial displacement pressures are expected in lithofacies with smaller pore-throat sizes, which may buffer the displacement of air by water phase. Therefore, differences in the flow velocity in the capillarity driven flow domain, may be related to both the difference in permeability and pore geometry (diameter, connectivity, tortuosity) between the two rocks as have been reported by Zambrano et al. (2017, 2018).
The combined use of XCT and NCT methodologies can provide information regarding the pore space architecture (X-rays) and the fluid contents (neutrons). According to our results, X-rays can define the geometry of the solid components of the rocks (framework grains, cements, and matrix). Neutrons, however, show images more diffused and only a few macropores are distinguished. On the other hand, comparing NCT in dry and wet conditions allows to discriminate the presence of water within pores. In fact, the method seems to provide information on micropores contributing to fluid flow even below the actual spatial resolution of the images. On the other hand, the NCT at wet conditions reveled air trapped in the pores. This issue may be related to the initial unsaturated and low-pressure conditions of the experiment.
This approach using NR and integrated XCT an NCT is relevant for the study of petroleum systems, where the capillarity governs the initial distribution of the different phases of fluids within the reservoir (Brown, 1951), control the relative permeabilities, pressure and saturation of different phases during production (Jerauld and Rathmell, 1997; Christiansen, 2001). Particularly, the implemented approaches were useful for mapping fluid flow as a function of time, wetting phase (water) saturation dynamically and at the end of the experiments. In these regards, the methodology finds uses to the study of spontaneous and forced imbibition gas recovery (e.g., Di Stefano et al., 2017), irreducible water estimation useful for petrophysical evaluations and oil recovery planning (e.g., Treiber and Owens, 1972; Salathiel, 1973; Morrow and Melrose, 1991). Another important application of this method could be the evaluation of moisture inside building stones (e.g., Cnudde et al., 2008). Here the absorption of water by capillarity can cause important degradation of in building materials (e.g., carbonate rocks).
Conclusion
In this work we have applied a combined approach (X-ray and neutron imaging) for mapping the fluid flow within porous carbonates rocks and estimated the effective pore space properties. The methodology includes dynamic neutron radiography (NR), integrated X-ray and neutron tomography (XCT and NCT, respectively), and computational fluid dynamics simulations.
The dynamic NR was very useful for mapping water flow through the studied samples. From these experiments we conclude that: (i) Fractures presented in samples generate a non-uniform flow front, indicating some anisotropy on permeability, and (ii) in unsaturated samples, water fills rapidly part of the pore-structure which may indicate a capillary control of the flow. Lately, the sample is uniformly saturated until the water spills out, indicating a control of macropores on fluid flow and storage.
The combined tomographic experiments including X-ray- and neutron-based techniques were useful for mapping the three-dimensional distribution of pores, and the fluids within them. In particular, the difference between NCT images in dry and wet conditions allows the determination of water, even in partially filled pores and pores with sizes below the spatial resolution. In fact, the limitations (i.e., missing pores and throats, undervalued connectivity) of performing fluid flow simulations using X-ray images can be overcome with neutron-based methods.
Data Availability Statement
The datasets generated for this study are available on request to the corresponding author.
Author Contributions
MZ: collection and preparation of samples and experiments in site. FH: experiments in site and elaboration of data. KA: setup preparation, experiments in site, and elaboration of data. LM and ET: interpretation and elaboration of data.
Disclaimer
Elettra-Sincrotrone Trieste S.C.p.A. is an institute of research and non-profit organization.
Conflict of Interest
MZ and ET were employed by company GeoMore s.r.l.
The remaining authors declare that the research was conducted in the absence of any commercial or financial relationships that could be construed as a potential conflict of interest.
Funding
This research was supported by the FAR (‘Fondi di Ateneo per la Ricerca,’ University of Camerino research funds) Project 2014 “Characterization and modelling of natural reservoirs of geofluids in fractured carbonate rocks” and the Reservoir Characterization Project (www.rechproject.com). FH acknowledges the receipt of a fellowship from the ICTP Programme for Training and Research in Italian Laboratories, Trieste, Italy.
Acknowledgments
This work is based on experiments performed at the Swiss spallation neutron source SINQ of the Paul Scherrer Institute in Villigen (Switzerland). We acknowledge Prof. Giulio Lupidi for providing the syringe pump used in the experiments. We also acknowledge Elettra synchrotron facility (Italy) for allowing us to use the Pore3D software and the related training. We also thank the staff of a local company (Meccanica Matelicese s.r.l., Matelica, Italy) who kindly provided support for the design and creation of the sample holders.
Footnotes
- ^ http://henke.lbl.gov/optical_constants/atten2.html
- ^ https://www.psi.ch/en/niag/comparison-to-x-ray
References
Alava, M., Dubé, M., and Rost, M. (2004). Imbibition in disordered media. Adv. Phys. 53, 83–175. doi: 10.1080/00018730410001687363
Anderson, I. S., McGreevy, R. L., and Bilheux, H. Z. (2009). Neutron Imaging and Applications, Vol. 2209. Berlin: Springer Science+ Business Media, 980–987.
Andrä, H., Combaret, N., Dvorkin, J., Glatt, E., Han, J., Kabel, M., et al. (2013). Digital rock physics benchmarks—Part II: computing effective properties. Comput. Geosci. 50, 33–43. doi: 10.1016/j.cageo.2012.09.008
Antonellini, M., Cilona, A., Tondi, E., Zambrano, M., and Agosta, F. (2014). Fluid flow numerical experiments of faulted porous carbonates, Northwest Sicily (Italy). Mar. Petrol. Geol. 55, 185–201. doi: 10.1016/j.marpetgeo.2013.12.003
Arzilli, F., Cilona, A., Mancini, L., and Tondi, E. (2016). Using synchrotron X-ray microtomography to characterize the pore network of reservoir rocks: a case study on carbonates. Adv. Water Resour. 95, 254–263. doi: 10.1016/j.advwatres.2015.07.016
Baud, P., Exner, U., Lommatzsch, M., Reuschlé, T., and Wong, T. F. (2017). Mechanical behavior, failure mode, and transport properties in a porous carbonate. J. Geophys. Res. Solid Earth 122, 7363–7387. doi: 10.1002/2017jb014060
Baud, P., Vinciguerra, S., David, C., Cavallo, A., Walker, E., and Reuschlé, T. (2009). Compaction and failure in high porosity carbonates: mechanical data and microstructural observations. Pure Appl. Geophys. 166, 869–898. doi: 10.1007/978-3-0346-0122-1_7
Benioug, M., Golfier, F., Oltéan, C., Buès, M. A., Bahar, T., and Cuny, J. (2017). An immersed boundary-lattice Boltzmann model for biofilm growth in porous media. Adv. Water Resour. 107, 65–82. doi: 10.1016/j.advwatres.2017.06.009
Bhatnagar, P. L., Gross, E. P., and Krook, M. (1954). A model for collision processes in gases. I. Small amplitude processes in charged and neutral one-component systems. Phys. Rev. 94:511. doi: 10.1103/physrev.94.511
Blunt, M. J., Bijeljic, B., Dong, H., Gharbi, O., Iglauer, S., Mostaghimi, P., et al. (2013). Pore-scale imaging and modelling. Adv. Water Resourc. 51, 197–216. doi: 10.1016/j.advwatres.2012.03.003
Brown, H. W. (1951). Capillary pressure investigations. J. Pet. Technol. 3, 67–74. doi: 10.2118/951067-G
Brun, F., Kourousias, G., Dreossi, D., Mancini, L., and Tromba, G. (2011). “A comparative evaluation of ring artifacts reduction filters for X-ray computed microtomography images,” in Proceedings of the 2011 18th IEEE International Conference on Image Processing, (Brussels: IEEE), 405–408.
Brun, F., Mancini, L., Kasae, P., Favretto, S., Dreossi, D., and Tromba, G. (2010). Pore3D: a software library for quantitative analysis of porous media. Nucl. Instrum. Methods Phys. Res. A 615, 326–332. doi: 10.1016/j.nima.2010.02.063
Bultreys, T., De Boever, W., and Cnudde, V. (2016). Imaging and image-based fluid transport modeling at the pore scale in geological materials: a practical introduction to the current state-of-the-art. Earth Sci. Rev. 155, 93–128. doi: 10.1016/j.earscirev.2016.02.001
Chang, J., and Yortsos, Y. C. (1992). Effect of capillary heterogeneity on Buckley-Leverett displacement. SPE Reserv. Eng. 7, 285–293. doi: 10.2118/18798-pa
Chaouche, M., Rakotomalala, N., Salin, D., Xu, B., and Yortsos, Y. C. (1994). Capillary effects in drainage in heterogeneous porous media: continuum modelling, experiments and pore network simulations. Chem. Eng. Sci. 49, 2447–2466. doi: 10.1016/0009-2509(94)e0040-w
Christiansen, R. L. (2001). Two-Phase Flow Through Porous Media, Vol. 31. Littleton, CO: Colorado School of Mines, Golden, 2–4.
Cilona, A., Baud, P., Tondi, E., Agosta, F., Vinciguerra, S., Rustichelli, A., et al. (2012). Deformation bands in porous carbonate grainstones: field and laboratory observations. J. Struct. Geol. 45, 137–157. doi: 10.1016/j.jsg.2012.04.012
Cilona, A., Faulkner, D. R., Tondi, E., Agosta, F., Mancini, L., Rustichelli, A., et al. (2014). The effects of rock heterogeneity on compaction localization in porous carbonates. J. Struct. Geol. 67, 75–93. doi: 10.1016/j.jsg.2014.07.008
Cnudde, V., Dierick, M., Vlassenbroeck, J., Masschaele, B., Lehmann, E., Jacobs, P., et al. (2008). High-speed neutron radiography for monitoring the water absorption by capillarity in porous materials. Nucl. Instrum. Methods Phys. Res. B 266, 155–163. doi: 10.1016/j.nimb.2007.10.030
De Beer, F. C., Le Roux, J. J., and Kearsley, E. P. (2005). Testing the durability of concrete with neutron radiography. Nucl. Instrum. Methods Phys. Res. A 542, 226–231.
De Beer, F. C., and Middleton, M. F. (2006). Neutron radiography imaging, porosity and permeability in porous rocks. S. Afr. J. Geol. 109, 541–550. doi: 10.2113/gssajg.109.4.541
De Rosis, A. (2014). A lattice Boltzmann-finite element model for two-dimensional fluid–structure interaction problems involving shallow waters. Adv. Water Resour. 65, 18–24. doi: 10.1016/j.advwatres.2014.01.003
Degruyter, W., Burgisser, A., Bachmann, O., and Malaspinas, O. (2010). Synchrotron X-ray microtomography and lattice Boltzmann simulations of gas flow through volcanic pumices. Geosphere 6, 470–481. doi: 10.1130/ges00555.1
Dewanckele, J., De Kock, T., Fronteau, G., Derluyn, H., Vontobel, P., Dierick, M., et al. (2014). Neutron radiography and X-ray computed tomography for quantifying weathering and water uptake processes inside porous limestone used as building material. Mater. Charact. 88, 86–99. doi: 10.1016/j.matchar.2013.12.007
d’Humières, D. (1992). “Generalized Lattice-Boltzmann equations,” in Rarefied Gas Dynamics: Theory and Simulations, 159, eds B. D. Shizgal, and D. P. Weave, (Washington, DC: American Institute of Aeronautics and Astronautics), 450–458. doi: 10.2514/5.9781600866319.0450.0458
d’Humières, D., Ginzburg, I., Krafczyk, M., Lallemand, P., and Luo, L-S. (2002). Multiple-relaxation-time lattice Boltzmann models in three dimensions. Philos. Trans. A Math. Phys. Eng. Sci. 360, 437–451. doi: 10.1098/rsta.2001.0955
Di Stefano, V. H., Cheshire, M. C., McFarlane, J., Kolbus, L. M., Hale, R. E., Perfect, E., et al. (2017). Spontaneous imbibition of water and determination of effective contact angles in the Eagle Ford Shale Formation using neutron imaging. J. Earth Sci. 28, 874–887. doi: 10.1007/s12583-017-0801-1
Fedrigo, A., Strobl, M., Williams, A. R., Lefmann, K., Lindelof, P. E., Jørgensen, L., et al. (2018). Neutron imaging study of ‘pattern-welded’swords from the Viking Age. Archaeol. Anthropol. Sci. 10, 1249–1263. doi: 10.1007/s12520-016-0454-5
Graham, B., Antonellini, M., and Aydin, A. (2003). Formation and growth of normal faults in carbonates within a compressive environment. Geology 31, 11–14.
Hall, S. A. (2013). Characterization of fluid flow in a shear band in porous rock using neutron radiography. Geophys. Res. Lett. 40, 2613–2618. doi: 10.1002/grl.50528
Hameed, F., Rohatsch, A., Weber, J., Zamani, B., and Zawisky, M. (2006). Investigation of Calcareous Arenites From St. Stephan’s Cathedral, Vienna. Gaithersburg, MD: NIST.
Hameed, F., Schillinger, B., Rohatsch, A., Zawisky, M., and Rauch, H. (2009). Investigations of stone consolidants by neutron imaging. Nucl. Instrum. Methods Phys. Res. A 605, 150–153. doi: 10.1016/j.nima.2009.01.139
Hejazi, S. A. H., Shah, S., and Pini, R. (2019). Dynamic measurements of drainage capillary pressure curves in carbonate rocks. Chem. Eng. Sci. 200, 268–284. doi: 10.1016/j.ces.2019.02.002
Huang, Y., Ringrose, P. S., and Sorbie, K. S. (1995). Waterflood displacement mechanisms in a laminated rock slab: validation of predicted capillary trapping mechanisms. SPE Reserv. Eng. 10, 287–292. doi: 10.2118/28942-pa
Jerauld, G. R., and Rathmell, J. J. (1997). Wettability and relative permeability of Prudhoe Bay: a case study in mixed-wet reservoirs. SPE Reserv. Eng. 12, 58–65. doi: 10.2118/28576-PA
Ji, Y., Hall, S., Baud, P., and Wong, T.-f. (2015). Characterization of pore structure and strain localization in Majella limestone by X-ray computed tomography and digital image correlation. Geophys. J. Int. 200, 701–719. doi: 10.1093/gji/ggu414
Kaestner, A., Mannes, D., Hovind, J., Boillat, P., and Lehmann, E. (2016). “Combined neutron and x-ray imaging on different length scales,” in Proceedings of the 6th Conference on Industrial Computed Tomography, Wels.
Kaestner, A. P. (2011). MuhRec—A new tomography reconstructor. Nucl. Instrum. Methods Phys. Res. A 651, 156–160. doi: 10.1016/j.nima.2011.01.129
Kaestner, A. P., Hartmann, S., Kühne, G., Frei, G., Grünzweig, C., Josic, L., et al. (2011). The ICON beamline–A facility for cold neutron imaging at SINQ. Nucl. Instrum. Methods Phys. Res. A 659, 387–393. doi: 10.1016/j.nima.2011.08.022
Kaestner, A. P., Hovind, J., Boillat, P., Muehlebach, C., Carminati, C., Zarebanadkouki, M., et al. (2017). Bimodal imaging at ICON using neutrons and X-rays. Phys. Proc. 88, 314–321. doi: 10.1016/j.phpro.2017.06.043
Kaminskaite, I., Fisher, Q. J., and Michie, E. A. H. (2019). Microstructure and petrophysical properties of deformation bands in high porosity carbonates. J. Struct. Geol. 119, 61–80. doi: 10.1016/j.jsg.2018.12.001
Kanematsu, M., Maruyama, I., Noguchi, T., Iikura, H., and Tsuchiya, N. (2009). Quantification of water penetration into concrete through cracks by neutron radiography. Nucl. Instrum. Methods Phys. Res. A 605, 154–158. doi: 10.1016/j.nima.2009.01.206
Keehm, Y., Mukerji, T., and Nur, A. (2004). Permeability prediction from thin sections: 3D reconstruction and Lattice-Boltzmann flow simulation. Geophys. Res. Lett. 31:L04606.
Khan, F., Enzmann, F., Kersten, M., Wiegmann, A., and Steiner, K. (2012). 3D simulation of the permeability tensor in a soil aggregate on basis of nanotomographic imaging and LBE solver. J. Soils Sedim. 12, 86–96. doi: 10.1007/s11368-011-0435-3
Ladd, A. J. (1994). Numerical simulations of particulate suspensions via a discretized Boltzmann equation. Part 1. Theoretical foundation. J. Fluid Mech. 271, 285–309. doi: 10.1017/s0022112094001771
Lal, S., Poulikakos, L. D., Gilani, M. S., Jerjen, I., Vontobel, P., Partl, M. N., et al. (2014). Investigation of water uptake in porous asphalt concrete using neutron radiography. Trans. Porous Media 105, 431–450. doi: 10.1007/s11242-014-0376-6
Marchesini, P. (2015). Visualization and Quantification of Fluid Dynamics in Fractured Carbonates using 4D Ground Penetrating Radar (4D GPR. Available at: http://scholarlyrepository.miami.edu/oa_dissertations/1529 (accessed February, 2018).
Morrow, N. R., and Melrose, J. C. (1991). “Application of capillary pressure measurements to the determination of connate water saturation,” in Interfacial Phenomena in Petroleum Recovery, ed. N. R. Morrow, (New York, NY: Marcel Dekker Inc), 257–287.
Mutti, M. (1995). Porosity development and diagenesis in the Orfento supersequence and its bounding unconformities (Upper Cretaceous, Montagna della Majella, Italy). Am. Assoc. Petrol. Geol. Spec. Publ. 63, 141–158.
Ori, G. G., Roveri, M., and Vannoni, F. (1986). “Plio-Pleistocene sedimentation in the Apennine–Adriatic foredeep (central Adriatic Sea, Italy),” in Foreland Basins, eds P. A. Allen, and P. Homewood, (Oxford: Blackwell), 183–198. doi: 10.1002/9781444303810.ch9
Ren, F., Song, B., and Sukop, M. C. (2016). Terminal shape and velocity of a rising bubble by phase-field-based incompressible Lattice Boltzmann model. Adv. Water Resour. 97, 100–109. doi: 10.1016/j.advwatres.2016.08.012
Riaz, A., Tang, G. Q., Tchelepi, H. A., and Kovscek, A. R. (2007). Forced imbibition in natural porous media: comparison between experiments and continuum models. Phys. Rev. E 75:036305.
Riegel, H., Zambrano, M., Balsamo, F., Mattioni, L., and Tondi, E. (2019). Petrophysical properties and microstructural analysis of faulted heterolithic packages: a case study from miocene turbidite successions, Italy. Geofluids 2019:9582359.
Rustichelli, A., Torrieri, S., Tondi, E., Laurita, S., Strauss, C., Agosta, F., et al. (2016). Fracture characteristics in cretaceous platform and overlaying ramp carbonates: an outcrop study from Maiella mountain (central Italy). Mar. Petrol. Geol. 76, 68–87. doi: 10.1016/j.marpetgeo.2016.05.020
Salathiel, R. A. (1973). Oil recovery by surface film drainage in mixed-wettability rocks. J. Petrol. Technol. 25, 1216–1224. doi: 10.2118/4104-pa
Schillinger, B., Beaudet, A., Fedrigo, A., Grazzi, F., Kullmer, O., Laaß, M., et al. (2018). Neutron imaging in cultural heritage research at the FRM II reactor of the Heinz Maier-Leibnitz center. J. Imaging 4:22. doi: 10.3390/jimaging4010022
Schillinger, B., Calzada, E., Eulenkamp, C., Jordan, G., and Schmahl, W. W. (2011). Dehydration of moulding sand in simulated casting process examined with neutron radiography. Nucl. Instrum. Methods Phys. Res. Sect. A 651, 312–314. doi: 10.1016/j.nima.2011.02.103
Schillinger, B., Lehmann, E., and Vontobel, P. (2000). 3D neutron computed tomography: requirements and applications. Phys. B Condens. Matter 276, 59–62. doi: 10.1016/s0921-4526(99)01254-5
Schindelin, J., Arganda-Carreras, I., Frise, E., Kaynig, V., Longair, M., Pietzsch, T., et al. (2012). Fiji: an open-source platform for biological-image analysis. Nat. Methods 9:676e682. doi: 10.1038/nmeth.2019
Schneider, C. A., Rasband, W. S., and Eliceiri, K. W. (2012). NIH image to ImageJ: 25 years of image analysis. Nat. Methods 9:671. doi: 10.1038/nmeth.2089
Sekti, R. P. (2010). 3-D Stratigraphy and Fracture Characterization in Late Cretaceous Carbonates (Madonna della Mazza, Italy. Available at: http://scholarlyrepository.miami.edu/oa_theses/38 (accessed February, 2018).
Shah, S. M., Gray, F., Crawshaw, J. P., and Boek, E. S. (2016). Micro-computed tomography pore-scale study of flow in porous media: effect of voxel resolution. Adv. Water Resourc. 95, 276–287. doi: 10.1016/j.advwatres.2015.07.012
Stavropoulou, E., Andò, E., Tengattini, A., Briffaut, M., Dufour, F., Atkins, D., et al. (2019). Liquid water uptake in unconfined Callovo Oxfordian clay-rock studied with neutron and X-ray imaging. Acta Geotechn. 14, 19–33. doi: 10.1007/s11440-018-0639-4
Tondi, E. (2007). Nucleation, development and petrophysical properties of faults in carbonate grainstones: evidence from the San Vito Lo Capo peninsula (Sicily. Italy). J. Struct. Geol. 29, 614–628. doi: 10.1016/j.jsg.2006.11.006
Tondi, E., Antonellini, M., Aydin, A., Marchegiani, L., and Cello, G. (2006). The role of deformation bands, stylolites and sheared stylolites in fault development in carbonate grainstones of Majella Mountain, Italy. J. Struct. Geol. 28, 376–391. doi: 10.1016/j.jsg.2005.12.001
Tondi, E., Cilona, A., Agosta, F., Aydin, A., Rustichelli, A., Renda, P., et al. (2012). Growth processes, dimensional parameters and scaling relationships of two conjugate sets of compactive shear bands in porous carbonate grainstones, Favignana Island, Italy. J. Struct. Geol. 37, 53–64. doi: 10.1016/j.jsg.2012.02.003
Tondi, E., Rustichelli, A., Cilona, A., Balsamo, F., Storti, F., Napoli, G., et al. (2016). Hydraulic properties of fault zones in porous carbonates, examples from central and southern Italy. Ital. J. Geosci. 135, 68–79. doi: 10.3301/ijg.2015.08
Treiber, L. E., and Owens, W. W. (1972). A laboratory evaluation of the wettability of fifty oil-producing reservoirs. Soc. Petrol. Eng. J. 12, 531–540. doi: 10.2118/3526-PA
Vlassenbroeck, J., Masschaele, B., Cnudde, V., Dierick, M., Pieters, K., Van Hoorebeke, L., et al. (2006). “Octopus 8: a high performance tomographic reconstruction package for X-ray tube and synchrotron micro-CT,” in Advances in X-ray Tomography for Geomaterials, eds J. Desrues, G. Viggiani, and P. Bésuelle (London: ISTE), 167–173. doi: 10.1002/9780470612187.ch13
Voltolini, M., Kwon, T. H., and Ajo-Franklin, J. (2017). Visualization and prediction of supercritical CO2 distribution in sandstones during drainage: an in situ synchrotron X-ray micro-computed tomography study. Int. J. Greenhouse Gas Control 66, 230–245. doi: 10.1016/j.ijggc.2017.10.002
Xie, C., Raeini, A. Q., Wang, Y., Blunt, M. J., and Wang, M. (2017). An improved pore-network model including viscous coupling effects using direct simulation by the lattice Boltzmann method. Adv. Water Resour. 100, 26–34. doi: 10.1016/j.advwatres.2016.11.017
Yang, X., Mehmani, Y., Perkins, W. A., Pasquali, A., Schönherr, M., Kim, K., et al. (2016). Intercomparison of 3D pore-scale flow and solute transport simulation methods. Adv. Water Resour. 95, 176–189. doi: 10.1016/j.advwatres.2015.09.015
Yehya, M., Andò, E., Dufour, F., and Tengattini, A. (2018). Fluid-flow measurements in low permeability media with high pressure gradients using neutron imaging: application to concrete. Nucl. Instrum. Methods Phys. Res. A 890, 35–42. doi: 10.1016/j.nima.2018.02.039
Zambrano, M., Tondi, E., Mancini, L., Arzilli, F., Lanzafame, G., Materazzi, M., et al. (2017). 3D Pore-network quantitative analysis in deformed carbonate grainstones. Mar. Petrol. Geol. 82, 251–264. doi: 10.1016/j.marpetgeo.2017.02.001
Zambrano, M., Tondi, E., Mancini, L., Lanzafame, G., Trias, F. X., Arzilli, F., et al. (2018). Fluid flow simulation and permeability computation in deformed porous carbonate grainstones. Adv. Water Resour. 115, 95–111. doi: 10.1016/j.advwatres.2018.02.016
Zandomeneghi, D., Voltolini, M., Mancini, L., Brun, F., Dreossi, D., and Polacci, M. (2010). Quantitative analysis of X-ray microtomography images of geomaterials: application to volcanic rocks. Geosphere 6, 793–804. doi: 10.1130/ges00561.1
Zawisky, M., Hameed, F., Dyrnjaja, E., Springer, J., and Rohatsch, A. (2010). Digitized neutron imaging with high spatial resolution at a low power research reactor: applications to steel and rock samples. Nucl. Instrum. Methods Phys. Res. B 268, 2446–2450. doi: 10.1016/j.nimb.2010.04.020
Zhang, P., Wittmann, F. H., Zhao, T., and Lehmann, E. H. (2010). Neutron imaging of water penetration into cracked steel reinforced concrete. Phys. B Condens. Matter. 405, 1866–1871. doi: 10.1016/j.physb.2010.01.065
Zhang, P., Wittmann, F. H., Zhao, T. J., Lehmann, E. H., and Vontobel, P. (2011). Neutron radiography, a powerful method to determine time-dependent moisture distributions in concrete. Nucl. Eng. Design 241, 4758–4766. doi: 10.1016/j.nucengdes.2011.02.031
Keywords: neutron radiography, neutron tomography, X-ray microtomography, fluid flow, porous media, grainstones
Citation: Zambrano M, Hameed F, Anders K, Mancini L and Tondi E (2019) Implementation of Dynamic Neutron Radiography and Integrated X-Ray and Neutron Tomography in Porous Carbonate Reservoir Rocks. Front. Earth Sci. 7:329. doi: 10.3389/feart.2019.00329
Received: 08 July 2019; Accepted: 27 November 2019;
Published: 19 December 2019.
Edited by:
Sung Keun Lee, Seoul National University, South KoreaReviewed by:
Youngseuk Keehm, Kongju National University, South KoreaYoshio Kono, Ehime University, Japan
Copyright © 2019 Zambrano, Hameed, Anders, Mancini and Tondi. This is an open-access article distributed under the terms of the Creative Commons Attribution License (CC BY). The use, distribution or reproduction in other forums is permitted, provided the original author(s) and the copyright owner(s) are credited and that the original publication in this journal is cited, in accordance with accepted academic practice. No use, distribution or reproduction is permitted which does not comply with these terms.
*Correspondence: Miller Zambrano, bWlsbGVyLnphbWJyYW5vQHVuaWNhbS5pdA==
 Miller Zambrano
 Fareeha Hameed
 Kaestner Anders
 Lucia Mancini
 Emanuele Tondi