 Katsuichiro Goda
 Nobuhito Mori
 Tomohiro Yasuda
 Adi Prasetyo
 Ario Muhammad
 Daiki Tsujio7
- 1Department of Earth Sciences, University of Western Ontario, London, ON, Canada
- 2Department of Statistical and Actuarial Sciences, University of Western Ontario, London, ON, Canada
- 3Disaster Prevention Research Institute, Kyoto University, Kyoto, Japan
- 4Kansai University, Osaka, Japan
- 5Research Center for Water Resources, Indonesia Ministry of Public Works and Housing, Jakarta, Indonesia
- 6Narotama University, Surabaya, Indonesia
- 7Pacific Consultants Co., Ltd., Tokyo, Japan
Multiple cascading hazards triggered by the 2018 Sulawesi, Indonesia, earthquake caused various compounding consequences. A major strike-slip fault movement with along-dip components resulted in intense ground shaking, liquefaction and lateral spreading, large-scale mudflows, and tsunamis. This paper presents observations of such multi-hazard effects on buildings and infrastructure in areas along Palu Bay, based on field reconnaissance work, and discusses the main causes of the disaster by focusing upon the combined effects of the cascading geological hazards. To evaluate the tsunami risk potential of the strike-slip event, tsunami simulations for the 2018 Sulawesi earthquake are performed by considering different model settings for spatial earthquake slip distribution, rake angle, astronomical tidal effect, and co-seismic ground deformation. The numerical results indicate that the co-seismic rupture of a moment magnitude 7.5 strike-slip earthquake, having notable dip components can generate damaging tsunami waves at coastal locations of Palu Bay. The conclusion has important implications for future tsunami hazard assessments in active seismic regions where major fault systems cut across a bay or into the sea.
Introduction
On September 28, 2018, a large earthquake of moment magnitude (Mw) 7.5 struck Sulawesi Island, Indonesia (United States Geological Survey [USGS], 2018). The earthquake occurred along the Palu-Koro Fault, which is known to be active and is influenced by the complex tectonic interaction of major subducting plates. In the past, the Palu-Koro Fault zone caused several deadly earthquake disasters (Pelinovsky et al., 1997; Thein et al., 2014; Cipta et al., 2016). The capital city Palu of Central Sulawesi Province, which is home to more than 375,000 people, was devastated by cascading geological hazards (Sahadewa et al., 2019; Widiyanto et al., 2019) – strong shaking due to the mainshock, triggered tsunamis, and large-scale mass movements. As of February 2019, the numbers of deaths/missing and injured exceeded 4,340 and 4,438, respectively. The number of buildings damaged is greater than 68,451, and the total economic loss of the event was estimated at 1.1 billion U.S. dollars (BNPB, 2019).
The earthquake revealed damage in various ways. The Palu-Koro Fault runs underneath Palu (Figure 1), and the earthquake rupture caused significant shaking in the city. The estimated shaking intensity was IX (Violent) on the 12-scale Modified Mercalli Intensity (United States Geological Survey [USGS], 2018), and ground motion recordings having peak ground acceleration (PGA) of 0.21 g to 0.34 g were observed (Sahadewa et al., 2019). This level of shaking approximately corresponds to a 500-year return period seismic hazard in terms of MMI (Cipta et al., 2016). Consequently, multiple buildings, including a large shopping complex, hospital, hotel, and apartment, collapsed. The earthquake rupture was mainly of strike-slip but with along-dip components on a steeply inclined fault plane (United States Geological Survey [USGS], 2018). The rupture triggered tsunamis within Palu Bay and caused permanent subsidence of approximately 1 m near the bay area of Palu City (Heidarzadeh et al., 2019). Moreover, earthquake shaking induced underwater landslides at several locations around Palu Bay, which caused local tsunamis (Muhari et al., 2018; Pakoksung et al., 2019; Sasa and Takagawa, 2019). The tsunamis washed away numerous houses and destroyed port facilities along the coastal line of Palu Bay. Due to the landside in Palu City, three major mudflows were triggered at Petobo, Balaroa, and Jono Oge, swiping off numerous houses along the directions of the mass movements (Hidayat et al., under review).
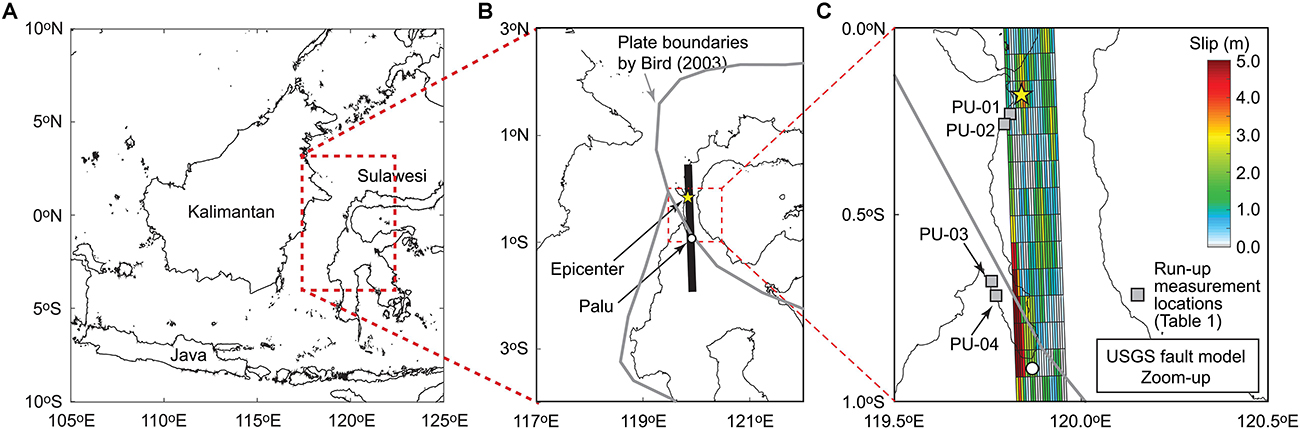
Figure 1. (A) Map of Western Indonesia, (B) USGS model for the 2018 Sulawesi earthquake, and (C) zoom-up of the USGS model near Palu.
There are several notable characteristics about this earthquake. The triggering of damaging tsunami waves by an Mw7.5 strike-slip event is not common because of the relatively small vertical ground deformation due to the fault rupture. Two possible reasons for larger than expected tsunamis are, the concentration of large earthquake slips at shallow depths within Palu Bay and underneath Palu City (United States Geological Survey [USGS], 2018; Ulrich et al., 2019), and the occurrence of underwater landslides (Muhari et al., 2018; Pakoksung et al., 2019; Sasa and Takagawa, 2019). The coincidence of the earthquake with the high tide phase amplified the effect on tsunami inundation. On the other hand, the large-scale mudflows at Petobo, Balaroa, and Jono Oge occurred on gentle slopes of about 1–3%. Their occurrence mechanisms can be attributed to liquefaction-induced-unlimited flow, where the existence of ground water flow in near-surface sandy soil layers escalated the mass movements over a few kilometers (Hidayat et al., under review).
In the current literature, there are mixed opinions with regard to the devastating tsunami damage caused by the 2018 Sulawesi earthquake. Several studies indicated that the main cause of the deadly tsunami was submarine landslides within Palu Bay (Muhari et al., 2018; Pakoksung et al., 2019; Sasa and Takagawa, 2019), whereas a detailed geophysical modeling by Ulrich et al. (2019) suggested that a large portion of the observed tsunami waves could be explained by the tsunami being induced by the earthquake rupture, implying that the submarine landslides were not the sole source of the tsunami waves. It is difficult to conclude the main causes of the large tsunami because the earthquake source modeling and tsunami simulation carried out by the above-mentioned studies differ significantly. For instance, Pakoksung et al. (2019) developed landslide-based tsunami sources by ignoring the earthquake rupture effect, whereas Ulrich et al. (2019) performed tsunami simulations based on relatively coarse grids (∼190 m) and without accounting for tidal levels at the time of the tsunami. For predicting future tsunami risks, it is important to characterize what portions of the observed tsunamis can be attributed to different mechanisms of inducing tsunami inundation and building damage, such as co-seismic rupture, ground subsidence/uplift, tidal effect, and remaining factors (e.g., submarine landslides). Importantly, the improved modeling capability leads to more effective earthquake risk mitigation against future geological multi-hazards and contributes to more effective development of multi-hazard georisk maps and mitigation strategies. The existing literature on integrated multi-risk assessments due to cascading hazards (Marzocchi et al., 2012; Selva, 2013; Gill and Malamud, 2014; Mignan et al., 2014; Liu et al., 2015) can be applied and extended for such purposes.
In light of the aforementioned ideas, this paper aims to achieve two goals. The first objective is to present field observations from the 2018 Sulawesi earthquake that were made by the authors and relate them to seismological information of the event (section “2018 Sulawesi Earthquake”). The field work was led by the Research Center for Water Resources, Indonesian Ministry of Public Works and Housing (Pusair PUPR) from December 18 to 22, 2018. Gathering the first-hand hazard and damage data and gaining new knowledge from a field investigation are of critical importance in understanding the exact causes of the disaster. The data serve as ground-truth of the event and are valuable for numerical modeling/simulations of cascading geological hazards and risks. The second objective of this paper is to discuss the tsunami risk potential of the strike-slip event based on existing field data and other knowledge (section “Tsunami Inundation Simulation of the 2018 Sulawesi Earthquake”). Finally, several concluding remarks are made in section “Concluding Remarks” to summarize the key findings from this event and to understand the complete picture of earthquake-tsunami hazard and risk mitigation in other seismic regions where strike-slip faults are dominant sources of earthquake hazards and risks.
2018 Sulawesi Earthquake
Earthquake Rupture
Sulawesi Island is located within a triple junction of the Australian, Philippine, and Sunda Plates, being affected by the complex interaction of their movements (Bird, 2003). The 2018 Sulawesi earthquake originated from the Palu-Koro Fault, which connects to the Minahasa Trench in the north and to the Matano and Lawanopo Faults in the south and is a major active seismic source in the region (Cipta et al., 2016). Based on GPS data, the Palu-Koro Fault zone accommodates about 40 mm/year of deformation (Socquet et al., 2006).
The United States Geological Survey [USGS] (2018) carried out teleseismic source inversion of the 2018 Sulawesi earthquake and produced a finite fault model for this event, consisting of a single fault plane. Based on the USGS model, the fault length and width were estimated as 264 and 36.75 km, respectively, whereas the strike, dip, and rake angles were estimated as 358°, 66°, and 343°, respectively. The fault plane was steeply inclined, but not vertical. The epicenter of the earthquake was positioned at the northern part of the rupture plane, and the rupture front propagated southwards (Figure 1B). The estimated slip distribution of the USGS model indicates that large slips exceeding 5 m are concentrated around Palu Bay (Figure 1C). This was one of the main reasons that various modes of destruction resulted in and around Palu City (i.e., strong shaking, triggering of underwater landslides and local tsunamis, and mass movements). The rake angles of the USGS model in individual subfaults show the different directions of vertical fault motions along the fault strike, meaning that both subsidence (normal) and uplift (reverse) of the ground occurred on the same side of the fault.
A source inversion carried out by Ulrich et al. (2019), which matched both teleseismic waveforms and satellite-based geodetic observations, produced detailed images of earthquake rupture processes. Their source model involves three fault planes, propagating rupture from the northern segment (where the epicenter is located) to the southern segment. The slip distribution of the Ulrich et al. (2019) model shows a higher concentration of slips at a depth of about 10 km and shows slip values exceeding 5 m, which is similar to the USGS model. One main difference between the USGS model and the Ulrich et al. model is that the rake angles of the Ulrich et al. model in individual subfaults consistently exhibit normal components along the fault strike, unlike mixed modes of normal and reverse components for the USGS model. This means that in the Ulrich et al. model, the eastern side of the fault experienced subsidence consistently [see Figure 7 in Ulrich et al. (2019)], whereas in the USGS model, both subsidence and uplift occurred along the fault strike [see Figure 6 in Heidarzadeh et al. (2019)]. Different vertical ground deformation profiles lead to different tsunami waves generated by the earthquake rupture (e.g., Heidarzadeh et al., 2019; Ulrich et al., 2019), and such differences can be regarded as model uncertainty associated with source inversion analysis. A further discussion related to this uncertainty is given in section “Tsunami Inundation Simulation of the 2018 Sulawesi Earthquake.”
Earthquake-Tsunami Field Investigation
During December 18 – 22, 2018, a field investigation of the earthquake and tsunami damage from the 2018 Sulawesi event was conducted in Palu City and surrounding areas by Pusair PUPR and the authors. Field data were collected in the form of digital photographs, recorded inundation marks, and damage observations, as well as discussions with local engineers and eyewitnesses. Sites around Palu Bay were visited, where the most severe damage occurred. All data were archived and provided to the Indonesian community through Pusair PUPR.
A map of Palu Bay is presented in Figure 2, together with photos taken at several notable locations that were visited by the survey team. At Donggala port near the mouth of Palu Bay (point 1 in Figure 2), major damage to port facilities and buildings was observed due to lateral spreading of the ground, where evidence of liquefaction was noted. At several locations along the western coast of Palu Bay, local communities were completely destroyed due to tsunami waves (e.g., point 2 in Figure 2). Along the bay area of Palu City (points 3 and 4 in Figure 2), major destruction to buildings was observed, which was caused by both intense shaking and tsunami. In inland areas of Palu City, several building collapses were noted, whereas massive destruction of residential areas occurred due to large-scale mudflows (e.g., point 5 in Figure 2). At places on the eastern side of Palu Bay (points 6 and 7 in Figure 2), severe destruction of local communities was observed due to tsunami waves. In the following subsections, key findings from the field investigation are presented.
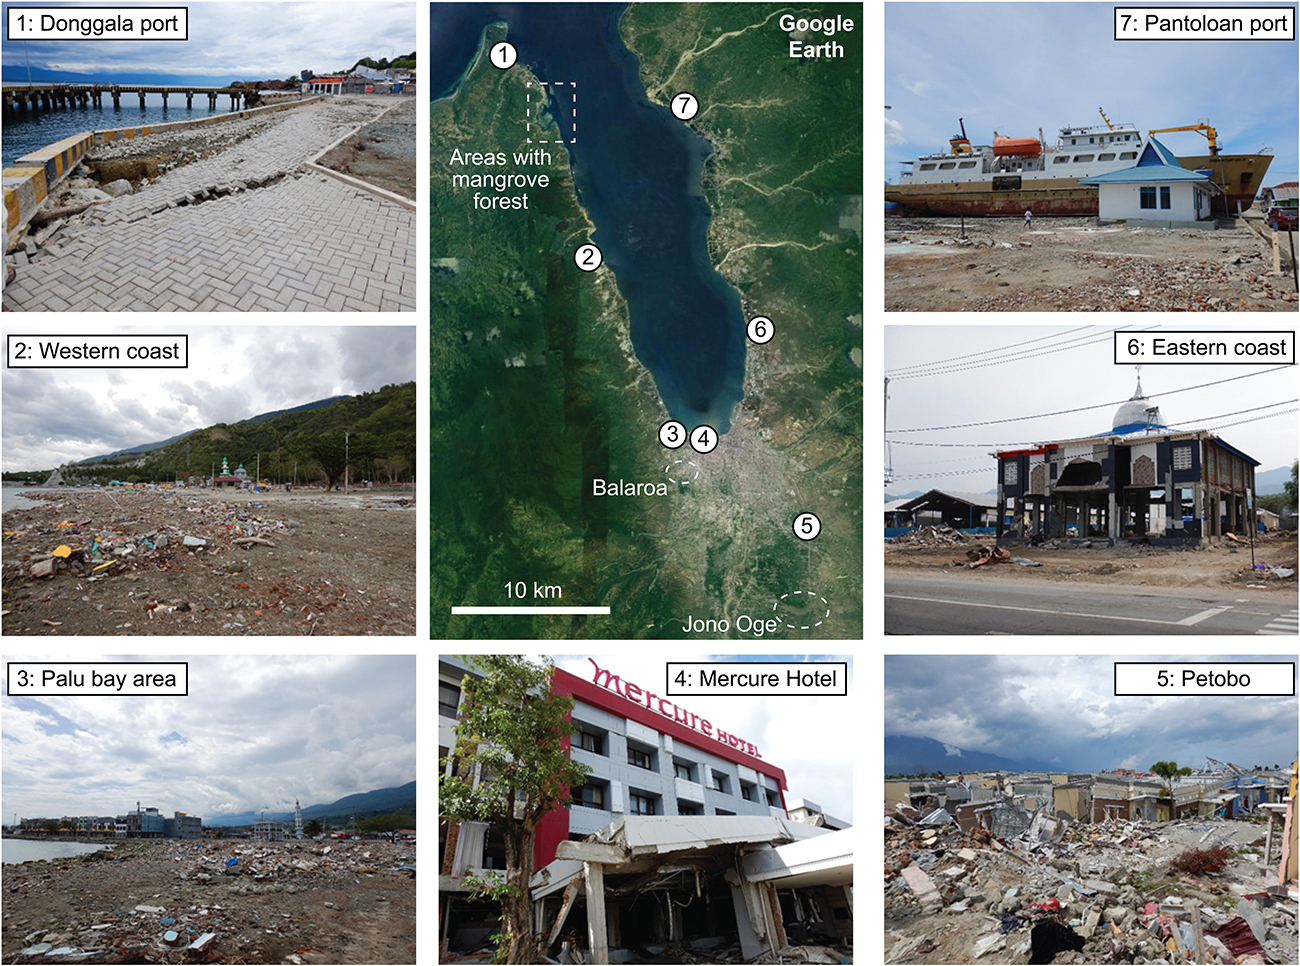
Figure 2. Earthquake damage at a glance around Palu Bay. The base satellite image is obtained from Google Earth.
Earthquake Shaking Damage
A strong ground motion was recorded at the JICA-BMGK station in Palu (Sahadewa et al., 2019). The PGA values of the E-W and N-S components were 0.29 g and 0.21 g, respectively, while that of the U-D component was 0.34 g. A larger vertical ground motion, in comparison with horizontal ones, is consistent with the large slip concentration at shallow depth underneath Palu (Figure 1C). Although a rigorous analysis of the strong ground motion record in Palu is not possible due to the unavailability of the data in a digital form, the acceleration time-series and response spectra shown by Sahadewa et al. (2019) exhibit near-fault motion features, such as velocity pulses and spectral peaks at 2.5 s, which are likely to be caused by forward directivity of rupture propagation. This is consistent with the dynamic rupture simulation results by Ulrich et al. (2019). The response spectral values at the Palu station were below the Indonesian seismic design code spectrum (typically 1/3 in the period range between 0.1 and 0.5 s), except for the period range between 2.0 and 3.5 s where the observed response spectral level reaches that of the design spectrum (Sahadewa et al., 2019). This indicates that widespread damage due to strong shaking alone would not happen (assuming that the majority of buildings in Palu are low-rise and constructed conforming to the seismic provisions). The observed ground motion levels in Palu appear to be lower than what typical modern ground motion models predict based on the seismological parameters of the event. For example, using a ground motion prediction equation by Boore et al. (2014), the expected PGA for this earthquake scenario is around 0.5 g, which is approximately twice as large as the geometric mean of the two horizontal components of the observed record (= 0.24 g). The lower observed ground motions have led to less pronounced overall shaking damage in Palu.
The coastal areas of Palu are on thick alluvial sediments and typical soil conditions can be classified as NEHRP site class D or E (Thein et al., 2014; Cipta et al., 2016); soft soils having in situ Soil Penetration Test-based N-counts of less than 10 can be found in Palu (Hidayat et al., under review). It is important to point out that the experienced level of the ground shaking in Palu (PGA = 0.24 g) during the 2018 Sulawesi earthquake is sufficient to trigger liquefaction in sandy soils. The cyclic stress ratio, which is typically taken as the seismic loading indicator for soil layers, is in the range of 0.15 to 0.25 (depending on the water table level and soil properties), and can exceed the cyclic resistance ratio for soil layers with N-counts less than 10 (e.g., Cetin et al., 2004), resulting in the triggering of liquefaction.
Due to the 2018 Sulawesi earthquake, many buildings were damaged, while several were destroyed. One of the destroyed buildings was a 5-story reinforced concrete apartment which was located 400 m from Palu Bay on the west bank of Palu River (Figure 3A). Some of the columns were fractured (Figure 3B) and shear cracks were observed on many walls. It appeared that the capacity of the columns was deficient compared with those of the beams/slabs, potentially resulting in a more dramatic failure mode, such as story collapse. At Mercure Hotel, which was along the bay promenade (100 m from Palu Bay), severe damage to columns and infill walls was observed (Figure 3C) and a spectacular collapse of one section of the building occurred (Figure 3D). It is noted that water marks on some building walls were about 0.5 m above the ground, indicating that the main cause of the building damage was due to shaking. Relatively slender columns appeared to have contributed to the dramatic failures of the structure. The two buildings that are shown in Figure 3 have a few common characteristics (e.g., mid-rise structures having longer vibration periods than other buildings in the areas and their sites being relatively soft which may amplify ground motions at the sites), enlarging the damage consequences.
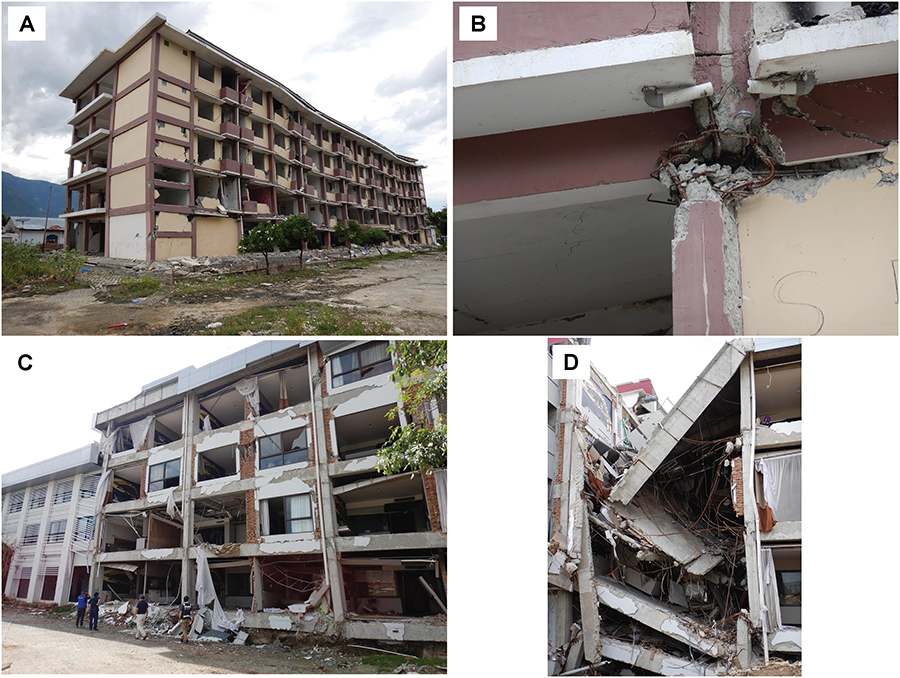
Figure 3. Observed earthquake-shaking damage in the Palu bay area (point 4 in Figure 2): (A,B) damage to a 5-story reinforced concrete apartment and (C,D) damage to Mercure Hotel.
At the mouth of Palu River (near the apartment building and Mercure Hotel), a two-span motorway bridge collapsed. The exact cause of the collapse is unknown. It may be due to damage to the bridge piers resulting from a combination of strong shaking and possible liquefaction at the foundation of the middle pier. In other parts of downtown Palu, several large buildings, e.g., a shopping mall and hospital, were destroyed.
Landslide and Mass Movement Damage
A major cause of large fatalities from this event (more than 1,300 people missing who may be still buried under the mudflows) was large-scale mass movements of soil at Petobo, Balaroa, and Jono Oge (see Figure 2 for the locations). The initiation of the mudflows was soil liquefaction caused by strong shaking. Liquefiable soil layers are prevalent in Palu (Thein et al., 2014; Cipta et al., 2016), and the observed ground motion in Palu was strong enough to trigger soil liquefaction (Sahadewa et al., 2019). The large size of the earthquake (Mw7.5) might have contributed to the increased chance of the liquefaction triggering due to a longer duration (e.g., Cetin et al., 2004). Hidayat et al. (under review) reported that soil conditions at the three locations had the potential to liquefy with low values of N-counts. Ground water levels were high due to the agricultural irrigation system at Petobo and Jono Oge and because of naturally high groundwater levels at Balaroa. Although gradients of the ground at these three locations were gentle (typically less than 3%), when a liquefaction-induced-unlimited flow was initiated, the mudflow could not have been stopped until the liquefied soil regained its shear strength and/or the ground slope was reduced (Hidayat et al., under review).
Figures 4A,B show the Google Earth images of Petobo before and after the Sulawesi earthquake. The mudflow swiped approximately a 1.5 km by 1.0 km area (from a satellite imagery). The crown area of the mudflow corresponds to the irrigation channel. Because of the irrigation system, the ground water level was high. At the foot of the mudflow (photo 5 in Figures 2, 4C), many houses were destroyed, whereas at the top of the mudflow (Figure 4D), many large tensile cracks appeared and roads as well as houses were damaged. Similar damage was also observed at Jono Oge (south of Petobo) having an even larger spatial extent of the damaged area.
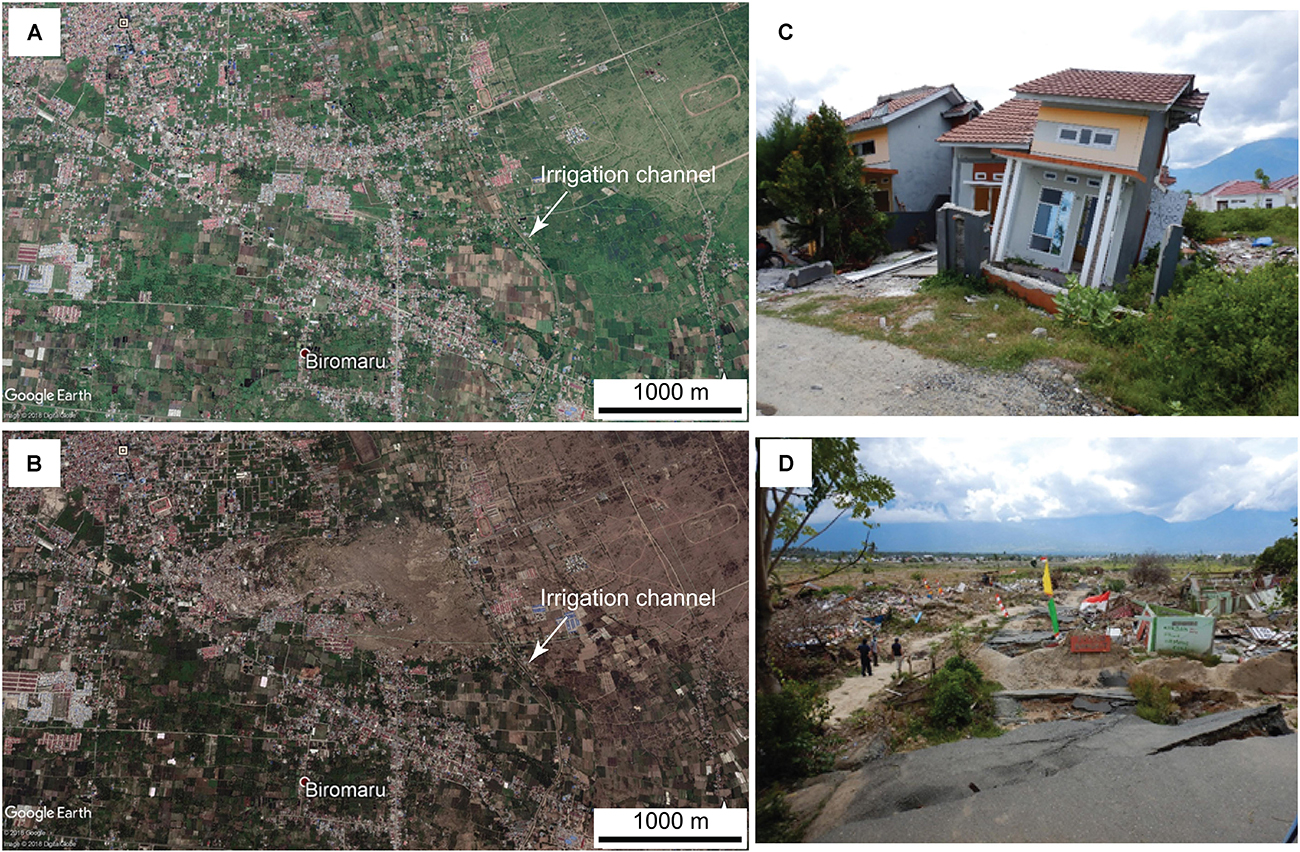
Figure 4. Large-scale landslide at Petobo: (A) Google Earth image before the earthquake, (B) Google Earth image after the earthquake, (C) destroyed houses at the foot of the landslide, and (D) destroyed houses at the crown area of the landslide (point 5 in Figure 2).
At Balaroa, a mudflow of approximately 0.5 km by 0.5 km (from a satellite imagery) occurred. Although the flow size was smaller than those of Petobo and Jono Oge, this area was more densely populated, being closer to the city center. Figures 5A,B show the Google Earth images of Balaroa before and after the event, whereas Figure 5C shows a photo taken at the crown area of the mudflow, where 3–6 m elevation gaps were observed.
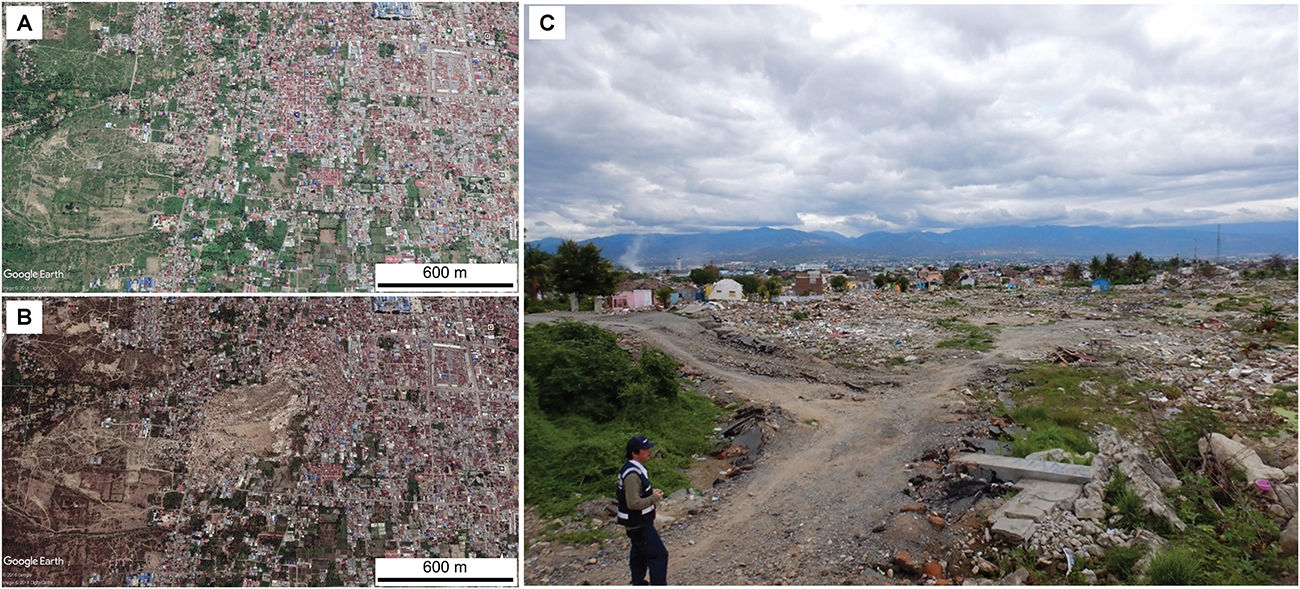
Figure 5. Large-scale landslide at Balaroa: (A) Google Earth image before the earthquake, (B) Google Earth image after the earthquake, and (C) view from the crown area of the mudflow.
Tsunami Damage
As part of the reconnaissance trip, four tsunami inundation/run-up heights were measured, and a summary of the measured heights is listed in Table 1. The reliability of the measurements is considered satisfactory to high because only clear water marks on fixed objects in consultation with local eyewitnesses were adopted. The measured heights were originally with respect to local tidal levels at the time of the measurements. Later, appropriate corrections of the measured heights were performed to obtain inundation and run-up heights during the time of the earthquake (see the last column in Table 1), with reference to the tidal datum level. A high tide period during the earthquake corresponds to about +2.3 m above the mean sea level (MSL) (Lutfi et al., 2018; Pakoksung et al., 2019), which was about +1.0 m with respect to the tidal datum level. The PU-01 and PU-02 sites were at the shoreline near the epicenter (see Figure 1C), which is outside of Palu Bay. The observed maximum inundation heights at these locations were up to 3 m. On the other hand, the PU-03 and PU-04 sites were on the western side of Palu Bay (see Figure 1C); the locations are within the ‘areas with mangrove forest’ as indicated in Figure 2. At these locations, inundation heights were up to about 2 m above the datum level.
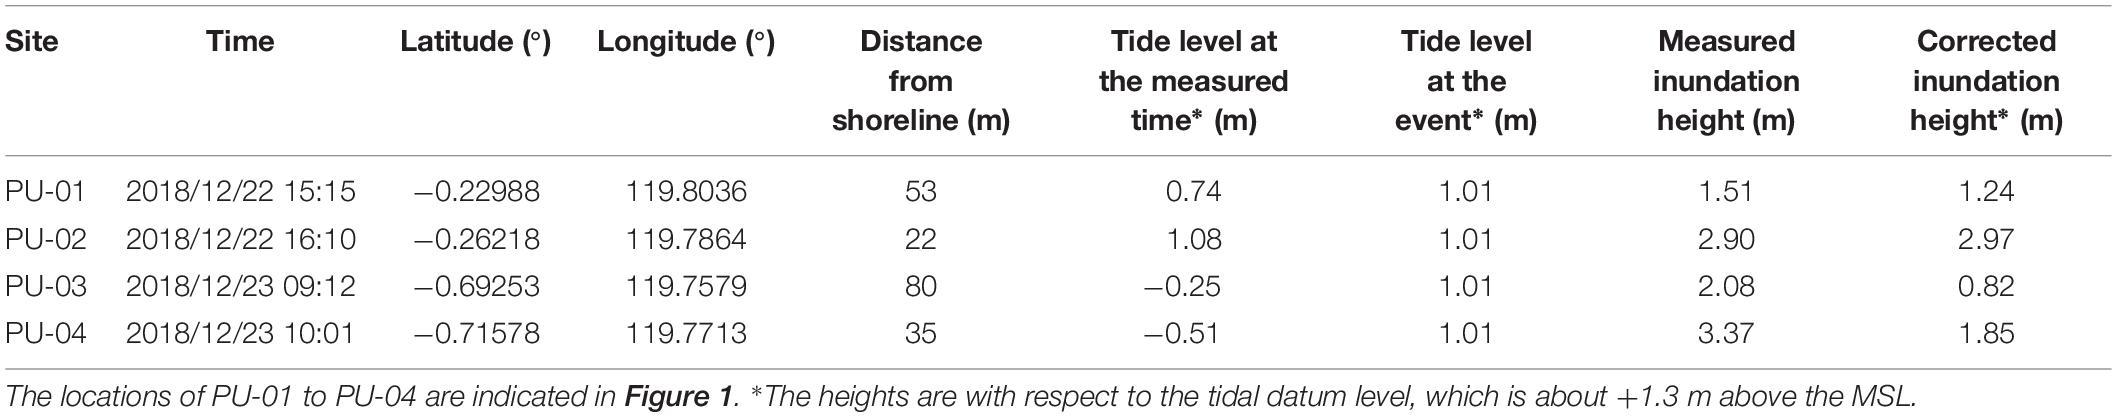
Table 1. Tsunami inundation and run-up height measurements at four locations along Palu Bay.
Tsunami damage was observed along the coastline of Palu Bay. Generally speaking, tsunami damage was more severe at the inner part and on the eastern side of Palu Bay, than the western side. This was partly because the eastern side of Palu Bay subsided due to the earthquake rupture (Heidarzadeh et al., 2019). However, there were several local communities on the western side of Palu Bay that were devastated by the tsunamis, most likely caused by local submarine landslides.
In Palu City, many 1-story and 2-story commercial/business properties (about 100–200 m from Palu Bay, near point 3 in Figure 2) were damaged by the tsunami. From the water marks and damage patterns observed at destroyed buildings (Figures 6A,B), the maximum tsunami heights were less than a few meters in height from the ground; the upper parts of the buildings were not severely affected. The foundation of some of the buildings was subjected to scouring damage (Figure 6C), whereas some notable tilt was caused by the tsunami (Figure 6D). Due to the subsidence of the bay area, normal astronomical tidal variations result in inundation of this area (up to about 300 m inland from the shoreline). These kinds of physical conditions make it challenging to carry out the recovery and reconstruction of this important area.
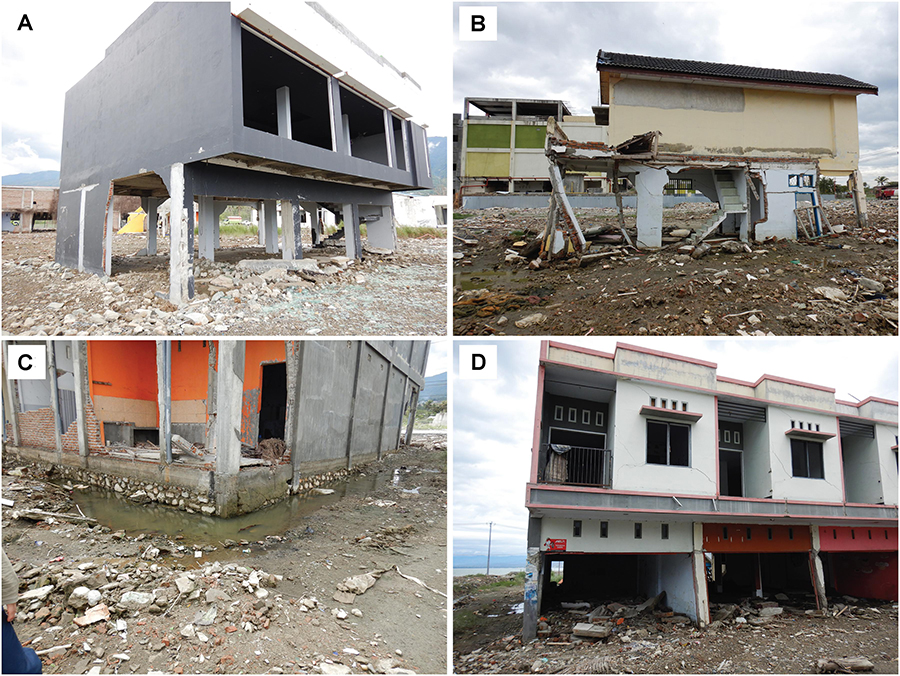
Figure 6. Observed tsunami damage in the Palu Bay area (point 3 in Figure 2): (A,B) destroyed 2-story buildings, (C) souring damage, and (D) tilted building complex.
In Donggala (western side of Palu Bay near the bay mouth, point 1 in Figure 2), damage due to tsunamis was relatively minor. However, severe damage to port facilities as well as some specific buildings occurred mainly due to liquefaction-related ground failures. A section of retaining walls in the port area was damaged due to lateral spreading and moved toward the sea. Consequently, a vertical gap of about 0.6 m was caused at the port (Figure 7A). Near the port, a residential house with a facility to keep swallows in the roof part of the building, collapsed due to a liquefaction-related foundation failure (Figure 7B). South of Donggala port, the retaining wall of the recreational area, called Pavilion Gonenggati Donggala, collapsed due to lateral spreading of the reclaimed land section (Figures 7C,D).
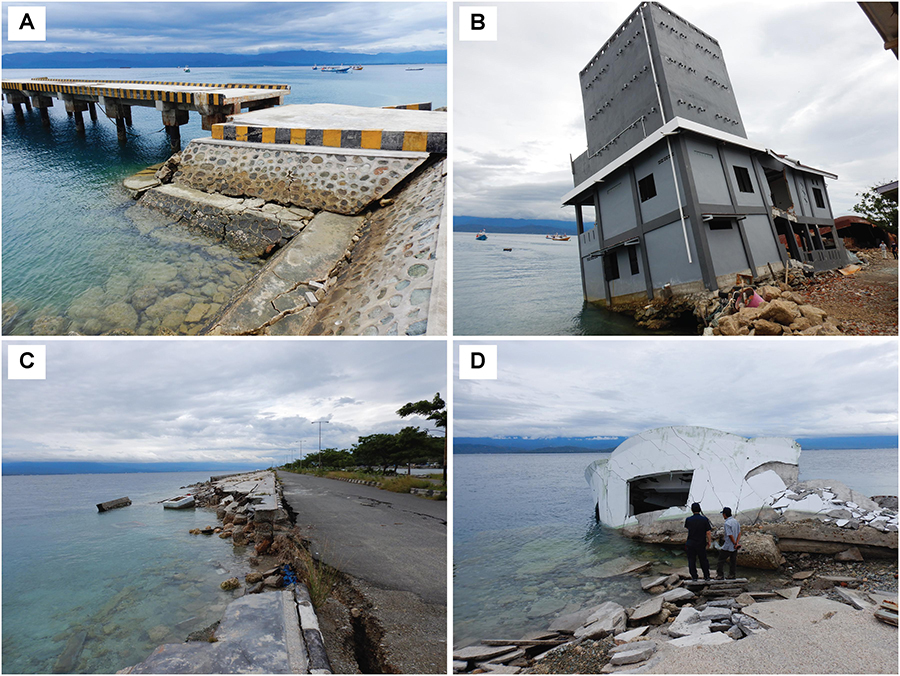
Figure 7. Observed tsunami damage near Donggala port (point 1 in Figure 2): (A) damage due to lateral spreading, (B) liquefaction-related foundation failure, and (C,D) damage due to lateral spreading at Pavilion Gonenggati Donggala.
Along the road on the western side of Palu Bay, there were several local areas that were completely devastated by the tsunami (Figure 8). These communities appeared to be sparse along the coast and were not affected by the larger-scale tsunami. This indicates that the destructive tsunamis were local and probably caused by underwater landslides (Muhari et al., 2018; Pakoksung et al., 2019; Sasa and Takagawa, 2019). On the other hand, during the field survey, it was observed that several local communities (western side of Palu Bay) that were protected by mangroves were less affected by the tsunami (see a rectangle in Figure 2). The PU-03 and PU-04 sites listed in Table 1 were in these areas and experienced the maximum tsunami height of about 2 m. Houses that faced the open part of mangrove forests were damaged/washed away, whereas those that were built behind the forests were less affected and survived. Such natural barriers can be effective in reducing the impacts of tsunami waves as observed in the 2004 Indian Ocean tsunami (e.g., Danielsen et al., 2005).
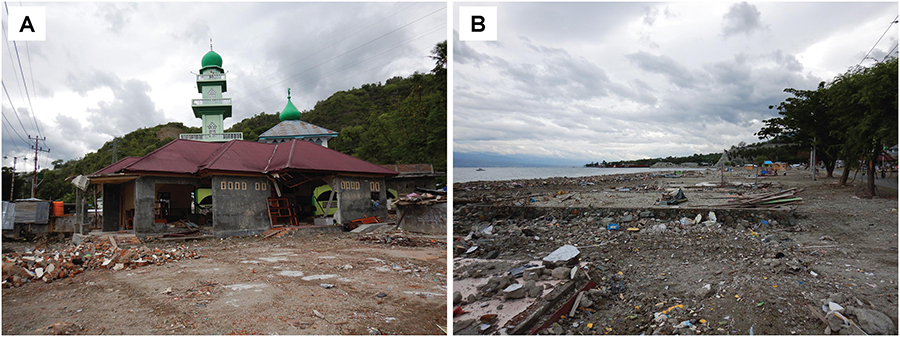
Figure 8. (A,B) Tsunami-devastated area on the western coast of Palu Bay (point 2 in Figure 2).
Along the eastern side of Palu Bay, severer tsunami damage was observed more frequently. At the old Dutch port, a section of road disappeared after the earthquake, either submerged or washed away. A large flat piece of land that was used for salt production was completely inundated, and a few buildings near the shore were damaged. The tsunami heights that were experienced at these damaged buildings appeared to be at the roof level of the first floor or higher (3–5 m range; e.g., photo 6 in Figure 2).
At the Pantoloan port (south of point 7 in Figure 2), an in situ sea surface elevation measurement was recorded during the tsunami, where the maximum wave height of about 2 m was recorded. North of the Pantoloan port, many vessels, including the large one shown in photo 7 in Figure 2, were swept ashore, and local communities were severely damaged by the tsunami (Figure 9). At locations further north outside of Palu Bay, destruction of houses was observed sporadically along the road near the epicenter. The maximum tsunami heights at these places (e.g., PU-03 and PU-04 in Table 1) were less significant compared with those inside Palu Bay but were sufficient to cause notable damage to buildings that are near the shoreline.
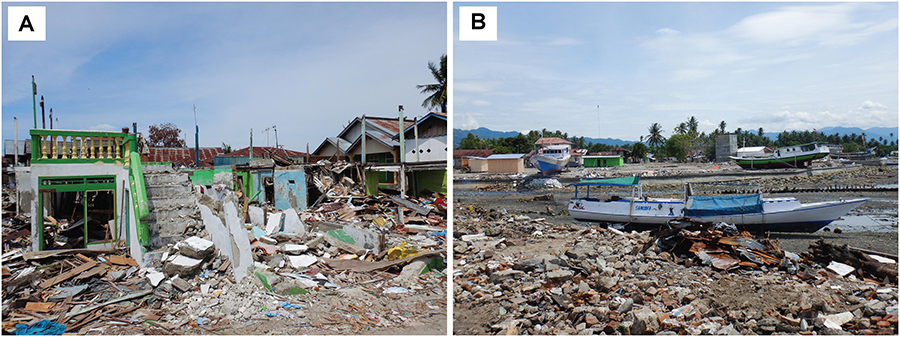
Figure 9. (A,B) Severely-damaged port area on the eastern coast of Palu Bay (point 7 in Figure 2).
Tsunami Inundation Simulation of the 2018 Sulawesi Earthquake
Motivation
For the 2018 Sulawesi earthquake, there is a large discrepancy among the tsunami simulation results that have been presented in the literature. Pakoksung et al. (2019) ignored tsunami contributions from co-seismic rupture because of small wave amplitudes and developed a tsunami model solely based on multiple submarine landslide sources (four larger and six smaller sources), involving the total submarine mass movement of 100 × 106 m3. Their conclusion that a co-seismic tsunami source can be neglected might have been reached because they used a uniform earthquake slip model for representing co-seismic earthquake rupture, which tends to underestimate simulated tsunami waves significantly (Muhammad and Goda, 2018). Another important tsunami simulation set-up adopted by Pakoksung et al. (2019) was the consideration of a high tide level of +2.3 m above the MSL at the time of the 2018 Sulawesi earthquake (Lutfi et al., 2018). At the Pantoloan tidal gauge station that is located on the eastern side of Palu Bay (point 7 in Figure 2), their landslide-triggered tsunami simulation generated about +2.0 and −3.0 m peak wave amplitudes with respect to the reference elevation level of the tsunami simulation, in comparison with the observed peak wave amplitudes of +1.8 and −2.0 m. Heidarzadeh et al. (2019) carried out their tsunami simulation based on the USGS source model (Figure 1) and showed that about +1.0 and −1.3 m peak wave amplitudes with respect to the reference elevation level of the tsunami simulation can be generated due to the co-seismic rupture. However, their tsunami simulation was based on the linear shallow water equations and coastal inundation was not accounted for. Furthermore, the high astronomical tide level was not considered in their study (partly because the run-up simulation was omitted). On the other hand, Ulrich et al. (2019) conducted a multi-physics-based source inversion of the 2018 Sulawesi earthquake and found a slip distribution similar to the USGS model with more consistent vertical slip directions along the fault strike, which result in a different pattern of vertical ground deformation with respect to the USGS model. Although they performed a tsunami run-up analysis, the high tide level was not considered, and the grid resolution was relatively coarse (190 m) for urban inundation modeling. The simulated peak wave amplitudes at the Pantoloan tidal recording station by Ulrich et al. (2019) were about +1.5 and −1.6 m with respect to the computational reference level. Moreover, their inundation simulation results showed that large run-up heights exceeding 10 m were possible at sites along Palu Bay, which were comparable to the field observations.
These previous studies illuminate that tsunami inundation simulation results are sensitive to various features of a tsunami model, including earthquake rupture characteristics (geometry, slip distribution, and rake angle), consideration of co-seismic vertical deformation, astronomical tidal level, governing equations of tsunami waves (e.g., linear versus non-linear shallow water equations), and elevation data resolution and its source (local versus global). The conclusions also depend on the choice of the observations to be matched by simulated data. Especially, tidal effects are excluded for a tsunami simulation but they are important for inundation modeling. The main motivations of the following tsunami simulations are to provide a more consistent comparison of the simulated and observed tsunamis in the coastal areas of Palu Bay and to estimate the co-seismic contributions of the tsunami. We do not model the submarine landslide-triggered tsunamis; nonetheless, the discrepancy between observations and simulations can be attributed to unmodeled aspects as a whole (not just submarine landslide-based sources).
Model Set-Up
Tsunami simulation is carried out by evaluating non-linear shallow water equations with run-up using a leap-frog staggered finite difference scheme (Goto et al., 1997). At the off-shore open-sea boundaries of the computational domain, out-going tsunami waves are allowed to pass freely. On the other hand, inundation and run-up calculations are performed by a moving-boundary approach at the water front, where a dry or wet condition of a computational cell is determined based on total water depth. The bathymetry/elevation data for the Sulawesi region are obtained from DEMNAS (2019). The local data have finer resolutions of 270 m for sea and 10 m for land, compared with global counterparts, such as GEBCO and SRTM (i.e., ∼900 and ∼30 m, respectively). The grid data are nested in five levels by following a 1/3 ratio rule, i.e., 810-m, 270-m, 90-m, 30-m, and 10-m grids. The initial tidal level is set to +2.3 m above the MSL, which is the same as Pakoksung et al. (2019). The bottom friction is evaluated using Manning’s formula by adopting n = 0.025. The fault rupture is assumed to occur instantaneously, and the simulation is conducted for a duration of 1 h with an integration time step of 0.05 s, meeting the requirement for the Courant-Friedrichs-Levy condition to ensure stable numerical simulation. In the tsunami simulation, coastal/riverside structures, such as embankments, are not taken into account.
Figures 10A,B show the nesting grid-system around Sulawesi Island and Palu Bay, whereas Figure 10C shows the bathymetry-elevation color map of Palu Bay. Palu Bay is relatively deep having a maximum depth of about 800 m (DEMNAS, 2019) and thus has steep slopes, having potential for submarine landslides. In Figure 10C, local areas of Palu City and Pantoloan port are indicated. At the Pantoloan tidal recording station, the tsunami wave profile was recorded and the Pantoloan wave data have been used as a reference in matching tsunami simulation results during the 2018 Sulawesi earthquake (Heidarzadeh et al., 2019; Pakoksung et al., 2019; Ulrich et al., 2019).
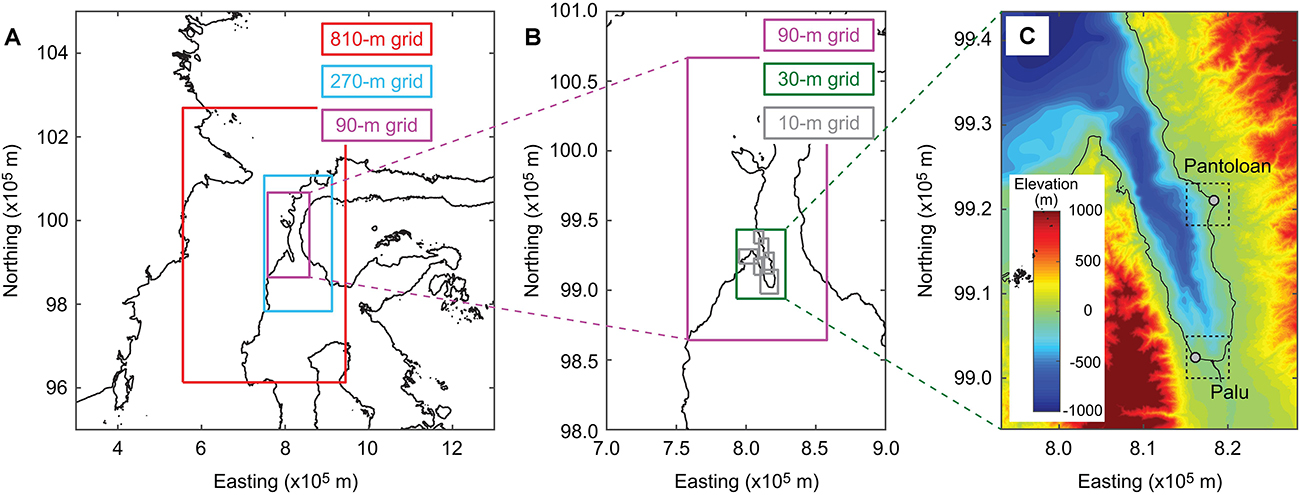
Figure 10. (A) Nesting for 810-m, 270-m, and 90-m grids, (B) Nesting for 90-m, 30-m, and 10-m grids, and (C) bathymetry-elevation data for the Palu Bay area.
To define initial boundary conditions for tsunami inundation simulation, a source model developed by the USGS (2019) is adopted (Figure 1). The vertical deformation profile due to co-seismic rupture is computed using formulae by Okada (1985) and by Tanioka and Satake (1996); the latter is to account for the effects of horizontal movement of seabed on its vertical deformation. To investigate the effects of co-seismic earthquake rupture modeling on generated tsunami wave profiles and run-up, three source models are considered. The first model is based on the USGS model, where rake angles are variable in individual subfaults, whereas the second model adopts the same slip distribution as the USGS model but with the constant rake angle of 343°. The second model is similar to the source model by Ulrich et al. (2019). In Figures 11A,B, initial water dislocation profiles in Palu Bay using the Okada and Tanioka-Satake formulae are compared for the above-mentioned two source models. Due to the variable rake angles for the first model, directions of vertical deformation inside Palu Bay shown in Figure 11A change from subsidence near Palu City to uplift near Pantoloan (from south to north) along the fault strike. On the other hand, for the second model, directions of vertical deformation inside Palu Bay are consistent, resulting in subsidence and uplift on the eastern and western sides of Palu Bay, respectively (Figure 11B). Furthermore, to investigate the effects of adopting a heterogeneous slip distribution versus a uniform slip distribution in tsunami simulation, the third source model having an average slip of 0.66 m based on the fault geometry of the USGS model (Figure 1) is considered. The initial water dislocation profiles in Palu Bay for the third model (Figure 11C) show that the co-seismic disturbance of the water is small (typically less than 0.2 m); consequently, it can be expected that the tsunami waves generated based on the uniform slip model do not cause major inundation in Palu Bay.
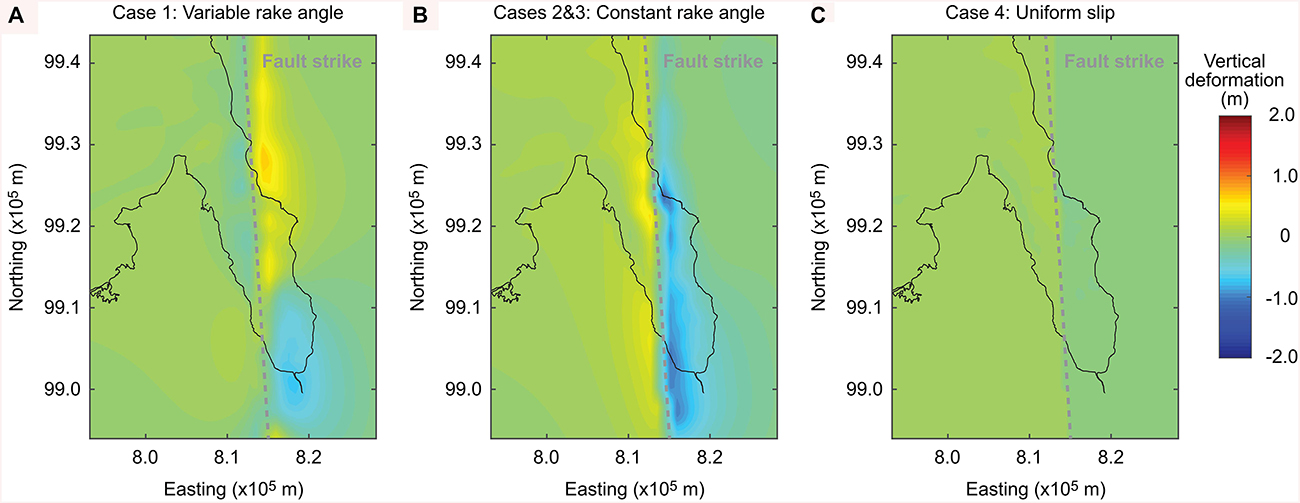
Figure 11. Initial water dislocation profiles due to earthquake rupture (i.e., co-seismic deformation): (A) the USGS model with the variable rake angle (Case 1), (B) the USGS model with the constant rake angle (Cases 2 and 3), and (C) the USGS model with the uniform slip distribution with the constant rake angle (Case 4).
In this study, four tsunami inundation simulations are performed. These cases differ in terms of: (i) spatial slip distribution (i.e., heterogeneous or uniform), (ii) rake angles in subfaults (i.e., variable or constant), and (iii) consideration of a high astronomical tidal level and co-seismic deformation (i.e., subsidence and uplift). When the effects due to the tidal level and co-seismic deformation are taken into account, the tsunami inundation simulation is run based on the modified elevation data. Table 2 summarizes the simulation set-up for the four cases. Either Case 1 or Case 2 is suitable for comparing the simulated results with the observations. The comparison between Case 2 and Case 3 will highlight the effects of accounting for the tidal level and co-seismic deformation (i.e., adjustment of the computational reference level of the ground), whereas that between Case 2 and Case 4 will emphasize the effects of spatial slip distribution.
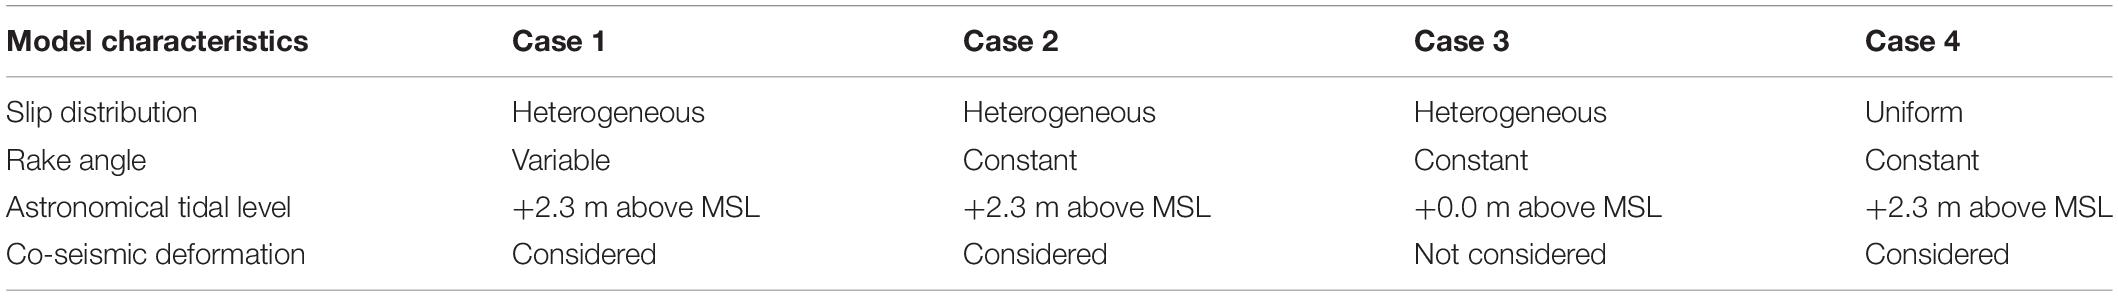
Table 2. Tsunami inundation simulation cases.
Simulation Results
Along the coastal areas of Palu Bay, damaging tsunami waves arrived, destroyed buildings that were located within inundated areas, and caused fatalities (Sahadewa et al., 2019; Widiyanto et al., 2019). It is important to examine tsunami wave profiles and tsunami inundation extent of the 2018 Sulawesi earthquake via tsunami simulation. In this section, wave profiles and inundation maps at Pantoloan port and Palu City are simulated by considering the four cases that are listed in Table 2 and are compared with the field observations (see section “2018 Sulawesi Earthquake,” such as Table 1, and those available in the literature, e.g., Pakoksung et al., 2019). The local areas that are focused upon are indicated with broken-line squares in Figure 10C. To discuss the effects of the tsunami waves on buildings, the maximum inundation depth maps are produced by accounting for the effects of the tidal level and co-seismic ground deformation. For instance, inundated areas are evaluated for the computational cells that are originally on land (i.e., positive elevation prior to the co-seismic deformation and at the MSL).
Tsunami Wave Profile and Inundation in Pantoloan Port
A comparison of the observed and simulated tsunami wave profiles is carried out at the Pantoloan station (see Figure 10C) and is shown in the bottom panels of Figure 12. The observed wave profile is obtained by removing the tidal component of the recorded waves. The simulated wave profiles based on the four cases are presented in each bottom panel; the simulated wave profiles are shifted in time to match the initial phases of the observed and simulated wave profiles.
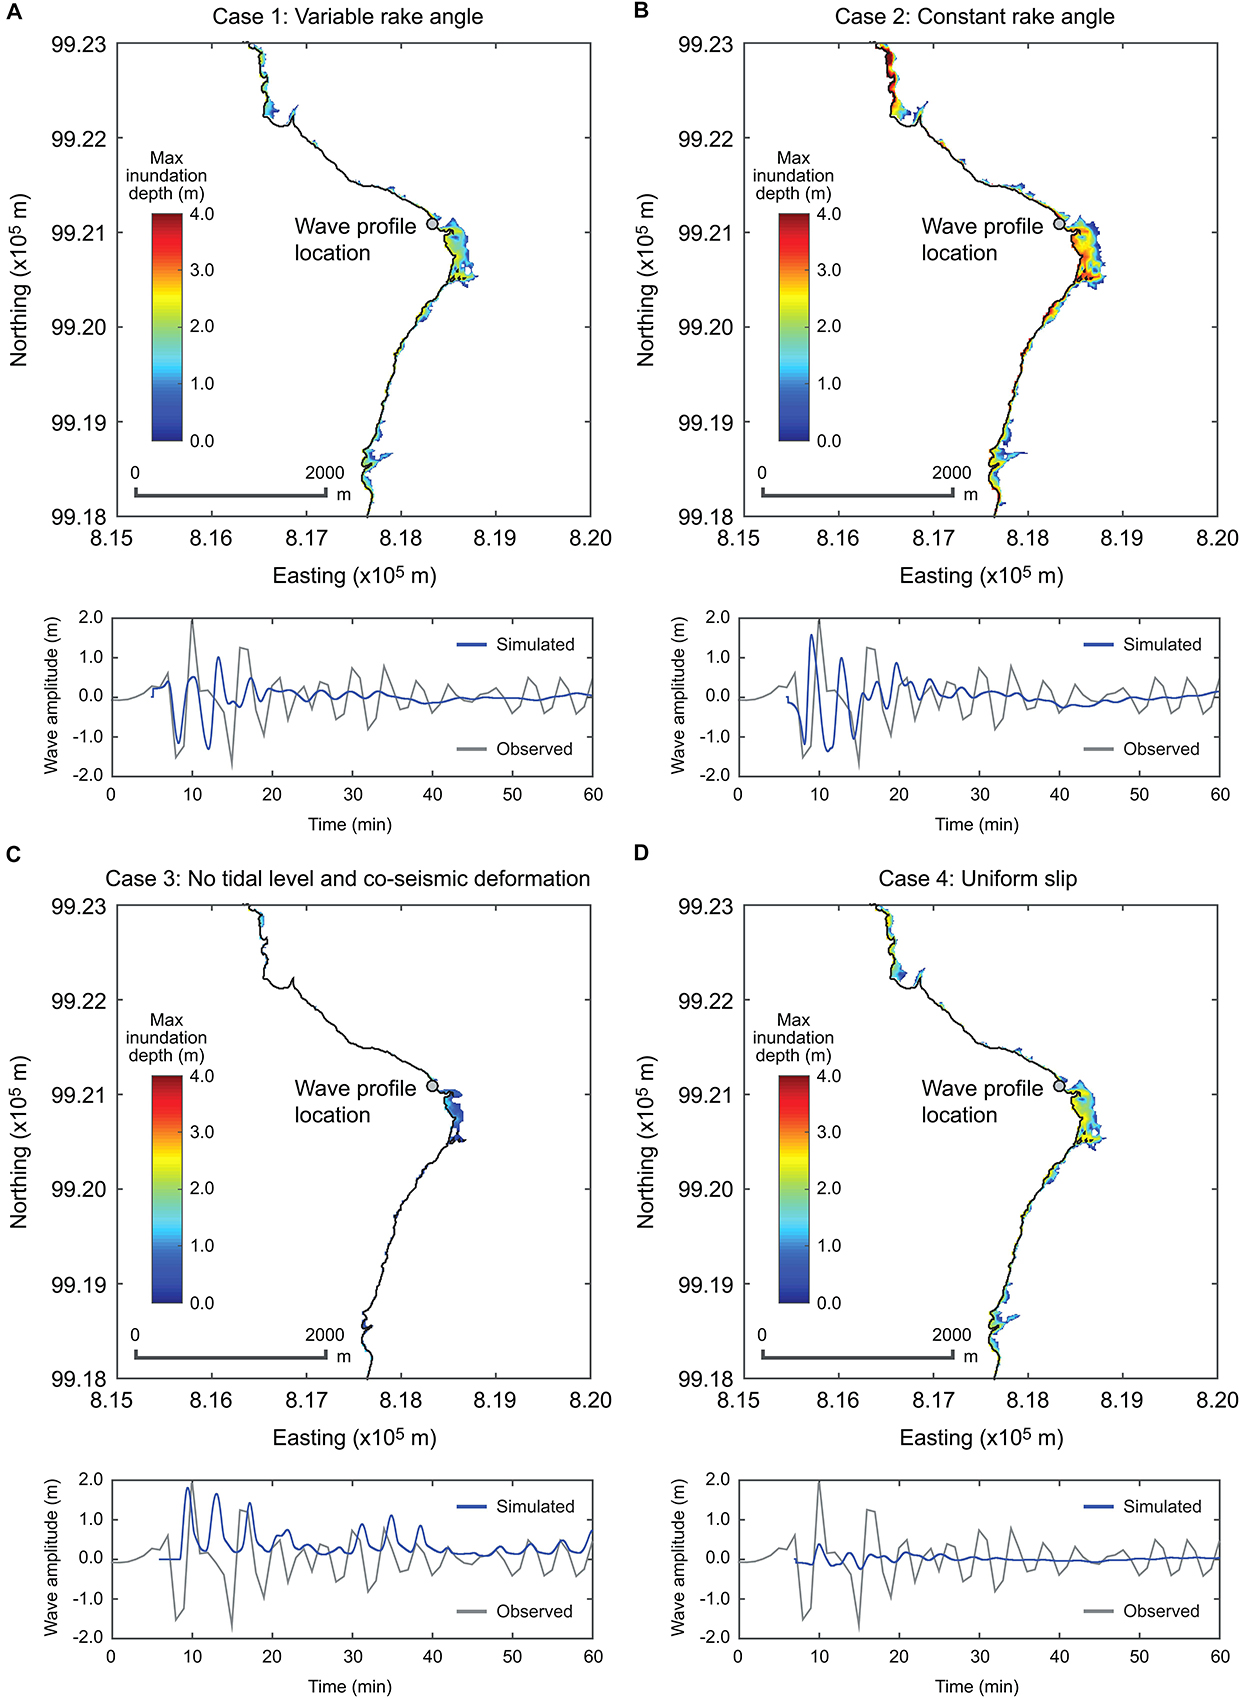
Figure 12. Tsunami inundation simulation results in the Pantoloan area (see Figure 10C): (A) the USGS model with the variable rake angle (Case 1), (B) the USGS model with the constant rake angle (Case 2), (C) the USGS model with the uniform slip distribution with the constant rake angle (Case 3), and (D) the USGS model with the variable rake angle without considering the effects of tidal level and co-seismic ground deformation (Case 4). For Cases (A–C), the maximum inundation depth is computed by taking into account co-seismic ground deformation and tidal level, while the wave profile at the near-shore location (indicated by a gray circle on a map) is with respect to the reference level of the tsunami simulation. The simulated wave profiles are shifted in time to match the initial phases of the waves.
The simulated wave profile for Case 1 (Figure 12A), initially shows a rising wave feature due to seabed uplift (see Figure 11A) and has a negative peak wave amplitude of −1.3 m, which is similar to the observed profile (−1.8 m). The positive peak amplitude of the simulated wave (+1.0 m) is about a half of the observed amplitude. On the other hand, the simulated wave profile for Case 2 (Figure 12B) presents a receding phase of the wave due to subsidence (see Figure 11B), followed by the main wave having peak amplitudes of +1.6 and −1.3 m. The peak amplitudes of the simulated wave profile for Case 2 are similar to those of the observed wave profile at the Pantoloan tidal recording station. The comparison indicates that relatively large portions of the tsunami waves observed at the Pantoloan station can be explained by the co-seismic deformation due to the earthquake rupture. This is consistent with the findings by Heidarzadeh et al. (2019) and Ulrich et al. (2019). The simulated tsunami wave profile for Case 3 (Figure 12C) exhibits an initial level of near zero wave, increasing to the peak amplitude of about +1.8 m (followed by two more successive waves). The reason for the initial near-zero phase of the wave is because the site is initially at near-zero elevation and no tidal or co-seismic effects are taken into account. The consideration of the tidal and co-seismic deformation effects is important in obtaining realistic characteristics of the simulated tsunami waves. The simulated tsunami wave profile for Case 4 (Figure 12D) demonstrates that the consideration of a realistic heterogeneous slip distribution is important; at sites where large concentrations of earthquake slip occur (e.g., Palu Bay; see Figure 1), the simulated tsunami waves tend to be underestimated.
The comparisons of the simulated tsunami waves based on different tsunami simulation settings exemplify the sensitivity of the simulated tsunami wave profiles. The results shown in the bottom panels of Figures 12A,B indicate that the extent of the submarine landslide-based tsunami source model may be overestimated if the co-seismic deformation effect is not properly taken into account. More importantly, the results demonstrate that the co-seismic rupture of a Mw7.5-class strike-slip earthquake, having notable dip components (which produce vertical seabed deformation), is capable of generating damaging tsunami waves at coastal locations of a narrow bay, such as Palu Bay. This has an important implication on future tsunami hazard assessments in active seismic regions where major fault systems cut across a bay or into the sea.
The top panels of Figure 12 show the tsunami inundation simulation results in the Pantoloan area (see Figure 10C), where the maximum tsunami inundation depth exceeding 4 m was recorded [see Figure 14 of Pakoksung et al. (2019)]. When Cases 1 and 2 are considered (Figures 12A,B), simulated tsunami profiles at the observation point indicated in the map are notable, having the peak amplitudes of more than 1.0 and 3.0 m, respectively, and the port areas of Pantoloan were flooded significantly. The differences between Cases 1 and 2 are attributed to the effects of rake angles in subfaults (see Figures 11A,B). These simulated inundation maps are generally consistent with our field observations (Figure 5) and the field observations reported by Pakoksung et al. (2019). Ignoring the effects due to the high tide and ground deformation (Case 3) leads to less significant flooded areas (Figure 12C), whereas the consideration of the uniform slip distribution (Case 4) still leads to noticeable flooded areas due to the high tide and ground subsidence (Figure 12D).
Tsunami Wave Profile and Inundation in Palu City
Figure 13 shows the tsunami inundation simulation results in the Palu area (see Figure 10C) by considering the four simulation cases. Within the displayed area (5 km by 5 km), an observation point is set up (shown with a gray circle), and the simulated wave profile is presented in a bottom panel below the inundation map. Figures 13A,B show major inundation in the bay area of Palu City and are consistent with the photographs shown in Figure 6; the maximum inundation depths at locations near the shoreline may reach 3 m to 4 m. The large water depths are caused by the combination of the tsunami waves, ground subsidence, and high tidal level. The simulated inundation areas by Cases 1 and 2 are consistent with the field observations [i.e., inundation depths of about 2 to 4 m; see Figure 14 of Pakoksung et al. (2019)]. Neglecting the tidal level and co-seismic ground deformation effects (Case C) has major influence on the inundated area and leads to an inconsistent appearance of the submerged area (Figure 13C). The consideration of the uniform slip distribution (Case 4) leads to notable inundation of the coastal area in Palu City (Figure 13D). This is because the elevation along the bay promenade becomes low after the co-seismic subsidence and the high-tide condition with a small tsunami wave is sufficient to flood the low-lying areas. It is noted that our tsunami simulation does not consider any coastal protection measures along the coastal line, while such coastal structures exist. Thus the inundation results for Case 4, shown in Figure 13D, may be overestimated. Nevertheless, during our field work, we observed that the low-lying areas along the coastal line were submerged at high tide times, indicating that ground subsidence had real influence in these areas.
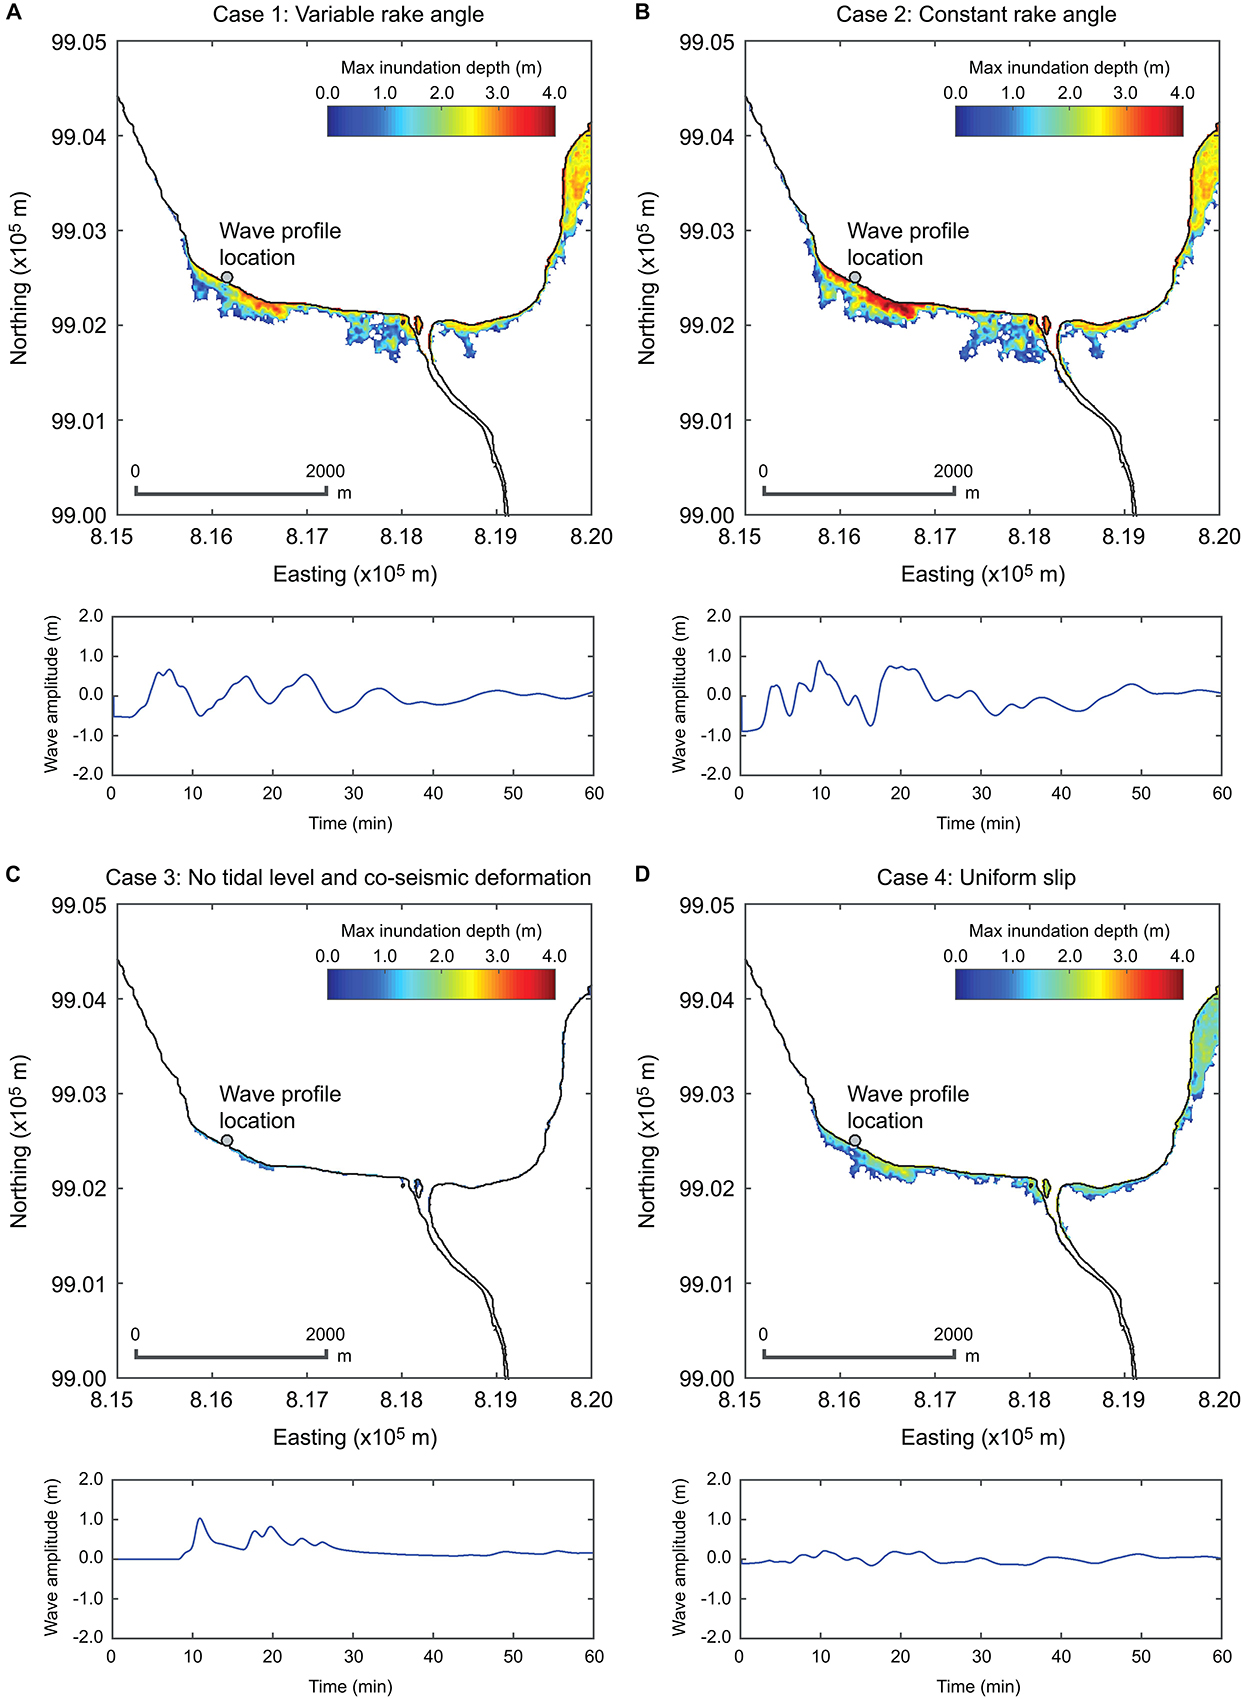
Figure 13. Tsunami inundation simulation results in the Palu area (see Figure 10C): (A) the USGS model with the variable rake angle (Case 1), (B) the USGS model with the constant rake angle (Case 2), (C) the USGS model with the uniform slip distribution with the constant rake angle (Case 3), and (D) the USGS model with the variable rake angle without considering the effects of tidal level and co-seismic ground deformation (Case 4). For Cases (A–C), the maximum inundation depth is computed by taking into account co-seismic ground deformation and tidal level, while the wave profile at the near-shore location (indicated by a gray circle on a map) is with respect to the reference level of the tsunami simulation.
The inundation analysis results shown in Figures 12, 13 demonstrate that the combined effects due to the co-seismic rupture and deformation, and high tide level result in significant levels of coastal flooding due to the earthquake rupture. In Pantoloan port and Palu City, inundation depths exceeding 3 m (above the roof height of a 1-story building) are possible. Using a tsunami fragility function for Banda Aceh after the 2004 Sumatra earthquake (e.g., Koshimura et al., 2009), such wave depths can lead to severe building damage. It is noteworthy that our field observations and tsunami inundation results also indicate that the co-seismic earthquake rupture alone may not be sufficient to explain all tsunami damage along the coastline of Palu Bay, and lacking elements in our tsunami source model include submarine-landslide tsunami sources (Muhari et al., 2018; Pakoksung et al., 2019; Sasa and Takagawa, 2019), but to a lesser extent than assumed previously.
Concluding Remarks
The reconnaissance field work in Palu after the 2018 Sulawesi earthquake highlighted the compounding nature of an earthquake catastrophe. The earthquake rupture generated strong shaking and ground deformation, which triggered secondary hazards, such as tsunami, liquefaction, submarine landslides, and massive mudflows. The observed patterns of destruction were very complex and varied widely in space. To encapsulate such complex phenomena, certain physical conditions need to coexist. For instance, Palu City was situated at the boundary of the two major segments of the Palu-Koro Fault where earthquake slip tends to concentrate. This situation caused significant subsidence and deformation in Palu City after the earthquake, while thick sedimentary soils and steep topography of the areas (both in sea and on land) led to significant site amplifications of ground shaking in the alluvial fan and high susceptibility of landslides on slopes. The existence of relatively impermeable soil layers at shallower depths and high groundwater levels in specific areas of Palu (partly affected by the irrigation system of the areas, such as Petobo and Jono Oge) jointly increased the occurrence probability of the liquefaction-induced-unlimited flow. In coincidence with the astronomical high tide local tsunamis that were triggered by submarine landslides resulted in the occurrence of unanticipatedly large tsunami waves and expanded flooded areas in Palu Bay. Response and recovery during the destructive event were influenced by the above-mentioned factors, making these operations particularly challenging. Given such large earthquakes are likely to strike in future, reconstruction of the damaged districts of Palu (e.g., bay promenade, port facilities, and residential areas swept by mudflows) requires careful considerations of land-use planning, protective measures, and emergency response plans for future earthquake-related disasters by embracing the key concepts of disaster preparedness and resilience (Cyranoski, 2012).
The 2018 Sulawesi earthquake clearly demonstrated that major strike-slip events can trigger deadly and damaging tsunamis, which can be contributed by multiple source mechanisms. The tsunami simulation results presented in this study showed that both co-seismic deformation due to earthquake rupture and other factors, including tidal effects and submarine landslides, are important. Although the generalization of the specific findings from the Palu case is difficult, hazard-risk modelers and emergency response officers who are in charge of developing natural hazard maps and disaster response-recovery plans should pay attention to these geological and geophysical factors. In particular, future predictions of tsunami hazards and risks in other seismic regions where such strike-slip events are dominant and cut across the sea (e.g., Turkey and New Zealand) will require re-evaluation in light of new evidence of the multi-hazard disaster from the 2018 Sulawesi event. Such assessments will require new and more sophisticated multi-hazard modeling tools for cascading and compounding geohazards and georisks.
Data Availability Statement
All datasets generated for this study are included in the manuscript/supplementary files.
Author Contributions
All authors contributed to the earthquake–tsunami damage survey field work in Palu, Indonesia, and preparation of the manuscript.
Funding
This work was supported by the Institute for Catastrophic Loss Reduction (Quick Response program), the Canada Research Chair Program (950-232015), the NSERC Discovery Grant (RGPIN-2019-05898), and Kyoto University’s DPRI disaster research fund.
Conflict of Interest
DT was employed by the Pacific Consultants Co., Ltd.
The remaining authors declare that the research was conducted in the absence of any commercial or financial relationships that could be construed as a potential conflict of interest.
Acknowledgments
The authors thank the Central Sulawesi Disaster Management Task Force Ministry of Public Works and Housing, Indonesia, for their support during the survey.
References
Bird, P. (2003). An updated digital model of plate boundaries. Geochem. Geophys. Geosyst. 4:1027. doi: 10.1029/2001GC000252
BNPB (2019). Available at: https://bnpb.go.id/publikasi/infografis/infografis-gempabumi-m74-tsunami-sulawesi-tengah.html (accessed July 1, 2019).
Boore, D. M., Stewart, J. P., Seyhan, E., and Atkinson, G. M. (2014). NGA-West2 equations for predicting PGA, PGV, and 5% damped PSA for shallow crustal earthquakes. Earthq. Spectra 30, 1057–1085. doi: 10.1193/070113eqs184m
Cetin, K. O., Seed, R. B., Der Kiureghian, A., Tokimatsu, K., Harder, L. F. Jr., Kayen, R. E., et al. (2004). Standard penetration test-based probabilistic and deterministic assessment of seismic soil liquefaction potential. J. Geotechn. Geoenviron. Eng. 130, 1314–1340. doi: 10.1061/(asce)1090-0241(2004)130:12(1314)
Cipta, A., Robiana, R., Griffin, J. D., Horspool, N., Hidayati, S., and Cummins, P. R. (2016). A probabilistic seismic hazard assessment for Sulawesi, Indonesia. Geol. Soc. Lond. Spec. Publ. 441, 133–152. doi: 10.1144/sp441.6
Danielsen, F., Sørensen, M. K., Olwig, M. F., Selvam, V., Parish, F., Burgess, N. D., et al. (2005). The Asian tsunami: a protective role for coastal vegetation. Science 310, 643–643. doi: 10.1126/science.1118387
DEMNAS (2019). Available at: http://tides.big.go.id/DEMNAS/#Info doi: 10.1126/science.1118387 (accessed March 1, 2019).
Gill, J. C., and Malamud, B. D. (2014). Reviewing and visualizing the interactions of natural hazards. Rev. Geophys. 52, 680–722. doi: 10.1002/2013rg000445
Goto, C., Ogawa, Y., Shuto, N., and Imamura, F. (1997). Numerical Method of Tsunami Simulation with the Leap-Frog Scheme. Paris: UNESCO.
Heidarzadeh, M., Muhari, A., and Wijanarto, A. B. (2019). Insights on the source of the 28 September 2018 Sulawesi Tsunami, Indonesia based on spectral analyses and numerical simulations. Pure Appl. Geophys. 176, 25–43. doi: 10.1007/s00024-018-2065-9
Koshimura, S., Oie, T., Yanagisawa, H., and Imamura, F. (2009). Developing fragility functions for tsunami damage estimation using numerical model and post-tsunami data from Banda Aceh, Indonesia. Coast. Eng. J. 51, 243–273. doi: 10.1142/s0578563409002004
Liu, Z., Nadim, F., Garcia-Aristizabal, A., Mignan, A., Fleming, K., and Luna, B. Q. (2015). A three-level framework for multi-risk assessment. Georisk 9, 59–74. doi: 10.1080/17499518.2015.1041989
Lutfi, M., Afifah, R. S., Sulaiman, B., and Risna, B. (2018). Numerical simulation of hydrodynamic for abrupt bathymetry in Palu river estuary. Indian J. Sci. Technol. 11, 1–5. doi: 10.17485/ijst/2018/v11i23/125637
Marzocchi, W., Garcia-Aristizabal, A., Gasparini, P., Mastellone, M. L., and Di Ruocco, A. (2012). Basic principles of multi-risk assessment: a case study in Italy. Nat. Hazards 62, 551–573. doi: 10.1007/s11069-012-0092-x
Mignan, A., Wiemer, S., and Giardini, D. (2014). The quantification of low-probability–high-consequences events: part I. a generic multi-risk approach. Nat. Hazards 73, 1999–2022. doi: 10.1007/s11069-014-1178-4
Muhammad, A., and Goda, K. (2018). Impact of earthquake source complexity and land elevation data resolution on tsunami hazard assessment and fatality estimation. Comput. Geosci. 112, 83–100. doi: 10.1016/j.cageo.2017.12.009
Muhari, A., Imamura, F., Arikawa, T., Hakim, A. R., and Afriyanto, B. (2018). Solving the puzzle of the September 2018 Palu, Indonesia, tsunami mystery: clues from the tsunami waveform and the initial field survey data. J. Disaster Res. 13, 1–13.
Okada, Y. (1985). Surface deformation due to shear and tensile faults in a half-space. Bull. Seismol. Soc. Am. 75, 1135–1154.
Pakoksung, K., Suppasri, A., Imamura, F., Athanasius, C., Omang, A., and Muhari, A. (2019). Simulation of the submarine landslide tsunami on 28 September 2018 in Palu Bay, Sulawesi Island, Indonesia, using a two-layer model. Pure Appl. Geophys. 176, 3323–3350. doi: 10.1007/s00024-019-02235-y
Pelinovsky, E., Yuliadi, D., Prasetya, G., and Hidayat, R. (1997). The 1996 Sulawesi tsunami. Nat. Hazards 16, 29–38.
Sahadewa, A., Irsyam, M., Hanifa, R., Mikhail, R., Pamumpuni, A., Nazir, R., et al. (2019). “Overview of the 2018 Palu Earthquake,” in Proceedings of the 7th International Conference on Earthquake Geotechnical Engineering, Rome, 857–869.
Sasa, S., and Takagawa, T. (2019). Liquefied gravity flow-induced tsunami: first evidence and comparison from the 2018 Indonesia Sulawesi earthquake and tsunami disasters. Landslides 16, 195–200. doi: 10.1007/s10346-018-1114-x
Selva, J. (2013). Long-term multi-risk assessment: statistical treatment of interaction among risks. Nat. Hazards 67, 701–722. doi: 10.1007/s11069-013-0599-9
Socquet, A., Simons, W., Vigny, C., McCaffrey, R., Subarya, C., Sarsito, D., et al. (2006). Microblock rotations and fault coupling in SE Asia triple junction (Sulawesi, Indonesia) from GPS and earthquake slip vector data. J. Geophys. Res. 111:B08409. doi: 10.1029/2005JB003963
Tanioka, Y., and Satake, K. (1996). Tsunami generation by horizontal displacement of ocean bottom. Geophys. Res. Lett. 23, 861–864. doi: 10.1029/96gl00736
Thein, P. S., Pramumijoyo, S., Brotopuspito, K. S., Kiyono, J., Wilopo, W., Furukawa, A., et al. (2014). Estimation of seismic ground motion and shaking parameters based on microtremor measurements at Palu City, Central Sulawesi Province, Indonesia. Int. J. Geol. Environ. Eng. 8, 308–319.
Ulrich, T., Vater, S., Madden, E. H., Behrens, J., van Dinther, Y., van Zelst, I., et al. (2019). Coupled, physics-based modeling reveals earthquake displacements are critical to the 2018 Palu, Sulawesi Tsunami. Pure Appl. Geophy. 1–41. doi: 10.1007/s00024-019-02290-5
United States Geological Survey [USGS] (2018). Available at: https://earthquake.usgs.gov/earthquakes/eventpage/us1000h3p4/executive (accessed December 1, 2018).
Keywords: earthquake, tsunami simulation, earthquake damage survey, disaster risk management, earthquake source characterization
Citation: Goda K, Mori N, Yasuda T, Prasetyo A, Muhammad A and Tsujio D (2019) Cascading Geological Hazards and Risks of the 2018 Sulawesi Indonesia Earthquake and Sensitivity Analysis of Tsunami Inundation Simulations. Front. Earth Sci. 7:261. doi: 10.3389/feart.2019.00261
Received: 31 July 2019; Accepted: 20 September 2019;
Published: 04 October 2019.
Edited by:
Afroz Ahmad Shah, Universiti Brunei Darussalam, BruneiReviewed by:
Hyoungsu Park, Oregon State University, United StatesArnaud Mignan, ETH Zürich, Switzerland
Copyright © 2019 Goda, Mori, Yasuda, Prasetyo, Muhammad and Tsujio. This is an open-access article distributed under the terms of the Creative Commons Attribution License (CC BY). The use, distribution or reproduction in other forums is permitted, provided the original author(s) and the copyright owner(s) are credited and that the original publication in this journal is cited, in accordance with accepted academic practice. No use, distribution or reproduction is permitted which does not comply with these terms.
*Correspondence: Katsuichiro Goda, kgoda2@uwo.ca