 Taavi Liblik
 Urmas Lips
- Department of Marine Systems, Tallinn University of Technology, Tallinn, Estonia
Stratification of the water column, consisting of the three layers (upper, intermediate, and deep layer) separated by the seasonal thermocline and the permanent halocline, respectively, is an important factor for the functioning of the brackish Baltic Sea. In the present work, changes in the vertical structure of temperature and salinity, as well as heat content, salt mass, and stratification conditions were estimated on the basis of in situ and remote sensing data in 1982–2016. The seasonal thermocline and the halocline have strengthened in most of the sea by a rate of 0.33–0.39 and 0.70–0.88 kg m−3, respectively, during 35 years. The upper layer has warmed by 0.03–0.06°C year−1 and sub-halocline deep layer 0.04–0.06°C year−1 in most of the sea. The total warming trend in the whole Baltic has been 1.07°C for 35 years, being approximately twice higher compared to the upper 100 m in the Atlantic Ocean. Average upper layer warming of the sea from May to September has been 0.07–0.08°C year−1 while in winter, trends were mostly statistically not significant. More rapid warming during summers has occurred in shallower, closed-end areas of gulfs if compared to the rest of the sea. Possible reasons for high warming there might be shallow depths and limited water exchange, stronger stratification, and/or higher turbidity. Sea surface temperature trends estimated by in situ and satellite data agree well. Trends of freshening (−0.005 to −0.014 g kg−1 year−1) of the upper layer and increasing salinity (0.02 to 0.04 g kg−1 year−1) in the sub-halocline deep layer were detected. Increased salinity in the deep layer is likely caused by the increased lateral import of saltier water from the North Sea. Changes in the upper layer salinity might not be related to the accumulated river runoff only, but decadal changes of vertical salt flux might also contribute. The vertically distinct changes cancel each other and no significant trend in the mean salinity of the Baltic Sea was detected. No remarkable changes have occurred in the cold intermediate layer. In conclusion, different dominating processes have caused distinct long-term trends in the three layers of the Baltic Sea.
Introduction
The Baltic Sea is a brackish, shallow sea with limited water exchange and enclosed character. The sea has strong seasonality and stratification. In winter, the water column is mixed down to the permanent halocline at depths of 40–80 m, while in summer, the seasonal thermocline and three-layer structure develop in the sea: warm and fresher upper layer (UL), saltier cold intermediatelayer (CIL), and saltiest and warmer deep layer (DL). Density gradients between the three layers have great importance for vertical fluxes and functioning of the sea in general (BACC Author Team, 2015). Unlike to open ocean, the contribution of vertical salinity gradient to the density stratification is as important as temperature in the Baltic Sea.
Changes in air-sea heat fluxes (Large et al., 2012) have led to an increase in the upper ocean heat content in recent decades (Gouretski, 2018). Due to the small volume of the sea, changes in atmospheric conditions impact the Baltic Sea quite rapidly. The mean warming trend in the sea surface temperature (SST) of 0.04–0.05°C year−1 has been detected in the Baltic Sea covering 1982–2012/13 (Stramska and Białogrodzka, 2015; Høyer and Karagali, 2016). There is an inter-annual variability in the SST (Bradtke et al., 2010), which quite well follows the changes in air temperature (Tronin, 2017). The warming signal has been confirmed by in situ observations in coastal stations (Dailidienë et al., 2011; Laakso et al., 2018). Available remotely sensed salinity product (Kao et al., 2018) is not capable of resolving dynamics in the Baltic Sea. A decline in the SSS has been detected in the Baltic (Girjatowicz and Świątek, 2016), which could have caused a shift of the threshold salinity for freshwater and marine species (Vuorinen et al., 2015). The Baltic Sea is very sensitive to wind forcing. Therefore, long-term trends of sea surface properties might also be caused by changes in the wind regime. Wind-induced processes, such as upwellings, movement of fronts and vertical mixing alter water properties considerably in the sea (Astok et al., 1999; Lips et al., 2009; Haavisto et al., 2018).
Cold intermediate layer forms in winter due to mixing by convection and wind stirring of the previous year intermediate water and the upper layer (Stepanova et al., 2015). Erosion of the halocline contributes to the formation of intermediate layer water mass as well during storm events due to wind stirring (Lass et al., 2003). Water column turn-overs caused by estuarine circulation reversals (Liblik et al., 2013; Elken et al., 2014) during winters also enhance diapycnal mixing through the halocline (Lips et al., 2017). Inter-annual changes of temperature of the CIL depend on the severity of winter and are well correlated with the NAO (Jones et al., 1997) and BSI (Lehmann et al., 2002) indexes (Mohrholz et al., 2006; Liblik and Lips, 2011).
Bottom waters of the Baltic Proper, the largest central basin of the Baltic Sea, are renewed by sporadic barotropic (Fischer and Matthäus, 1996) and baroclinic (Feistel et al., 2006) large inflows, so-called Major Baltic Inflows (MBI) from the North Sea. The strong MBIs have been quite rare, e.g., the major event in 2003 was followed by the strong inflow in December 2014 (Mohrholz et al., 2015). The inflow events can be followed in the deep layer properties as peaks in time-series. The variations have a higher amplitude in the south-western Baltic (Rak, 2016; Mohrholz, 2018) while in the north-eastern Baltic, the signal is more damped. However, the impact of MBIs is detectable all the way to the Gulf of Finland (Liblik et al., 2018). Temperature of the deep layer depends on source water properties of the MBIs that origin from the North Sea and on mixing with the ambient water in the Baltic. For instance, after the 2003 MBI arrived in the Gotland Deep, temperature was <4.5°C (Feistel et al., 2006), while after the 2014 December and concurrent MBIs, it was >7.5°C (Liblik et al., 2018). Positive temperature trend in the deep waters of the Baltic can be expected as warming of the SST was detected in the North Sea (Høyer and Karagali, 2016). Reduction of MBIs has been reported since the early 1980s (Fischer and Matthäus, 1996). However, recently, it was claimed that large volume changes did not decrease (Lehmann and Post, 2015) and that there is no long term trend in MBI occurrence (Mohrholz, 2018). Deep waters of the open Baltic do not penetrate the Gulf of Riga and the Gulf of Bothnia, which are separated by sills from the rest of the Baltic. Thus, the permanent halocline does not exist in those basins, and the direct impact of MBIs cannot be seen there (Hietala et al., 2007; Skudra and Lips, 2017).
A linear trend is the most straightforward statistical parameter to describe long-term changes in water characteristics. It misses the dynamical properties of the time-series, but on the other hand, it is a widely used standard method. Numerous studies have shown linear SST trends based on remote sensing data (Bradtke et al., 2010; Lehmann et al., 2011; BACC Author Team, 2015; Stramska and Białogrodzka, 2015; Høyer and Karagali, 2016) and coastal observations (Dailidienë et al., 2011; Laakso et al., 2018) in the Baltic Sea. Future predictions are often presented as differences to a reference period. For instance, a remarkable increase in temperature (2–3°C) and a decrease in salinity(1–2 g kg−1) through the three layers are predicted in the deeper basins for 2069–2098 relative to the reference period 1978–2007 (BACC Author Team, 2015). The motivation of the present study comes from the fact that most of the available water column trend studies in the Baltic are dealing with the SST (BACC Author Team, 2015). In the present study, we estimated the temperature and salinity trends in the whole water column.
The main aim of the study was to analyze the changes in the SST of the Baltic Sea on the basis of remote sensing products and the changes in the water column properties in eight selected locations around the Baltic Sea on the basis of in situ data in 1982–2016. This period was chosen to have the study period covered by satellite-derived SST measurements. It allows us to combine remotely sensed and in situ measurements. There were four main objectives in this investigation: first, to estimate the SST trends based on remote sensing and in situ observations in selected open sea locations in the Baltic; secondly, to reveal the vertical structure of temperature, salinity and density trends; thirdly, to estimate the changes in heat and salt content of the sea, and fourthly, to describe the changes in stratification conditions.
Materials and Methods
In situ data from eight areas (red polygons in Figure 1) around the Baltic Sea from years 1982–2016 were analyzed: the Gulf of Finland, the Bothnian Bay, the Bothnian Sea, the Northern Baltic Proper, the Eastern Gotland Basin, the Bornholm Basin, the Arkona Basin, and the Gulf of Riga. Monitoring data of Department of Marine Systems at TalTech and its predecessors were used: data acquired by research vessels in 1982–2016, autonomous vertical profilers (Lips et al., 2016) in 2009–2016 and bottom-mounted devices (Liblik et al., 2013) in 2010–2015. Likewise, available data from HELCOM (Helsinki Commission) database1 and EU Copernicus Marine Service Information2 product “Baltic in situ observations yearly delivery in delayed mode” were used. Measurements, quality assurance and data processing were in accordance with the HELCOM Monitoring Manual3.
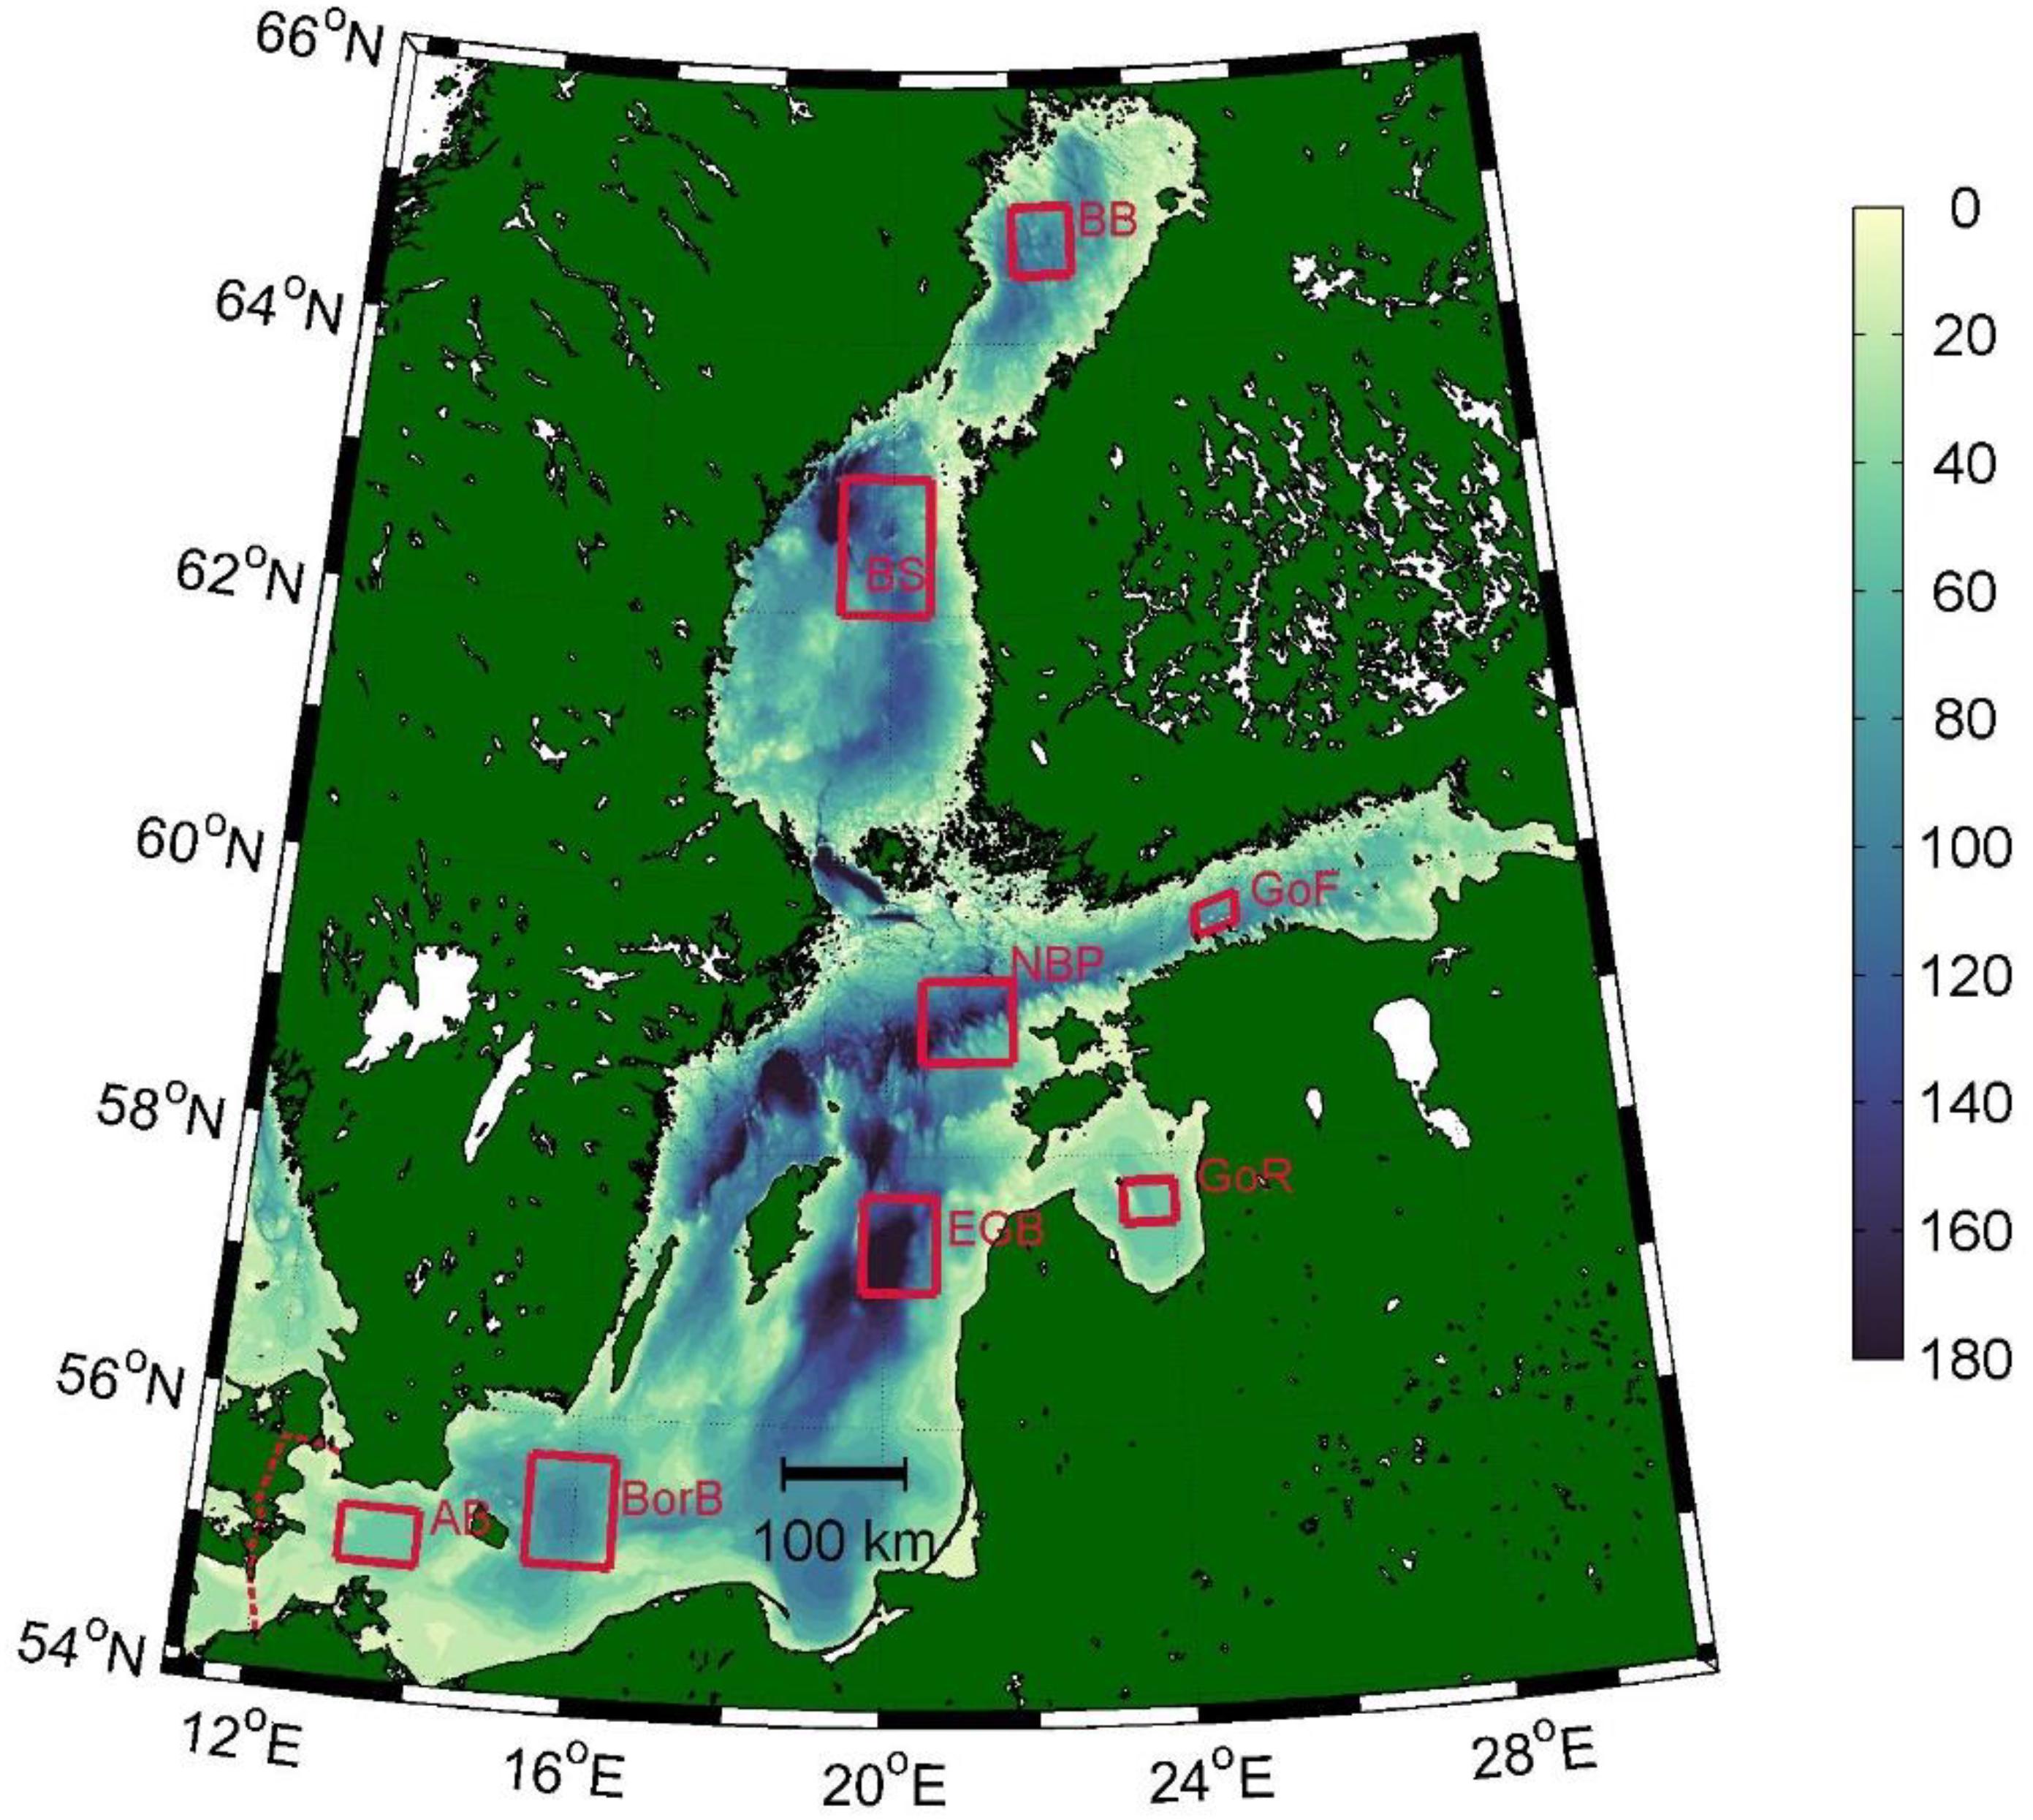
Figure 1. Bathymetric map of the Baltic Sea with eight selected areas (red polygons) and the western edge of the study area (red dashed line). Color scale shows sea depths.
Two sources of remotely sensed SST were used: (1) EU Copernicus Marine Service Information4 product “Baltic Sea – Sea surface temperature reprocessed” 1982–2011 and (2) GHRSST Level 4 G1SST Global Foundation Sea Surface Temperature Analysis5 data 2012–2016. The GHRSST data were interpolated to the Copernicus data grid, which has a spatial resolution of 0.03°.
Satellite SST data were checked against in situ data in the upper 2 m layer. Data inside the eight polygons were used. Satellite-derived SST was linearly interpolated to a location of in situ measurements. Linear regression slope, correlation, absolute average error, and bias for the whole satellite data set and separately for the two products are shown in Table 1. Strong correlation between satellite data and in situ data was found. A smaller absolute average error was found for the Copernicus data. The Copernicus satellite data had a bias of −0.28°C and GHRSST data +0.11°C. In order to avoid a jump between the two datasets at 2011/2012, we shifted the GHRSST data by −0.39°C.
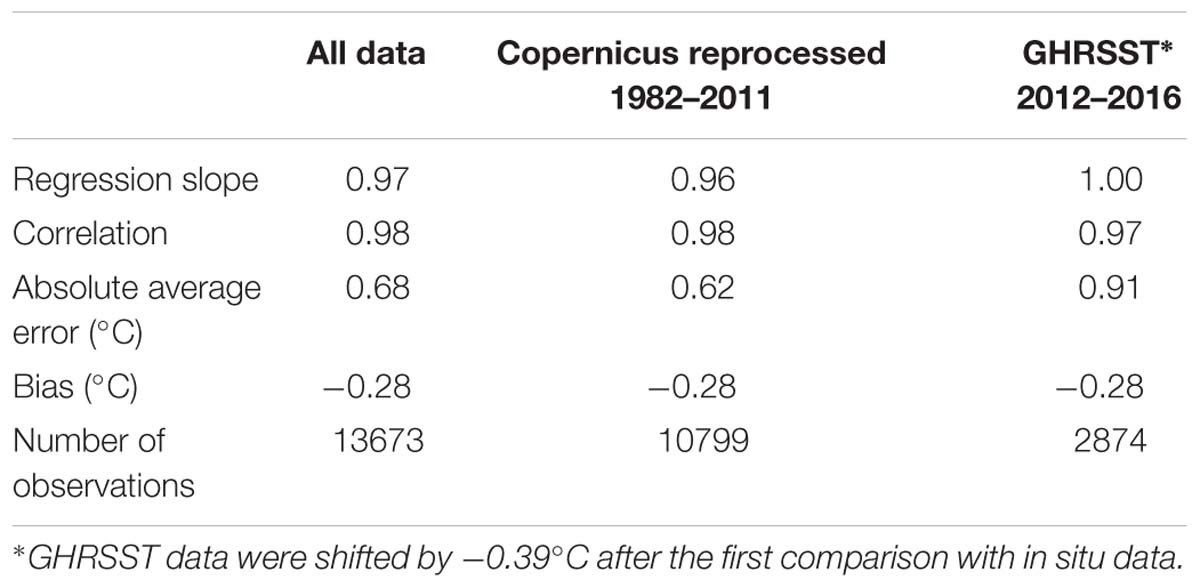
Table 1. Regression, correlation, absolute average error (°C), and bias (°C) between in situ measurements and satellite-derived SST (°C).
First, daily mean profiles with a vertical resolution of 10 m (centered to the depths of 5, 15, 25 m, etc.) were calculated in each area. Secondly, 10-day mean profiles were calculated, and from those, the mean seasonal cycle was determined. Next, the mean seasonal course was subtracted from daily profiles, and monthly mean profiles were calculated from deviations. Finally, yearly mean vertical profiles of deviations were calculated, and linear trends were determined using these annual averages. Same calculation steps were applied for each cell of the daily satellite SST data.
Hypsographic curves for the heat and salt content calculations were derived from the Baltic Sea Hydrographic Commission (2013) database. Temperature and salinity trends in eight areas were extrapolated in respective basins according to the hypsographic curves with a vertical step of 1 m. For instance, there is a salinity trend of +0.04 g kg−1 y−1 in the Eastern Gotland Basin at 80 m depth. We assumed that this +0.04 g kg−1 y−1 change took place in the whole basin at 80 m depth. Finally, the eight sub-basins were integrated to get the heat and salt content change profiles for the whole Baltic Sea. The western edge of the study area in the present work is shown in Figure 1.
Mean SST trends for the various classes of sea bottom depth, mean Secchi depth and mean salinity were calculated in the three areas: the Northern Bothnian Bay, the Eastern Gulf of Finland and the Bornholm/Arkona area (see locations in Figure 3). Mean Secchi depth data from March to October 2003–2012 (Stock, 2015) and mean surface salinity from April to October (Janssen et al., 1999) were used.
Trend values in the present paper were calculated as linear regressions, and trends were considered significant when the p-value was ≤0.05.
It has to be noted that the Gulf of Riga, the Bothnian Bay, and the Bothnian Sea had less in situ data available compared to other areas (see Figure 2) and that might be one reason, why trends there deviate from the rest of the basins.
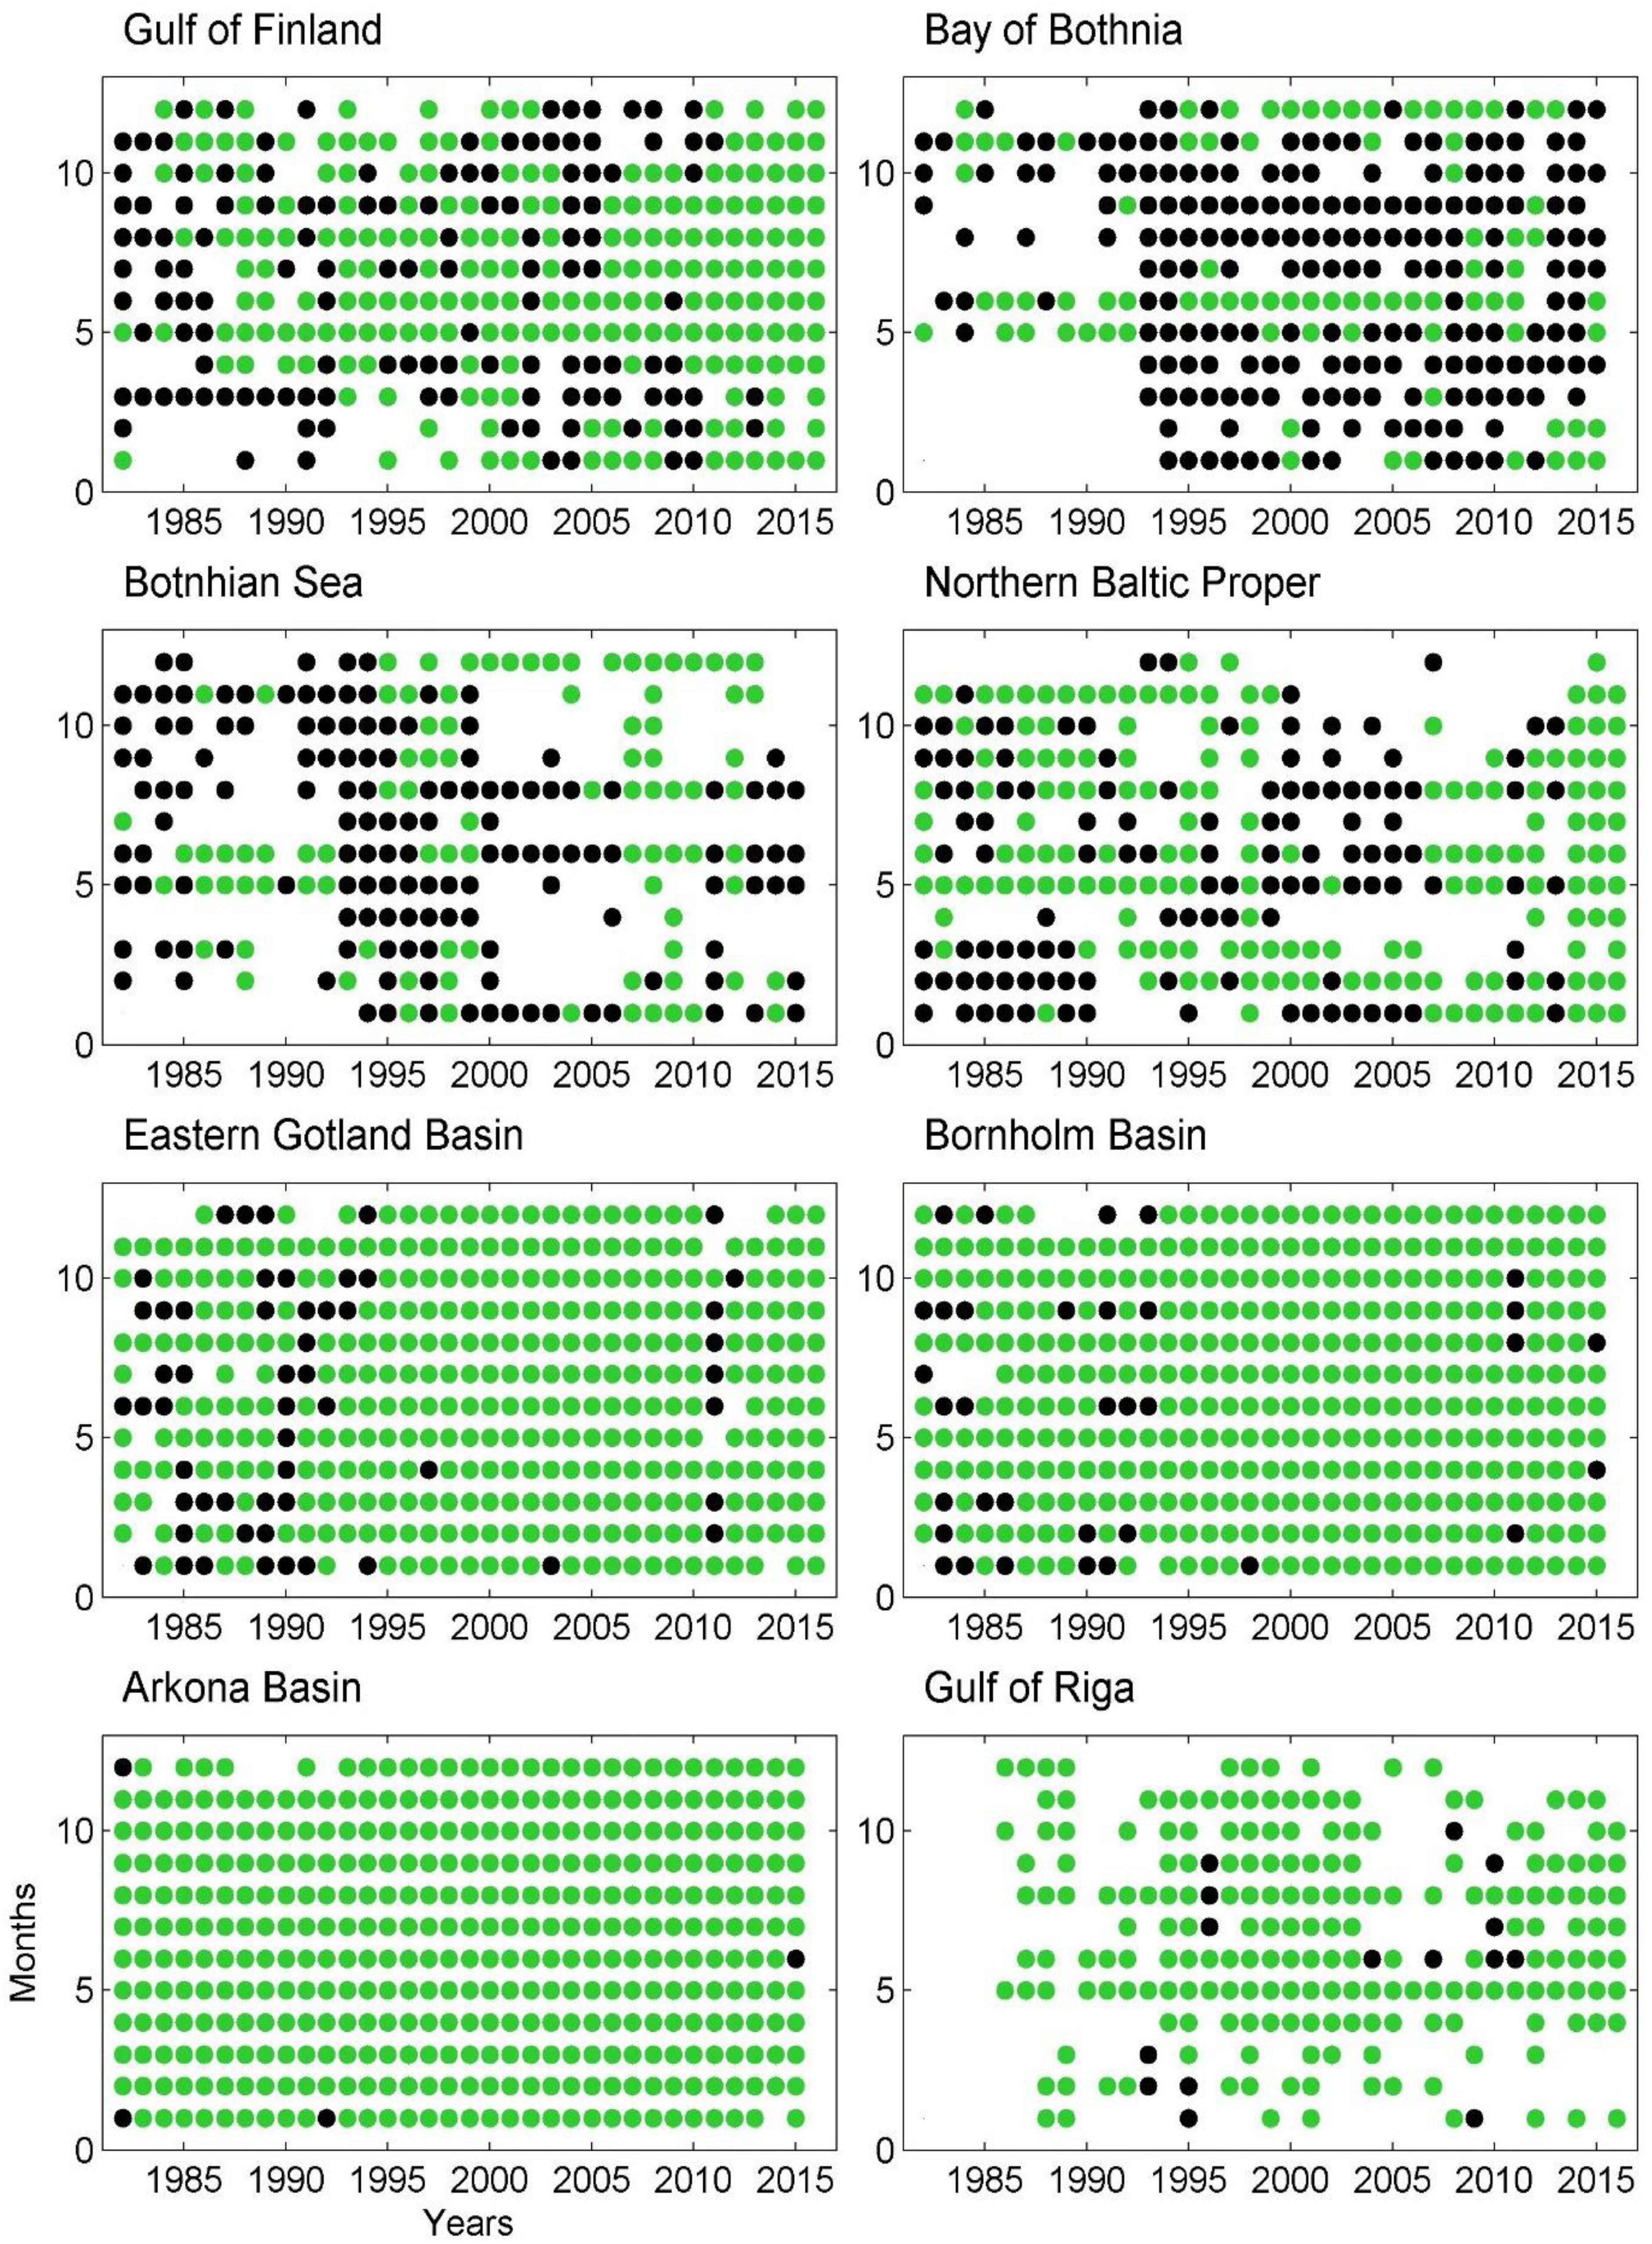
Figure 2. Availability of the data in the eight selected locations. Black dots show the month/year when the data were available at least from the surface layer and green dots indicate the month/year when the data were available throughout the entire water column.
Results
Trends in Temperature, Salinity, Heat Content, and Salt Mass
There is a significant positive trend in annual SST all over the Baltic Sea (Figure 3). In 85.3% of the area, the trend is in the range between 0.03 and 0.06°C year−1. A higher rate of warming (>0.06°C year−1) has occurred in the shallower, closed-end areas of the gulfs, e.g., the northern part of the Bothnian Bay, the eastern part of the Gulf of Finland, the eastern part of the Gulf of Riga, and the Curonian lagoon. Shallower areas with active water exchange such as the Arkona Basin, the Irbe Strait or the Åland Sill area, have not experienced such fast warming. The average trend in the entire Baltic is stronger (>0.05°C year−1) from May to October, and it is significant in most of the Baltic Sea in these months (78–95% of the area) (inlays in Figure 3). A slight positive temperature trend, although mostly not significant, can be found in winter as well.
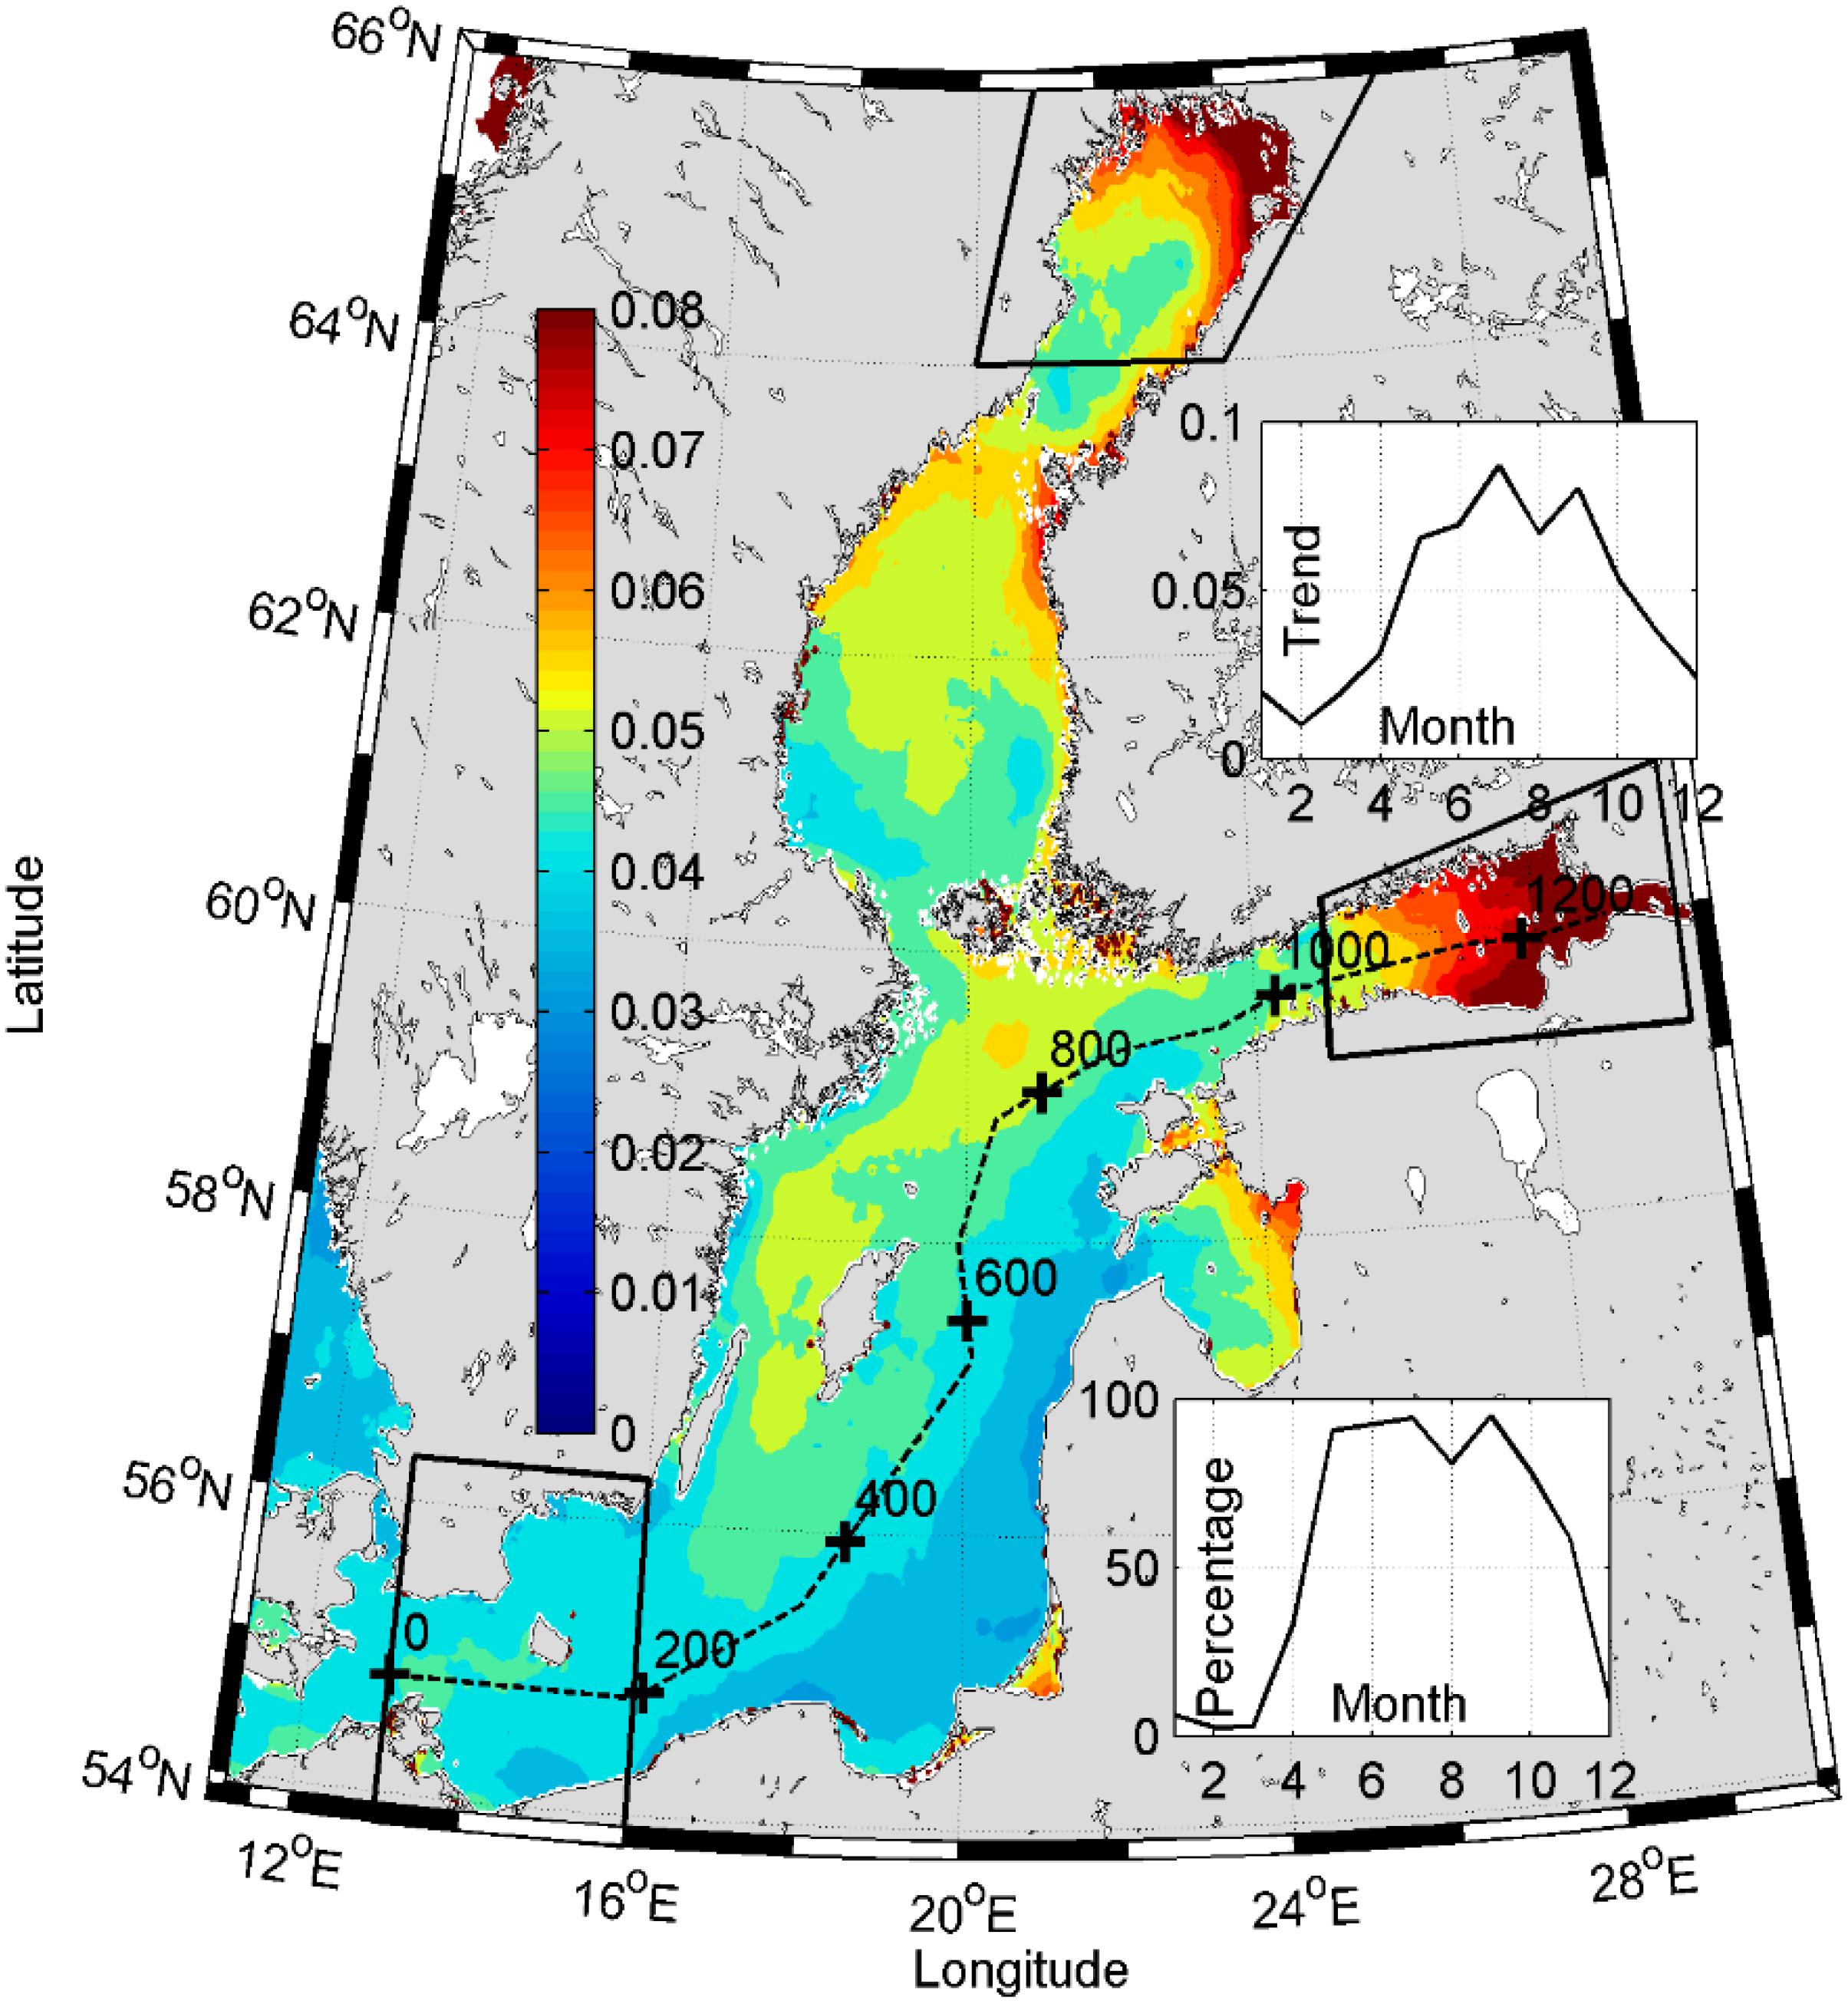
Figure 3. Sea surface temperature trend in °C year−1 from 1982 to 2016. The upper inlay shows the mean seasonal temperature trend (°C year−1) in the entire Baltic Sea. The lower inlay shows by months the percentage of the area, where positive temperature trends were significant (p ≤ 0.05). The dashed line shows the transect, which is shown in Figure 8A. Numbers indicate the distance from the southwestern end of the transect Boxes show areas of Arkona/Bornholm, Northern Bothnian Bay, and Eastern Gulf of Finland. Data from these areas are used in Figures 8B–D.
Temperature trend profiles are presented in Figure 4. Diamond-markers in the figure represent satellite-based estimates of trends. Warming trends based on in situ measurements and remote sensing coincide well. Only in the areas, where fewer measurements are available, some discrepancies are evident: the in situ data estimated trend is higher than the remote sensing estimated trend in the Gulf of Riga and lower in the Bothnian area.
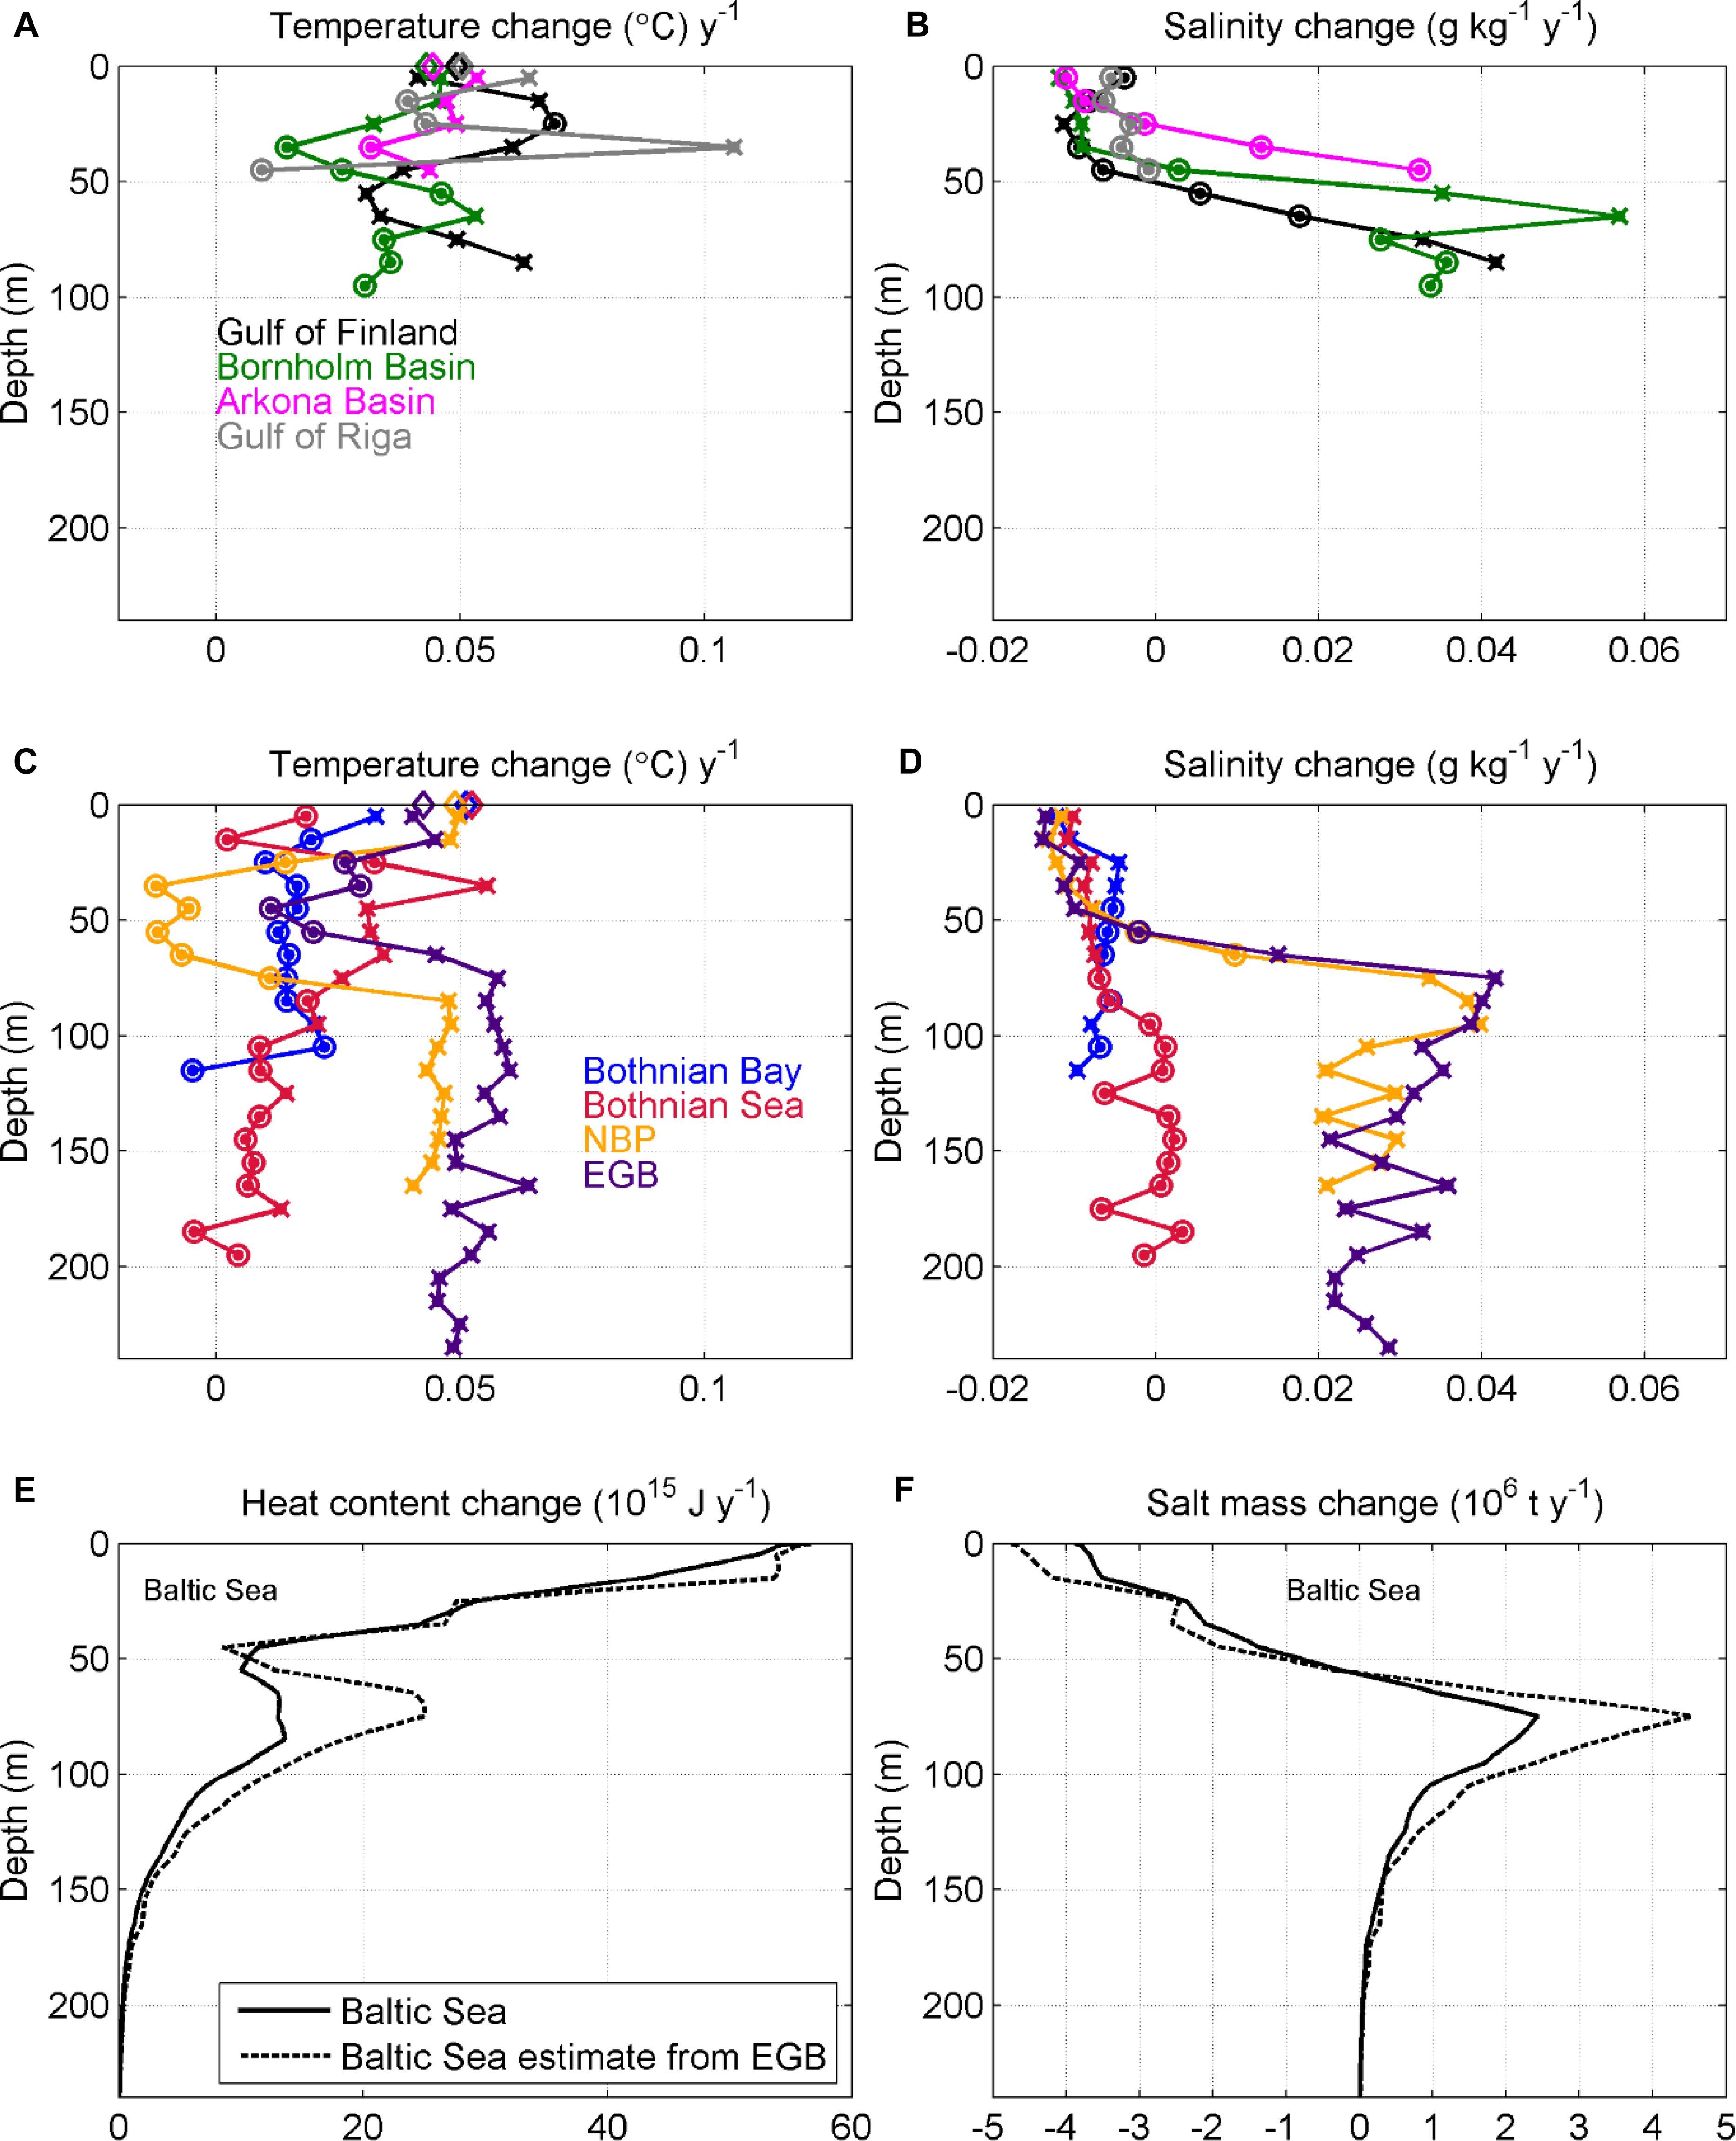
Figure 4. Temperature (A,C), salinity (B,D) trends in the sub-basins (Gulf of Finland, Bothnian Bay, Bothnian Sea, NBP – Northern Baltic Proper, EGB – Eastern Gotland Basin, Bornholm Basin, Arkona Basin, Gulf of Riga) and heat content (E), salt mass (F) trends of the whole Baltic Sea from 1982 to 2016. Crosses in the upper panel indicate a statistically significant trend (p ≤ 0.05) and circles not significant trend (p > 0.05). Diamonds in the upper part of (A,C) show satellite-based estimates of SST trend in the same areas. Solid lines in the lower panels show the heat content and salt mass estimates if temperature and salinity changes in all eight areas are taken into account. Dashed lines show the estimates if only changes in the Eastern Gotland Basin (EGB) area are taken into account and extrapolated over the entire Baltic Sea using the hypsographic curve.
It is clear that the warming trend prevails in the water column of the Baltic Sea (Figure 4). The warming signal is not homogenous in the water column, but has a layered structure. Most of the areas (Gulf of Finland, Eastern Gotland Basin, Bornholm Basin, Northern Baltic Proper and Arkona Basin) have significant positive temperature trend with a rate of 0.04–0.05°C year−1 in the upper layer. A slightly higher significant trend in the upper layer can be found in the Gulf of Riga (0.06°C year−1) and a lower trend in the Bothnian Bay (0.03°C year−1). An insignificant positive trend of 0.02°C year−1 is revealed in the upper layer of the Bothnian Sea. The two locations in the central Baltic (Eastern Gotland Basin and Northern Baltic Proper) have significant warming trends in the two upper bins 5 and 15 m depth. The warming has been higher in the sub-surface layer of the Gulf of Finland at the 15–35 m depth. Such a vertical maximum of warming trend can be found in the Bothnian Sea, but in the depth range of 35–75 m.
There is a minimum in temperature trend profiles in the Gulf of Finland, Northern Baltic Proper, Eastern Gotland Basin, and Bornholm Basin at the depth around 50 m. A significant positive trend of 0.03°C year−1 can be found in the Gulf of Finland while no trend exists or the trend is statistically insignificant in the intermediate layer of the rest of the three basins. There is a clear positive trend of 0.04–0.06°C year−1 in the deeper layers of the four basins. Significant temperature trends were not found in the deep layers of the Bay of Bothnia, the Bothnian Sea and the Gulf of Riga. There is, however, a strong warming signal in the Gulf of Riga at the depth of 35 m. A closer look to data shows that it is caused by warmer mixed layer during the decay of stratification in autumn in recent years.
Most of the areas have had a significant negative surface salinity trend of −0.005 to −0.014 g kg−1 a year. Such a negative trend reaches down to 40–50 m depth. The negative salinity trend in the upper layer prevails in most of the areas in all seasons. A significant positive salinity trend of 0.02–0.04 g kg−1 a year was detected in the deep layers of the Bornholm Basin, the Eastern Gotland Basin, the Northern Baltic Proper, and the Gulf of Finland. A similar trend, but not statistically significant, has occurred in the Arkona Basin. A significant salinity trend was not detected in the deep layer of the rest of the three areas.
There is no seasonality in temperature and salinity trend in the deep layer in most of the areas. An exception is the deep layer of the Gulf of Finland, where the warming trend is stronger (0.06–0.08°C year−1) from March to August and weaker (0.02–0.04°C year−1) from September to February. A similar tendency appears in salinity trend in the deep layer of the Gulf of Finland. There is no significant trend from December to February (−0.02 to +0.01 g kg−1 year−1) while in March to August, a significant positive salinity trend (0.03 to −0.06 g kg−1 year−1) is evident.
Vertical profiles of the trends in the heat content and salt mass in the whole Baltic Sea are shown in Figure 4. The water column of the upper 50 m has contributed 65% of the total heat content change while the layer deeper than 100 m 12% of the change. The total heating trend in the Baltic has been 2.5 × 10¹⁸ J year−1, reflecting the temperature trend of 0.031°C year−1, which corresponds to the temperature increase of 1.07°C from 1982 to 2016. The changes in salt mass are driven by a slight decrease in salinity in the upper layer that covers large areas and a stronger increase in salinity in the deeper layer, which has a smaller volume of water. The salt mass decrease in the upper 56 m has been 1.34 × 10⁸ t year−1 and the increase below that depth 1.10 × 10⁸ t year−1. The total estimated decrease of salt mass in the Baltic has been −0.24 × 10⁸ t year−1, which corresponds to salinity decrease of −1.1 × 10⁻³ g kg−1 year−1 or −0.040 g kg−1 during 35 years. Such a small trend is strongly overshadowed by variability in shorter time scales, and it is not significant. Thus, in conclusion, no trend in the mean salinity and salt mass for the entire Baltic Sea for the 35-year period was detected.
Changes in Stratification
Accompanied seawater density (Figures 5A,B) trends are associated with the changes in temperature and salinity. There is a negative density trend in the upper 50 m, which has the highest magnitude in the near-surface layer. The decreasing trend is very similar (−0.013 to −0.014 kg m−3 year−1) in five basins: Arkona Basin, Bornholm Basin, Eastern Gotland Basin, Gulf of Riga, and Northern Baltic Proper. The decreasing trend in density has been stronger in summer in the five areas and was in the range from −0.017 to −0.023 kg m−3 year−1. The trends were smaller in the Bothnian Bay and the Bothnian Sea being −0.010 kg m−3 year−1 (based on annual averages) and −0.010 and −0.011 kg m−3 year−1, respectively, in summer, and the Gulf of Finland −0.007 and −0.003 kg m−3 year−1 based on annual and summer values. The decreasing trend in density in the Gulf of Finland has a higher magnitude (−0.013 to −0.015 kg m−3 year−1) in the subsurface layer at the 15–35 m depth. The latter corresponds to the decreasing trend in salinity and increasing trend in temperature at this depth range in the gulf (Figures 4A,B). A significant density trend was detected in the basins where the halocline exists and an increasing trend in salinity in the deep layers (Figures 4B,D) has occurred: Bornholm Basin, Eastern Gotland Basin, Northern Baltic Proper and Gulf of Finland. The increase in salinity overshadows the effect of the increase in temperature on density in the deep layer. A density increase, mostly in the range of 0.020–0.030 kg m−3 year−1, has occurred in the sub-halocline layers. No significant density trend was detected in the near-bottom layers of the Bothnian Sea, the Bothnian Bay and the Gulf of Riga. A remarkable seasonality in the deep layer density trend was found in the Gulf of Finland, where in winter, no significant trend exists, while in the rest of the year a significant trend was detected.
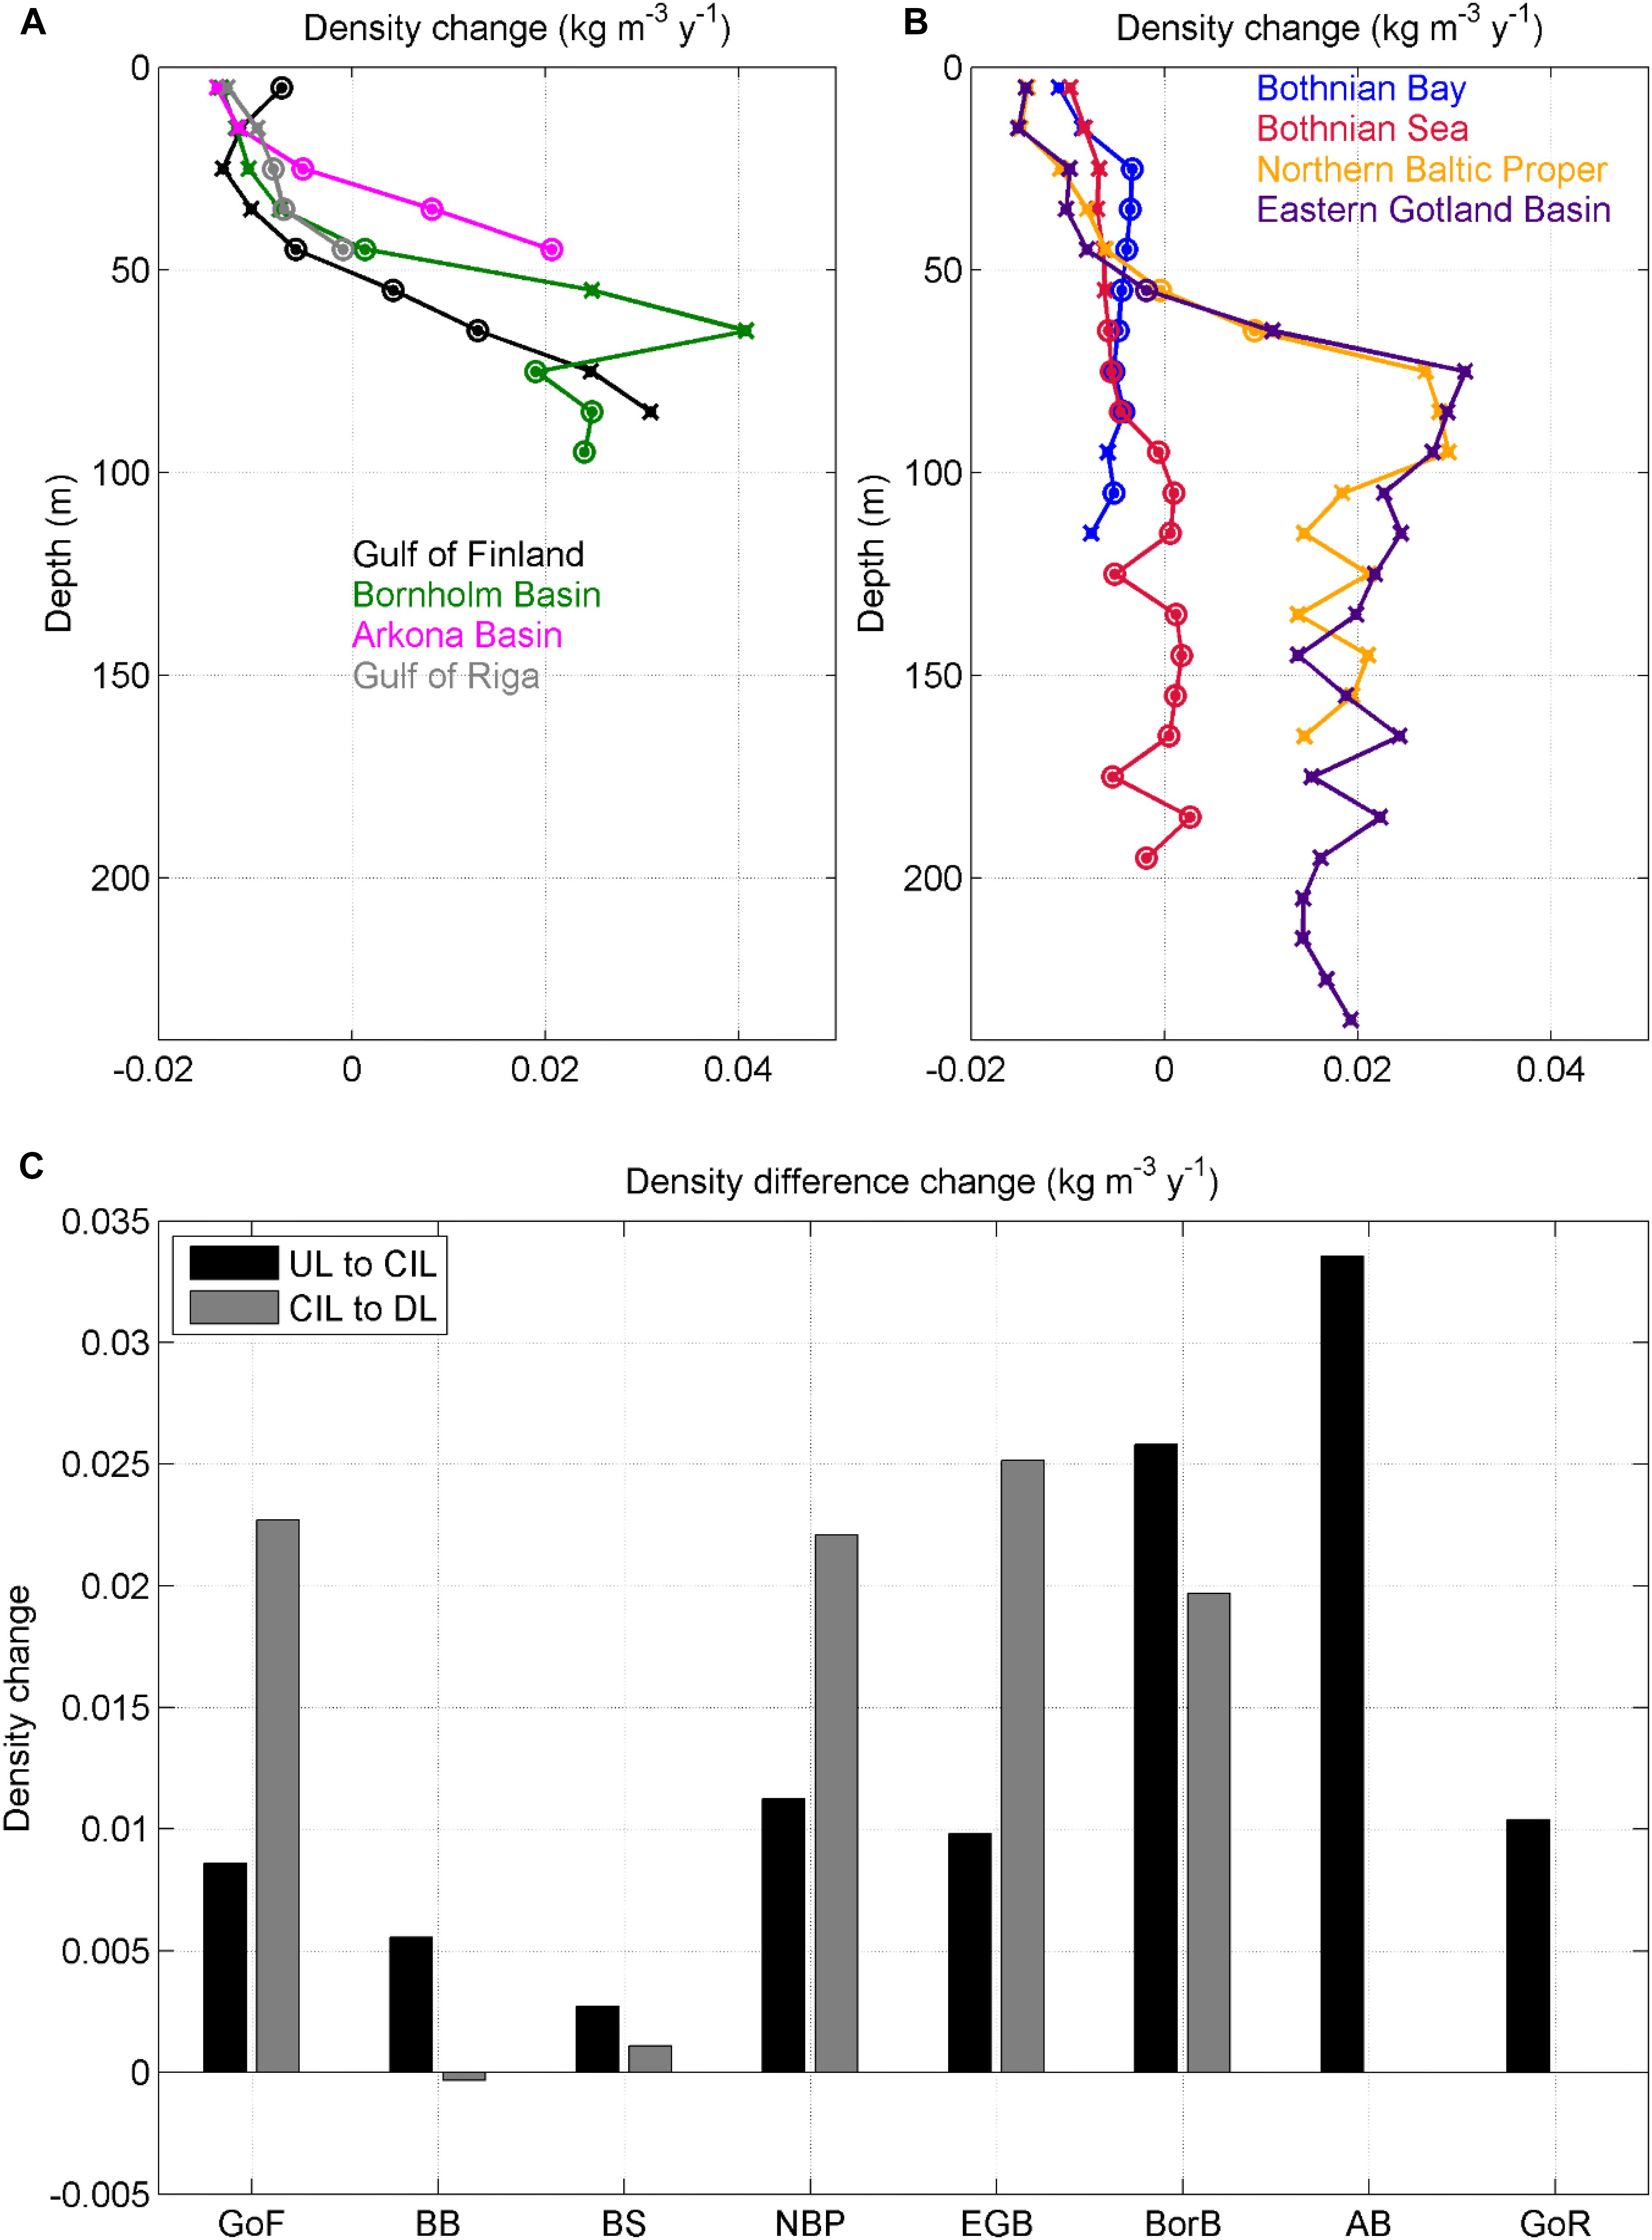
Figure 5. Density trends (A,B): trends of density differences (C) between the upper mixed layer and cold intermediate layer (UL to CIL, from 5–15 to 45–55 m), and between cold intermediate layer and sub-halocline deep layer (CIL to DL, from 45–55 to 65–85 m) in the sub-basins (GoF – Gulf of Finland, BB – Bothnian Bay, BS – Bothnian Sea, NBP – Northern Baltic Proper, EGB – Eastern Gotland Basin, BorB – Bornholm Basin, AB – Arkona Basin GoR – Gulf of Riga) of the Baltic Sea.
As a proxy of stratification strength, trends in density differences between the upper layer (UL, 5–15 m), the intermediate layer (CIL, 45–55 m) and the deep layer (DL, 65–85 m), are shown in Figure 5C. Stratification between the upper layer and intermediate layer has become stronger in all basins. The trend in the Gulf of Finland, the Gulf of Riga, the Eastern Gotland Basin and the Northern Baltic Proper has been in the range of 0.009–0.011 kg m−3 year−1. A higher trend was found in the Arkona and Bornholm basins. This is, however, likely related to the fact that the halocline is located there shallower compared to the Central and Eastern Baltic. Weaker trends are revealed in the Bothnian Sea and the Bothnian Bay. The density difference between the intermediate layer and the deep layer has increased at a rate of 0.020–0.025 kg m−3 year−1 in the Bornholm Basin, the Eastern Gotland Basin, the Northern Baltic Proper, and the Gulf of Finland. This change is driven by lateral water exchange and a corresponding increase in deep layer salinity. Since haline stratification is very weak in the Bothnian Bay and the Bothnian Sea, such a trend there cannot be found.
Discussion
Heat and Salt Content Changes
An increase in the total heat content of 2.5 × 10¹⁸ J year−1 (7 × 10¹² J year−1 km−2), which corresponds to the mean temperature increase of 1.07°C in 1982–2016, has occurred in the Baltic Sea. No significant change in the salt content of the sea during the same period has occurred. The pentadal time-series of mean salinity (Figure 6B) show a decrease from the 1980s to the mid-1990s, confirming the earlier observation-based estimate (Winsor et al., 2001) and model results (Meier and Kauker, 2003). Thus, even if there was no decline in the occurrence of smaller barotropic inflows since the 1980s (Mohrholz, 2018), a decrease in the mean salinity still occurred, likely due to the lack of strong MBIs since the early 1980s until the 1993 MBI. The pentadal averages of temperature in 2002–2016 had a higher mean temperature than those in 1982–1996, indicating a warming trend of the Baltic Sea (Figure 6A). Pentadal averages of temperature in the upper 100 m in the Atlantic Ocean (Levitus et al., 2012) had similar temporal development (Figure 6A), although warming has been more rapid in the Baltic Sea. If taking the mean depth of the Baltic Sea of 54 m (Leppäranta and Myrberg, 2009), the heat content change of the Baltic has been rather similar to the change in the upper 100 m in the Atlantic Ocean. In other words, a similar trend in heat content has caused a higher temperature rise in the Baltic in proportion to the mean depth. Thus, the Baltic Sea had roughly two times higher temperature increase rate, compared to the upper 100 m in the Atlantic Ocean. This important factor has to be taken into account when long-term changes of temperature-sensitive species are explained in the past or predicted for the future. Similar heat content rise in the Baltic Sea and the upper layer of the Atlantic Ocean hints that there are large-scale (Kniebusch et al., 2019) rather than local reasons for the temperature trend in the Baltic.
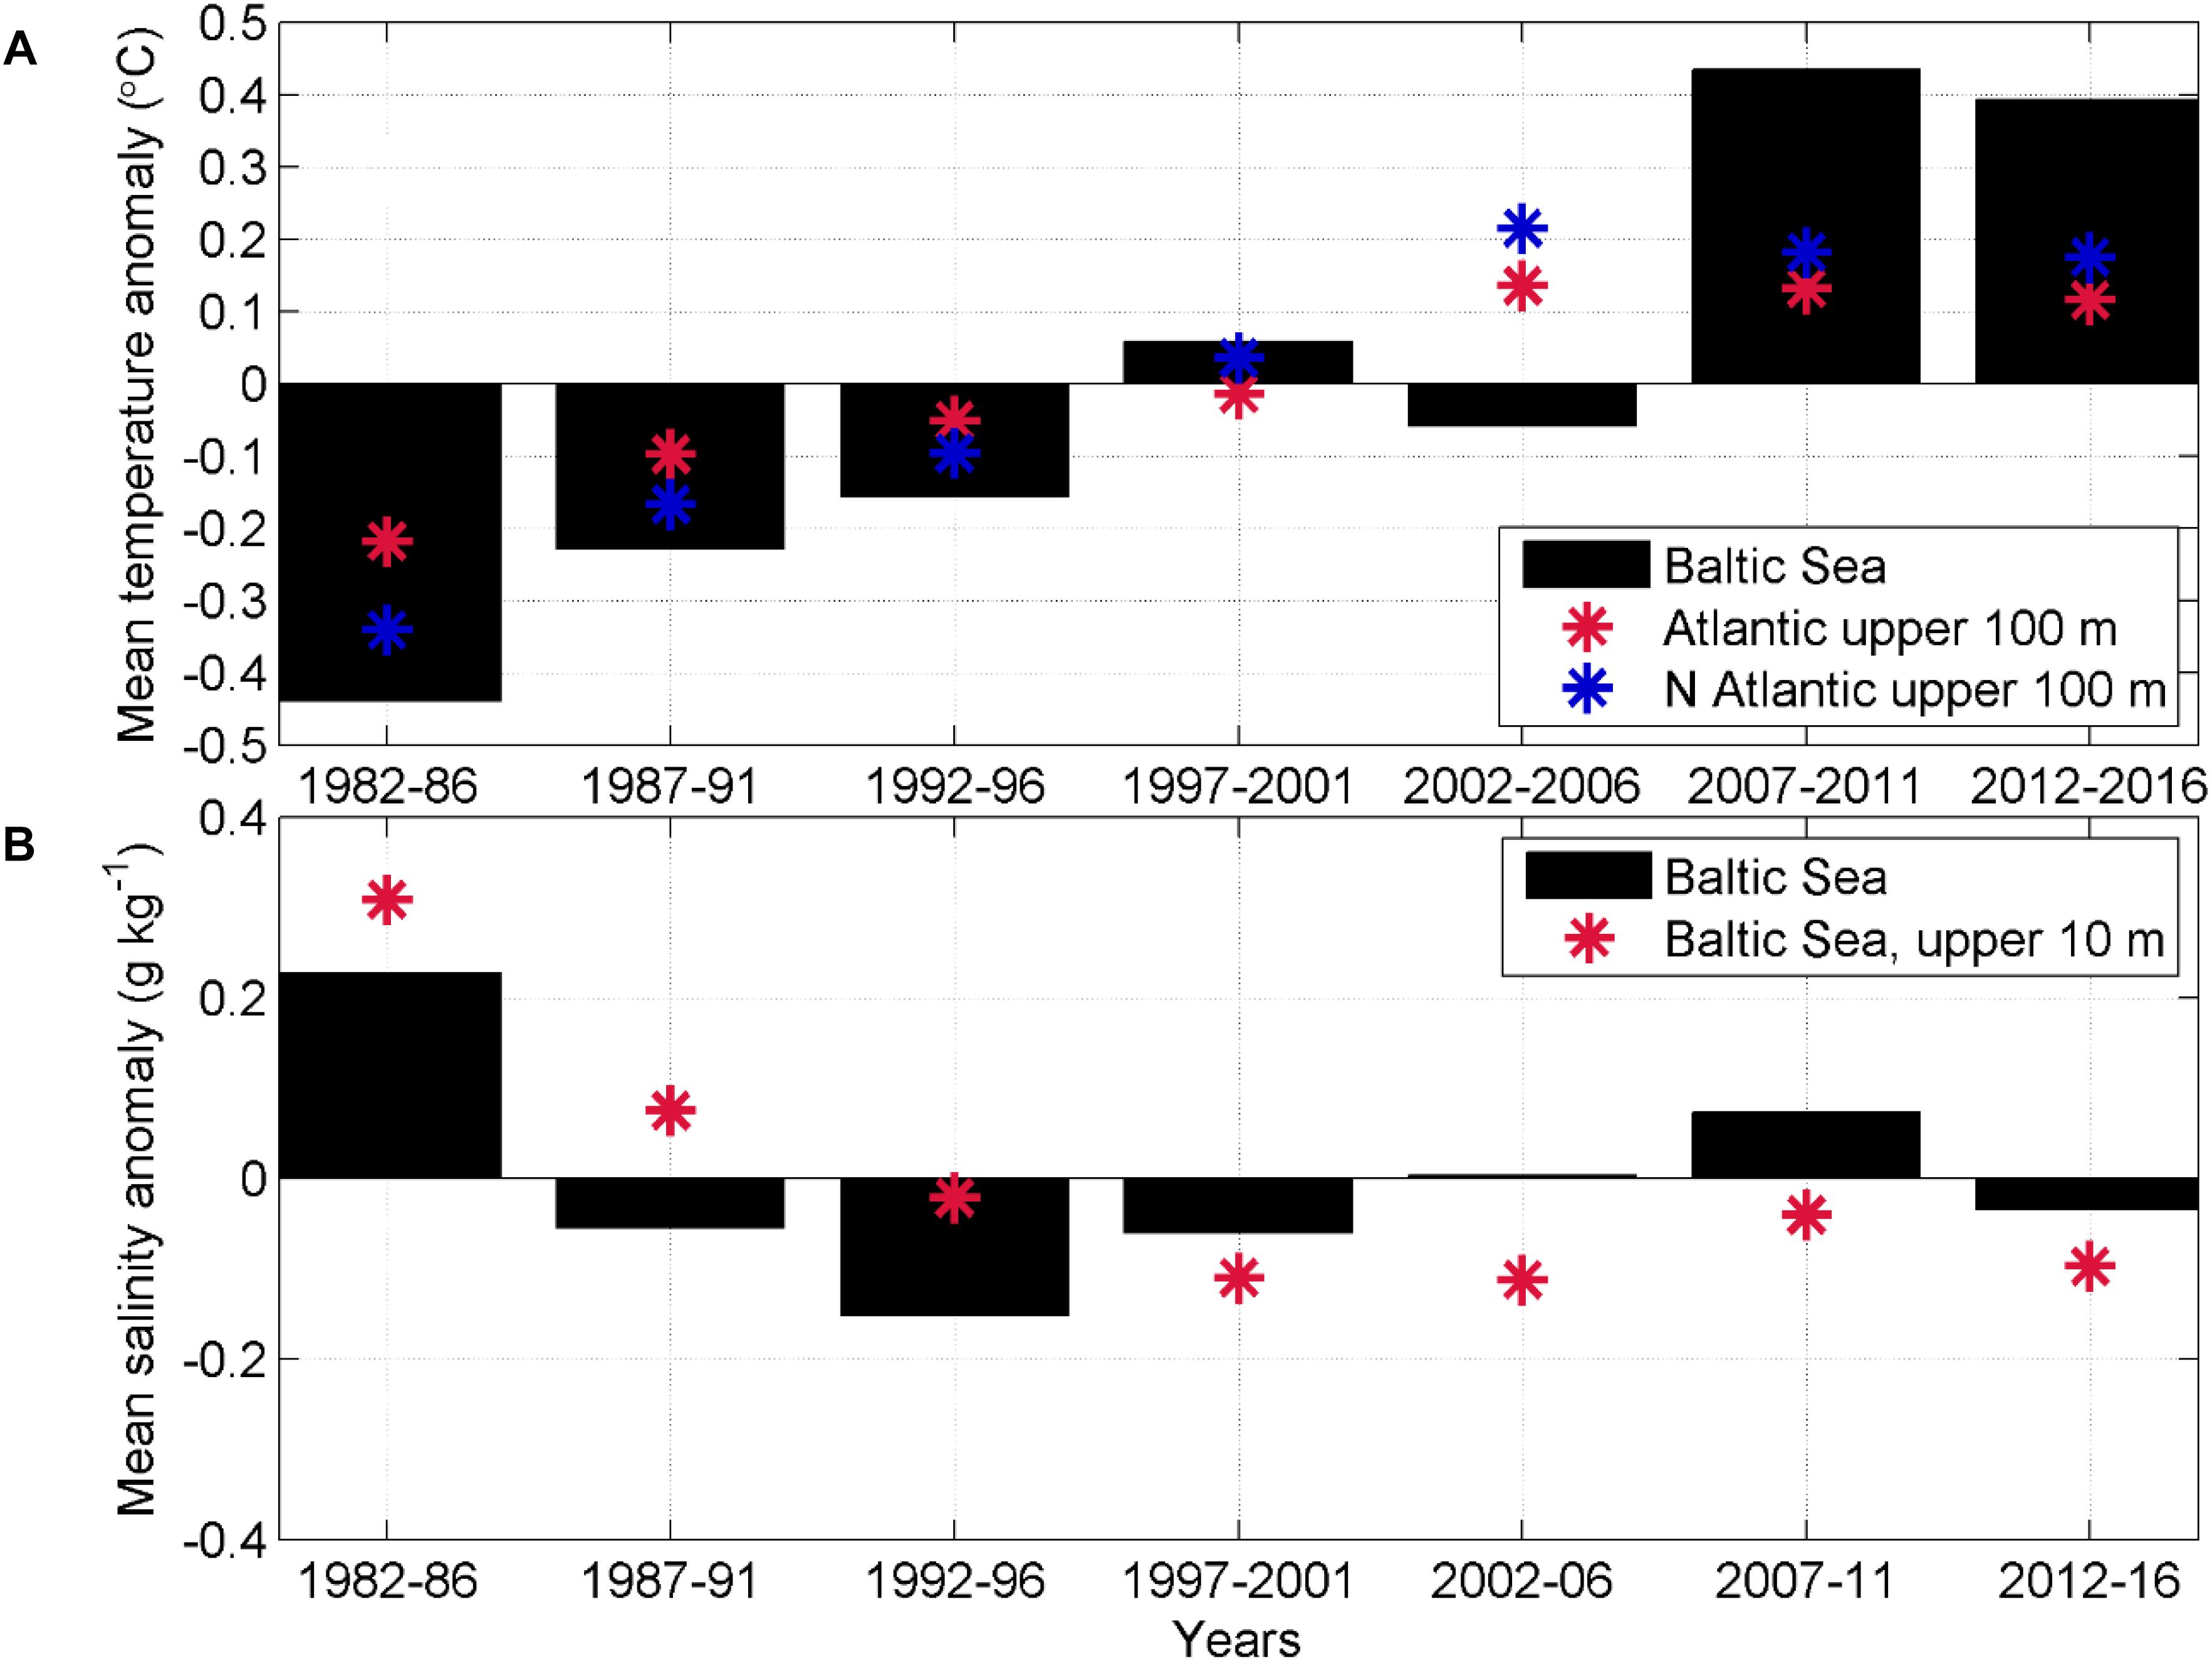
Figure 6. Pentadal averages of temperature (A) and salinity (B) anomalies in the entire Baltic Sea in 1982–2016. Pentadal averages of temperature in the upper 100 m in the Atlantic Ocean and its part in the northern hemisphere are shown in the upper panel. Extended time-series of vertically integrated temperature change in the (Northern) Atlantic Ocean by Levitus et al. (2012) are presented.
Distinct Changes in the Three Layers and Pycnoclines
Temperature and salinity trends are not homogenous in the water column. There is a warming trend of 0.03–0.06°C year−1 in the upper layer and below the halocline in the deep layer. The negative salinity trend of −0.005 to −0.014 g kg−1 year−1 in the upper 40–50 m has simultaneously occurred with a positive trend of 0.02–0.04 g kg−1 year−1 below the halocline. The trends in the deep layer have not occurred in the basins, where the halocline does not exist – the Bothnian Sea, the Bothnian Bay, and the Gulf of Riga. In the rest of the areas, the three layers have had the following distinct changes: the upper layer has become warmer and fresher while the deep layer has become warmer and saltier. The smallest changes have occurred in the cold intermediate layer. These distinct changes are revealed not only from the trends but also visually from the time-series of temperature and salinity anomalies (Figure 7). For instance, it is clear that in all three selected areas – the western (Bornholm Basin, Figure 7B), central (Eastern Gotland Basin, Figure 7D) and eastern (Gulf of Finland, Figure 7F) part of the Baltic Sea, there has been higher (lower) salinity in the beginning of the study period and lower (higher) salinity in the recent decade in the surface (deeper) layer. A nearly homogenous change in the entire water column has been reported (Zorita and Laine, 2000) and predicted (BACC Author Team, 2015) though.
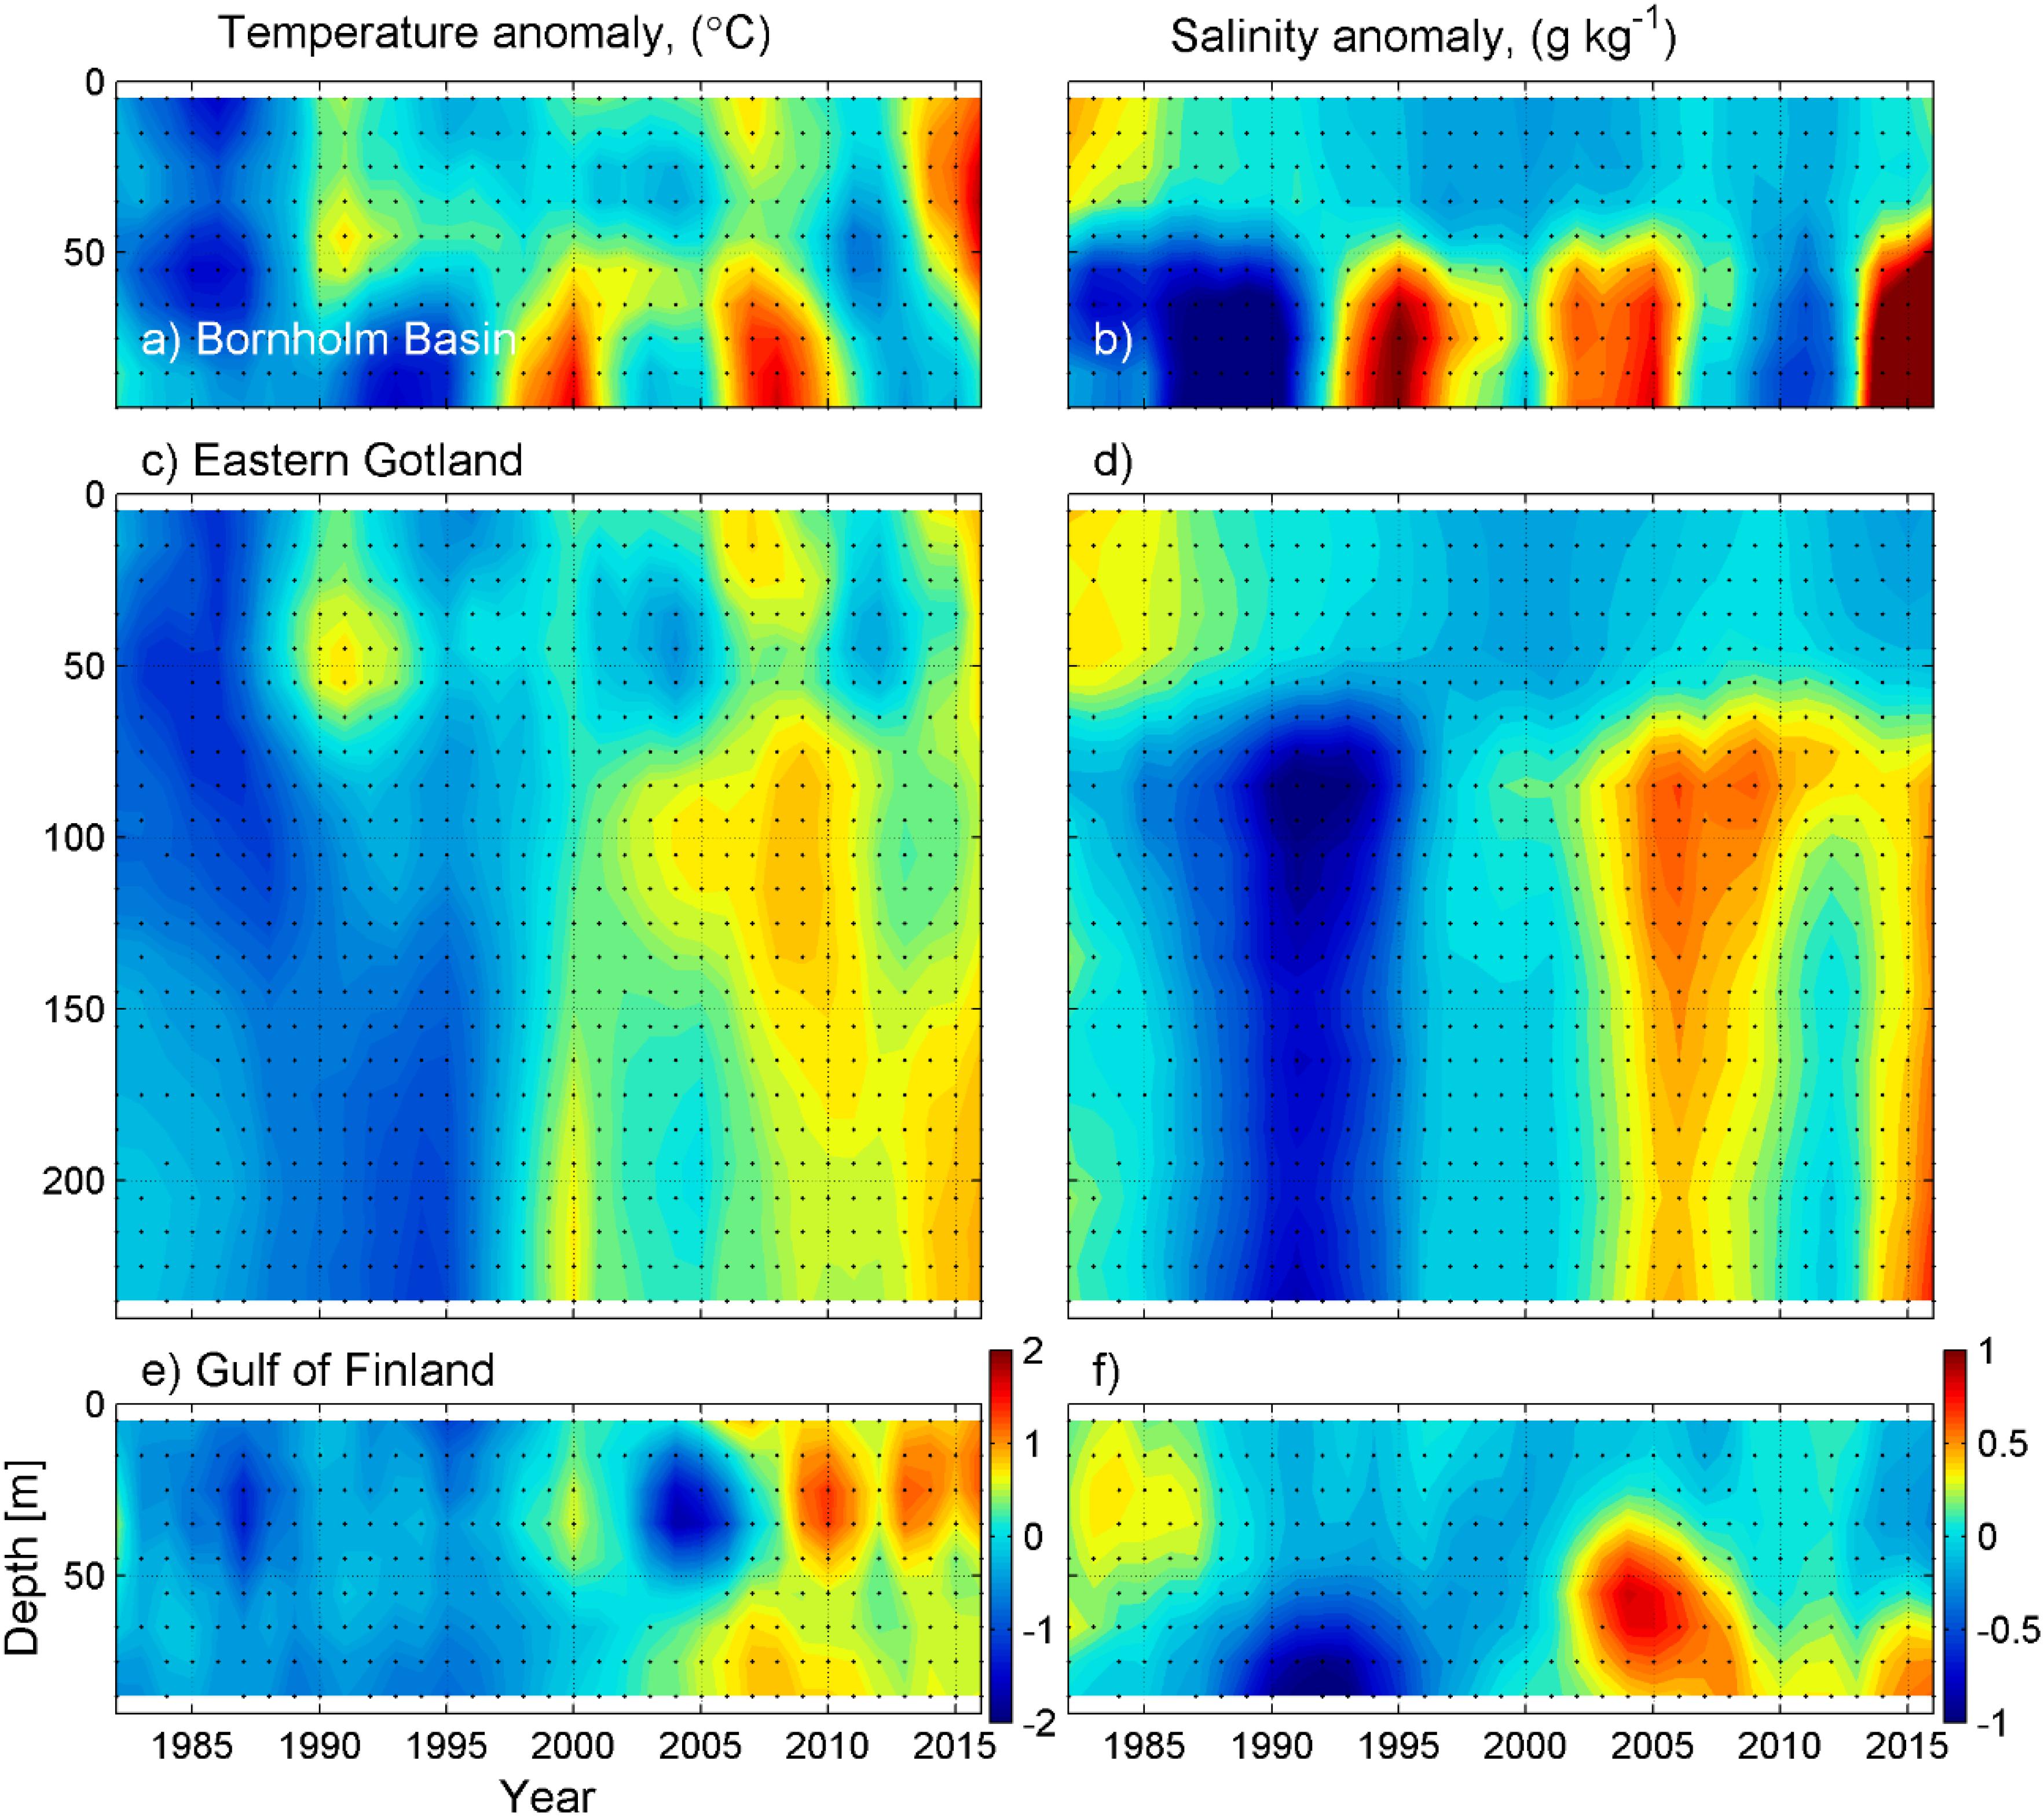
Figure 7. Time-series of annual anomalies of temperature (A,C,E) and salinity (B,D,F) in the Bornholm Basin, the Eastern Gotland Basin, and the Gulf of Finland.
The main reason for distinct changes is that different processes in various spatial and temporal scales dominate in the three layers. The upper layer is about half a year separated from the rest of the water column by the seasonal thermocline. It means, the changes in the heat flux through the sea surface and riverine/atmospheric freshwater flux impact only the upper 10–30 m thick layer during half a year. The cold intermediate layer instead is formed in the winter period. Even if the trend in the heat flux would be the same in winter and summer, the extra heat is distributed in the 60–70 m layer in winter in most of the Baltic. Therefore, the annual temperature change would be higher in the upper layer compared to the intermediate layer. Moreover, even if there is a change in temperature of the cold intermediate layer, it almost does not have any impact on stratification, since, at low temperatures, density changes caused by temperature changes are very small. There is no direct effect of changes in river runoff and winter mixing on the deep layer. Thus, the deep layer, which is controlled by abrupt inflows from the North Sea, and the upper layer, which is controlled by vertical salt flux and accumulated river runoff, show different long-term temporal courses. This can be observed from long-term records (Fonselius and Valderrama, 2003) – temperature and salinity in the surface layer do not follow the changes in the deep layer. Exceptions might be the areas where pycnoclines do not exist, e.g., the Gulf of Bothnia (Raateoja, 2013). Our results show that the thermohaline properties change in different directions and have different magnitudes in the three layers.
The Baltic Sea has become more stratified during the recent 35 years. The upper pycnocline is stronger due to the increase in temperature and decrease in salinity in the upper layer. The deeper pycnocline is stronger due to higher salinity in the deep layer. Warming of the deep layer contributes to the slight decrease in density, but this effect is overshadowed by the salinity increase. The increase in density difference between UL and CIL (between CIL and DL) in most of the Baltic Sea has been in a range of 0.009–0.011 (0.020–0.025) kg m−3 year−1 or 0.32–0.39 (0.70–0.88) kg m−3 for 35 years. Only slight trends can be found in the Bothnian Sea and the Bothnian Bay. Trends in the deeper pycnocline did not have seasonality. An exception was the Gulf of Finland where an inter-annual trend to stronger pycnocline was found, but such a trend did not exist in winter. The likely reason is the increased frequency of westerly winds during winters (Keevallik, 2011; Lehmann et al., 2011), which causes more frequent estuarine circulation reversals and consequent weakening of the halocline in the Gulf of Finland (Liblik et al., 2013; Elken et al., 2014; Lips et al., 2017).
In the present work, we concentrated on stratification strength, but the stratified period has extended as well. SST statistics (Kahru et al., 2016) suggest that the onset of stratification has occurred earlier, and the start of the decay of stratification later in recent years.
Sea Surface Temperature Trend
The average increase in the SST in the Baltic Sea for the period 1982–2016 was 0.05°C year−1, which is very similar to earlier estimates: 0.05°C year−1 for the period 1982–2013 (Stramska and Białogrodzka, 2015) and 0.04°C year−1 for the period 1982–2012 (Høyer and Karagali, 2016). The increase of the SST in the Baltic Sea has been more rapid than the globally averaged SST rise, but in a similar order with other marginal seas around Europe: the North Sea (Høyer and Karagali, 2016), the Mediterranean Sea (Pastor et al., 2018), and the Black Sea (Shaltout and Omstedt, 2014). As noted by previous studies (Stramska and Białogrodzka, 2015; Høyer and Karagali, 2016; Tronin, 2017), warming is stronger in summer – the mean positive SST trend in the sea is between 0.07 and 0.08°C year−1 from May to September while in December – March statistically significant trend was not detected in most of the sea areas (Figure 3). This seasonal warming has extended favorable conditions for cyanobacteria blooms in the Baltic (Kahru et al., 2016). The spatial pattern of the SST trend shown in the present study is very similar to the trend in the study by Stramska and Białogrodzka (2015). Spatial distribution of trend slopes is much more patchy and likely much more impacted by inter-annual variability if shorter periods are used for SST trend calculation (BACC Author Team, 2015).
An interesting feature in the SST trend is stronger warming in shallow ends of the gulfs and areas with limited water exchange (Figure 3). In locations with more active water exchange, such intense warming cannot be seen. In Figure 8A, the seasonal course of temperature trend along the line from the Arkona Basin to the Eastern Gulf of Finland is shown (location of the line is shown in Figure 3). It is clear that the higher SST increase (compared to the open Baltic, for instance) in the annual signal (Figure 3) in the eastern part of the Gulf of Finland is caused by a stronger trend in summer. Thus, the Eastern Gulf of Finland and other such areas have experienced more rapid warming, particularly in summer, compared to the rest of the Baltic Sea. The explanation of the stronger warming is not clear, but might be related to the bathymetry, stronger stratification or higher turbidity in these regions.
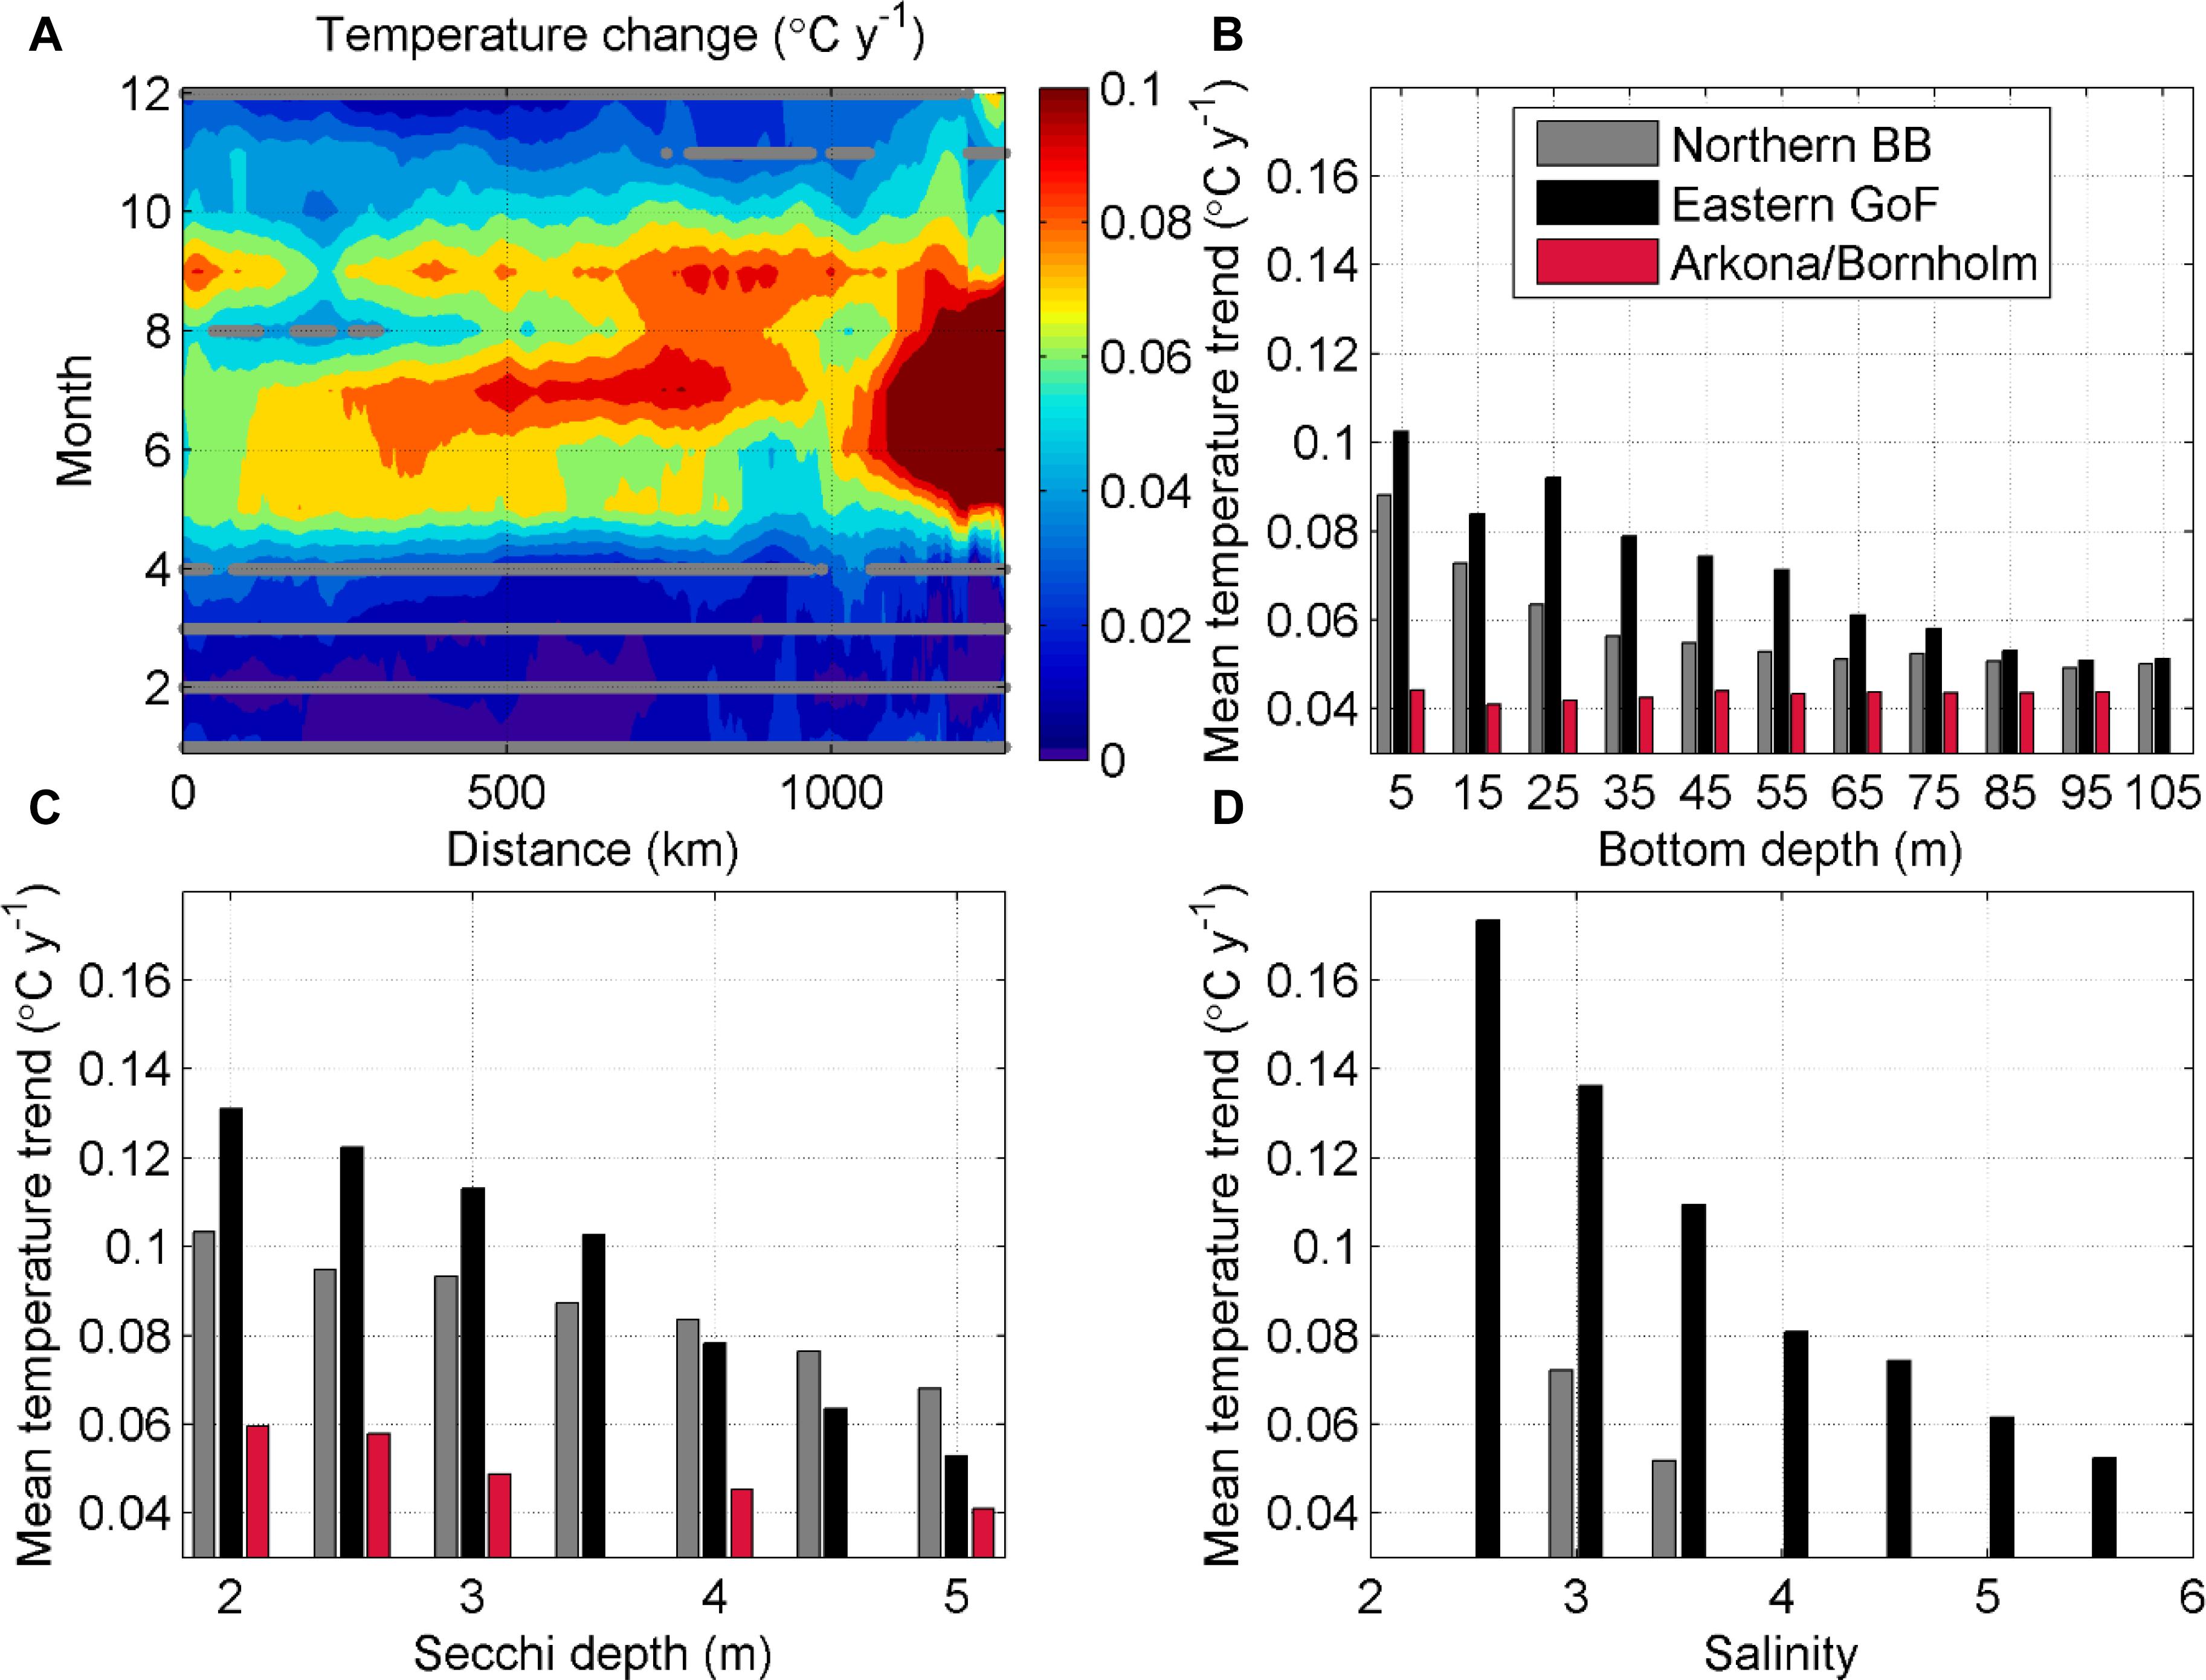
Figure 8. (A) Seasonal course of SST trend (°C year−1) along the line from Arkona basin to the Eastern Gulf of Finland (Figure 3). Gray lines/dots at subplot (A) show locations/months, where/when the trend was not significant (p > 0.05). Mean SST trend (°C year−1) at different (B) sea bottom depths, (C) Secchi depth (m), and (D) upper layer salinities in the Eastern Gulf of Finland, Northern Bothnian Bay, and Arkona/Bornholm area. Mean Secchi depth data from March to October 2003–2012 (Stock, 2015) and mean surface salinity from April to October (Janssen et al., 1999) were used. Salinity in this figure is given on the Practical Salinity Scale.
Extra heat in shallow areas is distributed in a thinner water column compared to deeper areas. To illustrate the effect, we have selected the following three areas (see boxes in Figure 3): Northern Bothnian Bay, Eastern Gulf of Finland and Arkona/Bornholm area, and calculated mean temperature trends for different bottom depth ranges inside those areas (Figure 8B). It shows that the temperature trend in shallower areas of the Eastern Gulf of Finland and the Northern Bothnian Bay has been higher than in deeper areas in the same regions. No such tendency can be found in the Arkona/Bornholm area. One can see (Figure 3) that the relationship between the higher temperature trend and shallower sea depth is valid (particularly in the Gulf of Finland) not only in very shallow areas but also in areas where sea bottom is well greater than the typical upper mixed layer depth. This might indicate that the warmed water formed in shallow areas has been transported toward central parts of the basins. Estuarine nature of mean circulation in both basins supports transport in the upper layer to deeper areas – to the west in the Gulf of Finland and the south in the Bothnian Bay (Andrejev et al., 2004; Myrberg and Andrejev, 2006).
The second possible explanation for the stronger warming in these areas, particularly for the Eastern Gulf of Finland, might be stronger haline stratification that coincides in summer with the seasonal thermocline (Vankevich et al., 2016). The mouth of the largest river in the Baltic Sea, the Neva River, is located at the eastern end of the Gulf of Finland. This riverine water causes stratification, which impedes vertical mixing, e.g., convection due to diurnal heat flux cannot reach that deep. Therefore, heat is kept in a relatively thin water column compared to the areas with less riverine water impact. Proxy of haline stratification and the impact of riverine water on the upper layer is the upper layer salinity. It is clear that the SST trend in the Gulf of Finland is well correlated with the upper layer salinity (Figure 8D). In case of easterly winds, this fresher and warmer thin layer can occasionally drift to the central Gulf of Finland and increase stratification there (Liblik and Lips, 2017; Suhhova et al., 2018). Another reason for enhanced stratification in these regions might be a lower activity of surface waves (Tuomi et al., 2010).
The third possible explanation might be shallower attenuation of solar radiation of more turbid waters in the eastern Gulf of Finland (Ylöstalo et al., 2016) and consequent higher warming rate in the sea surface (Morel et al., 1994; Gildor and Naik, 2005; Lin et al., 2007). There is a clear correlation between the mean Secchi depth and SST trend (Figure 8C). Modeling experiment (Löptien and Meier, 2011) has shown that turbidity impacts the SST trends in the Baltic. Probably all three possible components (shallow depths and limited water exchange, stronger stratification, and higher turbidity) contribute to the higher warming rate of these areas. Further investigations of the components are out of the scope of the present work, but all three are worthy of studying in the future.
Upper Layer Salinity Trend
Freshening of the upper 50 m and an increase in salinity below that depth in the Baltic Sea has occurred during 1982–2016. The uppermost layer has become fresher at a rate of −0.005 to −0.014 g kg−1 year−1. The trend is not continuous, but it is clear that the upper layer salinity has been lower in the recent decade compared to the first decade of the study period (Figure 7). A negative salinity trend, but with a smaller magnitude (between −0.003 and −0.008 g kg−1 year−1) near the southern coast of the Baltic has been detected for the period 1950–2010 (Girjatowicz and Świątek, 2016). Possible causes for the decrease in the upper layer salinity are (1) reduced vertical salt fluxes from the deeper layers and/or (2) increased freshwater flux from atmosphere and land and its storage in the Baltic. It has been hinted that the upper layer salinity decrease since the beginning of the 1980s is related to the absence of MBIs (Reissmann et al., 2009) or has been mainly related to the accumulated river runoff (Winsor et al., 2001).
The reduced vertical salt flux might be caused by reduced vertical mixing or decreased salinity below the halocline. Latter is not the case, as salinity has increased in the deep layers of the Baltic (Figures 4B,D). Contributions of various processes to the vertical mixing and upward salt transport are not clear (Reissmann et al., 2009). Mean salinity in the Eastern Gotland Basin quite well describes the changes in the whole Baltic Sea (Winsor et al., 2001). We can confirm this by Figure 4F – the total salt mass change rate on the basis of the salinity changes and hypsographic curves in all basins is similar to the estimate where only the salinity changes in the Eastern Gotland Basin and the hypsographic curve of the whole Baltic Sea are taken into account. Moreover, the profiles of the heat content change calculated by the same two methods also fit well (Figure 4E). Discrepancies in the magnitude of the salinity and temperature increase can be found in the halocline, where the Eastern Gotland Basin-based estimate shows a higher increasing rate. This overestimation can be explained by the absence of the halocline in the Bothnian Sea and the Bothnian Bay, which is not taken into account by the Eastern Gotland Basin-based method. Nevertheless, multiyear salinity changes in the Eastern Gotland Basin can be used as a proxy of the mean salinity changes in the whole Baltic Sea.
Due to its central location and long distances from main fresh- and saltwater sources and coastal slopes, offshore areas of the Eastern Gotland Basin are not that strongly impacted by synoptic scale movements of fronts, upwelling events, etc. Taking the mean residual current of 0.2 cm s−1 (Meier, 2007; Reissmann et al., 2009) and mean horizontal salinity gradient between the Northern Baltic Proper and the Eastern Gotland Basin above halocline 0.0013 g kg−1 km−1 (Janssen et al., 1999), freshening of the upper layer caused by the advection (residual current) would be 0.007 g kg−1 month−1 or 0.04 g kg−1 during 6 months. The average seasonal increase of upper layer salinity in the Eastern Gotland Basin from August-September to February-March has been 0.52 g kg−1 in 1982–2016. Thus, the vertical mixing overshadows the effect of lateral freshwater flux on the upper layer salinity in a seasonal time-scale during autumn-winter. This can be well seen in the annual cycle of the upper layer salinity. Salinity increases in the upper layer of the Eastern Gotland Basin every autumn-winter. By taking the upper layer thickness of 60 m and the upper layer salinity change from summer to winter, we can estimate the upward salt flux (Reissmann et al., 2009). The mean vertical salt flux has been 31 kg m−2 year−1 during 1982–2016 that is very close to the estimate by Reissmann et al. (2009). If the mean salinity decrease by lateral advection is taken into account, the mean estimated flux would be 34 kg m−2 year−1. The flux does not show a trend suggesting that the negative salinity trend in the upper layer is not a consequence of changes in vertical salt transport.
Total runoff to the Baltic has been lower in the 1960s–1970s and higher since the 1980s (Johansson, 2018). Smoothed time-series (by 5-years cut-off period) of salinity in the Eastern Gotland Basin show a declining tendency from 1983 to 2001, an increase from 2002 to 2009 and a decline again until 2015 (Figure 9). Smoothed (by 5-years cut-off period) accumulated river runoff anomaly (anomalies from the average in 1950–2016) has a negative correlation with the upper layer salinity change in the Eastern Gotland Basin (Figure 9). A relationship between the mean salinity of the Baltic Sea (freshwater storage) and the accumulated runoff perturbations was shown by Winsor et al. (2001) and Väli et al. (2013). A decrease in accumulated river runoff anomaly (i.e., runoff was smaller than the average in 1950–2016) fits with the period of the salinity increase. However, the decrease in runoff was not as pronounced as the increase in the upper layer salinity in 2002–2009. One can see (Figure 9) that higher than average vertical salt flux occurred during that period. Further studies are needed to check if this discrepancy is related to the vertical salt flux or not. It also has to be noted that no statistically significant trends have been detected in annual river discharge in the Baltic Sea basin as a whole (BACC Author Team, 2015).
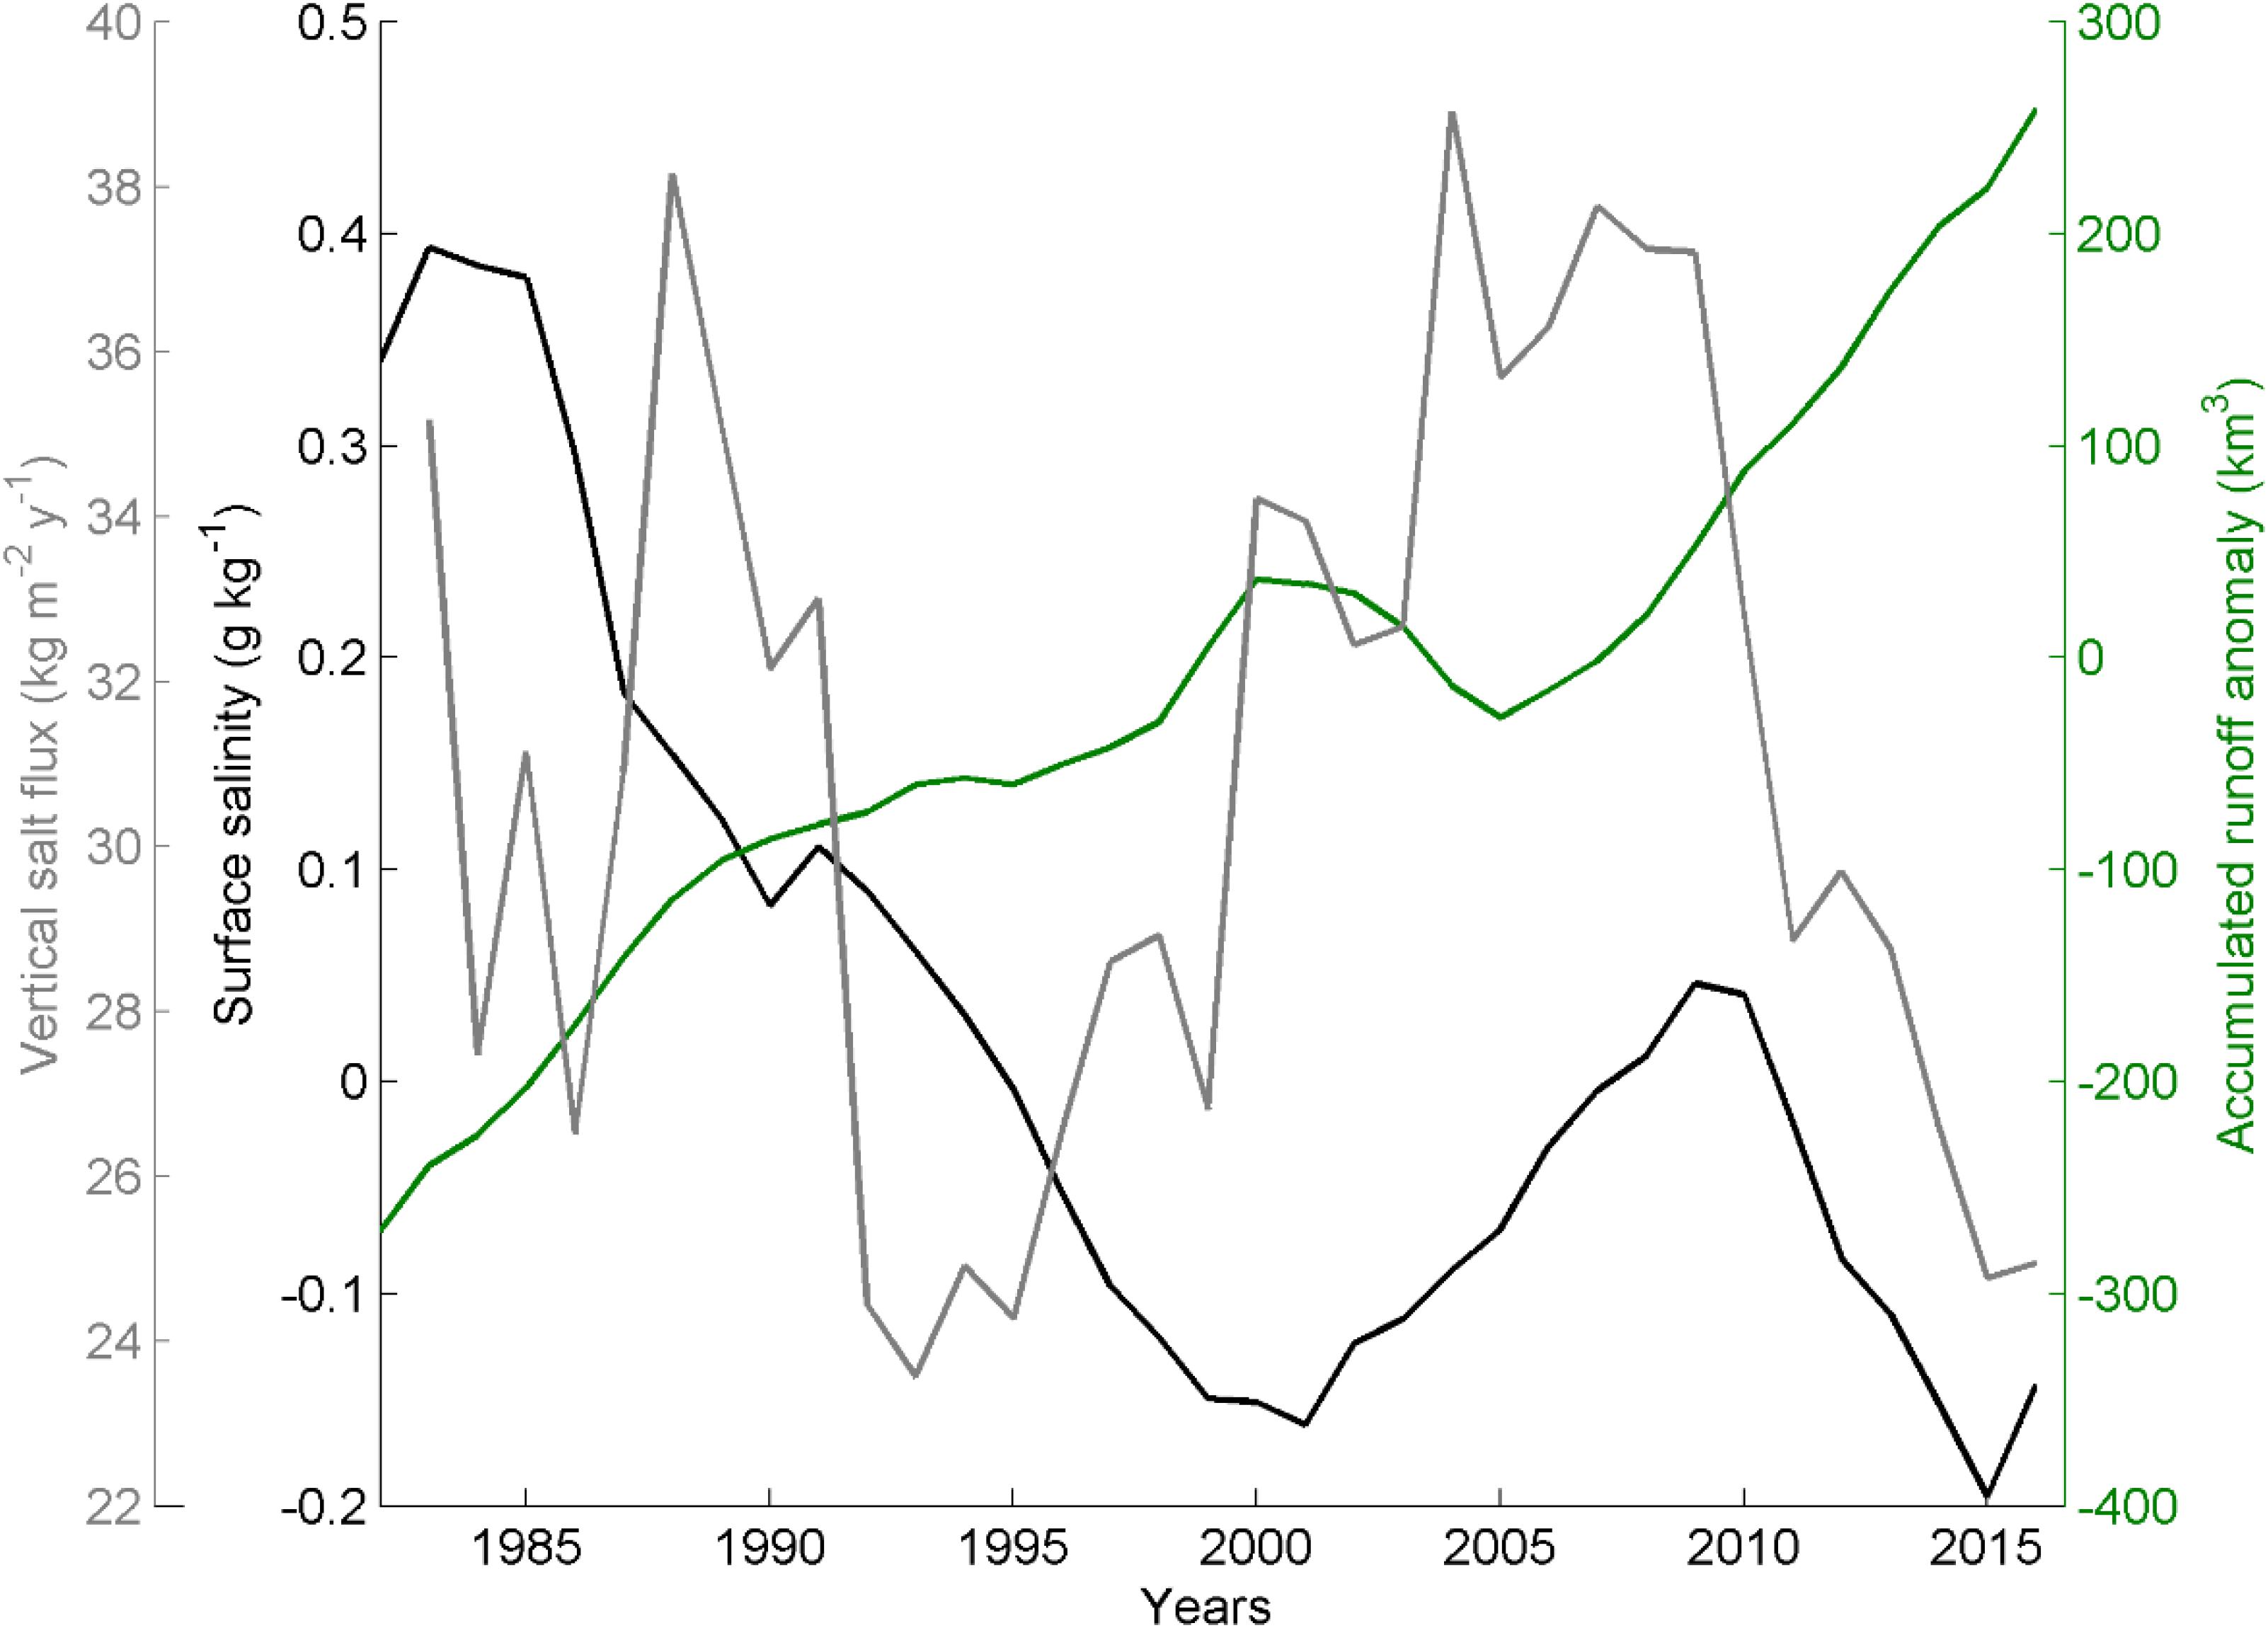
Figure 9. Smoothed (by cut-off period 5 years) time-series of surface salinity anomalies in the Eastern Gotland Basin, accumulated river runoff anomalies, and vertical salt flux. River runoff data from Johansson (2018) were used.
Conclusion
Stratification has strengthened in the Baltic Sea from 1982 to 2016. The trend in the annually averaged density gradient through the seasonal thermocline (halocline) in most of the Baltic Sea has been in the range of 0.009–0.011 (0.020–0.025) kg m−3 year−1 or 0.33–0.39 (0.70–0.88) kg m−3 for 35 years. The strengthening trend of the halocline does not have a remarkable seasonality. An exception is the Gulf of Finland where no trend was found for the winter period likely due to the sensitivity of the gulf to increased frequency of westerly winds.
Distinct changes due to different dominating processes in various spatial and temporal scales in the three layers have occurred. The upper layer in most of the Baltic Sea is characterized by increasing temperature (0.03–0.06°C year−1) and decreasing salinity (−0.005 to −0.014 g kg−1 year−1). SST trends estimated based on in situ and remote sensing data agree well. The decrease in the upper layer salinity is likely caused by accumulated river runoff. However, in the second half of the study period, the time-series of accumulated river runoff and upper layer salinity do not agree well. We suggest that decadal changes in vertical salt transport might be the reason for this. Further studies are needed to confirm this hypothesis. Increased salinity in the deep layer is likely associated with increased lateral salt import from the North Sea. Areas, where the halocline exists have had temperature trend of 0.04–0.06°C year−1 and salinity trend of 0.02 to 0.04 g kg−1 year−1 in the deep layers. Only minor and mostly statistically not significant changes have occurred in the cold intermediate layer.
Upper layer warming is stronger from May to September (0.07–0.08°C year−1 for the whole Baltic Sea). The mostly not significant trend in winter has been 0.01–0.02°C year−1. Higher rate of warming (>0.06°C year−1) has occurred in shallower, closed-end areas of gulfs, e.g., the northern part of the Bothnian Bay, the eastern part of the Gulf of Finland, and the eastern part of the Gulf of Riga. These areas have been warmed faster compared to the rest of the Baltic Sea during summers. The following three possible reasons could be responsible for high warming in these areas: shallow depths and limited water exchange, stronger stratification, and higher turbidity.
The warming trend in the whole Baltic has been 0.031°C year−1 or 1.09°C from 1982 to 2016. The temperature increase has been, proportionally to the mean depth of the sea, approximately two times higher in the Baltic Sea compared to the upper 100 m in the Atlantic Ocean. Such a more rapid temperature increase has to be considered in the predictions of future changes. No significant trend in the mean salinity of the Baltic Sea was detected.
Author Contributions
TL was responsible for compiling the data, data analyzes, and writing manuscript. UL contributed to writing of the manuscript.
Funding
This work was supported by Institutional Research Funding IUT (IUT19-6) of the Estonian Ministry of Education and Research.
Conflict of Interest Statement
The authors declare that the research was conducted in the absence of any commercial or financial relationships that could be construed as a potential conflict of interest.
Acknowledgments
We would like to thank everybody who has contributed to performing the measurements and producing valuable data in the Baltic Sea.
Footnotes
- ^ http://ocean.ices.dk/helcom (accessed January 31, 2018).
- ^ http://marine.copernicus.eu/ (accessed January 31, 2017).
- ^ http://www.helcom.fi/action-areas/monitoring-and-assessment/manuals-and-guidelines/salinity-and-temperature/ (Manual for Marine Monitoring in the COMBINE Programme of HELCOM, 2017).
- ^ http://marine.copernicus.eu/ (accessed October 1, 2018).
- ^ https://podaac.jpl.nasa.gov/dataset/JPL_OUROCEAN-L4UHfnd-GLOB-G1SST (accessed October 1, 2018).
References
Andrejev, O., Myrberg, K., Alenius, P., and Lundberg, P. A. (2004). Mean Circulation and Water Exchange in the Gulf of Finland-a Study Based on Three-Dimensional Modelling. Available at: http://www.borenv.net/BER/pdfs/ber9/ber9-001.pdf (accessed November 22, 2018).
Astok, V., Otsmann, M., and Suursaar, Ü (1999). Biological, physical and geochemical features of enclosed and semi-enclosed marine systems. Hydrobiologia 393, 11–18. doi: 10.1007/978-94-017-0912-5_2
BACC Author Team (2015). Second Asesment of Climate Change Impact for the Baltic Sea Basin. Book Series: Regional Climate Studies. Berlin: Springer.
Bradtke, K., Agnieszka, H., and Urbański, J. A. (2010). Spatial and interannual variations of seasonal sea surface temperature patterns in the Baltic Sea Sea surface temperature seasonality global climate change Baltic Sea. Oceanologia 52, 345–362. doi: 10.5697/oc.52-3.345
Dailidienë, I., Baudler, H., Chubarenko, B., and Navrotskaya, S. (2011). Long term water level and surface temperature changes in the lagoons of the southern and eastern Baltic. Oceanologia 53, 293–308. doi: 10.5697/OC.53-1-TI.293
Elken, J., Raudsepp, U., Laanemets, J., Passenko, J., Maljutenko, I., Pärn, O., et al. (2014). Increased frequency of wintertime stratification collapse events in the Gulf of Finland since the 1990s. J. Mar. Syst. 129, 47–55. doi: 10.1016/j.jmarsys.2013.04.015
Feistel, R., Hagen, E., and Nausch, G. (2006). Unusual Baltic inflow activity in 2002–2003 and varying deep-water properties. Oceanologia 48, 21–35.
Fischer, H., and Matthäus, W. (1996). The importance of the Drogden Sill in the sound for major Baltic inflows. J. Mar. Syst. 9, 137–157. doi: 10.1016/S0924-7963(96)00046-2
Fonselius, S., and Valderrama, J. (2003). One hundred years of hydrographic measurements in the Baltic Sea. J. Sea Res. 49, 229–241. doi: 10.1016/S1385-1101(03)00035-2
Gildor, H., and Naik, N. H. (2005). Evaluating the effect of interannual variations of surface chlorophyll on upper ocean temperature. J. Geophys. Res 110:7012. doi: 10.1029/2004JC002779
Girjatowicz, J. P., and Świątek, M. (2016). Salinity variations of the surface water at the southern coast of the Baltic Sea in years 1950–2010. Cont. Shelf Res. 126, 110–118. doi: 10.1016/J.CSR.2016.08.005
Gouretski, V. (2018). World Ocean circulation experiment-argo global hydrographic climatology. Ocean Sci. 14, 1127–1146. doi: 10.5194/os-14-1127-2018
Haavisto, N., Tuomi, L., Roiha, P., Siiriä, S.-M., Alenius, P., and Purokoski, T. (2018). Argo floats as a novel part of the monitoring the hydrography of the Bothnian Sea. Front. Mar. Sci. 5:324. doi: 10.3389/fmars.2018.00324
Hietala, R., Lundberg, P., and Nilsson, J. A. U. (2007). A note on the deep-water inflow to the Bothnian Sea. J. Mar. Syst. 68, 255–264. doi: 10.1016/J.JMARSYS.2006.12.004
Høyer, J. L., and Karagali, I. (2016). Sea surface temperature climate data record for the North Sea and Baltic Sea. J. Clim. 29, 2529–2541. doi: 10.1175/JCLI-D-15-0663.1
Janssen, F., Schrum, C., and Backhaus, J. O. (1999). A climatological data set of temperature and salinity for the Baltic Sea and the North Sea. Dtsch. Hydrogr. Zeitschrift 51:5. doi: 10.1007/BF02933676
Johansson, J. (2018). Total and Regional Runoff to the Baltic Sea - HELCOM. HELCOM Baltic Sea Environment Fact Sheets. Available at: http://www.helcom.fi/baltic-sea-trends/environment-fact-sheets/hydrography/total-and-regional-runoff-to-the-baltic-sea/ (accessed November 15, 2018).
Jones, P. D., Jonsson, T., and Wheeler, D. (1997). Extension to the North Atlantic oscillation using early instrumental pressure observations from Gibraltar and south-west Iceland. Int. J. Climatol. 17, 1433–1450. doi: 10.1002/(SICI)1097-0088(19971115)17:13<1433::AID-JOC203<3.0.CO;2-P
Kahru, M., Elmgren, R., and Savchuk, O. P. (2016). Changing seasonality of the Baltic Sea. Biogeosciences 13, 1009–1018. doi: 10.5194/bg-13-1009-2016
Kao, H.-Y., Lagerloef, G., Lee, T., Melnichenko, O., Meissner, T., Hacker, P., et al. (2018). Assessment of aquarius sea surface salinity. Remote Sens. 10:1341. doi: 10.3390/rs10091341
Keevallik, S. (2011). Shifts in meteorological regime of the late winter and early spring in Estonia during recent decades. Theor. Appl. Climatol. 105, 209–215. doi: 10.1007/s00704-010-0356-x
Kniebusch, M., Meier, H. E. M., Neumann, T., and Börgel, F. (2019). Temperature variability of the Baltic Sea since 1850 and attribution to atmospheric forcing variables. J. Geophys. Res. Ocean. 2018:JC013948. doi: 10.1029/2018JC013948
Laakso, L., Mikkonen, S., Drebs, A., Karjalainen, A., Pirinen, P., and Alenius, P. (2018). 100 years of atmospheric and marine observations at the Finnish Utö Island in the Baltic Sea. Ocean Sci. 14, 617–632. doi: 10.5194/os-14-617-2018
Large, W. G., Yeager, S. G., Large, W. G., and Yeager, S. G. (2012). On the observed trends and changes in global sea surface temperature and air–sea heat fluxes (1984–2006). J. Clim. 25, 6123–6135. doi: 10.1175/JCLI-D-11-00148.1
Lass, H. U., Prandke, H., and Liljebladh, B. (2003). Dissipation in the Baltic proper during winter stratification. J. Geophys. Res. 108:3187. doi: 10.1029/2002JC001401
Lehmann, A., Getzlaff, K., and Harlaß, J. (2011). Detailed assessment of climate variability in the Baltic Sea area for the period 1958 to 2009. Clim. Res. 46, 185–196. doi: 10.3354/cr00876
Lehmann, A., Krauss, W., and Hinrichsen, H.-H. (2002). Effects of remote and local atmospheric forcing on circulation and upwelling in the Baltic Sea. Tellus A Dyn. Meteorol. Oceanogr. 54, 299–316. doi: 10.3402/tellusa.v54i3.12138
Lehmann, A., and Post, P. (2015). Variability of atmospheric circulation patterns associated with large volume changes of the Baltic Sea. Adv. Sci. Res. 12, 219–225. doi: 10.5194/asr-12-219-2015
Leppäranta, M., and Myrberg, K. (eds) (2009). “Topography and hydrography of the Baltic Sea,” in Physical Oceanography of the Baltic Sea (Berlin: Springer), 41–88. doi: 10.1007/978-3-540-79703-6_3
Levitus, S., Antonov, J. I., Boyer, T. P., Baranova, O. K., Garcia, H. E., Locarnini, R. A., et al. (2012). World ocean heat content and thermosteric sea level change (0-2000 m), 1955-2010. Geophys. Res. Lett. 39:L10603. doi: 10.1029/2012GL051106
Liblik, T., Laanemets, J., Raudsepp, U., Elken, J., and Suhhova, I. (2013). Estuarine circulation reversals and related rapid changes in winter near-bottom oxygen conditions in the Gulf of Finland, Baltic Sea. Ocean Sci. 9, 917–930. doi: 10.5194/os-9-917-2013
Liblik, T., and Lips, U. (2011). Characteristics and variability of the vertical thermohaline structure in the Gulf of Finland in summer. Boreal Environ. Res. 16, 73–83.
Liblik, T., and Lips, U. (2017). Variability of pycnoclines in a three-layer, large estuary: the Gulf of Finland. Boreal Environ. Res. 22, 27–47.
Liblik, T., Naumann, M., Alenius, P., Hansson, M., Lips, U., Nausch, G., et al. (2018). Propagation of impact of the recent major baltic inflows from the Eastern Gotland Basin to the Gulf of Finland. Front. Mar. Sci. 5:222. doi: 10.3389/fmars.2018.00222
Lin, P., Liu, H., and Zhang, X. (2007). Sensitivity of the upper ocean temperature and circulation in the equatorial Pacific to solar radiation penetration due to phytoplankton. Adv. Atmos. Sci. 24, 765–780. doi: 10.1007/s00376-007-0765-7
Lips, I., Lips, U., and Liblik, T. (2009). Consequences of coastal upwelling events on physical and chemical patterns in the central Gulf of Finland (Baltic Sea). Cont. Shelf Res. 29, 1836–1847. doi: 10.1016/j.csr.2009.06.010
Lips, U., Kikas, V., Liblik, T., and Lips, I. (2016). Multi-sensor in situ observations to resolve the sub-mesoscale features in the stratified Gulf of Finland. Baltic Sea Ocean Sci. 12, 715–732. doi: 10.5194/os-12-715-2016
Lips, U., Laanemets, J., Lips, I., Liblik, T., Suhhova, I., and Suursaar, Ü (2017). Wind-driven residual circulation and related oxygen and nutrient dynamics in the Gulf of Finland (Baltic Sea) in winter. Estuar. Coast. Shelf Sci. 195, 4–15. doi: 10.1016/J.ECSS.2016.10.006
Löptien, U., and Meier, H. E. M. (2011). The influence of increasing water turbidity on the sea surface temperature in the Baltic Sea: a model sensitivity study. J. Mar. Syst. 88, 323–331. doi: 10.1016/J.JMARSYS.2011.06.001
Meier, H. E. (2007). Modeling the pathways and ages of inflowing salt- and freshwater in the Baltic Sea. Estuar. Coast. Shelf Sci. 74, 610–627. doi: 10.1016/J.ECSS.2007.05.019
Meier, H. E. M., and Kauker, F. (2003). Modeling decadal variability of the Baltic Sea: 2. Role of freshwater inflow and large-scale atmospheric circulation for salinity. J. Geophys. Res. 108:3368. doi: 10.1029/2003JC001799
Mohrholz, V. (2018). Major baltic inflow statistics – revised. Front. Mar. Sci. 5:384. doi: 10.3389/fmars.2018.00384
Mohrholz, V., Dutz, J., and Kraus, G. (2006). The impact of exceptionally warm summer inflow events on the environmental conditions in the Bornholm Basin. J. Mar. Syst. 60, 285–301. doi: 10.1016/j.jmarsys.2005.10.002
Mohrholz, V., Naumann, M., Nausch, G., Krüger, S., and Gräwe, U. (2015). Fresh oxygen for the Baltic Sea - an exceptional saline inflow after a decade of stagnation. J. Mar. Syst. 148, 152–166. doi: 10.1016/j.jmarsys.2015.03.005
Morel, A., Antoine, D., Morel, A., and Antoine, D. (1994). Heating rate within the upper ocean in relation to its bio–optical state. J. Phys. Oceanogr. 24, 1652–1665. doi: 10.1175/1520-04851994024<1652:HRWTUO<2.0.CO;2
Myrberg, K., and Andrejev, O. (2006). Modelling of the circulation, water exchange and water age properties of the Gulf of Bothnia mean circulation water age water exchange. Oceanologia 48, 55–74.
Pastor, F., Valiente, J. A., and Palau, J. L. (2018). Sea surface temperature in the Mediterranean: trends and spatial patterns (1982–2016). Pure Appl. Geophys. 175, 4017–4029. doi: 10.1007/s00024-017-1739-z
Raateoja, M. (2013). Deep-water oxygen conditions in the Bothnian sea. Boreal Environ. Res. 18, 235–249. doi: 10.1007/s13280-015-0675-3
Rak, D. (2016). The inflow in the Baltic proper as recorded in January–February 2015. Oceanologia 58, 241–247. doi: 10.1016/J.OCEANO.2016.04.001
Reissmann, J. H., Burchard, H., Feistel, R., Hagen, E., Lass, H. U., Mohrholz, V., et al. (2009). Vertical mixing in the Baltic Sea and consequences for eutrophication - a review. Prog. Oceanogr. 82, 47–80. doi: 10.1016/j.pocean.2007.10.004
Shaltout, M., and Omstedt, A. (2014). Recent sea surface temperature trends and future scenarios for the Mediterranean Sea. Oceanologia 56, 411–443. doi: 10.5697/OC.56-3.411
Skudra, M., and Lips, U. (2017). Characteristics and inter-annual changes in temperature, salinity and density distribution in the Gulf of Riga. Oceanologia 59, 37–48. doi: 10.1016/J.OCEANO.2016.07.001
Stepanova, N. B., Chubarenko, I. P., and Shchuka, S. A. (2015). Structure and evolution of the cold intermediate layer in the southeastern part of the Baltic Sea by the field measurement data of 2004–2008. Oceanology 55, 25–35. doi: 10.1134/S0001437015010154
Stock, A. (2015). Satellite mapping of Baltic Sea Secchi depth with multiple regression models. Int. J. Appl. Earth Obs. Geoinf. 40, 55–64. doi: 10.1016/j.jag.2015.04.002
Stramska, M., and Białogrodzka, J. (2015). Spatial and temporal variability of sea surface temperature in the Baltic Sea based on 32-years (1982–2013) of satellite data. Oceanologia 57, 223–235. doi: 10.1016/J.OCEANO.2015.04.004
Suhhova, I., Liblik, T., Lilover, M.-J., and Lips, U. (2018). A descriptive analysis of the linkage between the vertical stratification and current oscillations in the Gulf of Finland. Boreal Environ. Res. 23, 83–103.
Tronin, A. (2017). The satellite-measured sea surface temperature change in the Gulf of Finland. Int. J. Remote Sens. 38, 1541–1550. doi: 10.1080/01431161.2017.1286057
Tuomi, L., Kahma, K. K., and Pettersson, H. (2010). Wave hindcast statistics in the seasonally ice-covered Baltic sea. Boreal Environ. Res. 16,451–472.
Väli, G., Meier, H. E. M., and Elken, J. (2013). Simulated halocline variability in the Baltic Sea and its impact on hypoxia during 1961-2007. J. Geophys. Res. Ocean 118, 6982–7000. doi: 10.1002/2013JC009192
Vankevich, R. E., Sofina, E. V., Eremina, T. E., Ryabchenko, V. A., Molchanov, M. S., and Isaev, A. V. (2016). Effects of lateral processes on the seasonal water stratification of the Gulf of Finland: 3-D NEMO-based model study. Ocean Sci. 12, 987–1001. doi: 10.5194/os-12-987-2016
Vuorinen, I., Hänninen, J., Rajasilta, M., Laine, P., Eklund, J., Montesino-Pouzols, F., et al. (2015). Scenario simulations of future salinity and ecological consequences in the Baltic Sea and adjacent North Sea areas–implications for environmental monitoring. Ecol. Indic. 50, 196–205. doi: 10.1016/J.ECOLIND.2014.10.019
Winsor, P., Rodhe, J., and Omstedt, A. (2001). Baltic Sea ocean climate: an analysis of 100 yr of hydrographic data with focus on the freshwater budget. Clim. Res. 18, 5–15. doi: 10.3354/cr018005
Ylöstalo, P., Seppälä, J., Kaitala, S., Maunula, P., and Simis, S. (2016). Loadings of dissolved organic matter and nutrients from the Neva River into the Gulf of Finland – biogeochemical composition and spatial distribution within the salinity gradient. Mar. Chem. 186, 58–71. doi: 10.1016/J.MARCHEM.2016.07.004
Keywords: Baltic Sea, salinity, heat content, stratification, climate change
Citation: Liblik T and Lips U (2019) Stratification Has Strengthened in the Baltic Sea – An Analysis of 35 Years of Observational Data. Front. Earth Sci. 7:174. doi: 10.3389/feart.2019.00174
Received: 04 December 2018; Accepted: 19 June 2019;
Published: 02 July 2019.
Edited by:
Markus Meier, Leibniz Institute for Baltic Sea Research (LG), GermanyReviewed by:
Peter Sigray, KTH Royal Institute of Technology, SwedenFrank Janssen, Federal Maritime and Hydrographic Agency, Germany
Andreas Lehmann, GEOMAR Helmholtz Center for Ocean Research Kiel, Germany
Copyright © 2019 Liblik and Lips. This is an open-access article distributed under the terms of the Creative Commons Attribution License (CC BY). The use, distribution or reproduction in other forums is permitted, provided the original author(s) and the copyright owner(s) are credited and that the original publication in this journal is cited, in accordance with accepted academic practice. No use, distribution or reproduction is permitted which does not comply with these terms.
*Correspondence: Taavi Liblik, taavi.liblik@taltech.ee