 Tjarda Roberts
 Guillaume Dayma
 Clive Oppenheimer
95% of researchers rate our articles as excellent or good
Learn more about the work of our research integrity team to safeguard the quality of each article we publish.
Find out more
ORIGINAL RESEARCH article
Front. Earth Sci. , 03 July 2019
Sec. Volcanology
Volume 7 - 2019 | https://doi.org/10.3389/feart.2019.00154
This article is part of the Research Topic Recent Advances in Volcanic Gas Science View all 15 articles
When volcanic gases enter the atmosphere, they encounter a drastically different chemical and physical environment, triggering a range of rapid processes including photochemistry, oxidation, and aerosol formation. These processes are critical to understanding the reactivity and evolution of volcanic emissions in the atmosphere yet are typically challenging to observe directly due to the nature of volcanic activity. Inferences are instead drawn largely from observations of volcanic plumes as they drift across a crater’s edge and further downwind, and the application of thermodynamic models that neglect reaction kinetics as gas and air mix and thermally equilibrate. Here, we foreground chemical kinetics in simulating this critical zone. Volcanic gases are injected into a chain-of-reactors model that simulates time-resolved high-temperature chemistry in the dispersing plume. Boundary conditions of decreasing temperature and increasing proportion of air interacting with volcanic gases are specified with time according to an offline plume dynamics model. In contrast to equilibrium calculations, our chemical kinetics model predicts that CO is only partially oxidized, consistent with observed CO in volcanic plumes downwind from source. Formation of sulfate precursor SO3 at SO3/SO2 = 10-3 mol/mol is consistent with the range of reported sulfate aerosol to SO2 ratios observed close to crater rims. High temperature chemistry also forms oxidants OH, HO2, and H2O2. The H2O2 will likely augment volcanic sulfate yields by reacting with SO2(aq) in the cooled-condensed plume. Calculations show that high-temperature OH will react with volcanic halogen halides (HBr and HCl) to yield reactive halogens (Br and Cl) in the young plume. Strikingly, high-temperature production of radical oxidants (including HOx) is enhanced by volcanic emissions of reduced gases (CO, H2, and H2S) due to chemical feedback mechanisms, although the kinetics of some reactions are uncertain, especially regarding sulfur. Our findings argue strongly that the chemistry of the hot near-source plume cannot be captured by equilibrium model assumptions, and highlight the need for development of more sophisticated, kinetics-based, high-temperature CHONS-halogen reaction models.
Volcanoes release gases and aerosols to the atmosphere through both quiescent (passive) degassing, and effusive and explosive eruptions. Volcanic emissions of SO2 to the stratosphere are well known to impact climate through the atmospheric oxidation of SO2 to form radiatively active sulfate aerosol particles. In fact, volcanoes release a wide range of highly reactive gases that can impact atmospheric composition and climate. Volcanic bromine and chlorine emissions undergo plume atmospheric chemistry that can destroy both tropospheric and stratospheric ozone. In descending order of typical abundance (which varies with volcano setting, magma redox conditions, and eruptive style) volcanic gas emissions consist of: H2O, CO2, SO2, HCl, HF, H2S, OCS, CO, and HBr, as well as other trace species e.g., metals. Observations of volcanic plumes identify several additional species (e.g., NO, NO2, HNO3, BrO, OClO, SO42-, HO2NO2, and H2O2), (Allen et al., 2000; Mather et al., 2004b; Bobrowski et al., 2007; Oppenheimer et al., 2010; Carn et al., 2011; Martin et al., 2012; Kern and Lyons, 2018). These species are formed by oxidizing chemical reactions as the magmatic gases mix with air, first at high temperatures near to the source and then at low temperatures as the cooled plume disperses further into the background atmosphere. Numerical models of low-temperature atmospheric chemistry of the plume have been developed (e.g., Bobrowski et al., 2007; Roberts et al., 2009; von Glasow, 2010; Jourdain et al., 2016) that are able to reproduce some – but not all – of these observed oxidized species. This points to an important role of high-temperature chemistry. Current approaches apply thermodynamic equilibrium models to represent the high-temperature chemistry of the near-source plume (e.g., Gerlach, 2004; Martin et al., 2006). However, thermodynamic equilibrium calculations may be misleading if the chemistry is limited by kinetics (rates of reactions) in the rapidly cooling volcanic gas and air mixture within seconds of emission. Here, a chemical kinetics approach is developed to simulate the time-varying chemical processing of C-H-O-S gases in the hot near-source plume on its release and mixing with background air.
Observational evidence for the high-temperature production of oxidants in volcanic plumes includes SOxy, HOxy, NOxy, and rapid formation of reactive halogens. Sulfate-rich aerosols have been observed at the crater-rim or in very near-downwind plumes of many volcanoes (exception: volcanic domes), Table 1. Sulfate is reported relative to co-measured SO2 which serves as a convenient yet only approximate plume tracer, allowing observations to be normalized for dilution effects. The sulfate:SO2 ratios typically range from 0.00002 up to around 0.01 mol/mol, Table 1 and references therein. Many of the ratios are too high to be explained by atmospheric oxidation of SO2 at low-temperatures on the plume transport timescale of seconds to minutes (e.g., Galeazzo et al., 2018). Instead, the observations indicate a sulfate-rich aerosol formed very close to source. One hypothesized pathway to its formation is high-temperature oxidation of a small fraction of SO2 in the near-source plume to produce sulfate precursor SO3 (Allen et al., 2000). For volcanic domes, sulfate formation may be enhanced by circulation of air inside the dome (Zelenski et al., 2015). The range in observed SO42-:SO2 indicates variability in the near-source sulfate formation processes at different volcanoes, as well as possibly some measurement uncertainty. In all cases sulfate contributes a minor fraction to the total sulfur emission that is typically dominated by SO2 and H2S (the proportion depending strongly on magma redox conditions; Oppenheimer et al., 2014). Nevertheless, at source (or so-called “primary”) volcanic sulfate is critical to plume processes such as multi-phase halogen reactions (discussed further below) and acts as a condensational sink that can inhibit new particle formation (Sahyoun et al., 2019).
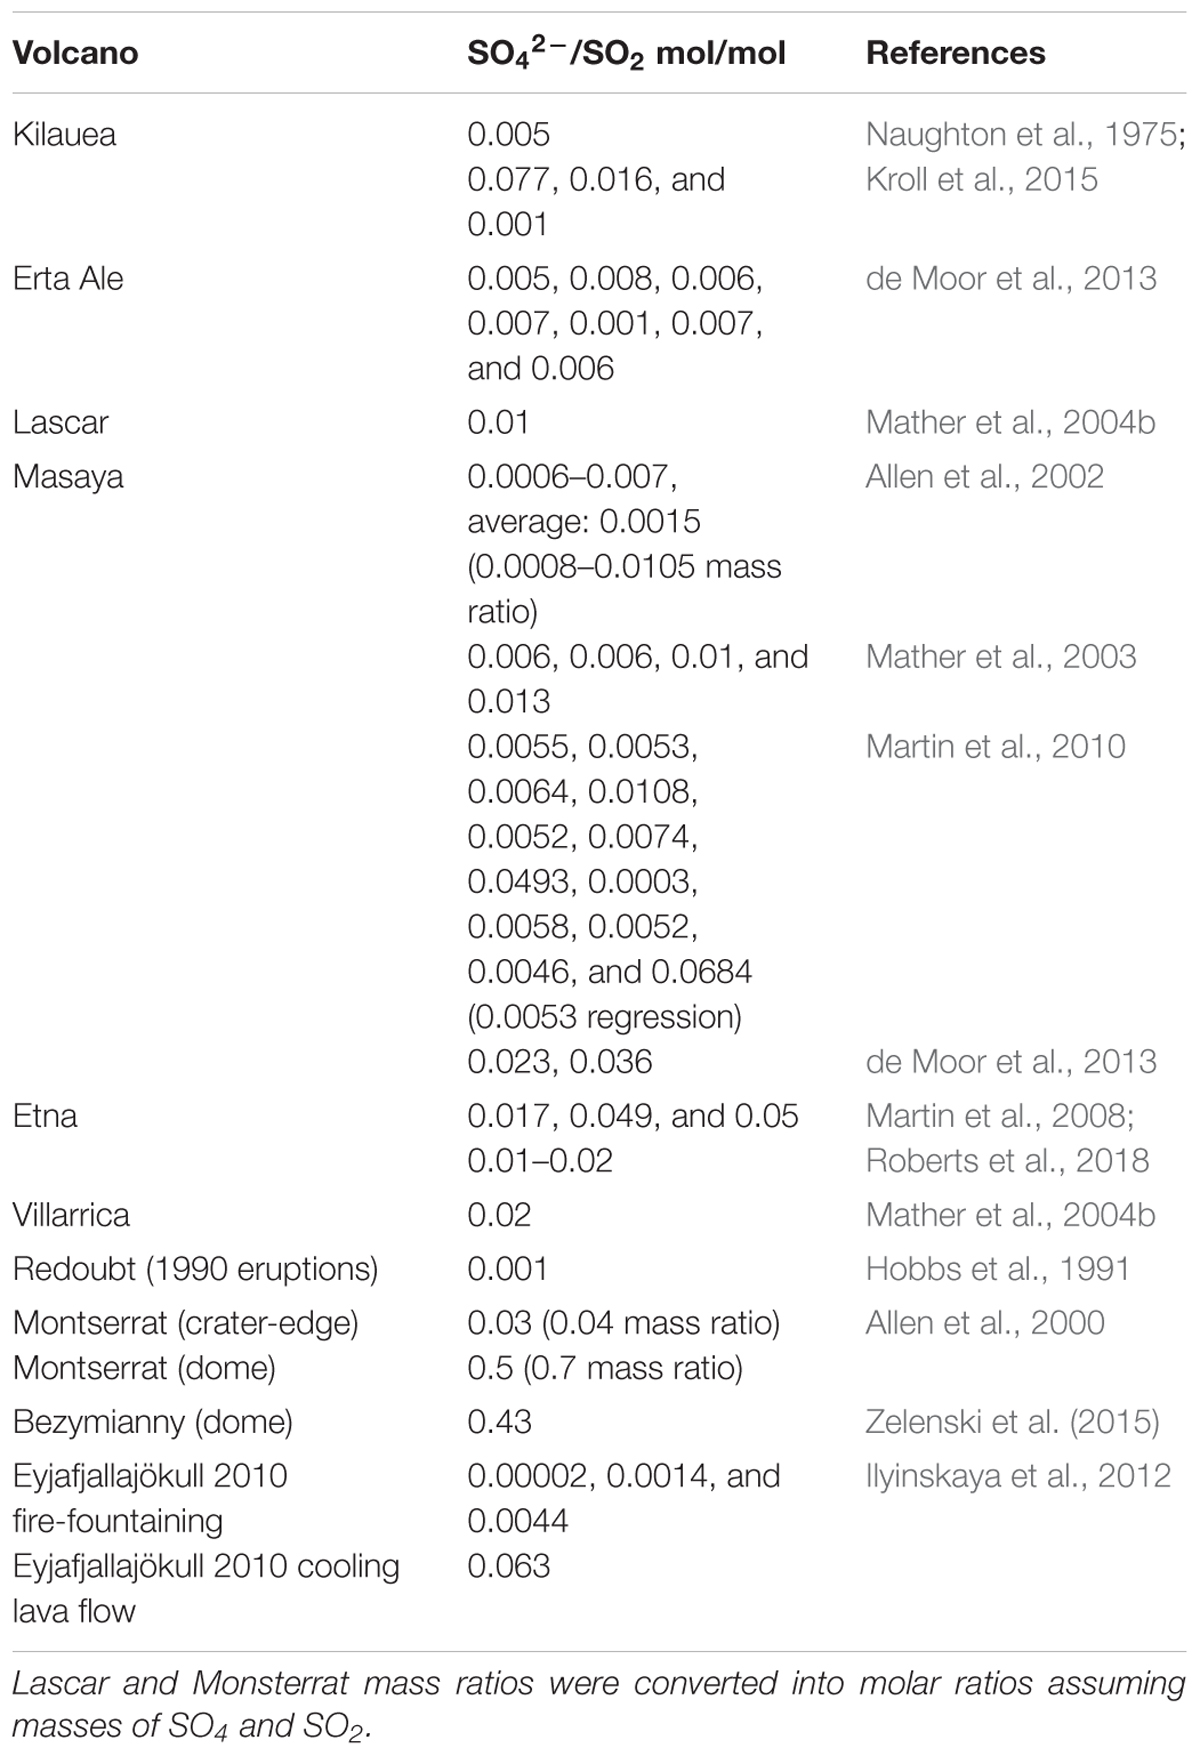
Table 1. Observational evidence for at-source sulfate aerosol in volcanic plumes.
There exist few measurements of volcanic HOxy. Carn et al. (2011) report in-cloud processing of SO2 from the Huila volcanic plume by H2O2, with plume H2O2 abundance elevated above background by about 0.5 ppbv. This volcanic H2O2 might have originated from the self-reaction of volcanic HO2. Oppenheimer et al. (2010) measured elevated HO2NO2 in the (cooled and dilute) Mt Erebus plume where the cold Antarctic atmosphere likely contributed to its thermal stability. HO2NO2 is formed by the reaction of HO2 with NO2 therefore its presence provides evidence for volcanogenic sources of both HOx and NOx. Volcanogenic HOx has also been observed by a chance encounter of an instrumented aircraft with the Hekla 2000 eruption plume in the lower stratosphere (Rose et al., 2006). Observations showed OH and HO2 were elevated at up to 0.5 and 15 pptv above background in 33–34 h aged volcanic cloud during night. These measurements have eluded any explanation given the lack of photochemistry, a cooled plume, and anticipated fast HOx destruction by reaction with volcanic SO2 and halogens (both in excess abundances). In general, the reported elevated abundances of HOxy in volcanic plumes compared to the background atmosphere are surprising because low-temperature volcanic plume chemistry is expected to deplete HOxy (Galeazzo et al., 2018). Volcanic HOxy may originate from high-temperature chemistry of the near-source plume.
Elevated concentrations of NO, NO2, and HNO3 have been measured in several volcanic plumes in the troposphere in addition to the HO2NO2 observed in the Mt Erebus plume: a review is given by Martin et al. (2012) and references therein, reporting a typical molar ratio for NOy/H2O of 10-5. Whilst filter pack sampling identified HNO3 in crater-rim plumes from several volcanoes (e.g., Mather et al., 2004a), on other occasions there was no evidence for HNO3, even at the same volcano (e.g., Martin et al., 2010). This may point to variability in emissions-processing or reliability of measurement technique. Nevertheless, real-time aircraft-based measurements by Atmospheric Chemical Ionization Mass Spectrometer confirm volcanic HNO3 in plumes downwind from Mt Etna at HNO3/SO2 = 0.02 (Voigt et al., 2014), and in the Mt Erebus plume (Oppenheimer et al., 2010). Sources of volcanic NOxy are uncertain. Martin et al. (2012) present a kinetic model of CHON chemistry that demonstrates high-temperature formation of thermal NOx is too slow to occur in the near-source plume that rapidly disperses and cools over seconds-minutes. Volcanic lightning is a likely source of NOx in clouds from explosive eruptions. It has also been hypothesized that NOx may sometimes be formed by oxidation of ammonia, for example in the stratospheric cloud from the Hekla 2000 eruption (Rose et al., 2006).
The need to characterize high-temperature chemistry in the near-source plume is underlined by model studies of volcanic halogen transformations in the plume (Bobrowski et al., 2007; von Glasow, 2010; Roberts et al., 2014). Halogens are emitted as hydrogen halides (HBr and HCl) from volcanoes but are transformed into reactive halogens (BrO and OClO) in the tropospheric plume via a multi-phase autocatalytic “bromine-explosion” chemistry occurring at low-temperatures. However, numerical models of the plume atmospheric halogen chemistry can only reproduce the observed magnitude and rate of formation of BrO if the volcanic emission is modified to include radicals believed to form at high-temperatures in the near-source plume (the so-called “effective source region”). Radicals such as OH (that react with HBr, HCl to produce Br, and Cl) provide an initial source of reactive bromine to initiate the low-temperature bromine explosion cycles. Furthermore, high-temperature production of sulfate-precursor SO3 generates near-source (so-called “primary”) sulfate aerosols that promote heterogeneous reactions that drive the bromine explosion chemistry. Observations of BrO (and occasionally OClO) in tropospheric volcanic plumes globally (e.g., Bobrowski et al., 2007; Boichu et al., 2011; Hörmann et al., 2013; Donovan et al., 2014; Kern and Lyons, 2018) indicate pervasive emissions of volcanic halogens to the troposphere accompanied by both high- and low-temperature chemistry in volcanic plumes.
The high-temperature region of the plume also facilitates gas-ash interactions including adsorption of gases such as SO2 and HCl onto ash particles that may then fall-out (Delmelle et al., 2018 and references therein). High-temperature SO3 is a precursor to sulfate that can condense as the eruption column cools and could change ash properties (e.g., Hoshyaripour et al., 2015) and ash-related atmospheric impacts e.g., regarding plume lightning or ice nuclei. Whilst such heterogeneous interactions are outside the scope of our study, quantifying the high-temperature oxidizing chemistry occurring in the gas-phase as volcanic gases mix with air is a fundamental first-step to characterising the near-source plume composition and its possible influence on gas-ash interactions.
Thermodynamic models such as HSC have been applied to calculate the equilibrium compositions of mixtures of magmatic gases with air, and HSC output has been used in numerical model studies of the plume atmospheric chemistry and impacts (e.g., Gerlach, 2004; Martin et al., 2006, 2007, 2009, 2011; Aiuppa et al., 2007; Bobrowski et al., 2007, 2015; Roberts et al., 2009, 2014, 2018; von Glasow, 2010; Martin and Ilyinskaya, 2011; Hoshyaripour et al., 2012; Ilyinskaya et al., 2012; Surl et al., 2015; Jourdain et al., 2016). HSC is used to calculate the composition of the near-source plume for temperatures above 600°C according to Gibbs free energy minimization. The emission is released at magmatic temperatures and as the magmatic gases entrain air, the mixture cools toward background temperature. The calculation assumes thermodynamic equilibrium composition is reached at a specified temperature and degree of mixing of air with magmatic gases (often expressed as a volumetric or molar ratio, VA:VM where VA is air volume and VM is magmatic gas volume). Plume composition is then assumed to be “quenched” with respect to high-temperature chemistry upon further mixing with air. Choice of the VA:VM “quenching-point” for the HSC calculation is rather uncertain and may vary with eruption/emission type. For studies of passively degassing volcanoes it was found that a high VA:VM = 40:60 (Bobrowski et al., 2007) yielded extremely high SO3 relative to SO2 (much greater than observed sulfate/SO2 ratios, see Table 1), therefore more recent studies chose lower VA:VM = 10:90 or 5:95 (e.g., Roberts et al., 2014) as the point where high-temperature chemistry is quenched. Conceivably, large eruptions might sustain high-temperature conditions over longer periods allowing the chemistry to reach equilibrium conditions at higher VA:VM. Hoshyaripour et al. (2012) simulated the high-temperature chemistry in an eruption column by co-varying VA:VM from 0 to 1 with temperature decreasing from 1273 K to 873 K (1000°C to 600°C), predicting that the eruption column acts as a hot oxidizing reactor for S species.
In general, volcanic plume applications of thermodynamic equilibrium models such as HSC yield elevated abundances of SOx (dominated by SO3), HOx (dominated by OH) and NOx (dominated by NO), and halogen radicals Br, Cl (e.g., Martin et al., 2006). The relative abundances of these oxidized products increase with increasing VA:VM. The equilibrium models also predict near-complete oxidation of reduced gases emitted from volcanoes (e.g., CO, H2S, and H2), yet these gas species are often detected at the crater-rim or in downwind (cooled) plumes (e.g., Aiuppa et al., 2005; Schumann et al., 2011; Moussallam et al., 2012; Roberts et al., 2012; de Moor et al., 2016). This suggests that some gas species may not always be under equilibrium control (Martin et al., 2009). Plume observations of reduced gases relative to major gases (e.g., CO/CO2, H2/H2O, and H2S/SO2) are used to infer emission properties such as temperature and oxidative state, but such inferences cannot hold true if there is substantial oxidation of the reduced gases following emission, as predicted by HSC. Here, a method is developed to evaluate how reaction rates control high-temperature chemistry of volcanic gases in air as a function of time-varying plume dynamics, Figure 1.
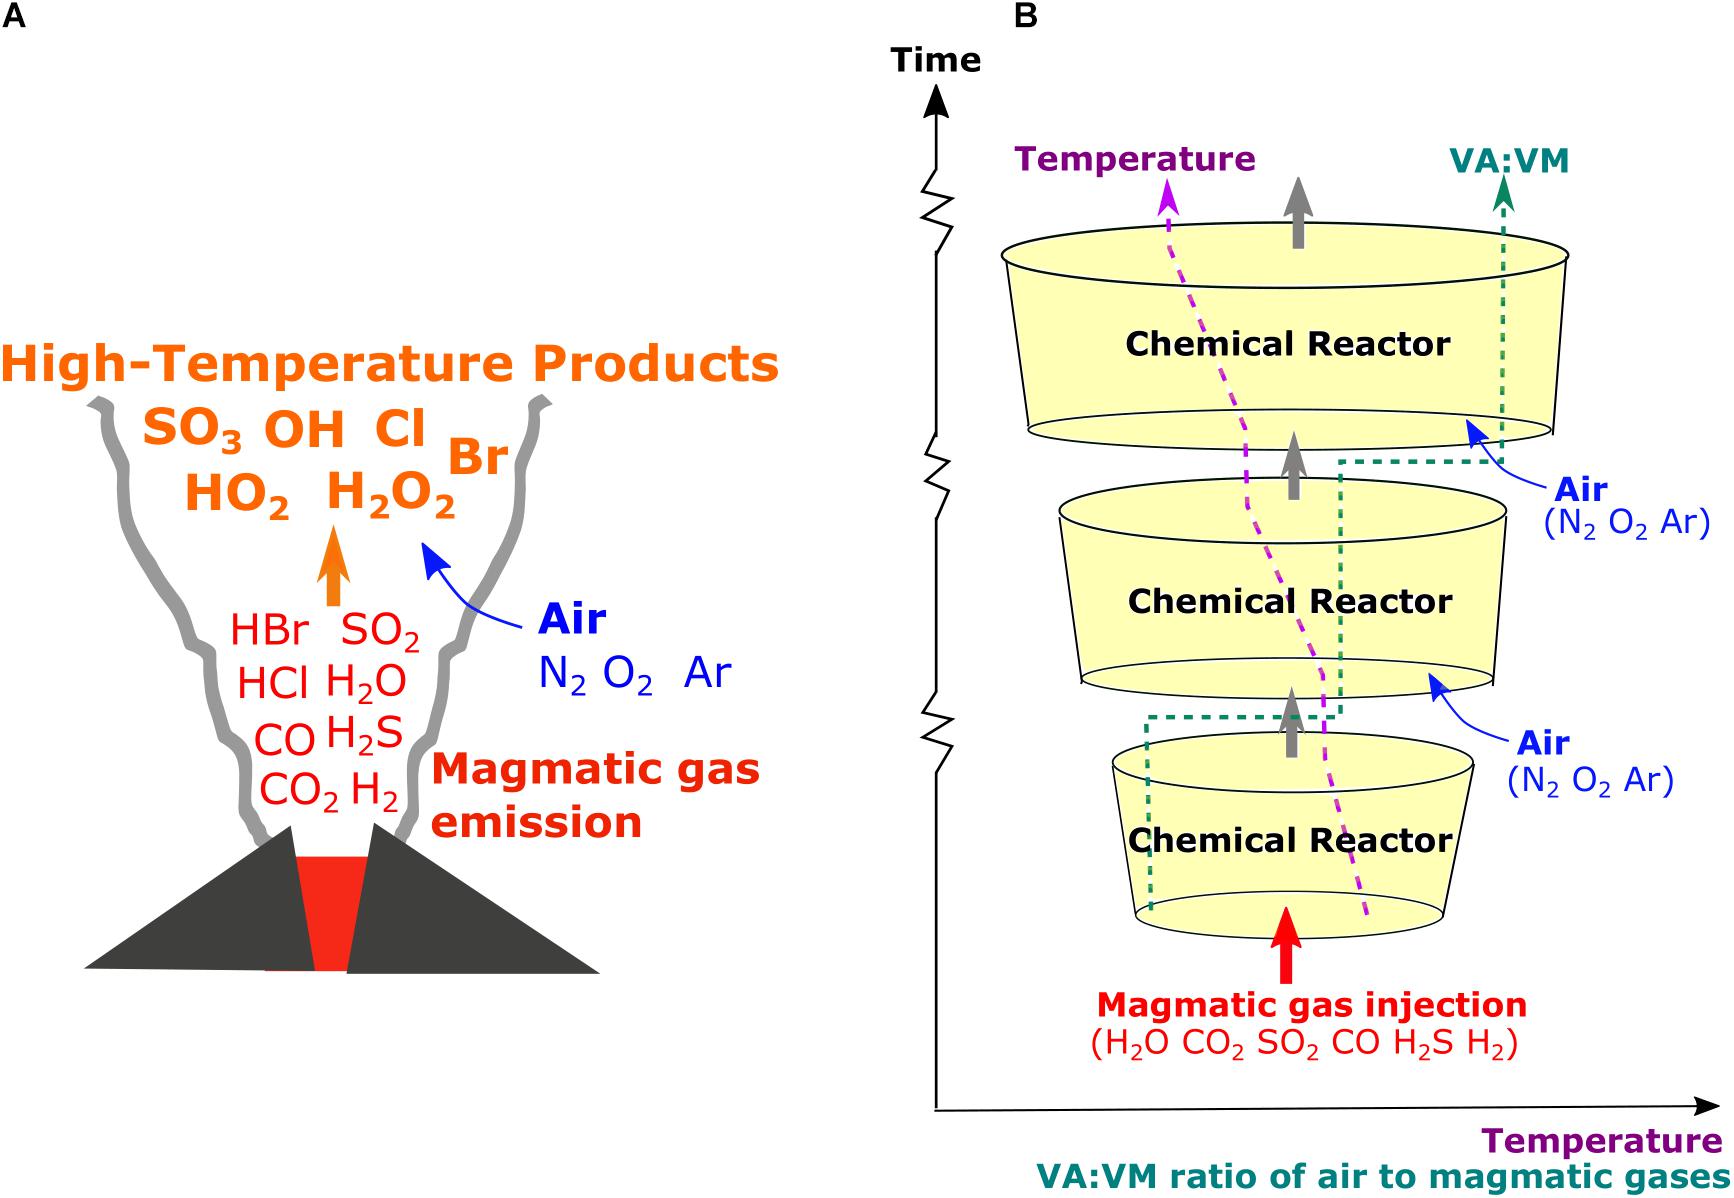
Figure 1. Schematics of (A) high-temperature plume chemistry that generates radicals and oxidized products in the plume and (B) our chain-of-reactors approach to simulate the processes based on chemical kinetics under time-varying temperature (T) and proportion of mixing of air with magmatic gases (VA:VM).
Our model uses a chemical kinetics rather than thermodynamics approach, and requires time-resolved boundary conditions in both temperature and degree of mixing of magmatic gases with air (VA:VM), as well as the composition of the volcanic gases emitted as model input. The temperature of the volcanic gas emission is uncertain. It is typically assumed to be identical to petrological magmatic estimates (600–1200°C), although analysis of gas compositions measured at Kilauea, Hawaii (Oppenheimer et al., 2018) and Mt Etna, Italy (Aiuppa et al., 2011) show that gases may cool prior to emission into the atmosphere. Introduction of surface waters may also cool the gas emission. Physical properties of the plume are poorly constrained for the few seconds following release from the eruptive vent (or other emission sources e.g., lava lake or dome), as there are few direct measurements or dedicated model studies. A study of gas-puffing dynamics at passively degassing volcano Masaya yielded estimates of mean dilutions of 0.09 and 0.24 between emission and detection by thermal radiometer about 5–10 m above the vent, for gas puffs with mean velocities 2.5 and 4.3 m/s (Branan et al., 2008).
One way to estimate temperature and VA:VM in the near-source plume can be through dynamical model simulations of plume rise (e.g., Mastin, 2007; Aubry et al., 2017). This study relies on one such eruptive case to supply physical boundary conditions: the PlumeRise model applied to the 2010 Eyjafjallajökull eruption plume (Woodhouse et al., 2013), for which observations of volcanic gases including CO/SO2 have also been reported both close to the source and far downwind (Allard et al., 2011; Schumann et al., 2011). This Eyjafjallajökull case forms the basis for an exploratory investigation into the chemical kinetics of gas-phase reactions occurring at high-temperatures in volcanic plumes.
Our approach to simulate high-temperature chemical reactions in the near-source plume includes three components: (i) the chemical kinetics model (chain-of-reactors), (ii) physical boundary conditions applied to the model, and (iii) the volcanic gas emissions injection as model input.
Chemkin is a fortran-based tool for incorporating complex chemical kinetics into model simulations of fluid dynamics (Kee et al., 2000 and related references from Reaction Design). Gas species and (reversible) reactions are first declared, as well as initial conditions (such as initial gas concentrations, temperature, pressure), and then the reactions are simulated in a plug-flow reactor (PFR) to evaluate temporal changes in gas composition.
Rates of progressions of reactions are quantified as the difference between the rate of the forward and reverse reactions, for example E1 for the reversible reaction A + B = C + D (where gases A, B, C, and D may also be involved in other reactions, each with its corresponding differential equation).
The rate constants for forward reactions, kf, are described in the form, E2, where R is the gas constant and T the gas temperature. The pre-exponential factor, A, the temperature exponent, β, and activation energy E, are specified in the mechanism file (see Glarborg and Marshall, 2013).
The reverse reaction rate constant, kr, is given by E3 where K is the equilibrium constant that is determined by thermodynamic properties (molar enthalpies and entropies as a function of temperature); these properties are specified in the thermodynamic data file (see Glarborg and Marshall, 2013).
The Chemkin model also accounts for third-body, unimolecular, chemically activated reactions, and pressure-dependencies of reaction rates. The resulting system of ordinary differential equations and initial conditions is solved by Chemkin to quantitatively predict how the gas composition in the chemical reactor evolves as a function of time according to the kinetics-based reaction scheme and the thermodynamic conditions.
The reaction mechanism applied within ChemKin is user-specified. There are very few studies at high-temperature dealing with sulfur species oxidation and their interactions with carbon, nitrogen oxides, or halogens. Here, the mechanism proposed by Glarborg and Marshall (2013) was selected for its good performance in comparison to laboratory shock-tube experiments, as recently highlighted by Mathieu et al. (2017). It includes 38 species involved in 161 reversible reactions. This reaction mechanism, and corresponding thermodynamic properties, relies on earlier works on sulfur chemistry and was updated to model the oxidation of carbonyl sulfide (OCS). A full list of gas species and chemical reactions is given in Supplementary Tables S1, S2. This version does not include halogens or NOx chemistry. The interactions between sulfur, carbon, halogens, and nitrogen oxides are beyond the scope of this work, but will need to be addressed in future. Also, all the species considered were in the gas-phase; heterogeneous reactions or photochemical reactions were not included. This is a clear limitation of the present study which should be seen as a preliminary step needed to account for time evolution of chemicals in a near-source plume. Whilst the chemical scheme is one of the most complete regarding sulfur compounds, there exist some uncertainties in the high-temperature reaction kinetics, in particular related to H2S (Mathieu et al., 2017). A single PFR simulates the high-temperature chemistry for given starting conditions in gas composition and temperature. A time-varying temperature can be introduced by applying a temperature gradient in the PFR and imposing an initial velocity of the reactor gases. However, air cannot be added as a function of time into a single reactor, i.e., the proportion of air to magmatic gases in the simulation is held constant according to the initial composition.
Therefore, a chain-of-reactors approach was developed using the Chemkin Pro software to simulate the chemical evolution of a near-source plume that simultaneously cools (decreasing T) and entrains air (increasing VA:VM) as it dilutes, Figure 1. Thirty PFRs were placed in a chain. A continuous decreasing trend in plume temperature was imposed across the chain by defining the start and end temperatures for each PFR according to our chosen boundary conditions (details in the next section). The starting composition for each reactor was defined by taking the output from the preceding one and diluting it with air (78% N2, 21% O2, 1% Ar) according to time-varying VA:VM boundary conditions. The pressure decrease was also considered even if it was not found to be significant. This alternate simulation of the plume chemistry (within reactor boxes) and mixing-dilution steps (between reactor boxes) is similar to the approach used in kinetics-based modeling of the low-temperature atmospheric chemistry of volcanic plumes e.g., PlumeChem (Roberts et al., 2009).
The chain-of-reactors model requires time-resolved boundary conditions for plume temperature and VA:VM as the emitted volcanic gases rapidly mix with air. Here, output from the 1D PlumeRise model is used. PlumeRise describes the ascent of a turbulent buoyant plume composed of solid pyroclasts, magmatic gases, and air and includes the effects of cross-wind on turbulent entrainment of air into the plume. The PlumeRise dynamics model approximates volcanic gases as entirely H2O (a more complex emission composition provides input to the chain-of-reactors model, see Section “Magmatic Gas Emissions” below).
Output from the PlumeRise model includes the plume temperature (T, in K), the total mass flux (Q in kg/s), the gas mass fraction (n), the vertical velocity, U (m/s), the mass fraction of water (liquid+gas) in the plume (φ), specific humidity (C), and altitude (z in m), each provided at a resolution (dz) of a few meters. These variables can be used to derive temperature and VA:VM as a function of time. The time, in seconds is given by E4, and integrating dt.
The plume total mass (gases and solids), M in kg, in the discrete volume at each time-step is given by E5.
The mass of all gases (volcanic H2O and air) in the plume, M(g) is the product of M and the gas mass fraction, n, E6.
Under high temperature plume conditions, all H2O in the plume is in gaseous form, whose mass M(w) is the product of M and φ, E7.
The mass of dry air in the plume, M(da) is the difference between M(g) and M(w), E8. The mass of background water in the plume, M(bw) is the product of M(da) with the specific humidity, C, E9. The mass of volcanic gases (here: entirely as H2O), M(vg), is the difference between M(w) and M(bw), E10.
The masses M(vg), M(da), and M(bw) in kg are converted into moles of volcanic gases, dry air, and background water, m(vg), m(da), m(bw), by dividing by their respective molecular weights (18 × 10-3 for H2O and 29 × 10-3 for dry air containing N2, O2, and Ar, expressed as kg/mol), E11,12,13. The total moles of entrained wet air, m(air), is calculated by the sum of m(da) and m(bw), E14.
Finally, the ratio VA:VM is the moles of wet air divided by moles of volcanic gases, E15.
The calculation yields VA:VM as a function of dz or time when performed for each row of output from the 1D plume dynamics model. Assumptions that water exists purely in the gas phase and that water content is dominated by the volcanic emission are valid for the hot and concentrated plume region investigated in this study. The resulting trend in temperature with VA:VM is consistent with simple specific-heat calculations for the magmatic-air-ash mixture. Plume temperature and VA:VM depend strongly on the T, n, U starting conditions used for the PlumeRise model.
Several PlumeRise 1D model results showing decreasing temperature and increasing VA:VM with time or distance from the source are shown in Supplementary Figure S1, for the Eyjafjallajökull eruption April 14–17, 2010. These are based on the model runs of Woodhouse et al. (2013) that used meteorological data from local balloon soundings1. The model input parameters are only partially constrained, but Woodhouse et al. (2013) found good predictive capability of the model to reproduce plume height for starting parameter ranges of temperature T = 600–1000 K, vertical velocity U = 50–100 m/s, gas mass fraction n = 0.030–0.086 (Woodhouse et al., 2013; Supplementary Table S3). Notably, the model runs are highly diverse in their starting temperatures and predicted VA:VM. The starting temperatures are all substantially lower than petrological estimates of the magmatic temperature, (Keiding and Sigmarsson, 2012) who reported 1443 K (1170 ± 25°C) for the early flank eruption, and 1273–1333 K (1000-1060°C) for benmoritic products related to the main summit eruption that are pertinent to this study. Reasons for this are unclear but could be due to decoupling of magmatic and gas temperatures or a cooling effect of incorporated water. The Introduction Section “High-Temperature Products in Volcanic Plumes: Observations and Modeling” highlighted considerable uncertainty in the physical conditions (temperature, VA:VM) of the near-source plume.
In this exploratory study we use output from the PlumeRise simulation with starting temperature at 1000 K as example boundary conditions in time-varying T and VA:VM as a basis for chemical kinetics modeling of the hot plume chemistry. This chosen PlumeRise dynamics scenario from Woodhouse et al. (2013) combined with magmatic gas emissions based on Allard et al. (2011; Table 2) yields an SO2 flux of 5.5 kt/hr SO2, that is consistent with the range of SO2 fluxes derived from satellite observations during the Eyjafjallajökull eruption (Boichu et al., 2013).
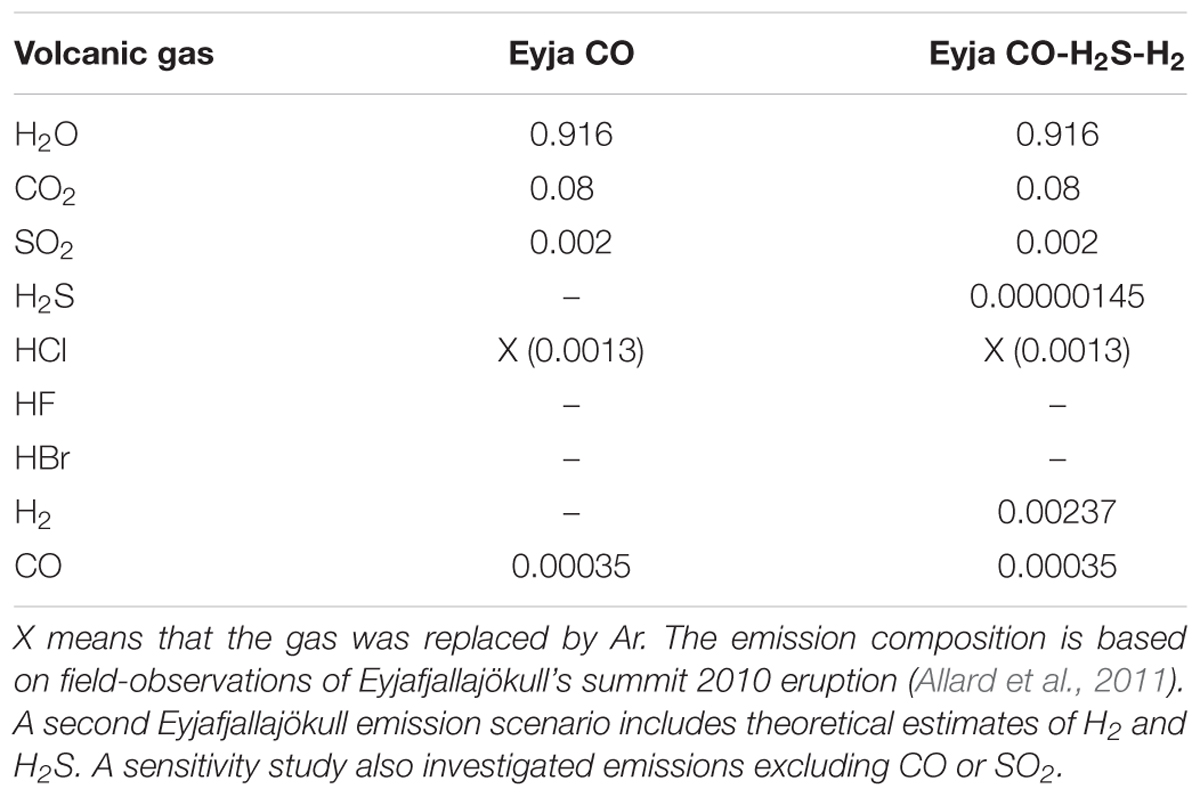
Table 2. Magmatic gas compositions (mole fraction) used as input to the chain-of-reactors model simulations.
A volcanic gas emission composition is input to the chain-of-reactors model, based on reported observations. It should be emphasized that available observations are an imperfect basis for the initialization of model of high-temperature chemistry in the near-source plume. First, no individual measurement technique can observe all gases in a volcanic plume. Available observations may not fully characterize all magmatic gases in the emission, nor any temporal evolution in their release as a function of volcanic activity. Second, observations of the cooled or partially cooled plume necessarily already incorporate any high-temperature modification of the emissions. Our use of such observations inherently assumes that preceding plume chemistry has only slightly modified the volcanic gas emission. This is indeed the prevalent assumption behind near-source monitoring of volcanic gas emissions (with the exception of volcanic BrO, e.g., Guttmann et al., 2018). Unfortunately, sources such as lava bodies are typically hazardous and inaccessible, therefore few direct measurements are available of the gas emission prior to any mixing with air.
In this study the composition of the Eyjafjallajökull magmatic gas emission is based on observations of H2O-CO2-SO2-CO-(HCl) in the young plume of the summit eruption reported by Allard et al. (2011) who performed FTIR spectroscopy of volcanic gases in early May 2010, using hot rocks as an IR source. Note that the volcanic emission of HCl was replaced by Ar in our modeling that does include halogens. The emission scenarios for the model studies are summarized in Table 2.
A first simulation emissions scenario (Eyja CO) is based entirely on observations of Allard et al. (2011). This emission contains CO but no other reduced gases such as H2 or H2S, which typically cannot be resolved in this experimental set up. HF was also not reported, being below detection limits. The measurements by Allard et al. (2011) yield a CO/SO2 molar ratio of 0.175 and CO/CO2 = 0.0044. To evaluate how the presence of CO and SO2 impact the high-temperature chemistry of the near-source plume, sensitivity studies were undertaken that excluded CO and SO2 from the emission (Eyja no-CO no-SO2).
A further simulation (Eyja CO–H2-H2S) was undertaken that included estimates for H2 and H2S in the Eyjafjallajökull emission (based on thermodynamic equilibrium calculations) alongside CO and the other gases reported by Allard et al. (2011). It is assumed that the magmatic gases were in thermodynamic equilibrium and at magmatic temperature on emission. For the Eyjafjallajökull summit eruption a temperature of 1273 K is assumed (Keiding and Sigmarsson, 2012). The gases obey the equilibria CO + 0.5 O2 = CO2, H2 + 0.5 O2 = H2O, H2S + 1.5 O2 = SO2 + H2O with corresponding thermodynamic equilibrium constants of 1.13 × 10⁷, 1.92 × 10⁷, and 1.54 × 10¹⁷ at 1273 K (constants obtained from HSC). For these conditions the CO/CO2 molar ratio 0.0044 observed by Allard et al. (2011) corresponds to an oxygen fugacity of 4.0 × 10⁻¹⁰ bar (i.e., QFM+1.6 log units). The corresponding H2O/H2 molar ratio is 387 and SO2/H2S molar ratio is 1379. Combining these theoretical molar ratios with the mole fraction composition for H2O and SO2 in Table 2 yields estimates for the mole fractions of H2 = 0.0024 and H2S = 1.45 × 10⁻⁶ in the Eyjafjallajökull emission. Thus, it is predicted that the eruption emitted a similar quantity (by mole) of H2 compared to SO2, but only a trace emission of H2S.
Some volcanoes release a larger proportion of sulfur in reduced forms. To investigate the potential impact of H2S on the high-temperature chemistry of near-source volcanic plumes, we undertook a sensitivity study using a composition based on measurements made at Mt Etna (passive degassing) whose emission composition is still relatively oxidized, but includes H2S (Roberts et al., 2017 and references therein) and H2 (Aiuppa et al., 2011; Supplementary Table S4). We emphasize that our combination of Eyjafjallajökull plume dynamics with Mt Etna emission composition for this sensitivity study is not representative of plume chemistry for Mt Etna passive degassing conditions. Rather it reflects a possible scenario for an ash-rich explosion from Mt Etna, assuming emission composition similar to that observed during passive degassing, and plume dynamics similar to Eyjafjallajökull. The Mt Etna composition used as input to our kinetics-model study is identical to the input used for a thermodynamic model study by Martin et al. (2011) [where the H2 emission was calculated theoretically and is somewhat higher than that observed by Aiuppa et al. (2011)]. Notably, the SO2 content of the Mt Etna emission composition (0.029 mole fraction) is more than an order of magnitude higher than the SO2 content of Eyjafjallajökull emission (0.002 mole fraction). The H2S content of the emission is also much higher for Mt Etna (also with a higher ratio to SO2), whilst the H2, H2O, and CO2 mole fractions are similar (although ratios to SO2, X/SO2, are lower). A sensitivity study was also performed without H2S in the Etna emission (Etna no-H2S).
Our study compares output from the chemical kinetics model outlined above to an equilibrium model (HSC) that has been previously applied to investigate volcanic plume chemistry (e.g., Martin et al., 2006). HSC model version 7.1 was used to calculate equilibrium compositions of mixtures of air with magmatic gases under the same temperature and VA:VM boundary conditions as for the chain-of-reactors model. The input composition was determined by mixing air (composed of 78% N2, 21% O2 and 1% Ar) with the Eyjafjallajökull magmatic gas composition (Table 2) for each VA:VM, whilst temperature was specified according to the PlumeRise boundary conditions. Pure magmatic gases are usually assumed to have compositions at chemical equilibrium when they are released from the volcano (and there is good evidence for this to first order for major C- and S-bearing species, e.g., Oppenheimer et al., 2018); however, some repartitioning of Eyjafjallajökull gases may be expected for thermodynamic equilibrium calculations even at VA:VM = 0:100 because the reported gas emission composition is incomplete and the initial PlumeRise temperature is slightly lower than magmatic temperature (see section “Magmatic Gas Emissions”).
Physical parameters from the PlumeRise model (temperature T, VA:VM, distance from the source, and plume cross-sectional area) used as boundary conditions for the chain-of-reactors model vary as a function of time, Figures 2A,B. Temperature is varied smoothly across the chain-of-reactors and decreases from 1000 K to 890 K (over the 30 PFRs) whereas VA:VM increases stepwise from 0 to 5.3 due to air-entrainment between each reactor. This T and VA:VM scenario is not representative of all volcanoes. Smaller volcanic emissions would likely disperse faster, particularly if ash-poor. The presence of ash in Eyjafjallajökull plume maintains high temperatures at higher VA:VM than would occur in an ash-poor emission (that for example for VA:VM > 3 would yield T < 500 K according to simple gas-phase mixing). This result is not surprising given 1D plume-rise models of explosive eruptions typically assume an emission containing volcanic gases at a few weight-percent, with the remainder as pyroclasts. We highlight that this “temperature buffering” effect of ash may significantly prolong the period in which volcanic gases undergo high-temperature chemistry as they mix with air.
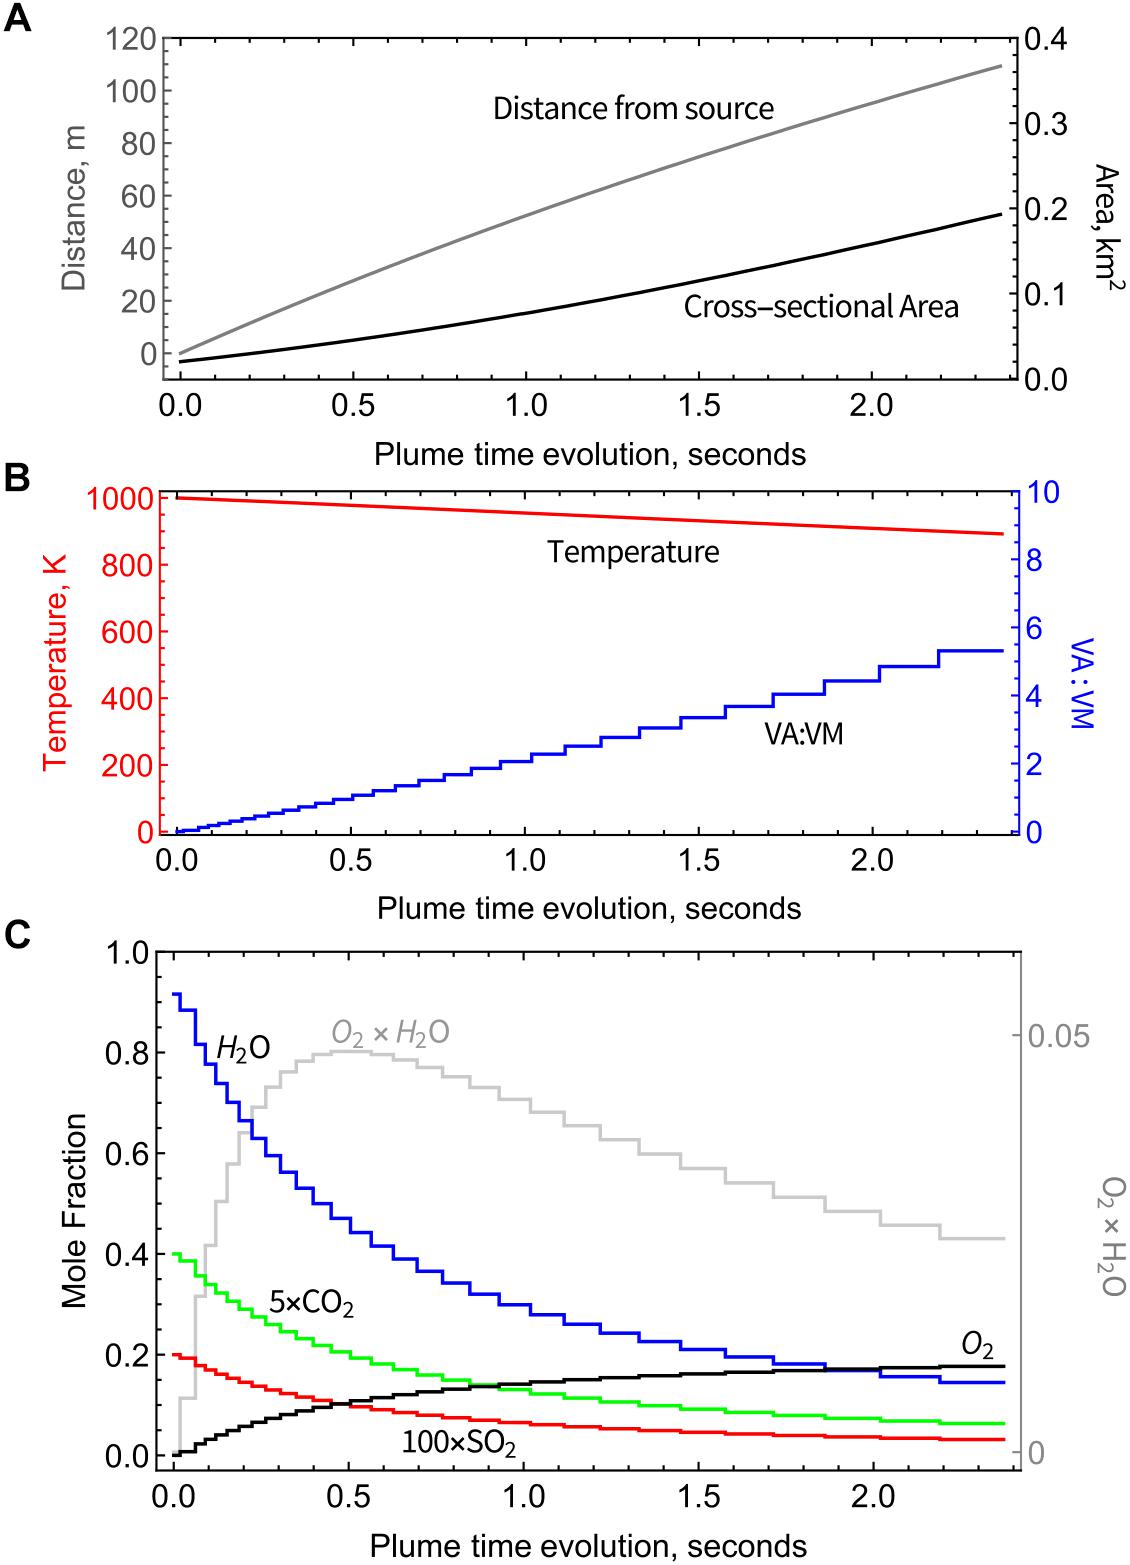
Figure 2. Physical parameters used as boundary conditions for the chain-of-reactors model, from the PlumeRise model applied to Eyjafjallajökull 2010 eruption (Woodhouse et al., 2013). (A) Plume cross-sectional area and distance from source as a function of plume time evolution. (B) Decreasing temperature and increasing proportion of mixing between air and magmatic gases (VA:VM) as a function of time. (C) Output from the chain-of-reactors model as a function of time: mole fractions of major volcanic gases (H2O, CO2, and SO2) decrease due to dilution and O2 increases due to entrainment of background air. Also shown is the product of H2O and O2 exhibiting maximum around 0.5 s.
As VA:VM increases, the abundance of air-dominated gases such as O2 increases step-wise toward an asymptote of 21% (pure air) whilst major magmatic gases such as H2O and CO2 decrease step-wise due to dilution, Figure 2C. Plume chemistry can additionally cause gas abundances to rise or fall within each reactor. Figure 2C shows that there is negligible or only small impact of plume chemistry on O2, H2O, and CO2 whose abundances are largely controlled by air entrainment/dilution. Also shown in Figure 2C is the product of the O2 and H2O mole fractions that reaches a maximum at around 0.5 s, of relevance to the high-temperature reactions discussed in Section “Discussion.”
The chemical evolution of the Eyjafjallajökull near-source plume according to the high-temperature chain-of-reactors model is shown in Figure 3A (Eyja CO run) over a time-period of about 2.4 s, during which VA:VM increases from 0 to 5.3, and temperature decreases from 1000 K to 890 K. The slight declines in major gases H2O, CO2, and SO2 mixing ratios show they are largely under the control of dilution whilst air is entrained, i.e., are largely conserved. The production of oxidant radicals such as OH, HO2, and H2O2 increases rapidly with plume time evolution during the first 0.5 s, after which their absolute mixing ratios decrease. Formation of SO3 follows a similar pattern. The volcanic gas CO decreases only slightly faster than the major gases, indicating that it is not substantially oxidized by the plume chemistry. The general pattern is similar for the Eyja CO–H2–H2S simulation, Figure 3B: a higher maximum abundance of oxidant radicals is reached (slightly earlier) and slightly more CO is oxidized, but still not completely depleted. In the Eyja CO–H2–H2S simulation both volcanic gases H2 and H2S become oxidized at around 0.5 s. To analyze the chemical kinetics model results in more detail and compare to field-observations and thermodynamic calculations, ratios are presented of the minor volcanic gases relative to the major (largely conserved) gases SO2, CO2, and H2O.
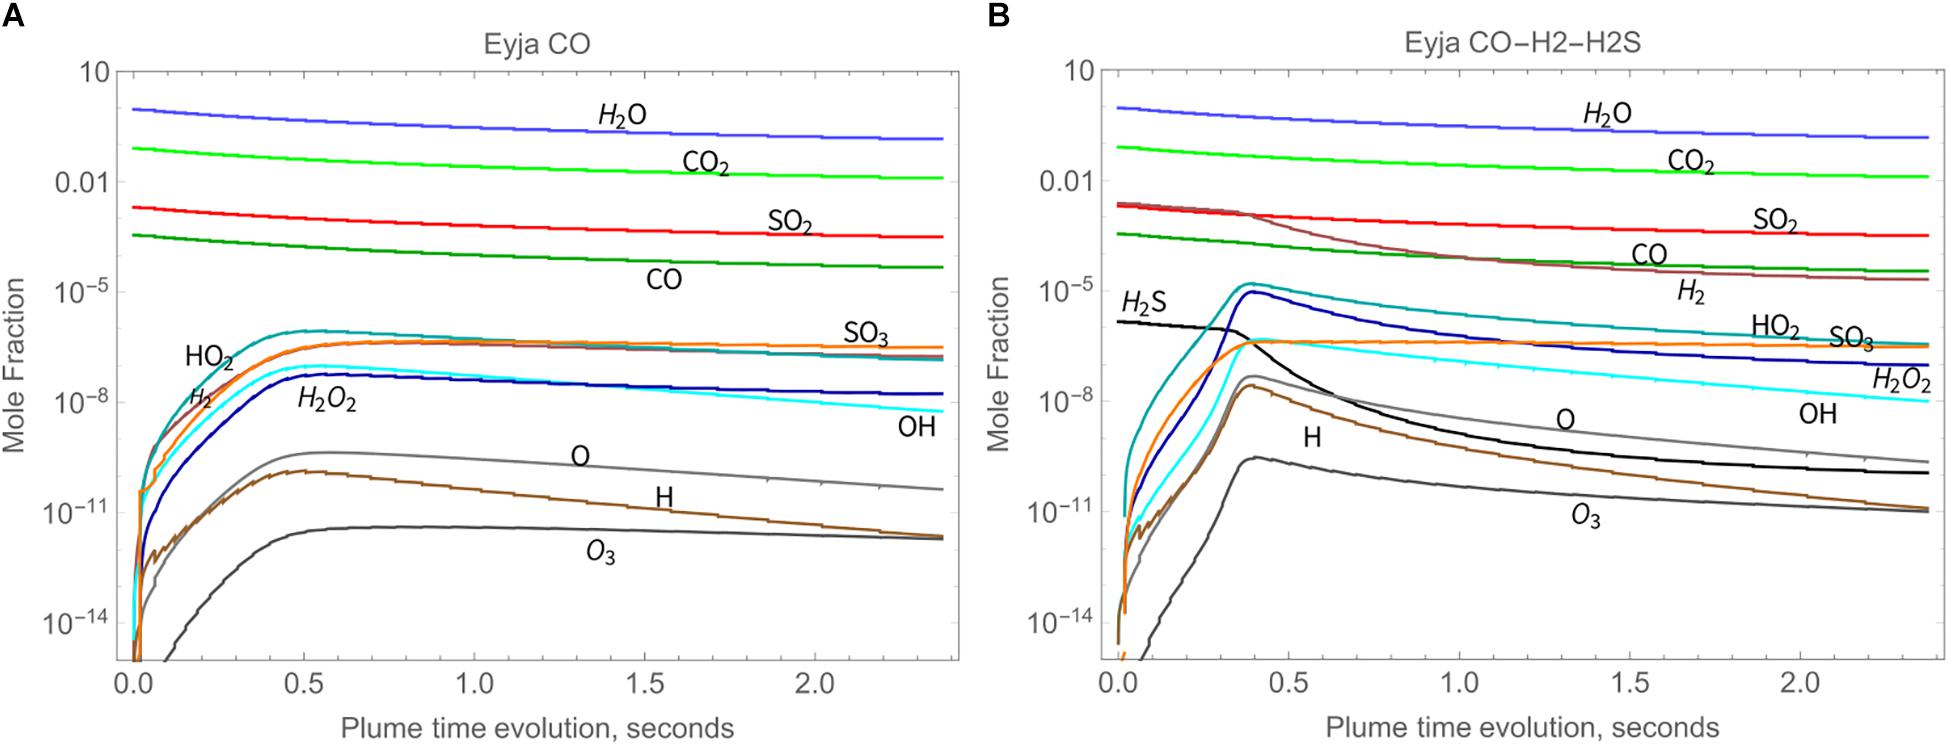
Figure 3. High-temperature oxidant and radical production as a function of time in Eyjafjallajökull plume according to the chain-of-reactors model for two initial compositions, both of which include major volcanic gases H2O, CO2, and SO2, as well as additional emitted gases as named: (A) Eyja CO and (B) Eyja CO-H2-H2S.
CO is only slightly oxidized by high-temperature chemistry, as shown by CO/SO2 ratio, Figure 4A (as well as CO/CO2, Figure 4B). At the end of the simulations (VA:VM = 5.3 after 2.4 s), CO/SO2 has only declined by about 15% of the initial ratios for Eyja CO, and by 37% of the initial ratios for Eyja CO–H2–H2S. In contrast, HSC thermodynamic calculations predict near-complete oxidation of CO as soon as air is mixed with the volcanic gases (VA:VM > 0), Figure 4. The kinetics model results are thus far more consistent with the presence of CO observed in the young Eyjafjallajökull plume by FTIR (Allard et al., 2011) and indeed in other volcanic gas emissions from more reduced magmas, e.g., at Mt Erebus (Oppenheimer and Kyle, 2008).
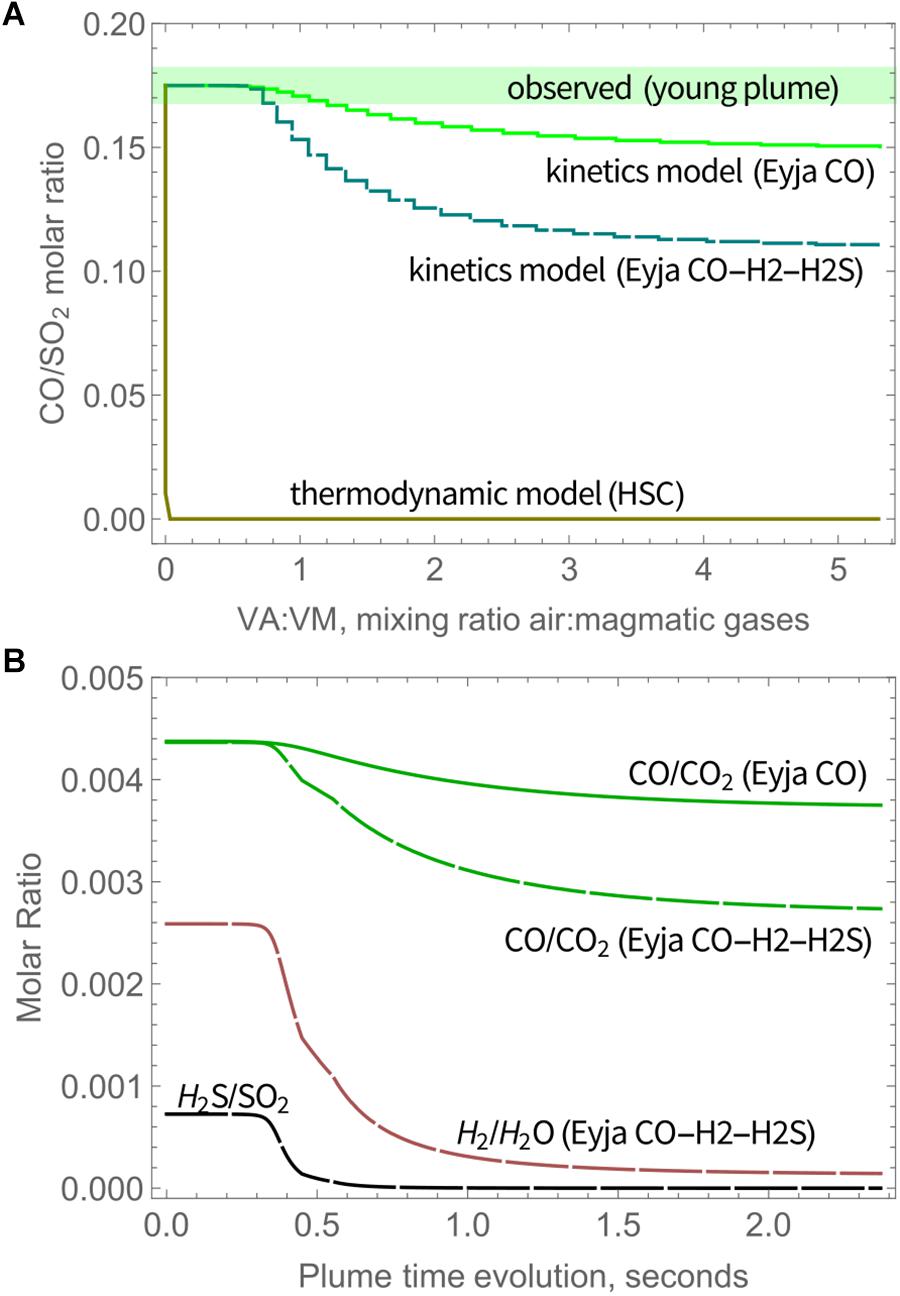
Figure 4. (A) Molar ratio of CO/SO2 in Eyjafjallajökull plume as a function of time according to the chain-of-reactors model for Eyja CO and Eyja CO-H2-H2S simulations, and the HSC thermodynamic model, compared to CO/SO2 observed in the young plume by Allard et al. (2011), see also Table 3. Solid lines: Eyja CO simulation, Dashed lines: Eyja CO-H2S-H2 simulation. (B) Molar ratio of CO/CO2 (Eyja CO and Eyja CO-H2-H2S simulations) as well as H2S/SO2 and H2/H2O (Eyja CO-H2-H2S simulation only) as a function of time according to the chain-of-reactors model. Solid lines: Eyja CO simulation, Dashed lines: Eyja CO-H2S-H2 simulation.
Additional observations of volcanic CO in the Eyjafjallajökull plume are reported by Schumann et al. (2011) who made instrumented aircraft measurements of the aged (10–100 h) plume over Europe during mid-April to mid-May. Both CO and SO2 were observed above background levels. The molar ratio of excess CO and excess SO2 (as averages) in transects of the aged plume is around ∼1, i.e., somewhat higher than the ratio reported by Allard et al. (2011) in the young plume. Reasons for this discrepancy are not clear. It is unlikely that CO was formed in the plume in an oxidizing atmosphere. Plume structure in the aircraft measurements as reported by Schumann et al. (2011) is smoother for SO2 compared to CO. This may in part be due to the vastly different response times of the aircraft-based instruments for SO2 (T95 response time to reach 95% signal is 80 s) and CO (response time < 2 s), which might cause a high bias in the derived CO/SO2. There is some scatter in the CO and SO2 measurements as well as variability in background CO. In addition, SO2 could undergo atmospheric oxidation processes, resulting in an increase in the CO/SO2 ratio in the downwind plume. Unusually, at Erebus volcano a rapid loss of SO2 has been identified in the very young plume possibly aided by cloud processing (Oppenheimer et al., 2010). However, oxidation of SO2 in volcanic plumes is typically slow (e.g., Galeazzo et al., 2018). The measurements of CO/SO2 in the downwind Eyjafjallajökull plume do not show any clear dependency on plume age. In any case, the aircraft measurements of Schumann et al. (2011) detected volcanic plume CO alongside SO2, confirming that CO was emitted during the 2010 Eyjafjallajökull eruption and that CO was not substantially oxidized by high-temperature near-source chemistry as is commonly predicted by thermodynamic modeling. Oxidation of CO was evidently kinetics-limited in the transient near-source plume. A summary of the model and observed CO/SO2 is given in Table 3.
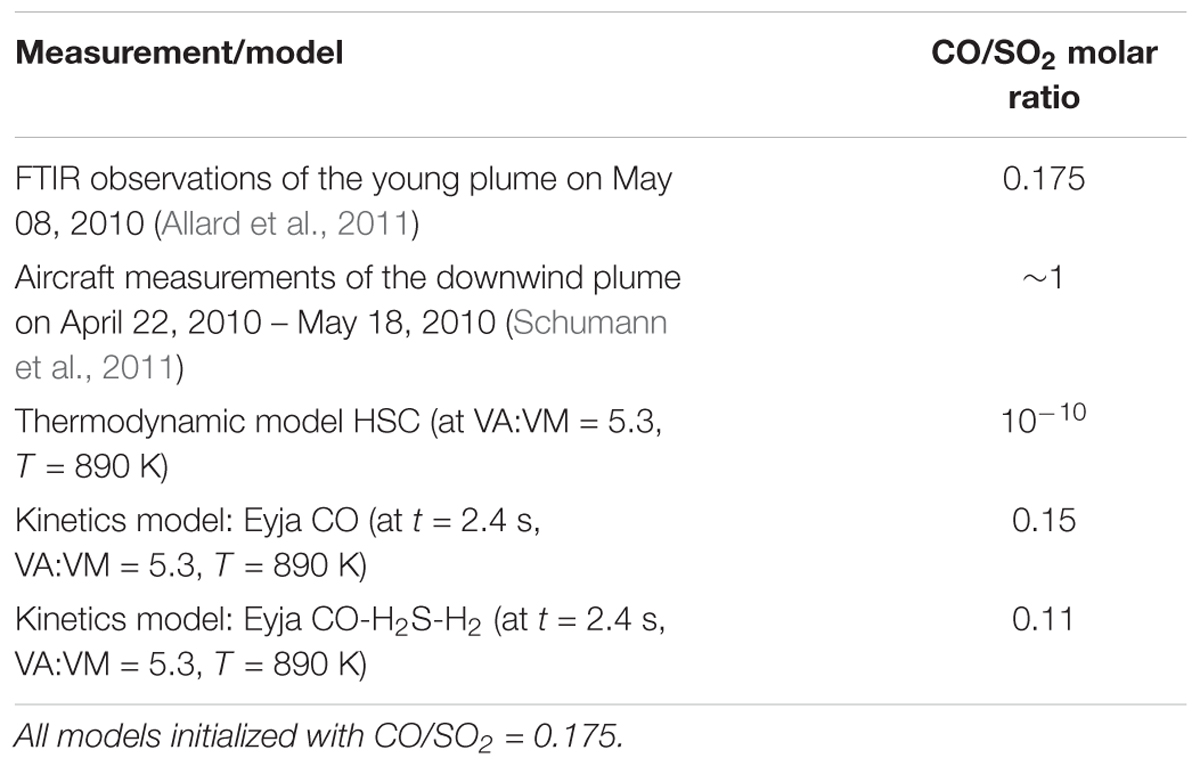
Table 3. Molar CO/SO2 ratio observed in Eyjafjallajokull eruption plume compared to model predictions.
The Eyja CO–H2–H2S simulation that includes theoretical estimates for volcanic emission of H2 and H2S predicts near-complete oxidation of both gases, Figure 4B, as well as partial oxidation of CO. This is due to an oxidant enhancing feedback mechanism (see section “Discussion”). No specific observations of H2 or H2S are available for comparison in the Eyjafjallajökull near-source or far downwind plume. However, observations of H2S in plumes from both passively degassing volcanoes (e.g., Roberts et al., 2017) and explosive eruption plumes (e.g., de Moor et al., 2016) indicate that H2S is (largely) conserved, as for CO. Measurements of H2 have been reported in plumes from some passively degassing volcanoes (e.g., Aiuppa et al., 2011; Moussallam et al., 2012). In general, observations of reduced gases in volcanic plumes (specifically CO/CO2, H2O/H2, and SO2/H2S gas ratios) may be used to infer magmatic properties at emission such as oxygen fugacity (see section “Magmatic Gas Emissions”), on the condition that modification of the emitted composition by near-source plume chemistry is either negligible or well-constrained by plume chemistry models. Here the small decrease in CO/CO2 predicted by the kinetics model (Eyja CO) is equivalent to a difference in oxygen fugacity of 1.5 × 10⁻¹⁰ bars or about 0.14 log unit QFM. We highlight two important areas of model uncertainty regarding the near-source oxidation of reduced gases. First, the reactions are temperature-dependent yet the temperature of the volcanic gas emission as well as subsequent plume physical evolution are both rather poorly known. Second, the kinetics of certain reactions, particularly for H2S are poorly constrained by laboratory experiments. Thus, the presence of H2 and H2S observed in certain volcanic plumes may suggest either a lower emission temperature or faster cooling rate than the Eyjafjallajökull case presented here, or may reflect uncertainties in the model chemical schemes.
SO3 abundance in magmatic gas is negligible but is predicted to form through high-temperature plume chemistry. SO3 is a precursor to sulfate aerosol (as is well-known e.g., from studies of power station emissions). Upon further plume cooling, volcanic SO3 will react readily with H2O(g) to form H2SO4(g) that is highly hygroscopic and will form sulfate particles. The widespread observation of near-source volcanic sulfate (see section “Introduction,” Table 1), motivates our model investigation of high-temperature SO3 as a possible sulfate source. The SO3 abundance increases rapidly at around 0.5 s, Figure 5A. The SO3/SO2 molar ratio increases throughout the model simulations, indicating a continual production of SO3 that is similar for Eyja CO and Eyja CO–H2–H2S. By the end of the simulations (2.4 s, VA:VM = 5.3, T = 890 K), the SO3/SO2 molar ratio reaches 10-3. The fact that SO3/SO2 ratio is still increasing at the end of the model simulation indicates that additional high-temperature production of SO3 is expected as the plume cools and dilutes further. Extrapolation of Figure 5A suggests SO3/SO2 may potentially reach up to ∼2 × 10⁻³. Whilst there are no reported sulfate/SO2 measurements for the Eyjafjallajökull summit eruption for specific comparison, this modeled ratio of SO3/SO2 of around 10-3 lies within the range of observed near-source sulfate/SO2 ratios, including the Eyjafjallajökull flank eruption (Figure 5B and Table 1). In contrast, calculations using the HSC thermodynamic equilibrium model at VA:VM = 5.3, T = 890 K predict SO3/SO2 of around 3.1, an order of magnitude above the highest ratio of sulfate/SO2 in the field observations, and several orders of magnitude higher than the Eyjafjallajökull observations. We conclude that the chemistry producing SO3 in the near-source volcanic plume is under kinetic rather than thermodynamic control.
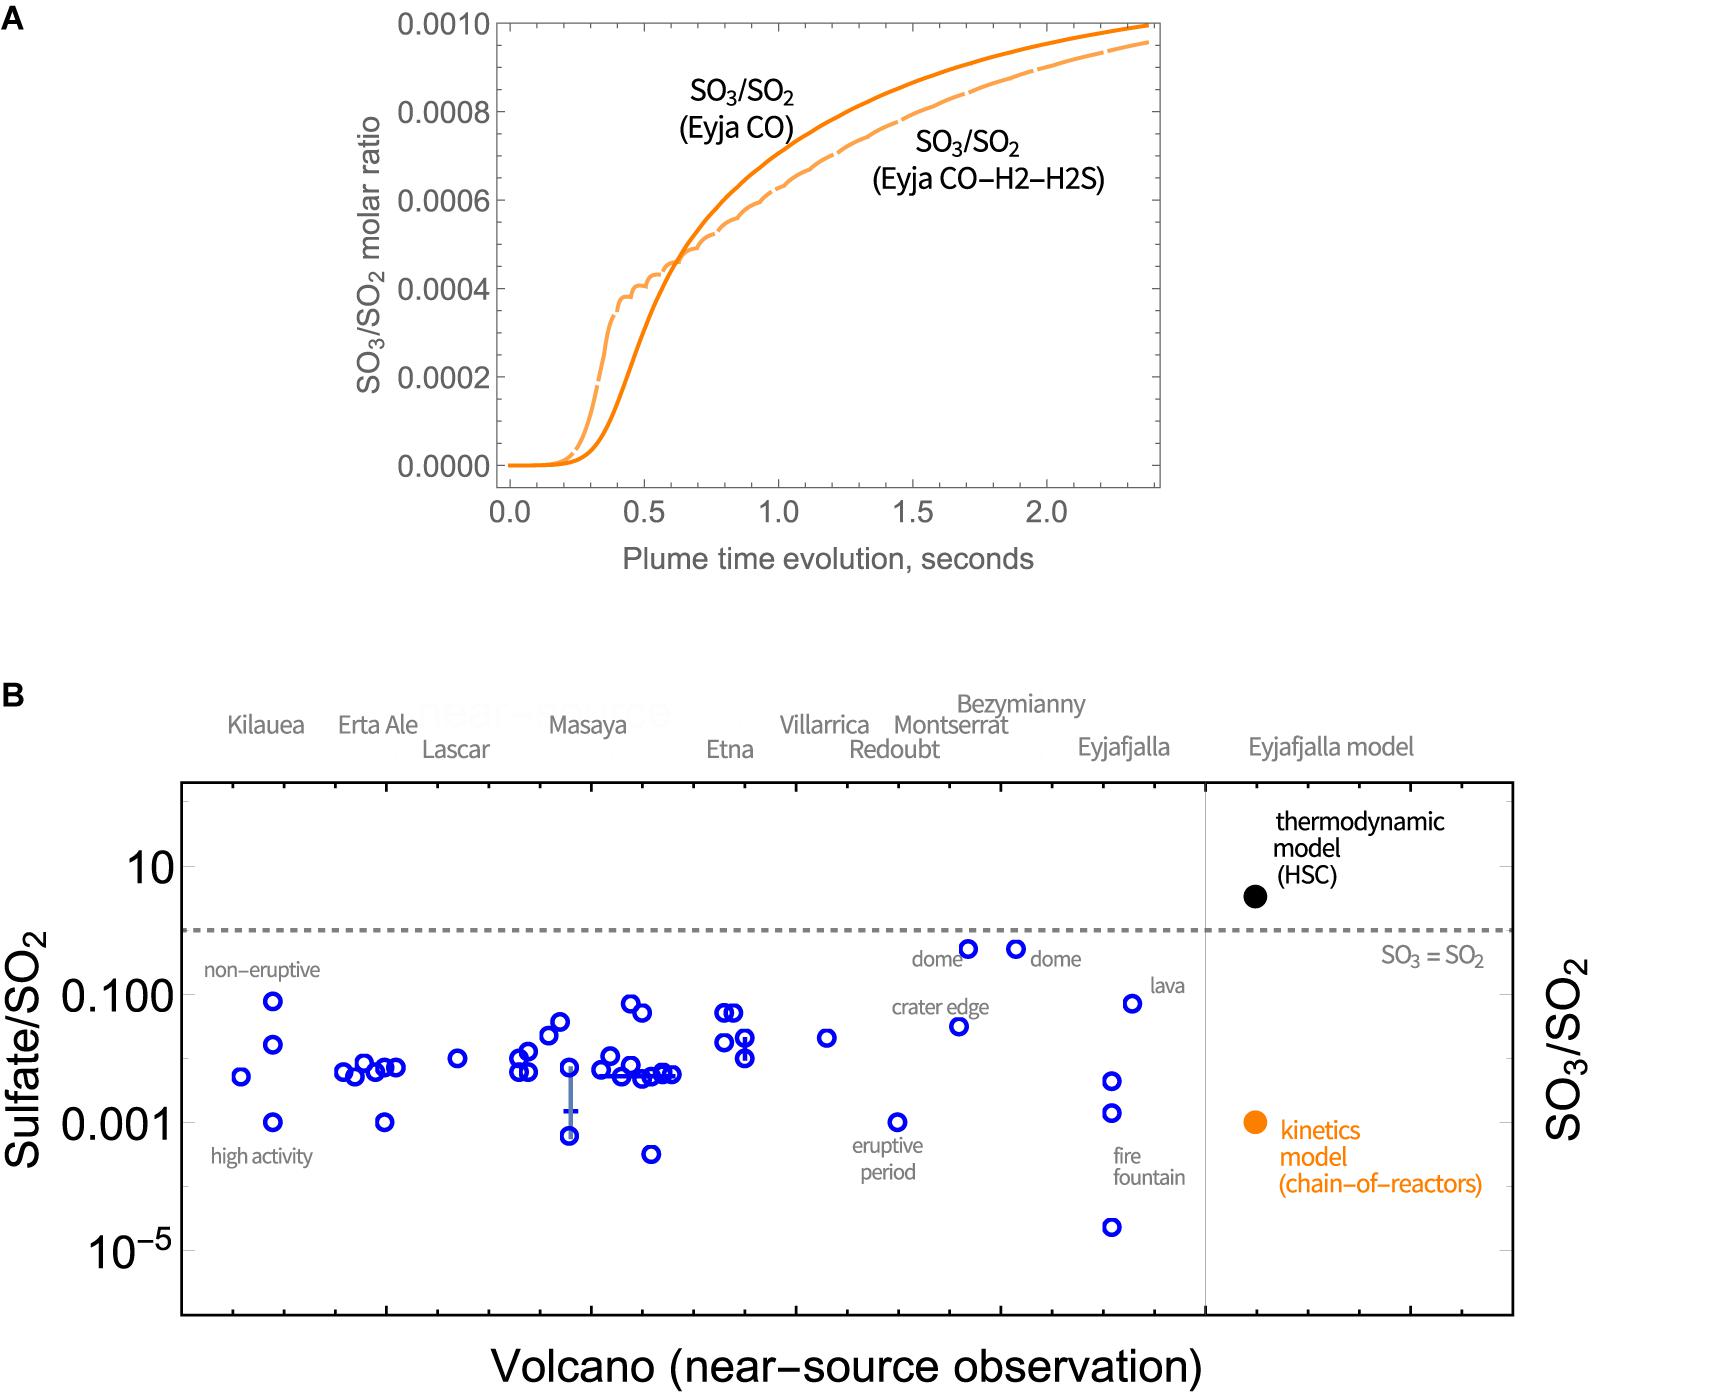
Figure 5. (A) Evolution in the SO3/SO2 molar ratio in Eyjafjallajökull plume as a function of time, according to the chain-of-reactors model. Solid lines: Eyja CO simulation, Dashed lines: Eyja CO-H2-H2S simulation. (B) Observations of near- or at-source sulfate relative to SO2 reported in volcanic plumes (Table 1) compared to the molar ratio of sulfate precursor SO3 to SO2 predicted by the chain-of-reactors model for Eyjafjallajökull eruption plume (time = 2.4 s, T = 890 K, VA:VM = 5.3) and HSC thermodynamic equilibrium calculations for the same plume conditions (T = 890 K, VA:VM = 5.3). The SO3 = SO2 is demarked by a dotted line.
High-temperature oxidants HOxy (HO2, OH, and H2O2) are predicted to form in the Eyjafjallajökull plume through high-temperature plume chemistry, Figures 6A,B (absolute concentrations shown). Also shown for scale is the SO2 concentration that decreases largely due to dilution. High-temperature HOxy reaches a maximum around 0.5 s. HOxy production is greater for Eyja CO–H2–H2S than for the Eyja CO simulation. In both cases HOx exists predominantly as HO2. This contrasts with thermodynamic calculations that predict HOx to exit predominantly as OH (e.g., Gerlach, 2004). Another important feature of the chemical kinetics modeling is that H2O2 is predicted to form (at greatest abundance for Eyja CO–H2–H2S), whilst H2O2 is essentially not formed in HSC thermodynamic calculations (e.g., Martin et al., 2006).
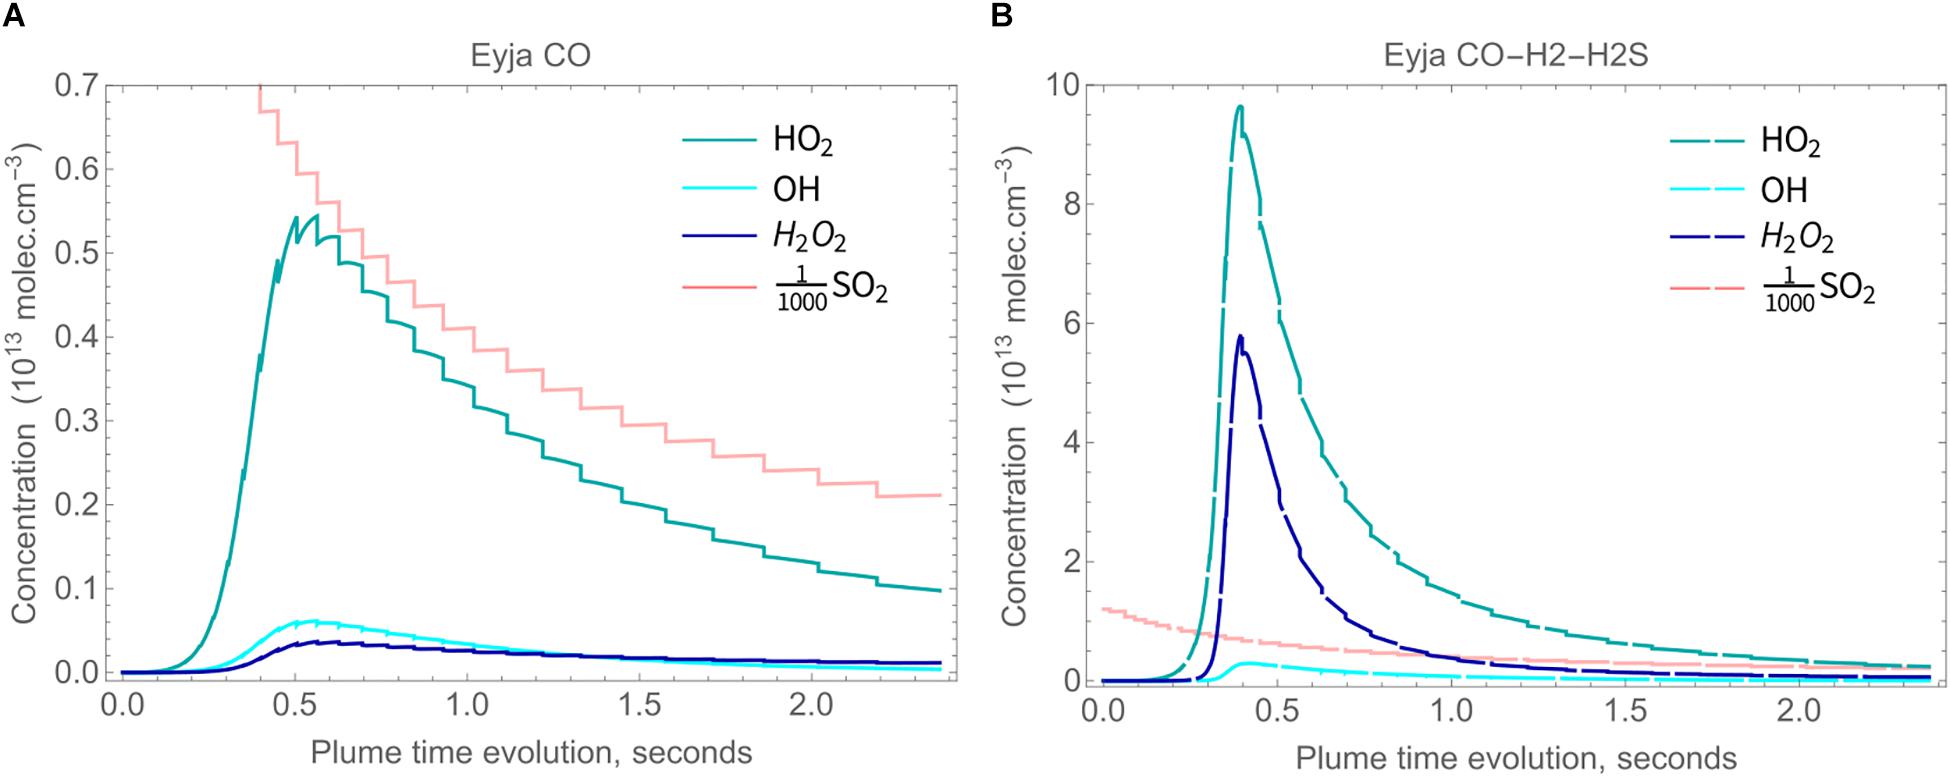
Figure 6. Concentrations of HO2 (blue), H2O2 (dark blue) and OH (cyan) in the plume, with SO2 concentration also shown for scale, molec cm-3. (A) solid lines: Eyja CO simulation and (B) dashed lines: Eyja CO-H2-H2S simulation.
High-temperature SO3 was discussed above as a precursor to sulfate aerosols. The H2O2 formed by high-temperature chemistry may promote further sulfate formation upon plume cooling, due to its reaction with dissolved SO2(aq). If a condensed phase is formed already in the crater zone this could yield an additional source of “primary” or near-source sulfate. Alternatively, if plumes become condensed clouds further downwind, the volcanic H2O2 may form secondary sulfates. In this respect, Carn et al. (2011) measured H2O2 in the plume emitted by Huila volcano (elevated above background by about 0.5 ppbv) that was rapidly titrated when the plume entered a cloudy phase. We are unaware of other observations of H2O2 in volcanic plumes.
We highlight two further potential impacts of volcanic H2O2. Studies have shown that iron on the surface of volcanic ash has the potential to generate substantial quantities of hydroxyl radicals that may affect the toxicity of inhaled ash particles (Horwell et al., 2003; Hillman et al., 2012). This occurs via the Fenton reaction involving H2O2. The elevated abundance of H2O2 in the volcanic plume predicted by our model study would likely enhance the production of OH radicals and their potential health hazard. Indeed, an observation that has puzzled the volcanology-atmospheric community to date is the presence of elevated OH (and HO2) measured in the 2010 Mt Hekla eruption cloud in the stratosphere (Rose et al., 2006). This elevated OH is all the more surprising given the measurement was made during night-time and in the presence of major OH reactive sinks (e.g., HCl and SO2). We propose the reaction of volcanic H2O2 on ash particles as a possible mechanism that could generate OH radicals in volcanic plumes even during night-time.
High-temperature oxidants such as OH and radicals such as Br, Cl are believed to have an important role in accelerating the onset of low-temperature atmospheric chemistry “bromine explosion” cycles that form BrO and destroy ozone in the downwind plume (e.g., Bobrowski et al., 2007; Roberts et al., 2014; Surl et al., 2015; Figure 7A). The bromine explosion is autocatalytic so can be efficiently “kick-started” by a small quantity of high-temperature halogen radicals. Observations show that halogens were emitted during the eruption (young plume HCl/SO2 ≈ 0.65, Allard et al., 2011) and that reactive halogen chemistry was active in the plume (downwind plume BrO/SO2 ≈ 1.3 × 10⁻⁴, Heue et al., 2011). The Eyjafjallajökull volcanic halogen chemistry caused a depletion of tropospheric ozone (Vance et al., 2010; Schumann et al., 2011). Here offline calculations show the potential for formation of high-temperature halogen radicals to initiate this process.
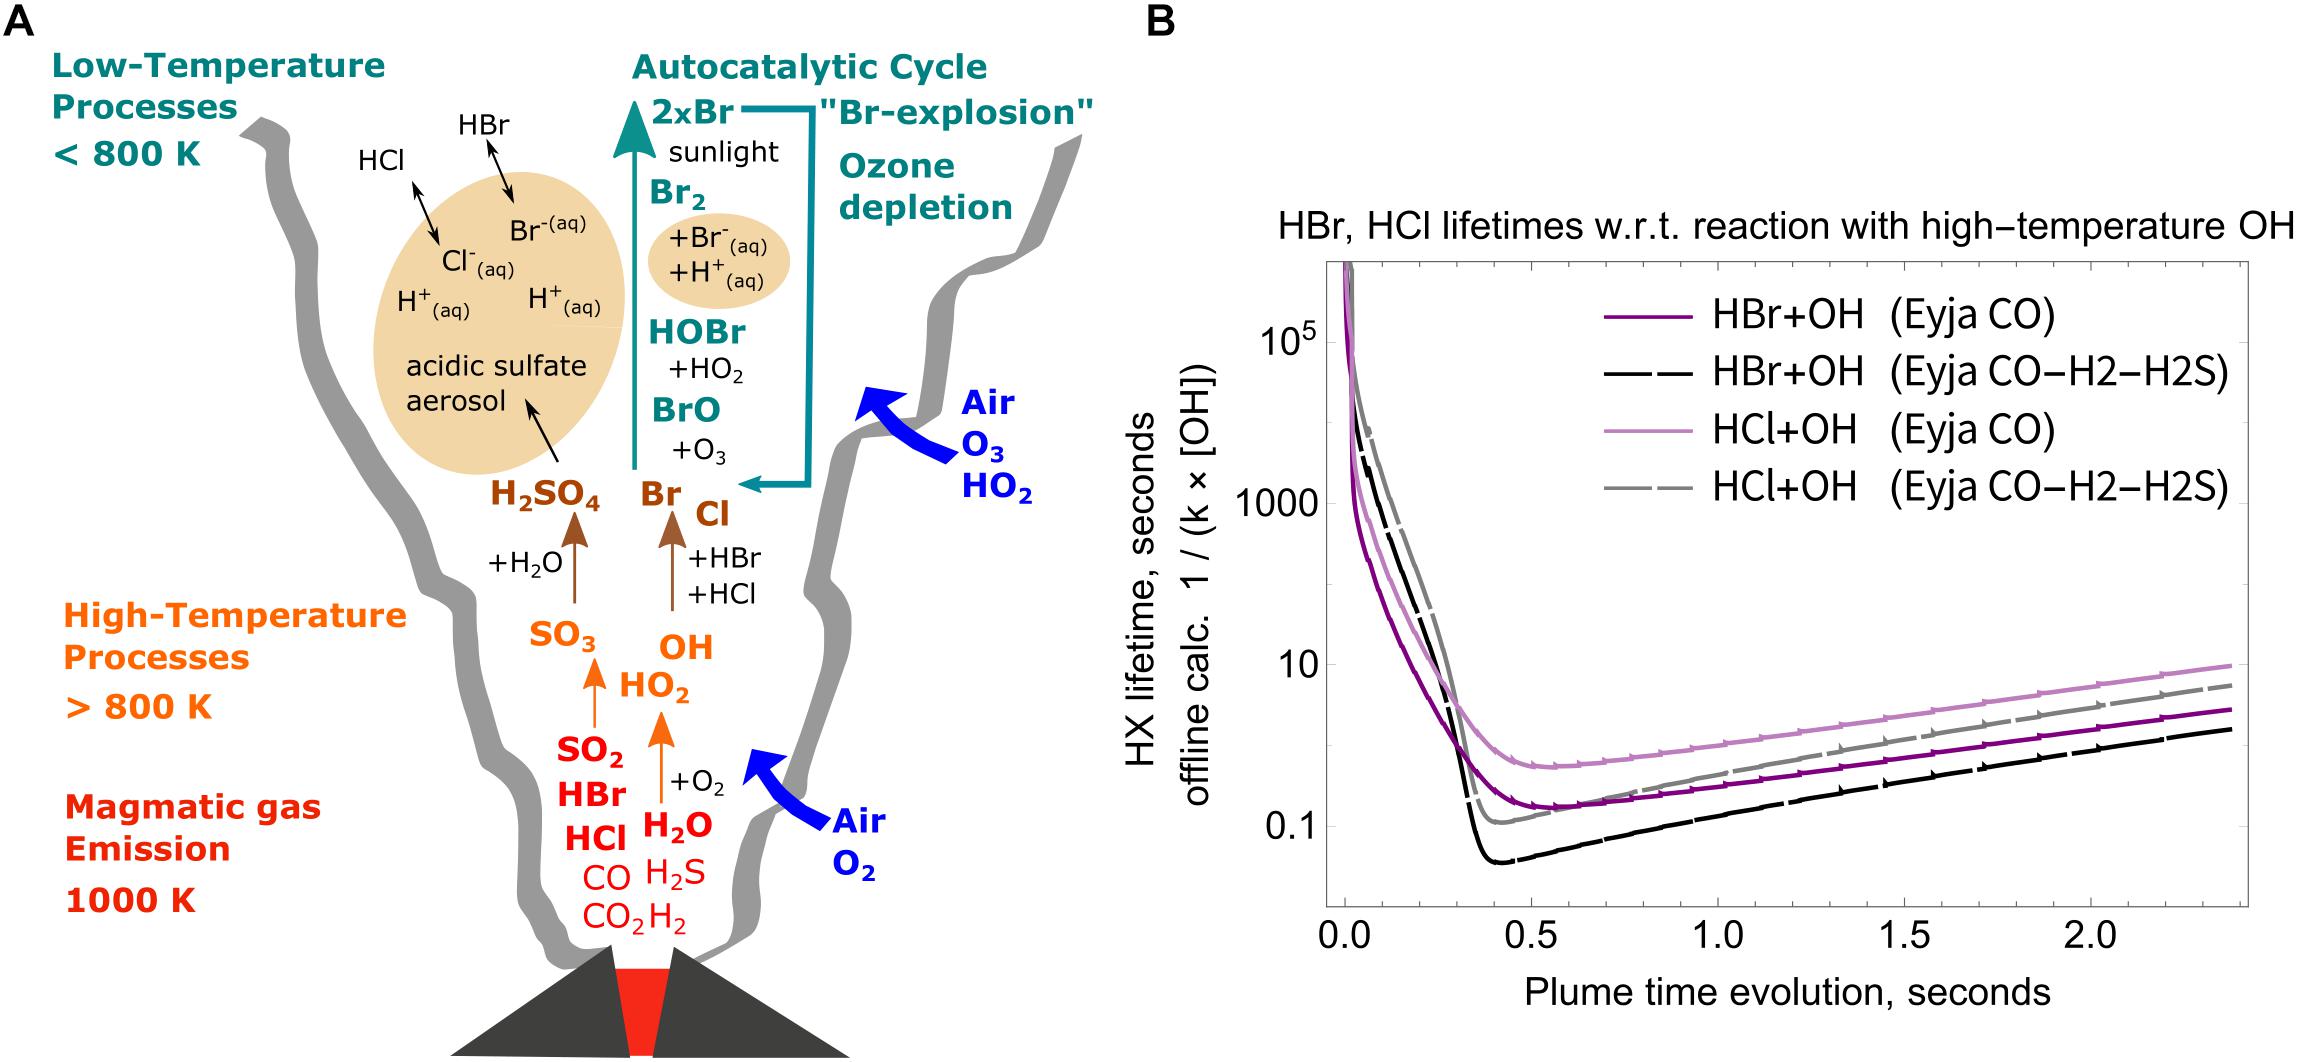
Figure 7. (A) schematic of key high-to-low temperature processes in the volcanic plume, including high-temperature production of SO3 as sulfate aerosol precursor, HOx oxidants and halogen radicals, and low-temperature multi-phase chemistry producing BrO. (B) Calculated lifetimes of HCl and HBr in the plume with respect to their reaction with high-temperature OH as a function of plume evolution time. Solid lines: Eyja CO simulation, Dashed lines: Eyja CO-H2-H2S simulation. Lifetime minima are <1 s, see Table 4.
The OH formed in the near-source volcanic plume is a powerful oxidant that can react with volcanic halogens (emitted as HCl and HBr) to produce halogen radicals (R1 and R2). The high-temperature chemical kinetics model scheme used in this study does not include halogen chemistry. Nevertheless, offline calculations of the lifetime of volcanic HCl, HBr emissions can be undertaken to estimate the potential for halogen radical formation, shown here for the Eyjafjallajökull simulations.
With bimolecular rate constant reported by Ravishankara et al. (1985) as k = 4.5 × 10⁻¹⁷ ×T1.65 exp[112/T] cm3 molecule-1 s-1 (valid for 240–1055 K).
With bimolecular rate constants estimated by Góger et al. (2018) as k = (9.86 ± 2.38) × 10-16 × T(1.23±0.03) × exp[(5.93 ± 0.33) kJ mol-1/RT] cm3 molecule-1 s-1 (valid for 600–3200 K).
Lifetimes of HBr and HCl in the near-source plume are calculated by the inverse of the first-order rate constant, i.e., the product of the 2nd order rate constants for R1 and R2 with the OH concentration. The temperature dependence of the rate constants is only slight (variation of up to about 15%) over our studied temperature range 890–1000 K. Rather, Figure 7B shows that the calculated HCl and HBr lifetimes during the Eyja CO and Eyja CO–H2–H2S simulations are a strong function of OH concentration. The halogen halide lifetimes rapidly decrease as OH is formed in the near-source plume, and then increase as OH is consumed (and diluted). Lifetimes of HBr and HCl reach minima of <1 s in the plume, Table 4. Lifetimes are shortest for HBr that has the greater rate constant of reaction and for the Eyja CO–H2–H2S simulation that produces highest OH concentration. In all cases, the calculated HBr and HCl lifetime minima are shorter than the timescale of the plume simulation (2.4 s) indicating that significant halogen radical production will occur. Reactions R1 and R2 will likely cause a negative feedback on OH concentrations. Once formed the halogen radicals will react with CHOS and some may reform HBr or HCl. A more comprehensive understanding of the halogen interactions will require inclusion of halogen reactions explicitly in the high-temperature model chemical mechanism.
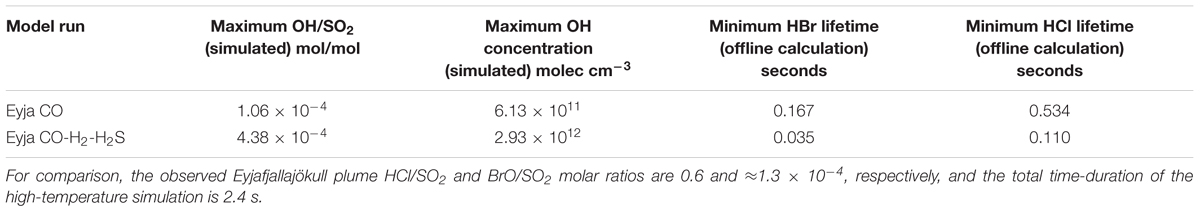
Table 4. Simulated maximum OH/SO2 ratio and OH concentration in the high-temperature near-source plume according to the chain-of-reactors model, and minimum lifetime of HX (X = Br or Cl) with respect to reaction with OH by offline calculation (see section “Potential for High-Temperature Formation of Halogen Radicals” and Figure 7B).
The chemical kinetics model identifies key reactions causing oxidation and oxidant production in the volcanic plume. In this study, the model simulations predict abundances of oxidants, and oxidized species increase rapidly around 0.5 s, at T = 980 K, corresponding to VA:VM around 1 according to the specific Eyjafjallajökull boundary conditions scenario used (different times or temperature conditions can be expected under other plume dyamics conditions). VA:VM = around 1 corresponds to the point where mixing of magmatic gases and air yields a maximum in the product of air-derived O2 and magmatic-derived H2O. Radical oxidants HOx are produced from the reaction of H2O with O2 to form OH and HO2, R3. This (two-way) reaction usually acts as a sink rather than source of radicals in combustion but OH and HO2 formation in the near-source volcanic plume is driven by the unusually high H2O content of the plume-air mixture at high temperatures. Production of HOx is fastest at around 0.5 s or VA:VM = 1, coincident with the maximum in the product of H2O and O2 mole fractions.
Formation of SO3 occurs by the reaction R4 of SO2 with HO2.
When CO is present in the plume, some of it can react with OH to form CO2 and H radicals, R5, which may further react with O2 to form HO2, R6.
Once formed, HO2 can react with itself, R7, to produce hydrogen peroxide, H2O2.
Some H2O2 can also thermally decompose to form OH radicals, R8.
In high-temperature chemistry (generally temperatures above 800–850 K), formation of H2O2 is usually considered as a sink of oxidant radicals. However, in the case of a near-source plume the removal of OH by CO (R5, followed by R6 and R7 leading to H2O2) drives the formation of more OH and HO2 from the reaction of H2O with O2 (more specifically, the balance of this reaction, R3, with its reverse reaction). This feedback mechanism promotes the production of HOxy in volcanic plumes containing CO, where only a fraction of the emitted CO needs to be oxidized to substantially enhance HOxy abundances and promote the chain reaction. Similarly, the H2 emission in the Eyja CO–H2–H2S simulation can also react with OH, R9 (followed by R6 and R7) to cause a similar positive feedback on HOx production.
These feedbacks involving reduced gases may explain the greater production of oxidants in Eyja CO–H2-H2S than Eyja CO simulation. This hypothesis is supported by a sensitivity study without CO and SO2 in the emission (Eyja no-CO no-SO2, Supplementary Figure S2) that produces a lower OH abundance but where more OH accumulates more in the first hundreds of milliseconds, reflecting the balance of OH production and consumption.
We now consider the role of H2S. The very low (theoretically estimated) H2S emission from Eyjafjallajökull had a rather negligible impact on the near-source plume chemistry. The role of H2S is investigated in a simulation of the high-temperature chemistry of Mt Etna emissions, that include H2 and H2S as well as SO2, H2O, and CO2, see Supplementary Table S4 (as well as a control run that excludes H2S). The Etna simulation assumes an eruption with the same plume physics as for Eyjafjallajökull. A very rapid production of oxidants is predicted within the first 0.1 s of plume evolution, Supplementary Figure S3, coincident with a rapid decrease in H2S (and a slower decrease in H2). Abundances of oxidant radicals initially substantially exceed those predicted for Eyja CO and Eyja CO–H2–H2S, and later decline to lower levels. According to our model, the oxidation of emitted H2S causes an extra production of O atoms (which is not observed in the case “without H2S”) with in the first milliseconds of the plume’s mixing with air, following the sequence: H2S + H (or OH) = SH + H2 (or H2O), 2SH = H2S + S, S + O2 = SO + O, and SO + O2 = SO2 + O. The production of sulfur atoms from H2S and their subsequent reactions with O2 are mostly responsible for this production of O, which, in turn, converts SO2 into SO3, resulting in the SO3 peak observed at 0.1 s in the plume. Beyond this point, the conversion of SO2 into SO3 is mainly due to the abundance of HO2 through SO2 + HO2 = SO3 + OH. A significant part of SO3 is then used to recycle SO2 through the formation of HOSO2 (SO3+HO2 = HOSO2+O2 and HOSO2+M = SO2+OH+M). Indeed, the formation of SO3 in the Mt Etna scenario proceeds through two different mechanisms (with O, and then with HO2) at different locations in the plume whereas in the Eyja CO and Eyja CO-H2-H2S or Etna no-H2S scenarios, the formation of SO3 is only linked to HO2. It must be emphasized, however, that model predictions are limited by uncertainty in high-temperature H2S chemistry.
This sulfur cycling regulates SO3/SO2 to reach around 10-3 after 2.4 s in all of the simulations (Eyja CO, Eyja CO-H2-H2S, Etna and Etna no-H2S, Figure 5A and Supplementary Figure S3), despite their differences in CO-H2-H2S emissions that lead to vast differences in the production and abundances of HOxy. Temperature and VA:VM evolution with time may be important controls on SO3/SO2, therefore production of near-source sulfate could vary for different physical conditions other than the Eyjafjallajökull case considered here.
Our chain-of-reactors model provides a framework for quantitative studies into the high-temperature reactions occurring in the near-source plume to form oxidized products such as sulfate-precursors, OH, H2O2 that can impact subsequent physico-chemical processing in the cooled plume. We find that the high-temperature chemistry is under kinetic control; plume composition does not follow thermodynamic equilibrium (Figures 4A, 5B, with example model output in Supplementary Tables S5, S6). Our exploratory study identifies several areas for further investigation.
Uncertainties in the high-temperature gas chemistry mechanism need to be addressed such as the chemical kinetics of sulfur species reactions, notably the oxidation of H2S, that are poorly quantified from laboratory experiments. Future model developments should also incorporate the chemistry of halogens and nitrogen species coupled to CHOS. Simulations of longer duration should cover the whole regime where high-temperature chemical reactions may be important (e.g., down to 800/850 K). The gas-phase mechanism should be extended to consider photolysis reactions for plumes that are not too optically thick, and, especially, heterogeneous chemical reactions, for example reactions on ash surfaces (Delmelle et al., 2018), noting the oxidized products from high-temperature gas chemistry could act to modify ash properties. Models should ultimately be developed that encompass both high-temperature chemistry and also the transition to low-temperature plume chemistry as simulated by atmospheric models (e.g., Jourdain et al., 2016).
The composition of magmatic gases released is specific to each volcano and can vary with volcanic activity/unrest. The chemical feedback mechanisms identified by our model suggest that emissions of reduced gases can enhance the high-temperature production of oxidants. This might lead to a greater production of oxidant radicals in the near-source plume of volcanoes with a relatively reduced emissions composition, such as Mt Erebus, Antarctica, whose emissions are rich in CO and H2. Few field-measurements exist to evaluate model predictions: the high-temperature region is difficult to access directly and few studies have quantified oxidized products in the cooled downwind plume, e.g., by instrumented aircraft. Another critical uncertainty is that the emission temperature of volcanic gases is poorly known. In some situations, according to the dynamics of the degassing, magmatic gas emissions at the surface may be neither in chemical nor thermodynamic equilibrium with the melt (Oppenheimer et al., 2018).
The chemical kinetics model requires time-resolved boundary conditions in plume dynamics, notably temperature and VA:VM (degree of mixing of air with magmatic gases). This study used output from a 1D PlumeRise model for the Eyjafjallajökull 2010 eruption (Woodhouse et al., 2013) for this purpose. Variability in plume dynamics was not investigated but is expected to exert a strong influence on the near-source chemistry through the rate of entrainment of air and cooling. For example, smaller emission sources will typically disperse and cool faster in the troposphere. Ash-poor emissions will tend to cool more rapidly than ash-rich emissions where the solid pyroclasts buffer the temperature of the volcanic gas and air mixture. Large eruptions that inject gases and ash into the stratosphere should also be investigated. Spatial heterogeneity in the turbulent mixing of air into the plume might non-linearly impact the plume chemistry, potentially requiring the development of 3D model approaches to investigate the plume’s high-temperature chemistry as a function of a more detailed turbulent mixing.
We present chemical kinetics model simulations of the high-temperature gas chemistry that occurs as magmatic gases mix with air and cool in the near-source volcanic plume. Volcanic gases released into the atmosphere undergo rapid processing including photochemistry, oxidation, and aerosol formation. Quantifying these processes in volcanic plumes is essential to assess atmospheric and environmental impacts of volcanic emissions. During the first few seconds after release, the hot magmatic gases mix with background air containing oxidants and undergo a high-temperature processing. The gas chemistry in this high-temperature region of the plume is poorly characterized, yet can critically modify the composition of the emission to produce oxidized products and radicals, such as near-source sulfates, HOxy, and halogen radicals. These high-temperature products influence the subsequent physico-chemical processing of the plume at low-temperatures as it disperses in the atmosphere. Studies to date have largely represented the chemical composition of the high-temperature region using thermal equilibrium calculations (e.g., Martin et al., 2006; Hoshyaripour et al., 2012). A source of uncertainty in thermodynamic modeling of the high-temperature chemistry of volcanic plumes is the assumption of equilibrium conditions, that may not always be valid for transient plumes (Martin et al., 2009).
The chain-of-reactors approach of this study is time-resolved and based on chemical kinetics thus differs markedly from thermodynamic equilibrium calculations used to date. We performed an exploratory study of the high-temperature chemistry in a near-source volcanic plume over the first 2.4 s, using as boundary conditions for the time-varying temperature and mixing of air output from 1D PlumeRise model simulations of Eyjafjallajökull plume (Woodhouse et al., 2013). The magmatic gas emission includes H2O, CO2, SO2, and CO, based on observations of the young plume (Allard et al., 2011), with theoretical estimates for H2S and H2 gas emissions added in a sensitivity study and offline calculations performed for halogens.
A key finding is that the plume chemistry is under kinetic control and that thermodynamic equilibrium cannot be assumed. The simulation predicts that CO emission from Eyjafjallajökull is not fully oxidized (largely conserved) by high-temperature chemistry. This is consistent with field-observations of CO in the volcanic plume (Allard et al., 2011; Schumann et al., 2011) and contrasts to thermal equilibrium calculations of near-complete CO oxidation, Table 3. Instead, our study shows CO oxidation is under chemical kinetics control. The model predicts that sulfate-precursor SO3 is formed at levels (SO3/SO2 = 10-3) in general agreement to observations of near-source volcanic sulfate/SO2 in volcanic plumes, Table 1. Conversely, thermodynamic calculations predict a much greater formation of SO3 relative to SO2 for the same plume dynamics conditions. The kinetics model predicts high-temperature formation of HO2, OH, and H2O2. Formation of HOxy is predicted to be enhanced when additional reduced gases (H2S and H2) besides CO are included in the emission.
Offline calculations demonstrate that volcanic halogens (HBr and HCl) will react rapidly with high-temperature OH, highlighting the potential for halogen radicals to form in the high-temperature plume. A key chemical mechanism is that HOx oxidants are formed by the (reversible) reaction of H2O with O2 at high-temperatures to produce OH and HO2. Chemical feedbacks occur when reduced gases in the volcanic emission (CO and H2) react with OH to produce HO2 that can self-react to form H2O2. Thus reduced gases in the volcanic emission act to promote formation of high-temperature HOxy. Another chemical feedback occurs via the oxidation pathway for volcanic H2S that rapidly generates additional oxidants in a chain-reaction. However, there is large uncertainty in some high-temperature reactions, particularly for sulfur species. Quantifying the chemical processes occurring at high-temperatures in the near-source plume is an essential step in understanding the reactivity and evolution of volcanic emissions and their impacts in the troposphere and stratosphere. Improved characterization of this high-temperature region of the plume will require the combination of model, field-observation and laboratory studies.
All authors contributed to the study design, analysis and interpretation of data, and manuscript writing.
The authors declare that the research was conducted in the absence of any commercial or financial relationships that could be construed as a potential conflict of interest.
The handling Editor declared a past co-authorship with one of the authors, TR.
We are grateful to the reviewers for their comments on the original manuscript. TR acknowledges support from the ANR Projet de Recherche Collaborative VOLC-HAL-CLIM (Volcanic Halogens: from Deep Earth to Atmospheric Impacts), ANR-18-CE01-0018, and Labex Orléans Labex VOLTAIRE (VOLatils-Terre Atmosphère Interactions – Ressources et Environnement, ANR-10-LABX-100-0). GD and CO acknowledge support from the Orléans Labex Caprysses (convention ANR-11-LABX-0006-01) and the NERC Centre for Observation and Modelling of Earthquakes, Volcanoes, and Tectonics (COMET), respectively.
The Supplementary Material for this article can be found online at: https://www.frontiersin.org/articles/10.3389/feart.2019.00154/full#supplementary-material
Aiuppa, A., Franco, A., von Glasow, R., Allen, A. G., D’Alessandro, W., Mather, T. A., et al. (2007). The tropospheric processing of acidic gases and hydrogen sulphide in volcanic gas plumes as inferred from field and model investigations. Atmos. Chem. Phys. 7, 1441–1450. doi: 10.5194/acp-7-1441-2007
Aiuppa, A., Inguaggiato, S., McGonigle, A. J. S., O’Dwyer, M., Oppenheimer, C., Padgett, M. J., et al. (2005). H2S fluxes from Mt. Etna, Stromboli, and Vulcano (Italy) and implications for the sulfur budget at volcanoes. Geochim. Cosmochim. Acta 69, 1861–1871. doi: 10.1016/j.gca.2004.09.018
Aiuppa, A., Shinohara, H., Tamburello, G., Giudice, G., Liuzzo, M., and Moretti, R. (2011). Hydrogen in the gas plume of an open-vent volcano, Mount Etna, Italy. J. Geophys. Res. 116, B10204. doi: 10.1029/2011JB008461
Allard, P., Burton, M., Oskarsson, N., Michel, A., and Polacci, M. (2011). Magmatic gas composition and fluxes during the 2010 Eyjafjallajökull explosive eruption: implications for degassing magma volumes and volatile sources. Geophys. Res. Abstracts 13:EGU2011-12040-1.
Allen, A. G., Baxter, P. J., and Ottley, C. J. (2000). Ottley, Gas and particle emissions from Soufrière Hills Volcano, Montserrat, West Indies: characterization and health hazard assessment. Bull. Volcanol. 62, 8–19. doi: 10.1007/s004450050287
Allen, A. G., Oppenheiler, C., Ferm, M., Baxter, P. J., Horrocks, L. A., Galle, B., et al. (2002). Primary sulfate aerosol and associated emissions from Masaya, Volcano, Nicaragua. J. Geophys. Res. 107, ACH5-1–ACH5-8. doi: 10.1029/2002JD002120
Aubry, T. J., Carazzo, G., and Jellinek, A. M. (2017). Turbulent entrainment into volcanic plumes: new constraints from laboratory experiments on buoyant jets rising in a stratified crossflow. Geophys. Res. Lett. 44, 198–110. doi: 10.1002/2017GL075069
Bobrowski, N., von Glasow, R., Aiuppa, A., Inguaggiato, S., Louban, I., Ibrahim, O. W., et al. (2007). Reactive halogen chemistry in volcanic plumes. J. Geophys. Res. 112:D06311. doi: 10.1029/2006JD007206
Bobrowski, N., von Glasow, R., Giuffrida, G. B., Tedesco, D., Aiuppa, A., Yalire, M., et al. (2015). Gas emission strength and evolution of the molar ratio of BrO/SO2 in the plume of Nyiragongo in comparison to Etna. J. Geophys. Res. Atmos. 120, 277–291. doi: 10.1002/2013JD021069
Boichu, M., Menut, L., Khvorostyanov, D., Clarisse, L., Clerbaux, C., Turquety, S., et al. (2013). Inverting for volcanic SO2 flux at high temporal resolution using spaceborne plume imagery and chemistry-transport modelling: the 2010 Eyjafjallajökull eruption case study. Atmos. Chem. Phys. 13, 8569–8584. doi: 10.5194/acp-13-8569-2013
Boichu, M., Oppenheimer, C., Roberts, T. J., Tsanev, V., and Kyle, P. (2011). On bromine, nitrogen oxides and ozone depletion in the tropospheric plume of Erebus volcano (Antarctica). Atmos. Environ. 45, 3856–3866. doi: 10.1016/j.atmosenv.2011.03.027
Branan, Y. K., Harris, A., Watson, I. M., Phillips, J. C., Horton, K., Williams-Jones, G., et al. (2008). Investigation of at-vent dynamics and dilution using thermal infrared radiometers at Masaya volcano, Nicaragua. J. Volcanol. Geothermal Res. 169, 34–47. doi: 10.1016/j.jvolgeores.2007.07.021
Carn, S. A., Froyd, K. D., Anderson, B. E., Wennberg, P., Crounse, J., Spencer, K., et al. (2011). In situ measurements of tropospheric volcanic plumes in Ecuador and Colombia during TC4. J. Geophys. Res. 116:D00J24. doi: 10.1029/2010JD014718
de Moor, J. M., Aiuppa, A., Avard, G., Wehrmann, H., Dunbar, N., Muller, C., et al. (2016). Turmoil at Turrialba Volcano (Costa Rica): degassing and eruptive processes inferred from high-frequency gas monitoring. J. Geophys. Res.121, 5761–5775. doi: 10.1002/2016JB013150
de Moor, J. M., Fischer, T. P., Sharp, Z. D., King, P. L., Wilke, M., Botcharnikov, R. E., et al. (2013). Sulfur degassing at Erta Ale (Ethiopia) and Masaya (Nicaragua) volcanoes: implications for degassing processes and oxygen fugacity of basaltic systems. Geochem. Geophys. Geosyst. 14, 4076-4108. doi: 10.1002/ggge.20255
Delmelle, P., Wadsworth, F. B., Maters, E. C., and Ayris, P. M. (2018). High temperature reactions between gases and ash particles in volcanic eruption plumes. Rev. Mineral. Geochem. 84, 285–308. doi: 10.2138/rmg.2018.84.8
Donovan, A., Tsanev, V., Oppenheimer, C., and Edmonds, M. (2014). Reactive halogens (BrO and OClO) detected in the plume of Soufrière Hills Volcano during an eruption hiatus. Geochem. Geophys. Geosyst. 15, 3346–3363. doi: 10.1002/2014GC005419
Galeazzo, T., Bekki, S., Martin, E., Savarino, J., and Arnold, S. R. (2018). Photochemical box-modelling of volcanic SO2 oxidation: isotopic constraints. Atmos. Chem. Phys. Discuss. 18, 17909–17931. doi: 10.5194/acp-2018-381
Gerlach, T. M. (2004). Volcanic sources of tropospheric ozone-depleting trace gases. Geochem. Geophys. Geosyst. 5:Q09007. doi: 10.1029/2004GC000747
Glarborg, P., and Marshall, P. (2013). Oxidation of reduced sulfur species: carbonyl sulfide. Int. J. Chem. Kinet. 45, 429–439. doi: 10.1002/kin.20778
Góger, S., Szabó, P., Czakó, G., and Lendvay, G. (2018). Flame inhibition chemistry: rate coefficients of the reactions of HBr with CH3 and OH radicals at high temperatures determined by quasiclassical trajectory calculations. Energy Fuels 32, 10100–10105. doi: 10.1021/acs.energyfuels.8b00989
Guttmann, A., Bobrowski, N., Roberts, T. J., Rudiger, J., and Hoffman, T. (2018). Advances in bromine speciation in volcanic plumes. Front. Earth Sci. 6:213. doi: 10.3389/feart.2018.00213
Heue, K.-P., Brenninkmeijer, C. A. M., Baker, A. K., Rauthe-Schöch, A., Walter, D., Wagner, T., et al. (2011). SO2 and BrO observation in the plume of the Eyjafjallajökull volcano 2010: CARIBIC and GOME-2 retrievals. Atmos. Chem. Phys. 11, 2973–2989. doi: 10.5194/acp-11-2973-2011
Hillman, S. E., Horwell, C., Densmore, A. L., Damby, D. E., Fubini, B., Ishimine, Y., et al. (2012). Sakurajima volcano: a physico-chemical study of the health consequences of long-term exposure to volcanic ash. Bull. Volcanol. 74, 913–930. doi: 10.1007/s00445-012-0575-3
Hobbs, P. V., Radke, L. F., Lyons, J. H., Ferek, R. J., Coffman, D. J., and Casadevall, T. J. (1991). Casadevall, Airborne measurements of particle and gas emissions from the 1990 volcanic eruptions of Mount Redoubt. J. Geophys. Res. 96, 18735–18752.
Hörmann, C., Sihler, H., Bobrowski, N., Beirle, S., Penning de Vries, M., Platt, U., et al. (2013). Systematic investigation of bromine monoxide in volcanic plumes from space by using the GOME-2 instrument. Atmos. Chem. Phys. 13, 4749–4781. doi: 10.5194/acp-13-4749-2013
Horwell, C., Fenoglio, I., Ragnarsdottir, K. V., Sparks, R. S. J., and Fubini, B. (2003). Surface reactivity of volcanic ash from the eruption of Soufrière Hills volcano, Montserrat, West Indies with implications for health hazards. Environ. Res. 93, 202–215. doi: 10.1016/s0013-9351(03)00044-6
Hoshyaripour, G. A., Hort, M., and Langmann, B. (2012). How does the hot core of a volcanic plume control the sulfur speciation in volcanic emission? Geochem. Geophys. Geosyst. 13:Q07004. doi: 10.1029/2011GC004020
Hoshyaripour, G. A., Hort, M., and Langmann, B. (2015). Ash iron mobilization through physicochemical processing in volcanic eruption plumes: a numerical modeling approach. Atmos. Chem. Phys. 15, 9361–9379. doi: 10.5194/acp-15-9361-2015
Ilyinskaya, E., Martin, R., and Oppenheimer, C. (2012). Aerosol formation in basaltic lava fountaining: eyjafjallajökull volcano, Iceland. J. Geophys. Res. Atmos. 117:D00U27. doi: 10.1029/2011JD016811
Jourdain, L., Roberts, T. J., Pirre, M., and Josse, B. (2016). Modeling the reactive halogen plume from Ambrym volcano and its impact on the troposphere with the CCATT-BRAMS mesoscale model. Atmos. Chem. Phys. 16, 12099–12125. doi: 10.5194/acp-16-12099-2016
Kee, R. J., Rupley, F. M., Miller, J. A., Coltrin, M. E., Grcar, J. F., Meeks, E., et al. (2000). CHEMKIN Collection, Release 3.6. San Diego, CA: Reaction Design. Inc.
Keiding, J. K., and Sigmarsson, O. (2012). Geothermobarometry of the 2010 Eyjafjallajökull eruption: new constraints on Icelandic magma plumbing systems. J. Geophys. Res. 117:B00C09. doi: 10.1029/2011JB008829
Kern, C., and Lyons, J. J. (2018). Spatial distribution of halogen oxides in the plume of Mount Pagan Volcano, Mariana Islands. Geophys. Res. Lett. 45, 9588–9596. doi: 10.1029/2018GL079245
Kroll, J. H., Cross, E. S., Hunter, J. F., Pai, S., Wallace, L. M. M., Croteau, P. I., et al. (2015). Atmospheric evolution of sulfur emissions from Kilauea: reat-time measurements of oxidation, dilution, and neutralization within a volcanic plume. Environ. Sci. Technol. 49, 4129–4137. doi: 10.1021/es506119x
Martin, R. S., and Ilyinskaya, E. (2011). Volcanic lightning as a source of reactive radical species in eruption plumes. Geochem. Geophys. Geosyst. 12:Q03002. doi: 10.1029/2010GC003420
Martin, R. S., Ilyinskaya, E., and Oppenheimer, C. (2012). The enigma of reactive nitrogen in volcanic emissions. Geochim. Cosmochim. Acta 95, 93–105. doi: 10.1016/j.gca.2012.07.027
Martin, R. S., Mather, T. A., and Pyle, D. M. (2006). High-temperature mixtures of magmatic and atmospheric gases. Geochem. Geophys. Geosyst. 7:Q04006. doi: 10.1029/2005GC001186
Martin, R. S., Mather, T. A., and Pyle, D. M. (2007). Volcanic emissions and the early earth atmosphere. Geochim. Cosmochim. Acta 71, 3673–3685.
Martin, R. S., Mather, T. A., Pyle, D. M., Power, M., Allen, A. G., Aiuppa, A., et al. (2008). Composition-resolved size distributions of volcanic aerosols in the Mt. Etna plumes. J. Geophys. Res. 113:D17211. doi: 10.1029/2007JD009648
Martin, R. S., Robert, T. J., Mather, T. A., and Pyle, D. M. (2009). The implications of H2S and H2 kinetic stability in high-T mixtures of magmatic and atmospheric gases for the production of oxidized trace species (e.g., BrO and NOx). Chem. Geol. 263, 143–150. doi: 10.1016/j.chemgeo.2008.12.028
Martin, R. S., Sawyer, G. M., Spanpinato, L., Salerno, G. G., Ramirez, C., Ilyinskaya, E., et al. (2010). A total volatile inventory for Masaya Volcano, Nicaragua. J. Geophys. Res. 115:B09215. doi: 10.1029/2010JB007480
Martin, R. S., Witt, M. L. I., Pyle, D. M., Mather, T. A., Watt, S. F. L., Bagnato, E., et al. (2011). Rapid oxidation of mercury (Hg) at volcanic vents: insights from high temperature thermodynamic models of Mt Etna’s emissions. Chem. Geol. 283, 279–286. doi: 10.1016/j.chemgeo.2011.01.027
Mastin, L. G. (2007). A user-friendly one-dimensional model for wet volcanic plumes. Geochem. Geophys. Geosyst. 8:Q03014. doi: 10.1029/2006GC001455
Mather, T. A., Allen, A. G., Davison, B. M., Pyle, D. M., Oppenheimer, C., and McGonigle, A. J. S. (2004a). Nitric acid from volcanoes. Earth Planet. Sci. Lett. 218, 17–30. doi: 10.1016/s0012-821x(03)00640-x
Mather, T. A., Allen, A. G., Oppenheimer, C., Pyle, D. M., and McGonigle, A. J. S. (2003). Size-resolved characterisation of soluble ions in the particles in the tropospheric plume of Masaya Volcano, Nicaragua: origins and plume processing. J. Atmos. Chem. 46, 207–237.
Mather, T. A., Tsanev, V. I., Pyle, D. M., McGonigle, A. J. S., Oppenheimer, C., and Allen, A. G. (2004b). Characterization and evolution of tropospheric plumes from Lascar and Villarrica volcanoes, Chile. J. Geophys. Res. Atmos. 109:D21303. doi: 10.1029/2004JD004934
Mathieu, O., Mulvihill, C., and Petersen, E. L. (2017). Shock-tube water time-histories and ignition delay time measurements for H2S near atmospheric pressure. Proc. Combust. Inst. 36, 4019–4027. doi: 10.1016/j.proci.2016.06.027
Moussallam, Y., Oppenheimer, C., Aiuppa, A., Gaetano, G., Moussallam, M., and Kype, P. (2012). Hydrogen emissions from Erebus volcano, Antarctica. Bull. Volcanol. 74, 2109–2120. doi: 10.1007/s00445-012-0649-2
Naughton, J. J., Lewis, V., Thomas, D., and Finlayson, J. B. (1975). Fume compositions found at various stages of activity at Kilauea Volcano, Hawaii, J. Geophys. Res. 80, 2963–2966. doi: 10.1029/JC080i021p02963
Oppenheimer, C., Fischer, T. P., and Scaillet, B. (2014). Volcanic Degassing: Process and Impact. Treatise on Geochemistry, 2nd Edn. Amsterdam: Elsevier, 111–179.
Oppenheimer, C., Keyp, P., Eisele, F., Crawford, J., Huey, G., Tanner, D., et al. (2010). Atmospheric chemistry of an Antarctic volcanic plume. J. Geophys. Res. 115:D04303. doi: 10.1029/2009JD011910
Oppenheimer, C., and Kyle, P. R. (2008). Probing the magma plumbing of Erebus volcano, Antarctica, by open-path FTIR spectroscopy of gas emissions. J. Volcanol. Geotherm. Res. 177, 743–754. doi: 10.1016/j.jvolgeores.2007.08.022
Oppenheimer, C., Scaillet, B., Woods, A., Sutton, J. A., Elias, T., and Moussallam, Y. (2018). Influence of eruptive style on volcanic gas emission chemistry and temperature. Nat. Geosci. 11, 678–681. doi: 10.1038/s41561-018-0194-5
Ravishankara, A. R., Wine, P. H., Wells, J. R., and Thompson, R. L. (1985). Kinetic study of the reaction of OH with HCl from 240–1055 K. Int. J. Chem. Kinet. 17, 1281–1297. doi: 10.1002/kin.550171206
Roberts, T. J., Braban, C. F., Martin, R. S., Oppenheimer, C., Adams, J. W., Cox, R. A., et al. (2009). Modelling reactive halogen formation and ozone depletion in volcanic plumes. Chem. Geol. 263, 151–163. doi: 10.1016/j.chemgeo.2008.11.012
Roberts, T. J., Braban, C. F., Oppenheimer, C., Martin, R. S., Freshwater, R. A., Dawson, D. H., et al. (2012). Electrochemical sensing of volcanic gases. Chem. Geol. 332-333, 74–91. doi: 10.1016/j.chemgeo.2012.08.027
Roberts, T. J., Lurton, T., Giudice, G., Liuzzo, M., Aiuppa, A., Coltelli, M., et al. (2017). Validation of a novel Multi-Gas sensor for volcanic HCl alongside H2S and SO2 at Mt. Etna. Bull. Volcanol. 79:36.
Roberts, T. J., Martin, R. S., and Jourdain, L. (2014). Reactive halogen chemistry in Mt Etna’s volcanic plume: the influence of total Br, high temperature processing, aerosol loading and plume-air mixing (volcanic emissions flux). Atmos. Chem. Phys. 14, 11201–11219. doi: 10.5194/acp-14-11201-12014
Roberts, T. J., Vignelles, D., Liuzzo, M., Giudice, G., Aiuppa, A., Coltelli, M., et al. (2018). The primary volcanic aerosol emission from Mt Etna: size-resolved particles with SO2 and role in plume reactive halogen chemistry. Geochim. Cosmochim. Acta 222, 74–93. doi: 10.1016/j.gca.2017.09.040
Rose, W. I., Millard, G. A., Mather, T. A., Hunton, D. E., Anderson, B., Oppenheimer, C., et al. (2006). Atmospheric chemistry of a 33–34 hour old volcanic cloud from Hekla Volcano (Iceland): insights from direct sampling and the application of chemical box modeling. J. Geophys. Res. Atmos. 111:D20206. doi: 10.1029/2005JD006872
Sahyoun, M., Freney, E., Brito, J., Duplissy, J., Gouhier, M., Colomb, A., et al. (2019). Evidence of new particle formation within Etna and Stromboli volcanic plumes and its parameterization from airborne in-situ measurements. J. Geophys. Res. Atmos. 124, 5650–5668. doi: 10.1029/2018JD028882
Schumann, U., Weinzierl, B., Reitebuch, O., Schlager, H., Miniki, A., Forster, C., et al. (2011). Airborne observations of the Eyjafjalla volcano ash cloud over Europe during air space closure in April and May 2010. Atmos. Chem. Phys. 11, 2245–2279. doi: 10.5194/acp-11-2245-2011
Surl, L., Donohoue, D., Aiuppa, A., Bobrowski, N., and von Glasow, R. (2015). Quantification of the depletion of ozone in the plume of Mt Etna. Atmos. Chem. Phys. 15, 2613–2628. doi: 10.5194/acp-15-2613-2015
Vance, A., McGonigle, A. J. S., Aiuppa, A., Stith, J. L., Turnbull, K., and von Glasow, R. (2010). Ozone depletion in tropospheric volcanic plumes. Geophys. Res. Lett. 37:L22802. doi: 10.1029/2010GL044997
Voigt, C., Jessberge, P., Jurkat, T., Kaufmann, S., Baumann, R., Schlager, H., et al. (2014). Evolution of CO2, SO2, HCl and HNO3 in the volcanic plumes from Etna. Geophys. Res. Lett. 41, 2196–2203. doi: 10.1002/2013GL058974
von Glasow, R. (2010). Atmospheric chemistry in volcanic plumes. Proc. Nat. Acad. Sci. U.S.A. 107, 6594–6599. doi: 10.1073/pnas.0913164107
Woodhouse, M. J., Hogg, A. J., Philips, J. C., and Sparks, R. S. J. (2013). Interaction between volcanic plumes and wind during the 2010 Eyjafjallajökull eruption, Iceland. J. Geophys. Res. 118, 92–109. doi: 10.1029/2012JB009592
Keywords: thermodynamic equilibrium model HSC, combustion kinetics model chemkin, high-temperature, magmatic gas emission, at-source primary sulfate, volcano plume, volcanic eruption, sulfuric acid
Citation: Roberts T, Dayma G and Oppenheimer C (2019) Reaction Rates Control High-Temperature Chemistry of Volcanic Gases in Air. Front. Earth Sci. 7:154. doi: 10.3389/feart.2019.00154
Received: 06 October 2018; Accepted: 03 June 2019;
Published: 03 July 2019.
Edited by:
Alessandro Aiuppa, University of Palermo, ItalyReviewed by:
Taryn Lopez, University of Alaska Fairbanks, United StatesCopyright © 2019 Roberts, Dayma and Oppenheimer. This is an open-access article distributed under the terms of the Creative Commons Attribution License (CC BY). The use, distribution or reproduction in other forums is permitted, provided the original author(s) and the copyright owner(s) are credited and that the original publication in this journal is cited, in accordance with accepted academic practice. No use, distribution or reproduction is permitted which does not comply with these terms.
*Correspondence: Tjarda Roberts, VGphcmRhLlJvYmVydHNAY25ycy1vcmxlYW5zLmZy
Disclaimer: All claims expressed in this article are solely those of the authors and do not necessarily represent those of their affiliated organizations, or those of the publisher, the editors and the reviewers. Any product that may be evaluated in this article or claim that may be made by its manufacturer is not guaranteed or endorsed by the publisher.
Research integrity at Frontiers
Learn more about the work of our research integrity team to safeguard the quality of each article we publish.