 Simon Warnach1,2*
 Nicole Bobrowski1,2
 Silvana Hidalgo3Santiago Arellano4Holger Sihler1,2
 Florian Dinger1,2Peter Lübcke2
 Jean Battaglia5
 Alexander Steele6Bo Galle4
 Ulrich Platt1,2Thomas Wagner1
- 1Max Planck Institute for Chemistry, Satellite Remote Sensing, Mainz, Germany
- 2Institute of Environmental Physics, University of Heidelberg, Heidelberg, Germany
- 3Instituto Geofísico, Escuela Politécnica Nacional, Quito, Ecuador
- 4Department of Space, Earth and Environment, Chalmers University of Technology, Gothenburg, Sweden
- 5Laboratoire Magmas et Volcans, Observatoire de Physique du Globe de Clermont-Ferrand (OPGC), IRD, CNRS, Université Clermont Auvergne, Aubière, France
- 6UCL Hazard Centre, Department of Earth Sciences, University College London, London, United Kingdom
Recent long-term observations of the bromine monoxide (BrO) to sulphur dioxide (SO2) molar ratio in volcanic plumes have suggested a link between changes in the BrO/SO2 ratio and the volcanic activity. Nevertheless, understanding of the mechanisms determining this link is still limited due to the lack of studies on volcanic bromine release from the melt into the atmosphere. We present the results of 10 years (2007–2017) of observations of the BrO/SO2 molar ratio in the volcanic plume of Tungurahua volcano, Ecuador. Following the nearly continuous eruptive activity from 1999 to 2008, Tungurahua showed alternating phases of eruptive activity separated by periods of quiescence between late 2008 and March 2016, after which degassing intensity decreased below detection. By comparing the BrO/SO2 molar ratios collected from 13 eruptive phases to volcanic activity, this study aims to broaden the global observational database investigating their link. For this purpose, we combine three different methods to retrieve the BrO/SO2 molar ratio to analyse variations over different timescales. We identify a cyclic pattern in BrO/SO2 molar ratios for 11 of the 13 eruptive phases. The phases are initialised by low BrO/SO2 molar ratios between 2 and 6 × 10⁻⁵ coinciding with vulcanian-type activity followed by a strong increase to ratios ranging between 4 and 17 × 10−5 when eruptive dynamism shifts to strombolian. For five phases, we additionally observe a progressive decrease to the initial values of 2 to 5 × 10⁻⁵ toward the end of the phase. This clear pattern indicates a connection between the BrO/SO2 molar ratio and eruptive dynamics. Based on our new data, we propose a conceptual model of the volcanic processes taking place at Tungurahua during the eruptive phases. Our data furthermore indicate that maximal BrO/SO2 molar ratios observed during each phase could be related to the input of volatile-rich magma into the active part of the volcanic system of Tungurahua. This study shows that long-term BrO/SO2 molar ratios can be used as a proxy for the volatile status as well as temporal evolution of the volcanic system.
Introduction
The molar ratios of gas species in volcanic plumes offer crucial information about volcanic processes. Sulphur dioxide (SO2) emissions have in some cases proven to be a good forecasting tool for volcanic eruptions (e.g. Malinconico, 1979; Olmos et al., 2007; Hidalgo et al., 2018). Moreover, the halogen to sulphur ratios have been used for detecting changes in volcanic activity due to the different melt-fluid partitioning coefficients of these elements (Noguchi and Kamiya, 1963; Carrol and Holloway, 1994).
Changes in the chlorine to sulphur ratio have been suggested to forecast eruptions (Menyailov, 1975) and to distinguish different types of activity (Pennisi and Cloarec, 1998; Allard et al., 2005; Aiuppa, 2009; Spina et al., 2015). Several studies interpreting these measurements advocated preferred release of chlorine and fluorine at low pressures corresponding to shallow depth beneath the volcanic vent (Noguchi and Kamiya, 1963; Villemant and Boudon, 1999; Aiuppa et al., 2002; Burton et al., 2007; Edmonds et al., 2009). For bromine in contrast, the degassing processes are still not fully understood and lack comparison of measurements with model data. Several studies investigated melt-fluid partitioning of bromine with respect to sulphur using artificial melts (Bureau et al., 2000, 2010; Cochain et al., 2015) and concluded that the partition coefficient highly depends on the melt composition. A recent study using natural melts suggested efficient degassing of bromine at shallow depths beneath the volcanic vent similar to chlorine behaviour (Cadoux et al., 2018).
Since the first detection of bromine monoxide (BrO) inside a volcanic plume (Bobrowski et al., 2003), BrO as well as the BrO/SO2 molar ratio have been retrieved at various volcanoes using ground-based measurements (e.g. Oppenheimer et al., 2006; Bobrowski and Platt, 2007; Kern et al., 2009; Boichu et al., 2011; Kelly et al., 2013) as well as from satellite (Theys et al., 2009; Hörmann et al., 2013). In addition, bromine chemistry in volcanic plumes has also been investigated through plume-chemistry models (e.g. Bobrowski et al., 2007; von Glasow, 2010; Roberts et al., 2014). A review of the current knowledge of bromine chemistry in volcanic plumes as well as a collection of all volcanic bromine measurements since 2003 was reported by Gutmann et al. (2018).
Recent studies of long-term BrO/SO2 datasets have revealed changes in connection with varying volcanic activity at Mount Etna (Bobrowski and Giuffrida, 2012) and Nevado del Ruiz (Lübcke et al., 2014), or due to external forcing such as Earth tides (Dinger et al., 2018). The advantage of the BrO/SO2 molar ratio compared to other halogen/sulphur ratios is that both species can be measured simultaneously via automated remote-sensing using scattered sunlight spectra applying the Differential Optical Absorption Spectroscopy (DOAS) technique (Platt and Stutz, 2008). This allows for continuous long-term data retrieval throughout different states of volcanic activity (Galle et al., 2010).
This study focuses on Tungurahua volcano, an andesitic subduction volcano located 120 km south of Quito, Ecuador. The average magma supply rates for this volcano have been estimated at ≈1.5 × 10⁶ m3yr−1 over the last 2300 years (Hall et al., 1999). Regular eruptions occurred at least once per century (Pennec et al., 2008; Bablon et al., 2018). Hence, Tungurahua is among the most active volcanoes in the northern Andes in recent times (Hall et al., 1999; Wright et al., 2012). The most recent eruptive cycle started in September 1999. From 1999 until late 2008 Tungurahua exhibited long periods of continuous eruptive activity (Arellano et al., 2008; Samaniego et al., 2011; Hidalgo et al., 2015), with typical SO2 emission rates of the order of 1000 t/d derived from ground-based measurements (Arellano et al., 2008; Galle et al., 2010) and from satellite (Carn et al., 2008; McCormick et al., 2014). From 2008 to 2016, however, the activity has been characterised by alternating eruptive phases and relative quiescence. Eruptive phases have displayed strombolian to vulcanian explosions, which were accompanied by persistent ash and gas emissions, and sporadic pyroclastic flows and lava effusion (Hidalgo et al., 2015).
We investigate the variation of the BrO/SO2 molar ratio in the plume of Tungurahua from the spectral data recorded by a network of four autonomous scanning-DOAS stations over the period March 2007 to January 2017. To improve readability, we will refer to all ratios by omitting “molar” in the rest of the manuscript, e.g. BrO/SO2 ratio. The different eruptive phases are decomposed into different stages, in order to identify characteristic patterns in the BrO/SO2 ratio. We identify a pattern which was repeatedly observed throughout phases over the whole period of investigation. We interpret it with respect to magmatic processes and volcanic activity and derive a conceptual model of the eruptive dynamic representative for each eruptive phase. Lastly, we also discuss the behaviour of the BrO/SO2 ratios in relation to different types of explosive activity.
Materials and Methods
Measurement Setup
At Tungurahua volcano, four stations were run during the study period by the IG-EPN (Instituto Geofísico – Escuela Politécnica Nacional), all of which operated with NOVAC (Network for Observation of Volcanic and Atmospheric Change) version 1 instruments (Galle et al., 2010). The instruments were located 6–11 km from the volcanic vent, with three stations to the west of the crater, in the direction of the prevalent plume direction, and one to the north-east (for a detailed description of the location of the instruments see Hidalgo et al., 2015).
NOVAC currently comprises automatic scanning DOAS instruments at more than 40 volcanoes. The instruments measure volcanic plume constituents by performing a scan across the sky, which is comprised typically of 51 spectra obtained in steps of 3.6°. The scanning plane intersects the volcanic plume under favourable wind conditions. Furthermore, the intersection of simultaneous measurements by different instruments is used to derive plume height and direction, allowing – with knowledge of the wind speed – for the calculation of fluxes (Galle et al., 2010). However, these variables are not needed to extract BrO/SO2 ratios, which purely depend on the spectral measurements.
Spectroscopic Retrieval
The amount of SO2 and BrO in the plume was retrieved via a DOAS analysis comparing the spectra measured in the direction of the volcanic plume with spectra in a direction not intercepting the volcanic plume. To improve the signal-to-noise ratio in this work the co-adding retrieval algorithm was used as described in Lübcke et al. (2014): The algorithm identifies 10 plume spectra (having the highest SO2 values) and 10 reference spectra (having the lowest SO2 values) in each scan. The algorithm then co-adds these spectra, respectively from four consecutive scans (i.e. 40 spectra of each type in total). The resulting spectra, which are from now on referred to as “co-added” spectra, are then used as measurement and reference spectrum in the DOAS fitting algorithm, respectively (Platt and Stutz, 2008). This yielded one co-added BrO as well as one SO2 mean slant column density (SCD) roughly every 30 min.
Fit Parameter
In addition to the co-added plume and reference spectra, the DOAS fitting algorithm also included absorption cross-sections for SO2 (Vandaele et al., 2009) and O3 (Burrows et al., 1999) in the SO2 spectral fit region (314.8–326.8 nm) and SO2, BrO (Fleischmann et al., 2004), O4 (Hermans et al., 2003), NO2 (Vandaele et al., 1998) and CH2O (Meller and Moortgat, 2000) in the BrO spectral fit region (330.6–352.75 nm) as well as a third-order polynomial to account for broadband absorption structures, Mie, and Rayleigh scattering. Two spectra were included to account for the Ring effect (Grainger and Ring, 1962) – the standard Ring spectrum as well as a wavelength dependent Ring spectrum (derived from the original Ring spectrum by multiplication with λ4, where λ represents wavelength; Wagner et al., 2009). The fit settings were chosen as an outcome of the study by Vogel et al. (2013).
The detection limit can be derived as a multiple of the DOAS fit error based on Platt and Stutz (2008). In our study we used three times the fit error – which is usually a quite conservative estimate – yielding here a mean detection limit of 4.9 × 10¹⁶ molecules/cm2 (SO2) and 4.9 × 10¹³ molecules/cm2 (BrO). The latter fits very well to the random fluctuations of BrO around zero when SO2 SCDs are close to zero (i.e. no gas emissions), which similarly span roughly ±5 × 10¹³ molecules/cm2. For SO2 this fluctuation is hardly visible, because the signal is up to two orders of magnitude larger than the detection limit.
Determining the BrO/SO2 Ratio
The BrO/SO2 ratio for a series of simultaneous measurements of both species inside a volcanic plume is usually obtained by performing a linear regression for BrO as a function of SO2 (e.g. Bobrowski et al., 2003, 2007; Bobrowski and Giuffrida, 2012; Hörmann et al., 2013). The linear regression was performed using the error-weighted orthogonal regression algorithm developed by Cantrell (2008).
For this study, it was employed in two ways:
1. Daily regression: This regression takes all co-added BrO and SO2 data of a particular day to retrieve daily BrO/SO2 ratios in order to observe short-term changes in the BrO/SO2 ratio. To ensure the quality of the retrieved BrO/SO2 ratio, days were considered only if at least one data point exceeded SO2 SCDs of 5 × 10¹⁷ molecules/cm2 and the regression fit error was below 1.5 × 10⁻⁵.
2. Period regression: Data acquired over the period of several days/weeks were evaluated using the same methodology as for the daily regression. The beginning and end of these periods were chosen when a change in the daily BrO/SO2 ratios could be detected. For long periods without significant change, the beginning and end of these periods were additionally chosen when changes in the classification of explosive activity from Hidalgo et al. (2015) occurred. Only those periods where at least five co-added SO2 SCDs exceeded 5 × 10¹⁷ molecules/cm2, the maximum SO2 SCD exceeded 7 × 10¹⁷ molecules/cm2, and the regression fit error was below 1 × 10⁻⁵ were taken into account.
We also calculated the BrO/SO2 ratio by taking the BrO/SO2 ratio of every co-added data point with high SO2 signal (SO2 SCD > 7 × 10¹⁷ molecules/cm2). In a second step, the daily mean BrO/SO2 ratio was calculated as the error-weighted daily mean over these single BrO/SO2 ratios. To ensure robust results we calculated the daily mean BrO/SO2 ratio only if there were at least five data points above the SO2 threshold. An example of the results obtained by this algorithm for 28 December 2010 is given in Figure 1A. This method was used by Lübcke et al. (2014) for NOVAC data and we will refer to it as “daily means” in this study.
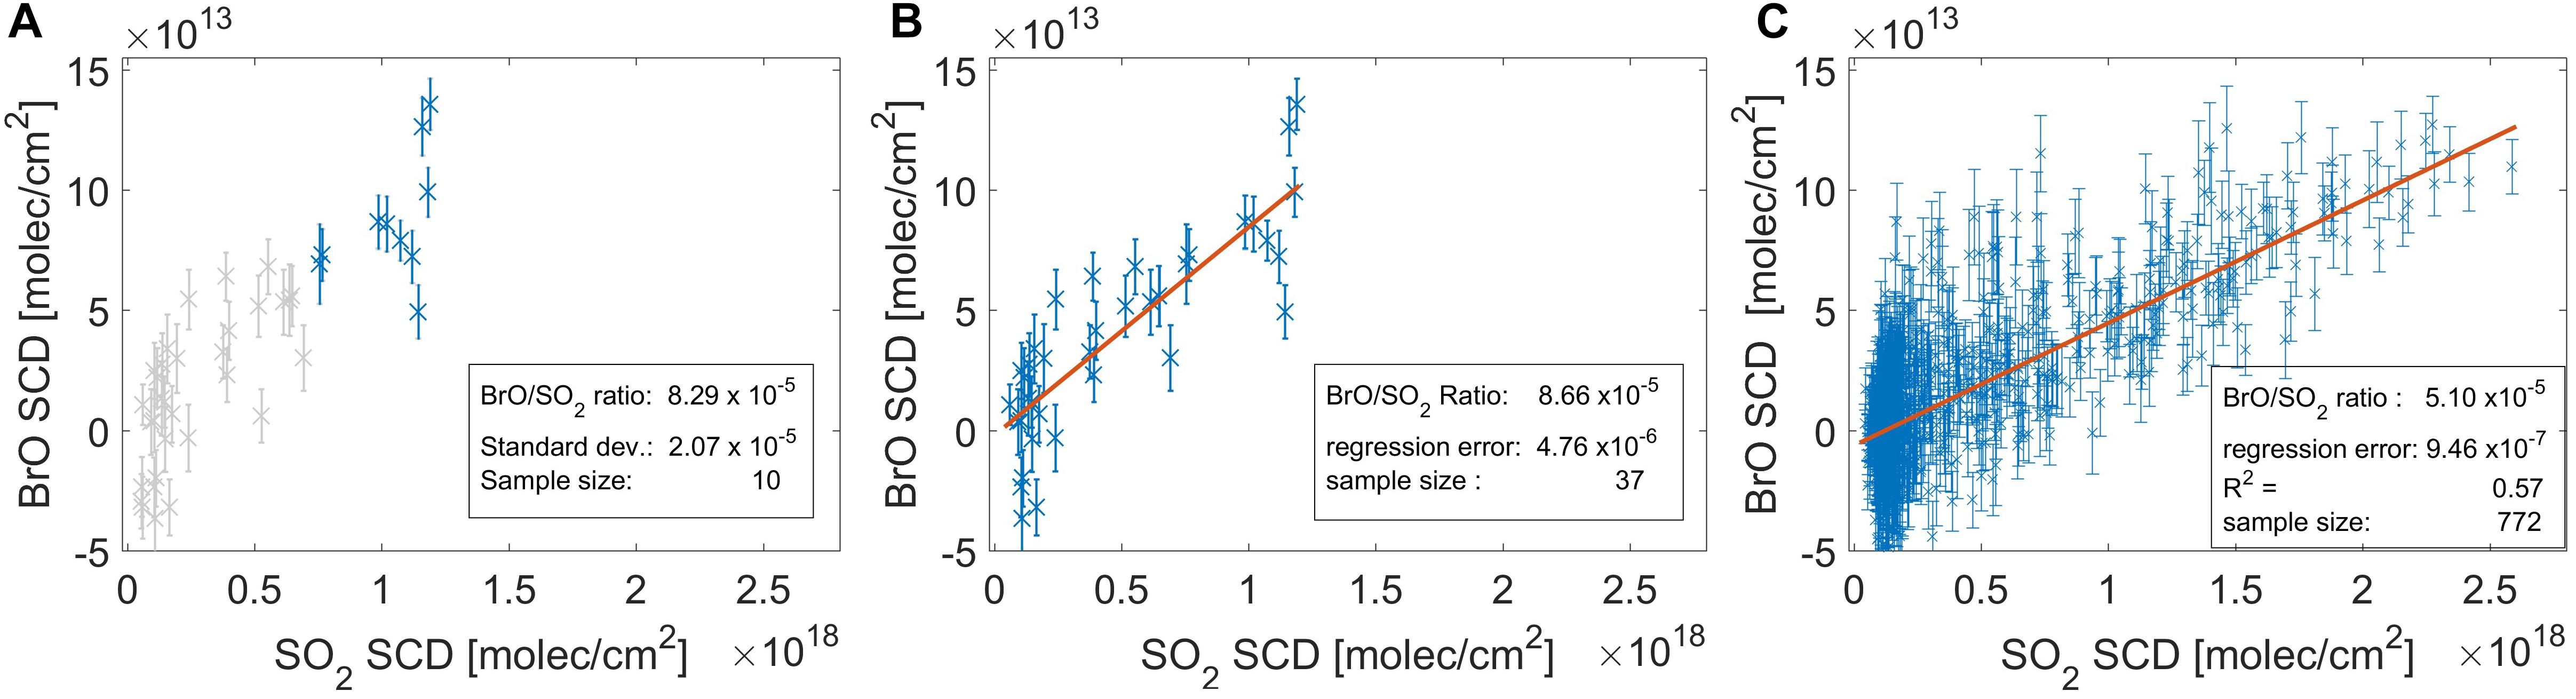
Figure 1. Examples for the three different methods to calculate the BrO/SO2 ratio: (A) “daily mean” method for 28 December 2010. The complete set of retrieved BrO and SO2 SCDs during this day is plotted in grey. The daily mean BrO/SO2 ratio is calculated as the mean from all values exceeding the SO2 threshold of 7 × 10¹⁷ molecules/cm2 (blue). Calculated ratio: 8.29 × 10⁻⁵. (B) Daily regression for 28 December 2010. Retrieved ratio: 8.66 × 10⁻⁵. (C) Period regression for the period from 22 November–25 December 2010, Retrieved ratio: 5.10 × 10⁻⁵.
In this study, we introduce a scheme including all three methods, the daily means method as well as the two linear regression methods to achieve a sufficient set of BrO/SO2 ratios. They are presented in Figure 1. The daily mean method yielded BrO/SO2 ratios on 277 days, while the daily regression was successful on 425 days. Of the 276 days, in which both methods yielded a BrO/SO2 ratio, we observed a good correlation between the two methods. However, the daily mean method consistently yielded slightly lower ratios (we retrieved a slope of 0.86 ± 0.05; see Figure 2). The results of all daily mean and daily regression BrO/SO2 ratios as a function of time are plotted in Figure 3C.
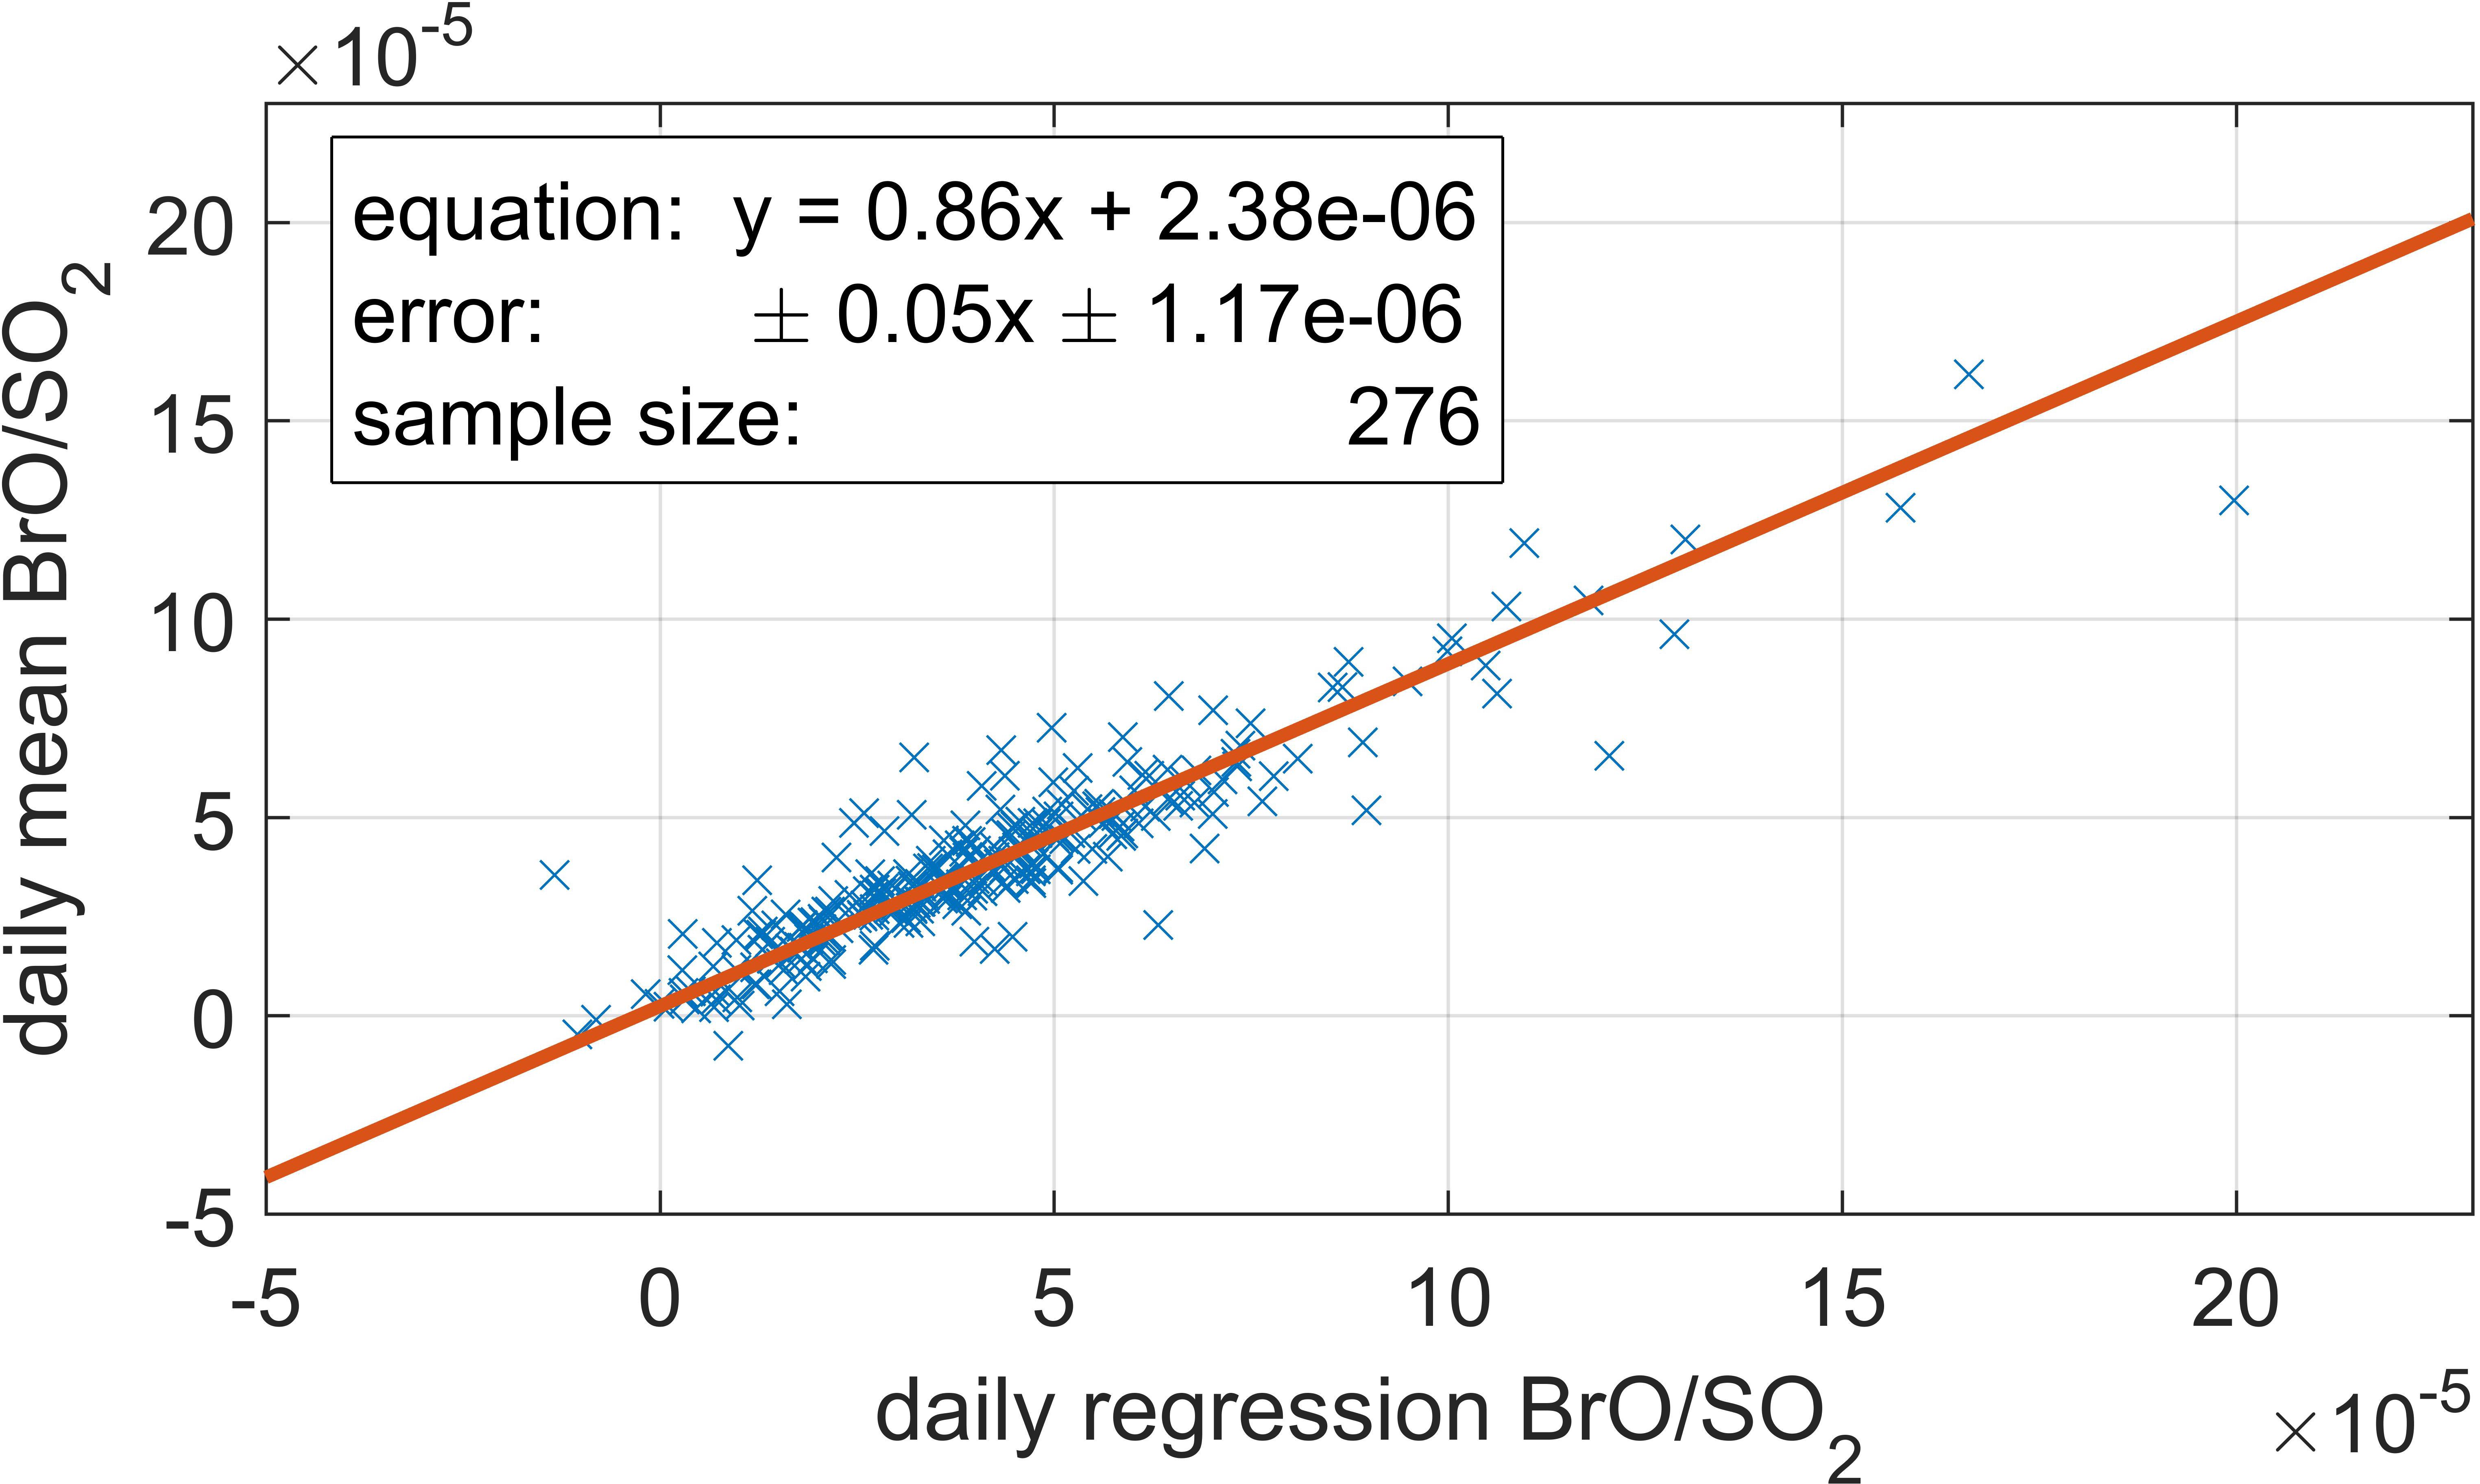
Figure 2. Error-weighted linear regression plot (using the method from Cantrell, 2008) between the daily mean and the daily regression BrO/SO2 ratios of the 276 acquisition days, in which both methods yielded a BrO/SO2 ratio. The fit result is written in the upper left corner and plotted by a red line. Error bars have been omitted for the sake of clarity.
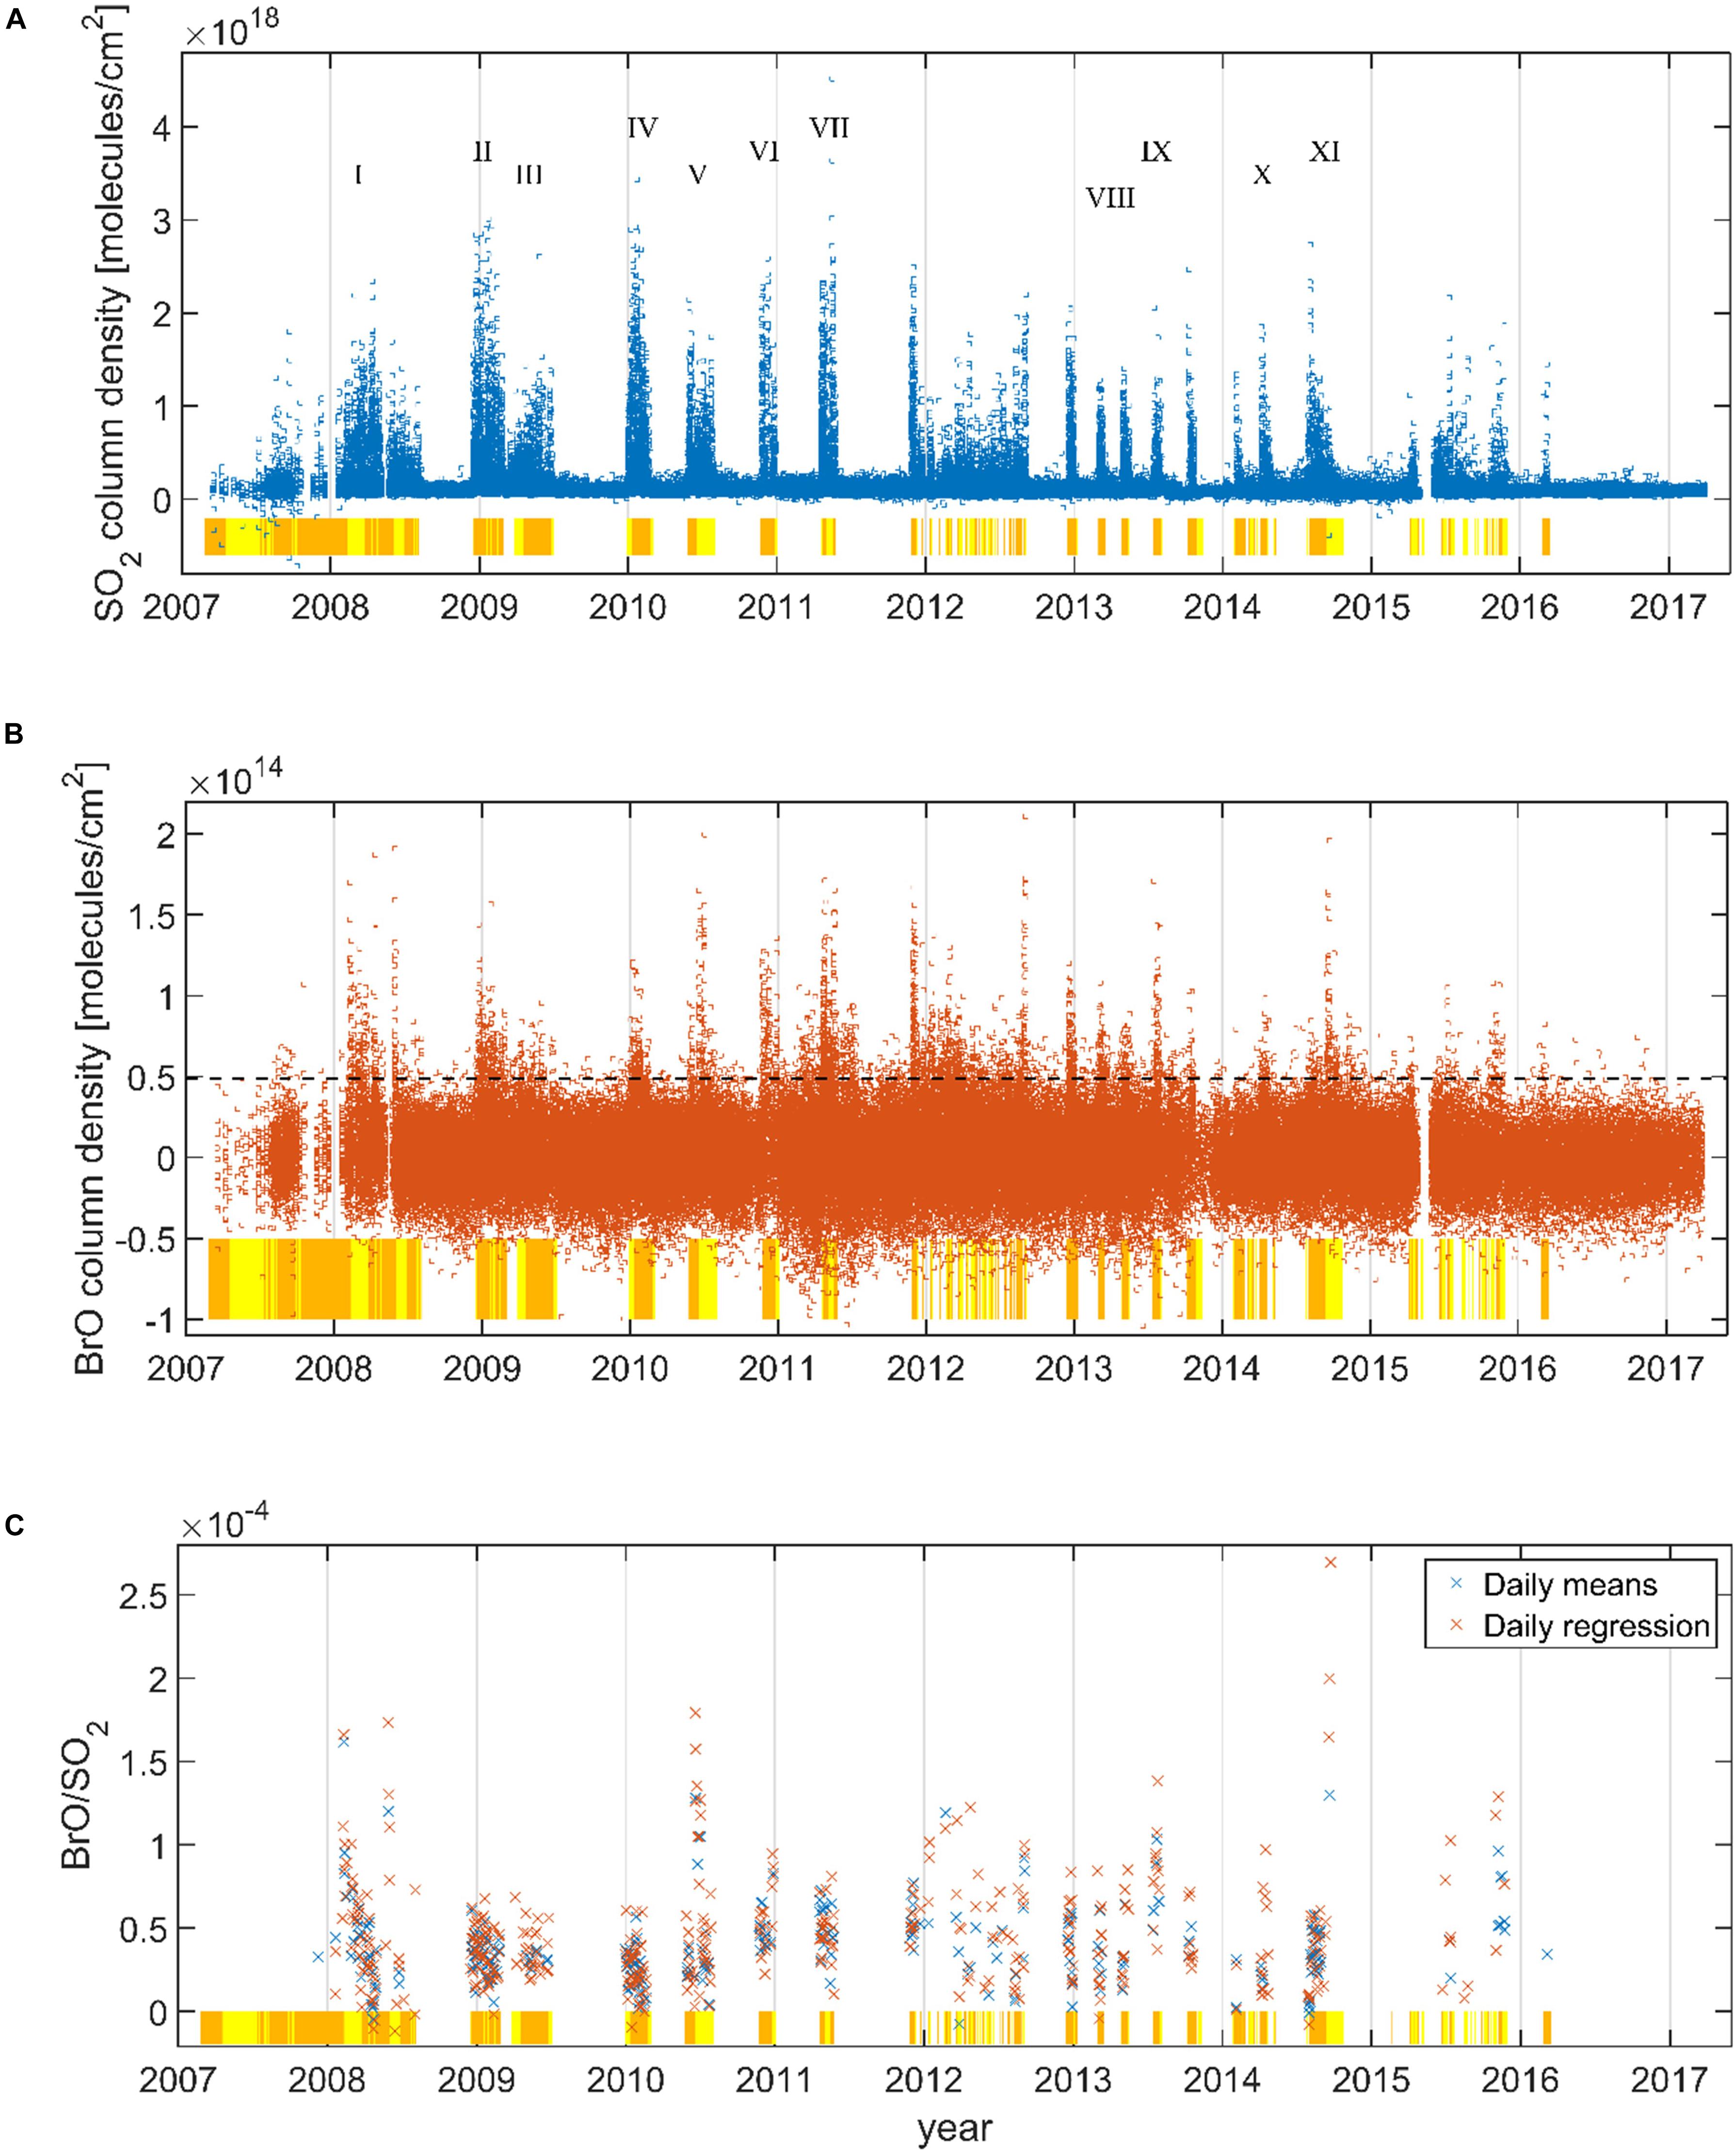
Figure 3. Time-series of the co-added results for (A) SO2 SCDs and (B) BrO SCDs for the NOVAC stations at Tungurahua volcano from March 2007 until March 2017. (C) the daily mean BrO/SO2 ratios are plotted for both calculation methods. The coloured areas at the bottom of each plos indicates the volcanic activity derived from seismo-acoustic data (Hidalgo et al., 2015): high explosive activity (orange) and low explosive activity (yellow). The SO2 detection limit is 4.9 × 10¹⁶ molecules/cm2 and the BrO detection limit is 4.9 × 10¹³ molecules/cm2 (indicated by the dashed line). The 11 eruptive phases discussed later in the manuscript are included with roman numerals in (A).
Volcanic Activity Classification
We used the classification criteria of volcanic activity described by Hidalgo et al. (2015), which includes the eruptive and quiescent phases from 2007 to 2013. We extended this classification in order to cover our study period following the same criteria (i.e. seismo-acoustic records and visual observations).
Three types of activity were distinguished during the study period: (1) Quiescence, (2) Low explosive activity and (3) High explosive activity. Episodes of high explosive activity are those in which discrete vulcanian explosions occurred, with the explosions themselves being classified as vulcanian when their mean acoustic excess pressures were greater than 100 Pa at a distance of 1 km from the vent (Johnson, 2003). Episodes of low explosive activity are those in which no vulcanian explosions were present. These episodes were instead characterised by Strombolian-type activity, during which the explosions had excess pressures smaller than the 100 Pa threshold (Johnson, 2003). In both cases, explosive activity is commonly accompanied by intense gas and ash emissions. During quiescent episodes, the seismic activity was generally weak and merely a few long period and volcano-tectonic earthquakes were detected.
Results
BrO and SO2 SCDs From Tungurahua
Over the study period between 2007 and 2017, 18 phases of high SO2 SCDs (of the order of 1018 molecules/cm2) could be identified from the NOVAC data. They were separated by periods of weak SO2 degassing, where the SO2 SCDs generally did not exceed 1.6 × 10¹⁷ molecules/cm2. BrO SCDs exceeded the detection limit of 4.8 × 10¹³ molecules/cm2 only during phases where high SO2 SCDs were measured. In those phases typical BrO SCDs around 8 × 10¹³ molecules/cm2 were observed. During the phases of weak SO2, BrO fluctuated around zero and was below detection. The results of BrO and SO2 from Tungurahua are displayed in Figures 3A,B.
BrO/SO2 Ratios
BrO/SO2 ratios typically ranged between 2 and 8 × 10⁻⁵, which is similar to ratios observed at other arc volcanoes in the Northern Volcanic Zone of the Andes, such as Nevado del Ruiz (Lübcke et al., 2014) and Cotopaxi (Dinger et al., 2018). In 2009 and the first half of 2010, relatively constant BrO/SO2 ratios of 2 to 6 × 10⁻⁵ were observed. This contrasts with periods in 2008 and after 2010, where a larger range of ratios between 2 and 20 × 10−5 were detected. During the intermitting periods of weak SO2 degassing, we could only infer an upper limit for the BrO/SO2 ratio, calculated as the ratio between the BrO detection limit and the maximal SO2 SCD during these periods:
Since this value far exceeds even the largest BrO/SO2 ratios observed during phases of high SO2 SCDs, we are not able to draw any conclusion from BrO/SO2 ratios during these phases of low SO2 at Tungurahua.
Dynamic of the BrO/SO2 Ratio at Tungurahua
We identified changing BrO/SO2 ratios during 11 phases of high SO2 SCDs, which we number with roman numerals in chronological order (see Figure 3A). We identified a characteristic pattern in the BrO/SO2 ratio over the course of each phase. For two phases (I and VII) the pattern is observed more than once and we separate this by adding the suffix a and b to the phase numbering, thus adding up to 13 phases, where we observe the BrO/SO2 pattern. This pattern can be divided into four stages, consisting of two initial stages (0 and 1), followed by an intermediate stage 2 and an ending stage 3. The separation of the initial stages into stage 0 and 1 could only be derived for four phases.
Stage 0 exclusively occurred in phases II, III, IV, and VII and typically lasted for periods of time between 2 and 21 days. We observed BrO and SO2 degassing and BrO/SO2 ratios between 3 and 6 × 10⁻⁵, with a mean ratio of 4.31 × 10⁻⁵.
Stage 1 was present in every phase. We observed a constant baseline BrO/SO2 ratio of typically less than 5 × 10⁻⁵ (only for phase IX was it significantly higher at 6.20 × 10⁻⁵). Mean ratio: 3.58 × 10⁻⁵.
Stage 2 generally started with a strong increase in bromine emissions, which resulted in a BrO/SO2 ratio of up to 17 × 10−5, often twice as high as the ratio during stage 1. If stage 2 continued for more than a week, the ratio progressively decreased until it reached the former baseline level from stage 1. We will denote the latter part of this stage as stage 2b and the former as stage 2a. Stage 2 was observed in 11 phases (see Table 1). Mean ratio: 9.22 × 10⁻⁵.
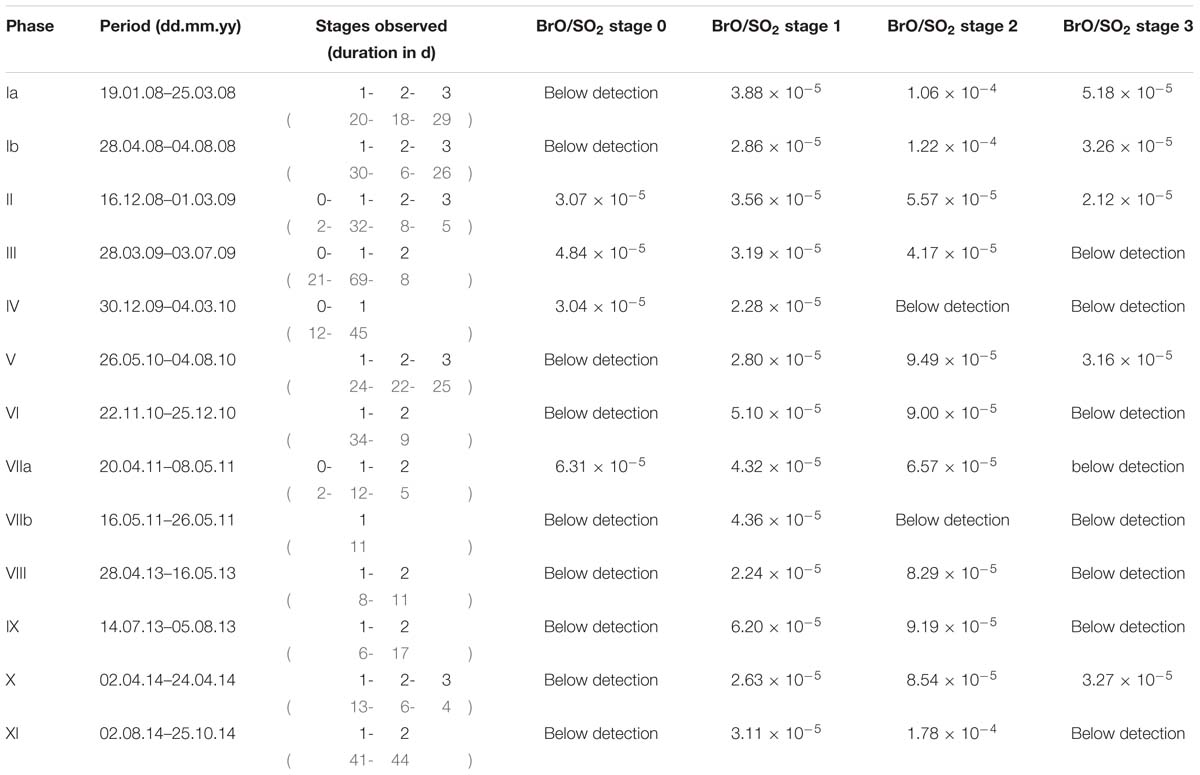
Table 1. Overview over all 13 phases: Name, period, stages observed and their respective duration (in days), and the BrO/SO2 ratio for each of the stages (if present). The evolution of the BrO/SO2 ratio during the phases is also depicted in Figure 4.
Stage 3 started when the BrO/SO2 ratio decreased to low BrO/SO2 ratios, similar to the ones observed in stage 1 (2–5 × 10⁻⁵). It could be seen in 5 phases (Ia, Ib, II, V, and X). Mean ratio: 3.44 × 10⁻⁵.
The most significant feature is the strong increase in the BrO/SO2 ratios from stage 1 to stage 2. This increase was lowest for phases II and VII and highest for phases Ia, Ib, V, and XI. The evolving pattern of BrO/SO2 ratios through the four stages can be clearly recognised for every phase (see Figure 4 and Table 1).
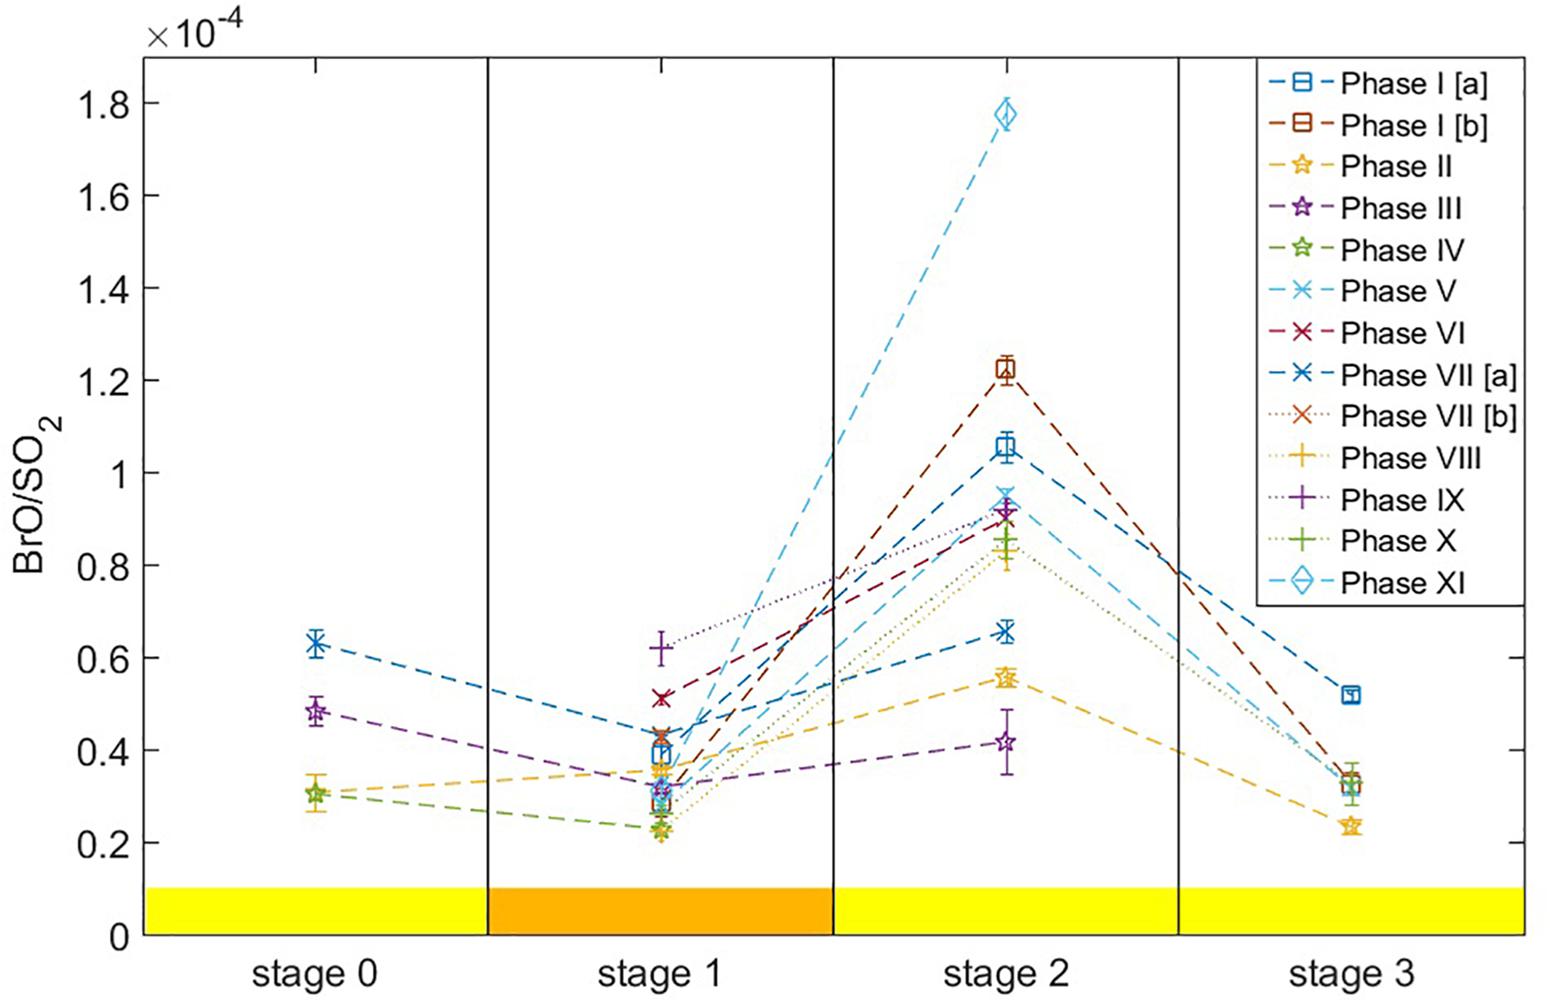
Figure 4. The evolution of the BrO/SO2 ratio during the stages of the different phases. Depicted are the mean BrO/SO2 ratios (period regression) for each of the four stages: stage 0, stage 1, stage 2, and stage 3. The colour at the bottom indicates the most predominant activity classification during each stage (Hidalgo et al., 2015). Detailed discussion in the text.
Evolution of the BrO/SO2 Ratio Over the Course of Each Phase
Here, we discuss in detail the evolution of the BrO/SO2 ratio through every phase in chronological order. Phase V – serving as an example – will be discussed in more detail.
Phase I: During phase I (from 19 January to 22 July 2008), we observed the pattern twice. We will refer to them as phase Ia and phase Ib. Phase Ia started with a BrO/SO2 ratio of 4.54 × 10⁻⁵ during the initialisation from 19 January 2008 (stage 1), lasting until an increase to 1.7 × 10⁻⁴ was observed on 8 February (stage 2a, lasting for 5 days). The BrO/SO2 ratio decreased over the following weeks (stage 2b) until baseline levels were reached in March/April 2008 (stage 3, see Figure 5). Phase Ib started on 28 April 2008 with a ratio of 2.86 × 10⁻⁵, reaching a short intermediate stage 2 on 28 May 2008, lasting only 6 days. It then decreased to 3.26 × 10⁻⁵ until 27 July 2008.
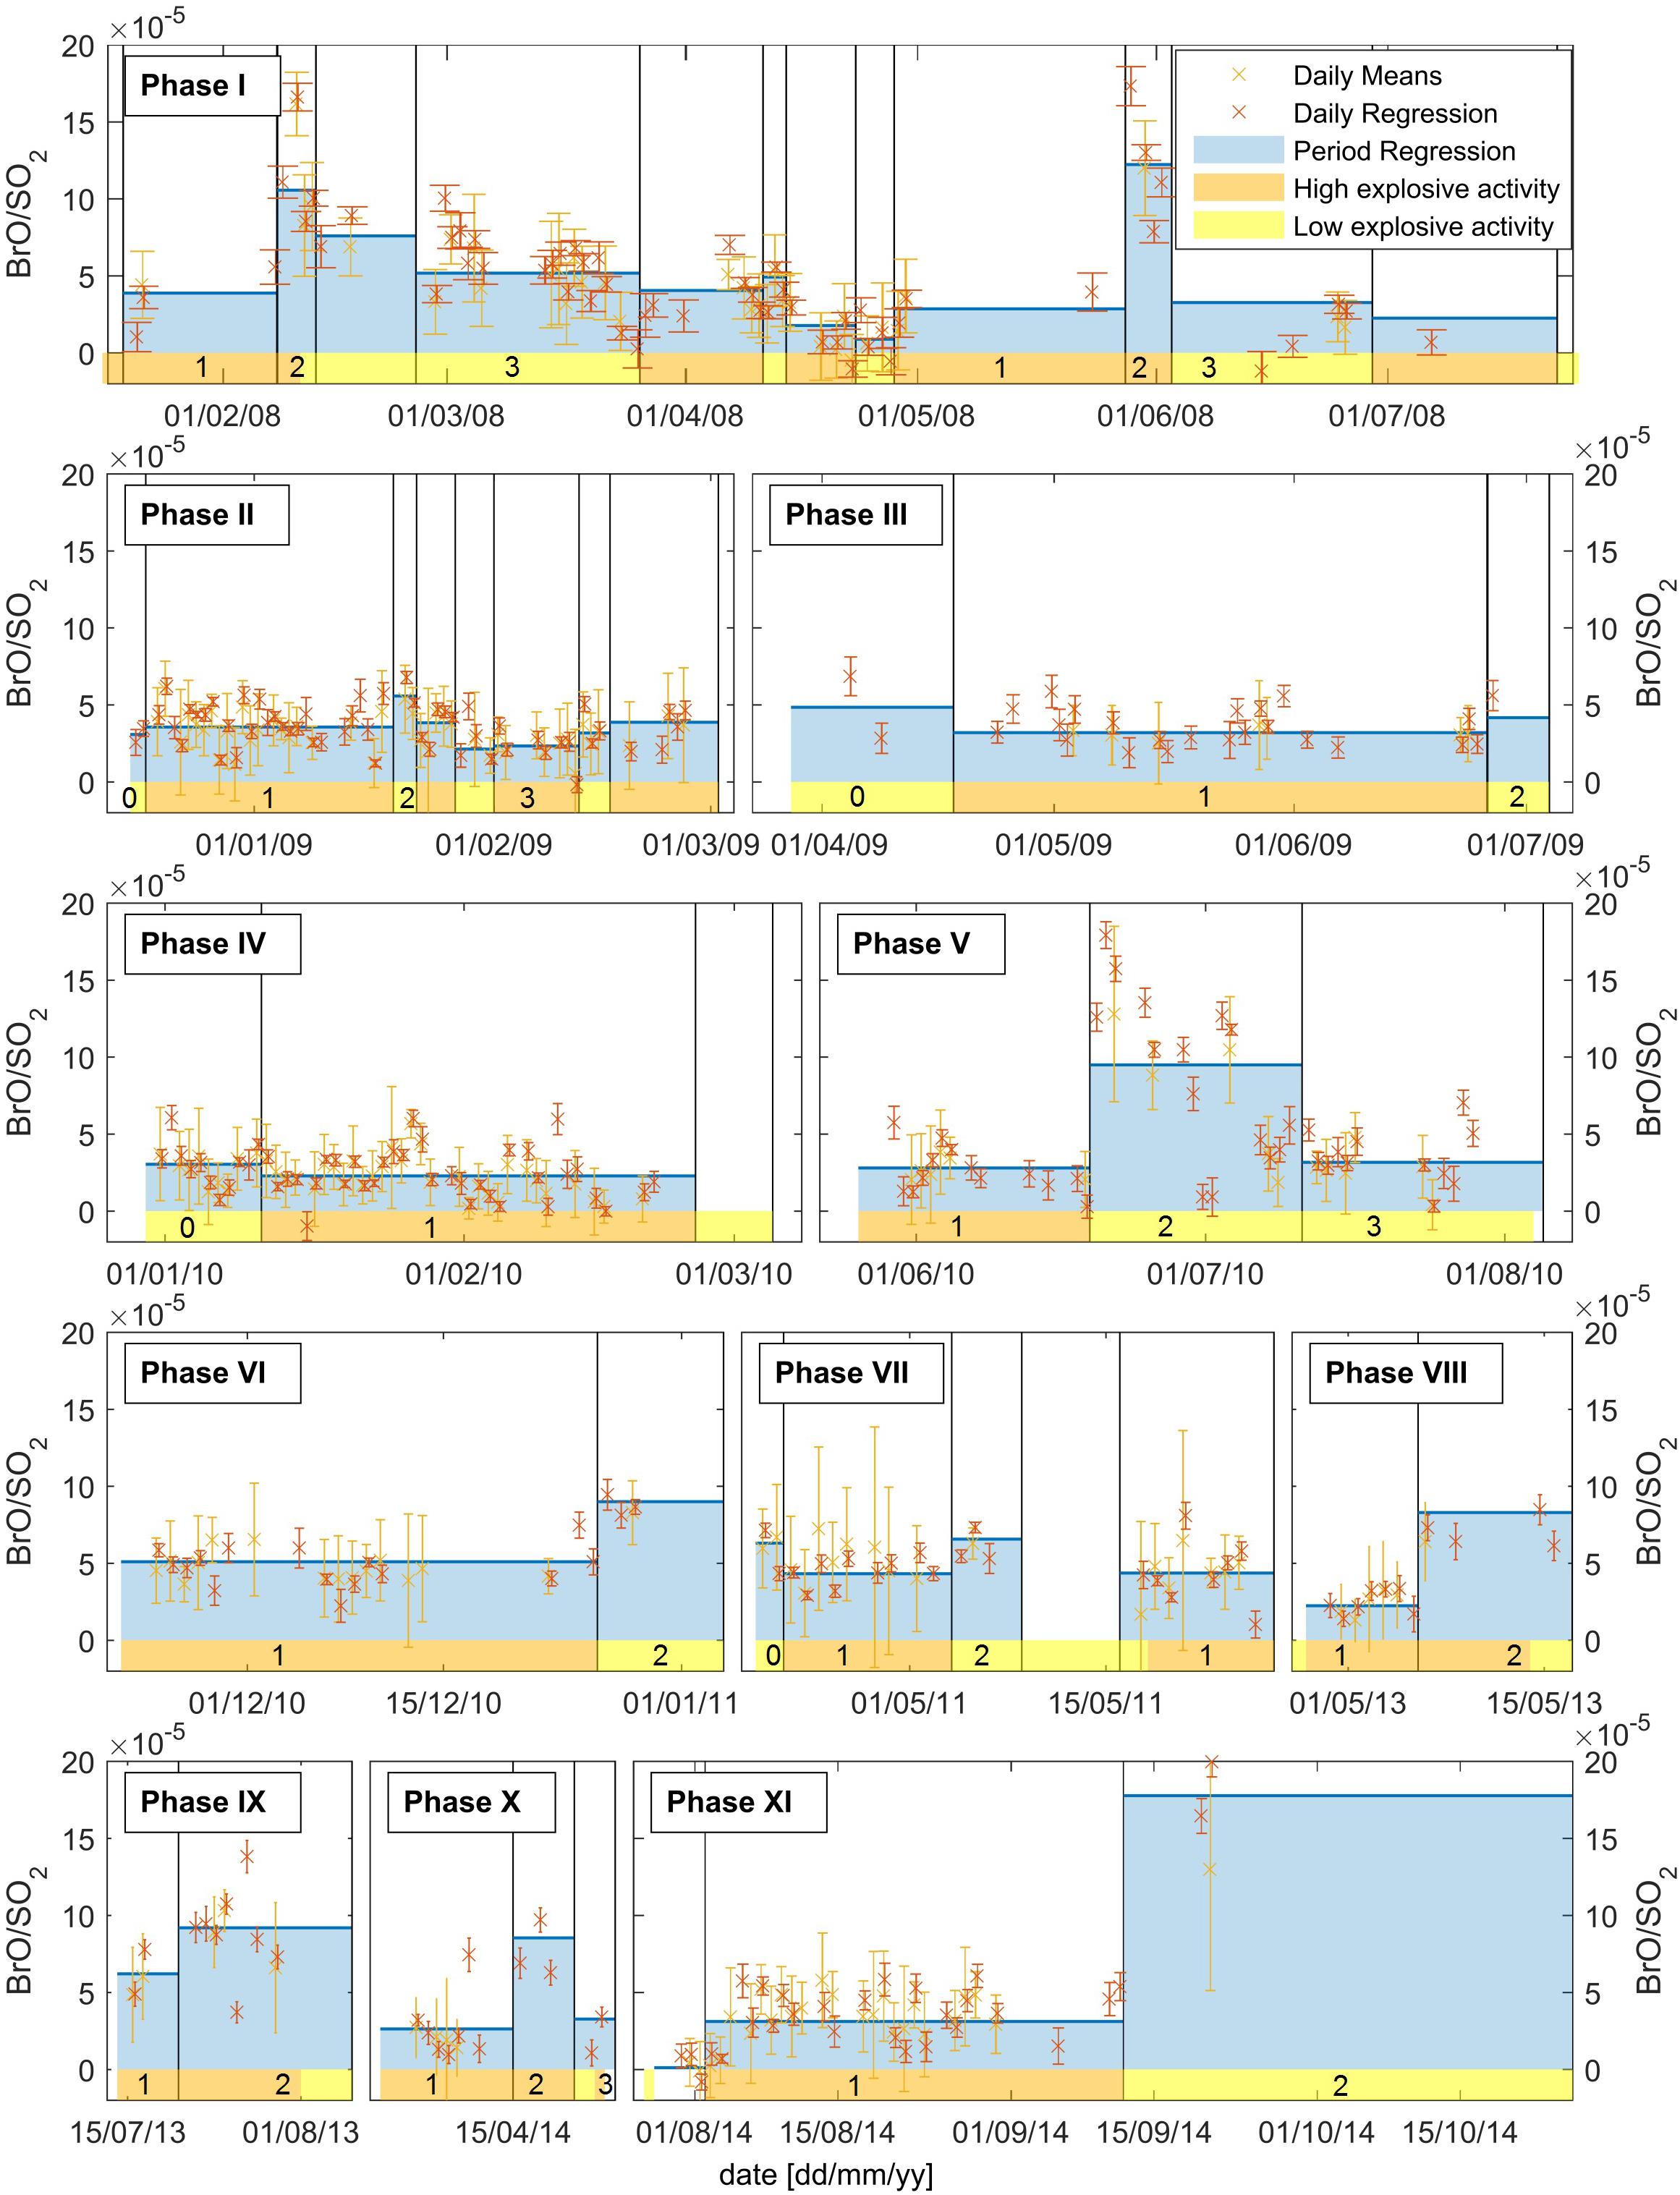
Figure 5. BrO/SO2 ratio over the course of each phase. Mean BrO/SO2 ratio of the different periods (blue area, separated by black lines), the corresponding stage number is marked below the blue area. Furthermore, daily BrO/SO2 from daily regression (red crosses) as well as from daily mean method (yellow crosses) are included. Explosivity classification is marked by yellow (low explosive) and orange area (high explosive).
Phases II and III: The pattern is less clear for these phases, where only a small enhancement in the BrO/SO2 ratio could be observed on 19 January 2009 (phase II) and on 26 June 2009 (phase III).
Phase IV: This phase exclusively consisted of the initial stages 0 and 1 with low BrO/SO2 ratio (2–3 × 10⁻⁵). After stage 1, the gas signal decreased below the detection limit and no BrO/SO2 ratio could be retrieved for stage 2.
Phase V: This phase took place from 29 May until 4 August 2010 and comprised stages 1 to 3. Stage 1, spanning from 29 May until 18 June, was characterised by high SO2 emissions with SO2 SCDs of up to 2 × 10¹⁸ molecules/cm2 while BrO SCDs did not exceed 1 × 10¹⁴ molecules/cm2 (see Figure 6, bottom left). During this stage, a mean BrO/SO2 ratio of 2.80 × 10⁻⁵ was retrieved. Stage 2 started on 19 June with a strong increase in the BrO/SO2 ratio by more than 1 × 10⁻⁴ to 1.7 × 10⁻⁴ as a result of a sharp rise in BrO SCDs up to 2 × 10¹⁴ molecules/cm2 (see Figure 6, bottom middle). As stage 2 progressed, the BrO/SO2 ratio slowly decreased (stage 2b), reaching previous baseline levels of roughly 3 × 10−5 by 11 July (after 22 days), where it remained throughout stage 3 until the gas emission dropped below the detection limit on 4 August. Both the BrO/SO2 ratio as well as the linear regression results for the three stages of phase V are plotted in Figure 6. The period regression of each of these three stages reveals that the gas composition was similar during stages 1 and 3. While the SO2 SCDs were similar for all three stages, BrO SCDs were higher during stage 2, if compared to stages 1 and 3 (Figure 6, bottom).
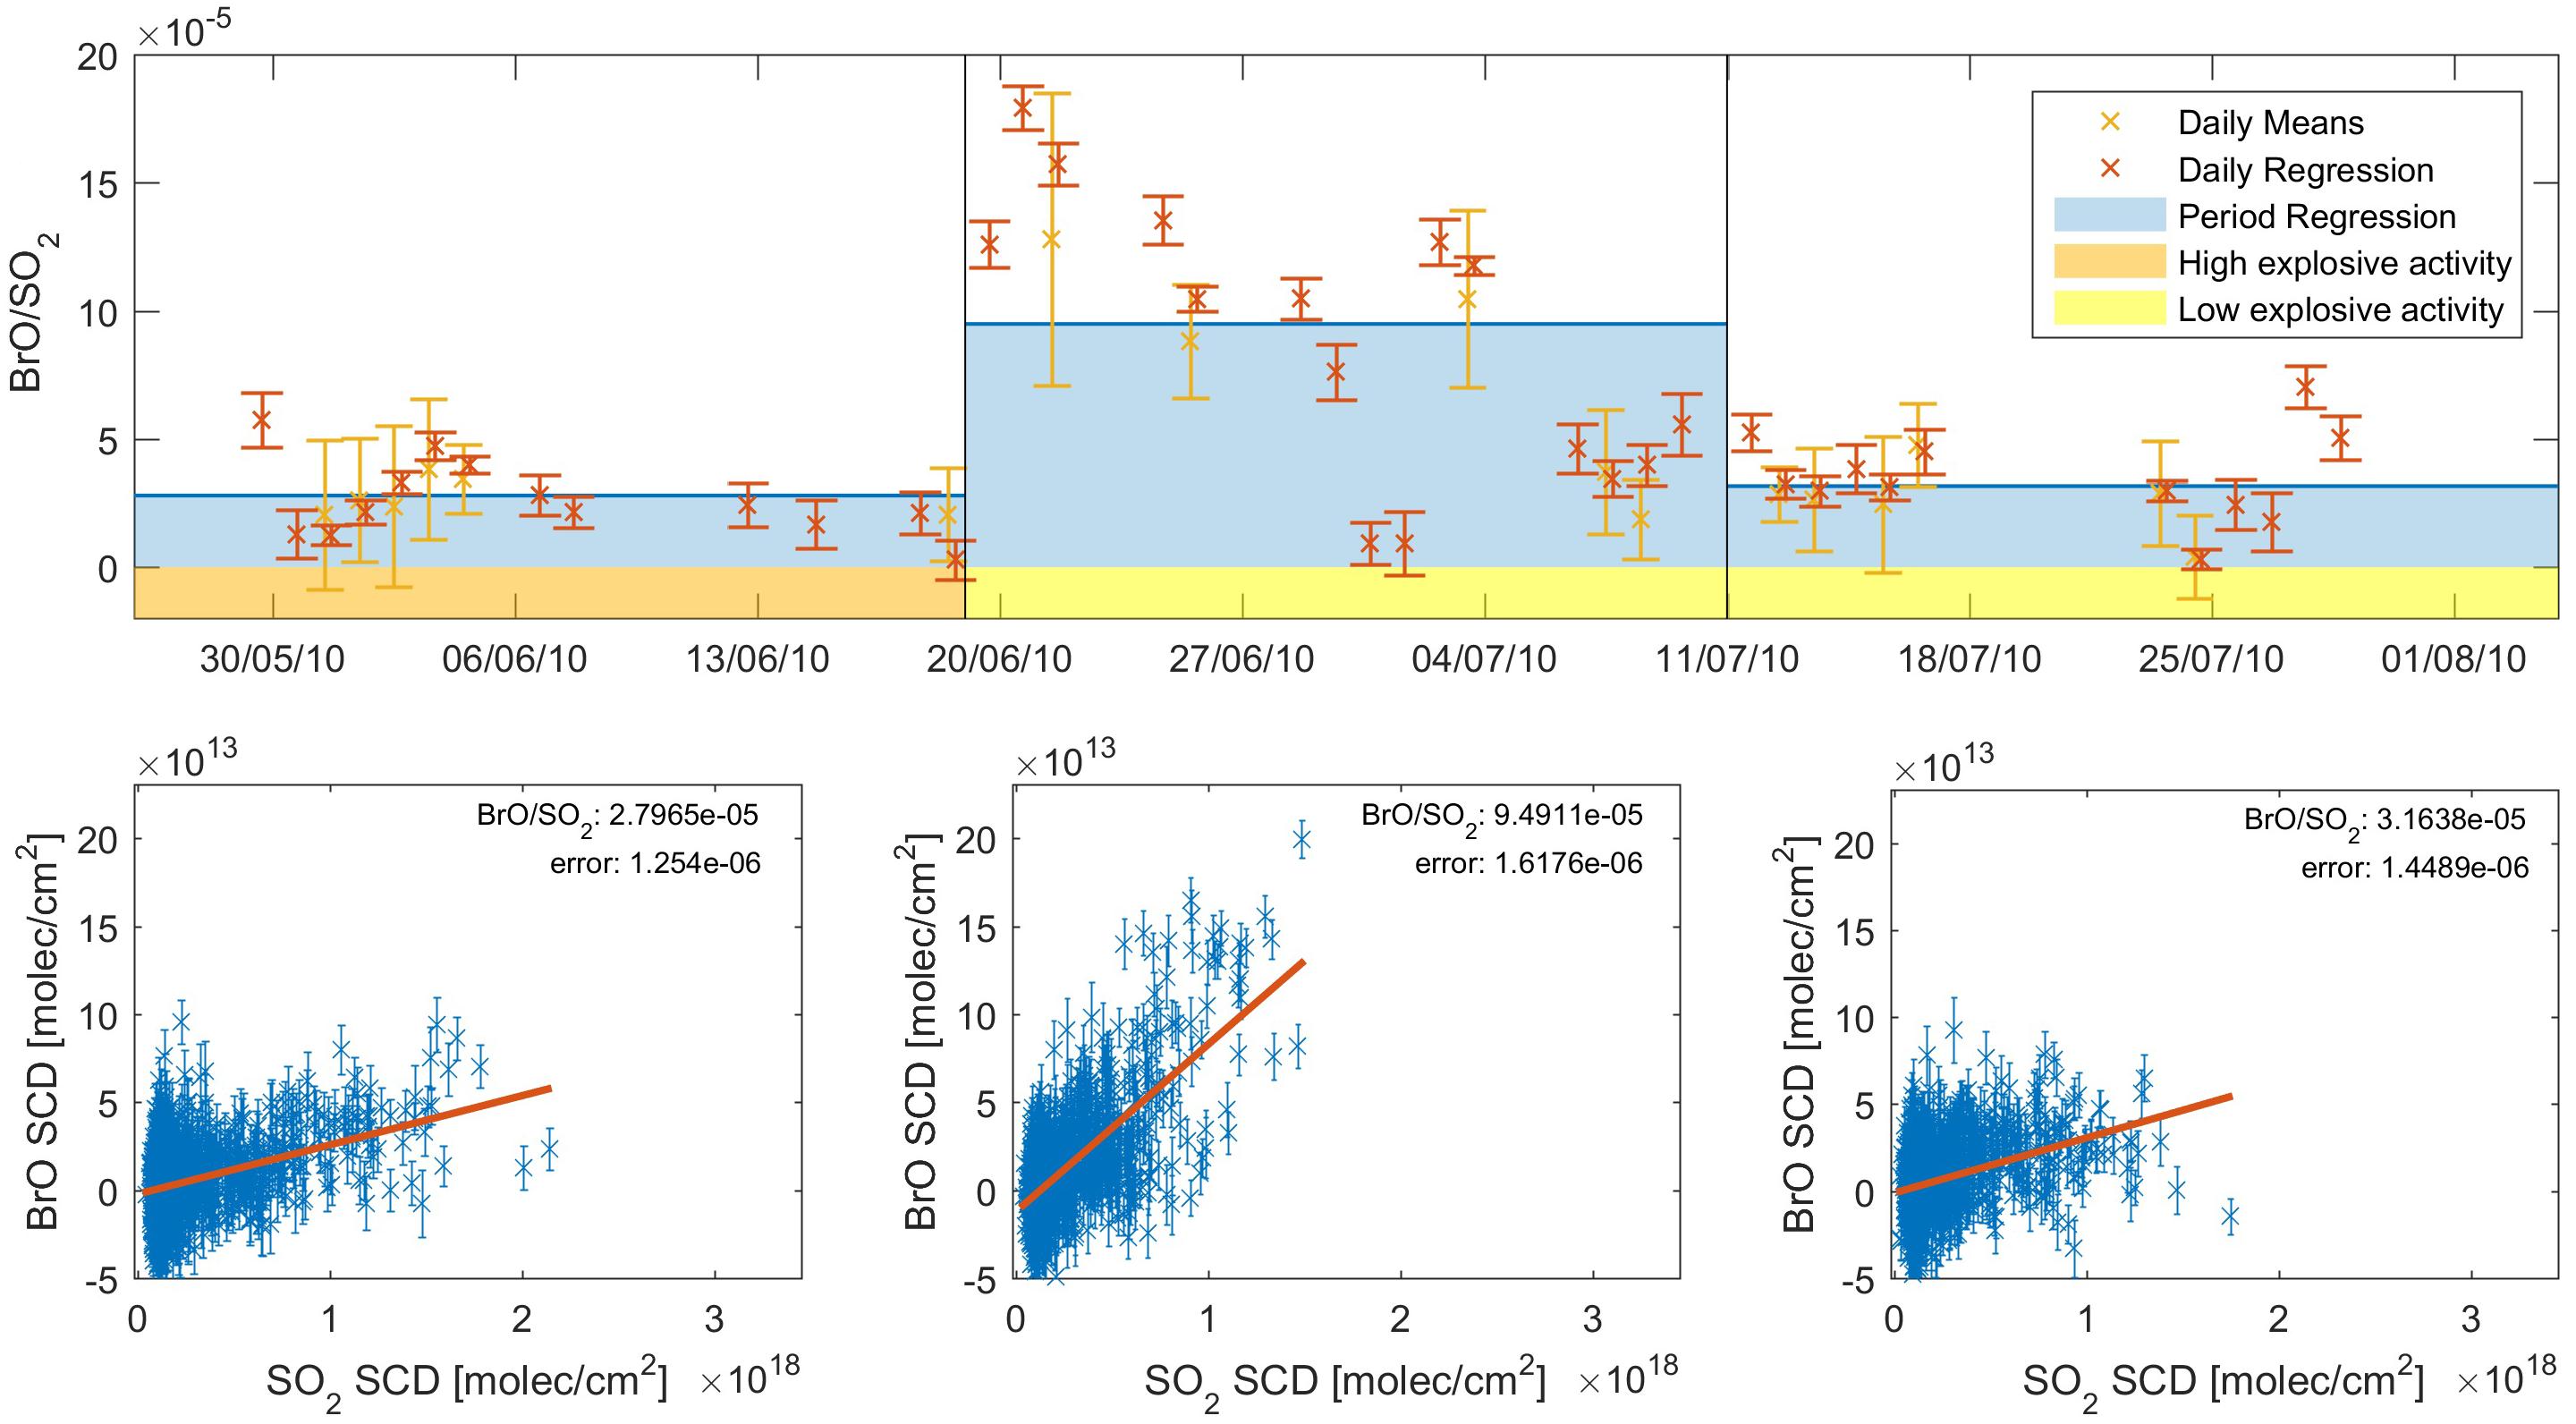
Figure 6. NOVAC data observed during eruptive phase V (26 May–4 August 2010). The three stages (stages 1–3) are separated by vertical lines. Top: The BrO/SO2 ratio calculated by a period regression for each stage (blue area). Also, the results for the daily regression (red) and daily means method (yellow) are plotted. Activity classification (Hidalgo et al., 2015) is indicated with orange (high explosive) and yellow (low explosive). Bottom: Period regression of the BrO to SO2 plotted for the three stages.
Phases VI to IX and XI exhibited only the initial stages and the intermediate stage 2, with a varying increase in strength from initialisation to stage 2 of 2.3 × 10⁻⁵ (during phase VII) to 1.4 × 10⁻⁴ (during phase XI).
Phase X: This phase behaved similar to phases VI-IX, but also had a short stage 3.
The detailed depiction of the co-added SO2 and BrO SCDs as well as the BrO/SO2 ratios for every phase can be found in the Supplementary Materials.
In 2012, in the second half of 2015, and for six phases between 2013 and 2016, only short periods with few BrO SCDs above the detection limit could be observed and longer period of BrO/SO2 ratios could not be identified. For the six phases between 2013 and 2016 constant BrO/SO2 ratio were calculated, with values ranging from 1.8 to 5.2 × 10⁻⁵, similar to the range during stages 0 and 1.
Relation of the BrO/SO2 Ratio With Explosive Activity
The observed changes in the BrO/SO2 ratio between the different stages in the cycle observed during each phase at Tungurahua can be linked to changes in the explosive activity classification. The classification is closely related to the pattern of the BrO/SO2 ratio in the following way: Stage 0 was typically related to low explosive activity. During Stage 1 – characterised by low BrO/SO2 ratios – explosive activity was always defined as high. The subsequent increase in BrO/SO2 ratios between stage 1 and 2 coincides with a change from high to low explosive activity. Only phases VIII, IX, and X (all after 2012), which are the shortest phases, did not exhibit this change in the classification. For these phases the activity classification remained high throughout stage 2. Stage 3 was generally governed by low explosive activity.
The fact that for most of the phases the change in activity from high to low explosive activity was linked to an increase in the BrO/SO2 ratio suggests that this might be inherent to the volcanic system of Tungurahua during the study period. In order to compare the explosive activity classification with the BrO/SO2 ratio throughout the whole dataset, we performed period regressions for every period of high and low explosive activity. The results are shown in Figure 7. While the mean of all BrO/SO2 ratio during high explosive activity (3.87 × 10⁻⁵) is slightly lower than the mean of all BrO/SO2 ratios during low explosive activity (5.19 × 10⁻⁵), there is large variance caused by other parameters and thus this difference seems to be not statistically significant.
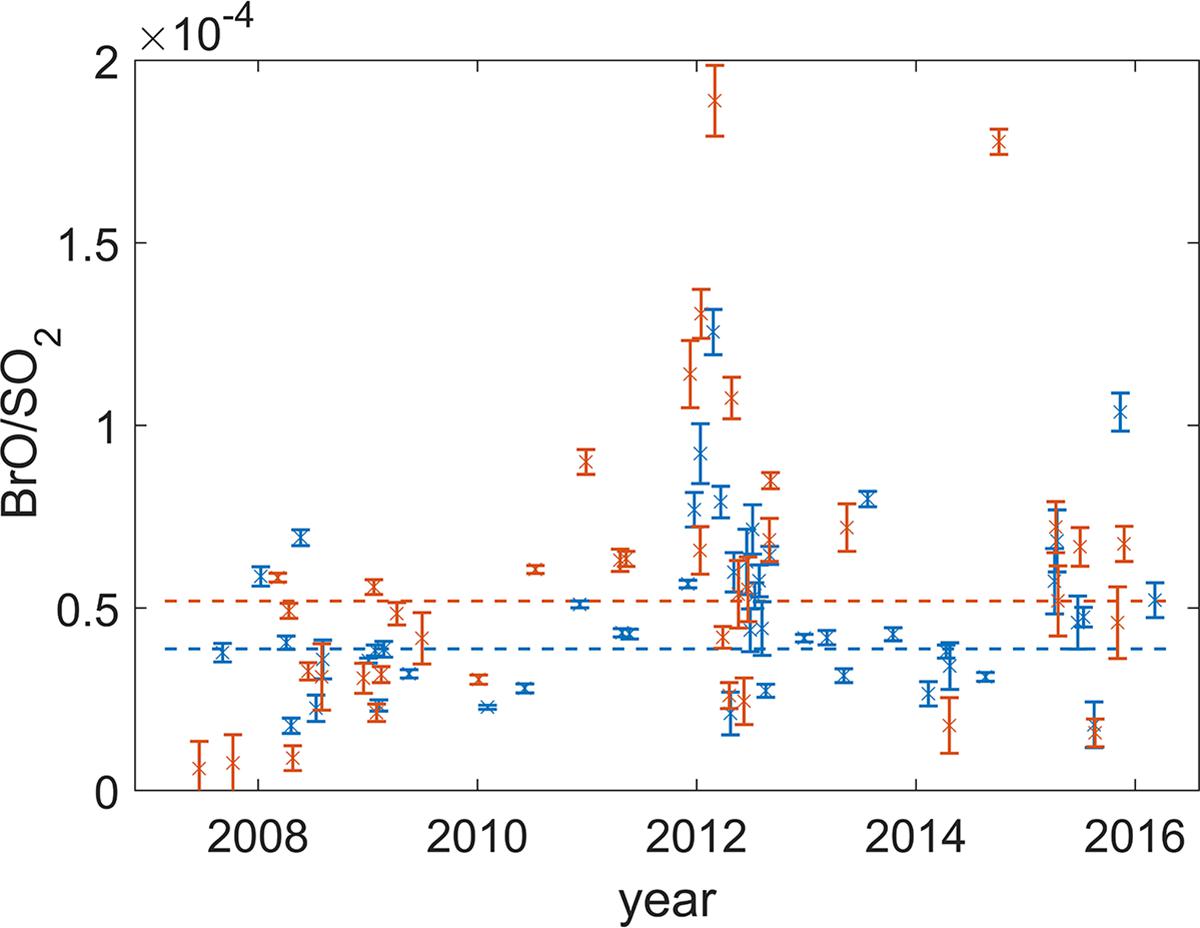
Figure 7. BrO/SO2 ratio calculated for the periods of low explosive activity (red) and high explosive activity (blue) as determined by Hidalgo et al. (2015) throughout the whole dataset 2007–2017. The respective mean ratios are indicated by coloured lines (high explosive activity: 3.87 × 10⁻⁵; low explosive activity: 5.19 × 10⁻⁵).
Discussion
In Figure 4, a recurring temporal pattern in the eruptive phases of Tungurahua can be observed. We can summarise our observations as follows:
1. Initiation of degassing with low BrO/SO2 ratios is observed during the initial stages. These are associated with high SO2 emissions and strong seismicity, i.e. vulcanian explosions, occurring at the beginning of the eruptive phases.
2. After the initial stages, increased BrO values and nearly unchanged SO2 emissions are observed in the plume, leading to an increased BrO/SO2 ratio (observed for 11 of 13 eruptive phases). This typically coincided with the termination of high explosive activity.
3. For five phases, BrO/SO2 decreased afterward and remained low until SO2 SCDs decreased below detection. For the other eight phases, degassing had decreased already to a point that SO2 and BrO were below the limit to calculate meaningful BrO/SO2 ratios.
Changes of the BrO/SO2 ratio in the plume of a single volcano have previously been linked to changes in volcanic processes (Bobrowski and Giuffrida, 2012; Lübcke et al., 2014; Dinger et al., 2018), when observing 3 to 20 min old volcanic plumes (e.g. Platt and Bobrowski, 2015; Gutmann et al., 2018). This was assumed to be caused by different melt-fluid partitioning of bromine and sulphur in magmatic melts. Moreover, differences in the BrO/SO2 ratio among different volcanoes have been attributed to differences in magmatic composition (Platt and Bobrowski, 2015).
The melt-fluid partitioning of halogens (especially of chlorine and fluorine) with respect to sulphur has been the subject of multiple studies (e.g. Spilliaert et al., 2006; Burton et al., 2007). They found lower melt-fluid partitioning of chlorine compared to sulphur and thus concluded that (1) sulphur is usually released from magma earlier than chlorine (Carrol and Holloway, 1994; Spilliaert et al., 2006; Aiuppa, 2009; Webster et al., 2009) and (2) that the Cl/S ratio decreases with increasing degassing source depth (e.g. Burton et al., 2007). Measurements of chlorine and sulphur suggest that chlorine is more significantly released only at shallow depth (typically less than 2 km; Allard et al., 2005; Spina et al., 2015).
However, the melt-fluid partitioning of bromine with respect to sulphur is still not very well constrained. Laboratory studies using natural silicate glasses suggested lower melt-fluid partitioning coefficients for bromine compared to sulphur also (Cadoux et al., 2018). They found melt-fluid partitioning coefficients between 3.8 and 20.8, which are similar to estimates derived from melt inclusions (0.3 to 21; Kutterolf et al., 2015) and from experimental data (2.18 to 9.2 and 17.5; Bureau et al., 2000, 2010).
This is similar to chlorine, where melt-fluid partitioning coefficients were found between 0.3 and 50 (Alletti et al., 2009; Webster et al., 2009; Zajacz et al., 2012). Thus, Cadoux et al. (2018) argue that bromine should behave similarly to chlorine and should be released predominantly during later degassing stages in comparison to sulphur. They assumed sulphur melt-fluid partitioning to be ≈15–20 times larger compared to bromine, based on sulphur melt-fluid partitioning ranging between 3 and 236 (Beermann et al., 2015), and a factor of ≈9 between the chlorine and sulphur partitioning coefficients (Aiuppa, 2009).
Following these studies, and assuming no change in magmatic composition, higher BrO/SO2 ratios should be associated with degassing from magma at shallow depths and lower BrO/SO2 ratios released from magma degassing at deeper levels in the volcanic system.
Conceptual Model of the Evolution of BrO/SO2 During Tungurahua’s Eruptive Phases
Based on the BrO/SO2 patterns observed in our study and on the recent studies of Cadoux et al. (2018), we propose a conceptual model that aims to explain the eruptive phases at Tungurahua.
Increasing SO2 and BrO SCDs in combination with low BrO/SO2 ratios are observed at the beginning of the explosive phases (stage 0 and 1). In agreement with increased SO2 fluxes calculated by Hidalgo et al. (2015), we therefore interpret the initialisation of the phase as being driven by the intrusion of gas-rich magma into the upper part of the volcanic system with degassing signature dominated by deep degassing sources.
The increase in the BrO/SO2 ratios on the transition to stage 2 indicates that bromine can partition from the melt more efficiently. SO2 SCDs are similar during stages 1 and 2 (also observed in the SO2 fluxes Hidalgo et al., 2015), implying that the increase in the BrO/SO2 ratio was unlikely to be caused by depletion of SO2 in the melt, but rather caused by a change of the degassing source depth. We thus propose that the magma was degassing at shallower depths during stage 2 (compared to stage 1), promoting bromine partitioning from the melt.
We further propose that the efficient degassing over the course of stage 2 resulted in a faster Br depletion due to its lower abundance in the melt. This led to the decrease in the BrO/SO2 ratios toward the end of stage 2. Together with the corresponding decrease in the SO2 SCDs this implies the interruption of magma intrusion. Stage 3 was thus governed by the degassing from gas-depleted magma until the gas emissions decreased below detection and the phase ends. The proposed conceptual model for the four stages is illustrated in Figures 8A–D, respectively.
Figure 8. Conceptual model for each of the 13 eruptive phases observed at Tungurahua. (A,B) Low BrO/SO2 ratios during initialisation indicate degassing at depth, interpreted as the intrusion of gas-rich magma and deep degassing signature. BrO/SO2 ratios typically between 3 and 6 × 10⁻⁵ (stage 0, mean ratio: 4.31 × 10⁻⁵), and 2 and 6 × 10⁻⁵ (stage 1, mean ratio: 3.58 × 10⁻⁵) were observed. (C) Strong increase in the BrO SCDs indicates degassing at shallow depth. BrO/SO2 ratio increased to 4 to 17 × 10−5 (stage 2, mean ratio: 9.22 × 10⁻⁵). The subsequent decrease in the BrO/SO2 ratio indicates depletion of first Br in the magmatic melt. (D) Degassing from magma depleted in gas during stage 3 with low BrO/SO2 ratios between 2 and 5 × 10⁻⁵ (stage 3: mean ratio: 3.44 × 10⁻⁵). Detailed description given in the text.
Based on our observations and data from previous studies (Cadoux et al., 2018), we therefore suggest that each eruptive phase is driven by an intrusion of gas-rich magma, which subsequently degasses under different conditions. However, the amount of magma driving the phase might vary between the different eruptive phases.
Comparison of the Conceptual Model to Petrological Studies
Petrological studies showed that major eruptive phases at Tungurahua, like August 2006 (VEI 3) and May 2010 (phase V in this study), have been triggered by the input of new, hot, volatile-rich magma into a long-lived magmatic reservoir (Samaniego et al., 2011; Myers et al., 2014). Both studies propose an andesitic magma reservoir located at 8–10 km depth, which is coupled to a deeper mafic reservoir, probably located at depth of 15–16 km (Andújar et al., 2017). Myers et al. (2014) suggest that phase V was driven by the ascent of volatile-rich magma from the deeper basaltic andesite magma reservoir resulting in mixing with the upper andesitic, degassed, reservoir. This mechanism can account for the major eruptive phases documented at Tungurahua, and is in agreement with our conceptual model, which proposes the intrusion of volatile-rich magma (at least sulphur- and bromine-rich) as the main triggering process.
The lowest BrO/SO2 ratios are observed for phases III (June 2009) and IV (February 2010), where the BrO/SO2 ratios varied only between 2 and 4 × 10⁻⁵. Thus, the high ratio recorded for phase V (18 × 10−5 at the beginning of stage 2) could indicate a comparatively high input of mafic magma leading toward this eruption (as proposed by Myers et al., 2014) and reciprocally the low BrO/SO2 ratios during phase III and IV indicate low or no input of volatile-rich mafic magma. Therefore, we can potentially link the BrO/SO2 ratios observed during efficient degassing (stage 2) of the eruptive phases to the respective volatile status of the degassing magma.
Furthermore, it is important to note that during phase V, the energy of the vulcanian explosions was extremely high (Hidalgo et al., 2015) and larger than for the other eruptive phases between 2007 and 2016.
Comparison to Other Studies With Respect to Volcanic Activity
There are other studies similarly discussing long-term trends of BrO/SO2 ratios with respect to changes in volcanic activity. Similar to our study, Bobrowski and Giuffrida (2012) found lower BrO/SO2 ratios during periods of higher volcanic activity at Mount Etna during an observation period of more than 3 years including two long lasting periods of effusive eruptive activity and several more violent events (e.g. lava fountaining). Lübcke et al. (2014) obtained a continuous 3-year time-series of BrO/SO2 ratios at the andesitic arc volcano Nevado del Ruiz. They observed low BrO/SO2 ratios of ≈ 2 × 10⁻⁵ during a period of high seismic activity and an increase of the BrO/SO2 ratios to ≈5 × 10⁻⁵ when the seismicity later decreased. This is similar to the behaviour which we observed during the eruptive phases of Tungurahua between the high explosive stage 1 and the low explosive stage 2.
In contrast to the laboratory measurements from Cadoux et al. (2018), Bobrowski and Giuffrida (2012) assumed an earlier bromine melt-fluid partitioning in comparison to sulphur as an interpretation of the spectral measurements, i.e. higher BrO/SO2 ratios during the intrusion of gas-rich magma into the system. A similar hypothesis was proposed by Lübcke (2014), who associated the low BrO/SO2 ratios to shallow degassing during a period of increased seismicity. The increase in BrO/SO2 ratios during the activity of Cotopaxi in 2015 (Dinger et al., 2018) were, like our study, similarly interpreted in terms of efficient degassing of rising magma in the conduit following the opening of the volcanic system by four phreato-magmatic explosions (Hidalgo et al., 2018).
In contrast to our measurements, the data of Bobrowski and Giuffrida (2012) and Lübcke et al. (2014) additionally enabled to determine BrO/SO2 ratios during non-eruptive periods and to include those in their interpretation, which could be a reason for the divergence in the interpretation to our study. In order to resolve this divergence in the interpretation of the BrO/SO2 ratio with respect to magmatic processes and partitioning of gas constituents from the melt, further field studies as well as laboratory studies should be undertaken. For such field studies, we therefore recommend even more comprehensive data collection, including seismic tomography to better determine source regions from a geophysical standpoint.
Multiple studies have investigated the behaviour of other halogens with respect to volcanic activity, predominantly through Cl/S ratio or HCl/SO2 ratios. Measurements at Mount Etna revealed a decrease in the Cl/S ratio when strombolian activity followed a period of violent lava fountaining, and even lower Cl/S during a phase of passive degassing (Aiuppa et al., 2004). Furthermore, Spina et al. (2015) suggested a correlation with eruption intensity derived from FTIR measurements of HCl/SO2 ratios at Mount Etna. This contrasts to what we found for the BrO/SO2 ratio, which could potentially be an indication that bromine and chlorine do not behave similarly as has been assumed here and in several previous studies (Seo and Zajacz, 2016; Cadoux et al., 2018). However, other measurements at Mount Etna did display an increase in the HCl/SO2 ratio, when explosive activity subsided (Allard et al., 2005).
To our knowledge there is only one study with simultaneous measurements of BrO/SO2 and Cl/S (Bobrowski et al., 2017). In this work the authors find a positive correlation of both ratios during a one-week period at Nyiragongo volcano in June 2011. Both ratios change concurrently with a significant decrease (several tens of metre) in the height of the lava lake. Another study by Aiuppa et al. (2005), investigating Br/S and Cl/S ratios during the transition from quiescence to eruption at Mount Etna starting in October 2004, does not demonstrate a clear change of either ratio, both staying within the variance of the measurements. Further studies will be essential to confirm or disprove the assumptions made regarding the similarities of fluid-melt partitioning of chlorine and bromine.
Conclusion
We successfully retrieved BrO/SO2 ratios for 13 eruptive phases at Tungurahua volcano between 2007 and 2017. The data show typical values of BrO/SO2 ratios between 2 and 8 × 10⁻⁵, similar to other andesitic arc volcanoes.
For 11 of the 13 eruptive phases, we identified an evolutionary pattern in the BrO/SO2 ratio, which we interpret as characteristic of the volcano’s eruptive phases. We propose a conceptual eruptive model for Tungurahua linking this pattern in the BrO/SO2 ratio to the eruptive dynamics of the volcanic system. The appearance of low BrO/SO2 ratios in the plume at the beginning of the eruptive phases is directly linked to a volatile-rich magma intrusion, which acts as a trigger for the eruptive activity and is initially characterised by high explosivity. A following increase in molar ratios is associated with a shift to shallower depth at which efficient bromine degassing occurs, and is typically associated with a sustained period of low explosive activity. The subsequent depletion in volatiles in the degassing magma body finally leads to a decrease in BrO/SO2 ratios altogether, and an end to the eruptive phase. The evolutionary pattern of the BrO/SO2 ratios is thus linked to the explosive activity of the volcano, with low BrO/SO2 ratios associated to high explosive activity later evolving to high ratios during a period of low explosive activity.
High BrO/SO2 ratios observed after a reported high input of volatile-rich magma into the upper volcanic system could infer a relationship between bromine degassing to the amount of volatiles in the active system. The BrO/SO2 can thus potentially be used as a proxy for the degree of depletion of volatiles. This study therefore demonstrates the increasing potential of long-term measurements of the BrO/SO2 molar ratio to reveal important information about status as well as temporal evolution of the volcanic system.
Author Contributions
NB, SW, PL, and UP contributed conception and design of the study. SW performed the data evaluation. NB, HS, and SW performed the statistical analysis. SW wrote the draft of the manuscript. NB, SH, FD, SA, UP, TW, and SW contributed to the interpretation of the data. All authors contributed to manuscript revision, read and approved the submitted version.
Funding
The publication costs of this study were kindly provided by the Max Planck Institute for Chemistry (MPIC).
Conflict of Interest Statement
The authors declare that the research was conducted in the absence of any commercial or financial relationships that could be construed as a potential conflict of interest.
The handling Editor is currently editing a Research Topic with one of the authors NB, and confirms the absence of any other collaboration.
Acknowledgments
We thank the reviewers for their valuable time, input, and critical remarks. We thank the reviewer, MP, for the persistence in criticism which helped to make the discussion more concise and coherent. We would especially like to thank the reviewer, SB, for the detailed remarks and suggestions, which improved the manuscript significantly both with respect to overall message and conciseness of the interpretation. Both reviewers helped to improve the manuscript significantly. We thank the editor, AA, for his input and managing during the publishing process. We kindly thank the staff of the Instituto Geofísico – Escuela Politécnica Nacional (IG-EPN) – especially the Observatory at Tungurahua – for maintaining the NOVAC instruments and for providing the spectral data. We thank the European Commission for funding of the NOVAC project under Framework 6 Research Program and DFG for financial support under project DFG PL 193/14-1.
Supplementary Material
The Supplementary Material for this article can be found online at: https://www.frontiersin.org/articles/10.3389/feart.2019.00132/full#supplementary-material
References
Aiuppa, A. (2009). Degassing of halogens from basaltic volcanism: insights from volcanic gas observations. Chem. Geol. 263, 99–109. doi: 10.1016/j.chemgeo.2008.08.022
Aiuppa, A., Federico, C., Antonio, P., Giovannella, P., and Mariano, V. (2002). S, Cl and F degassing as an indicator of volcanic dynamics: the 2001 eruption of Mount Etna. Geophys. Res. Lett. 29, 54-1–54-4. doi: 10.1029/2002GL015032
Aiuppa, A., Federico, C., Franco, A., Giudice, G., Gurrieri, S., Inguaggiato, S., et al. (2005). Emission of bromine and iodine from Mount Etna volcano. Geochem. Geophys. Geosyst. 6:Q08008. doi: 10.1029/2005GC000965
Aiuppa, A., Federico, C., Giudice, G., Gurrieri, S., Paonita, A., and Valenza, M. (2004). Plume chemistry provides insights into mechanisms of sulfur and halogen degassing in basaltic volcanoes. Earth Planet. Sci. Lett. 222, 469–483. doi: 10.1016/j.epsl.2004.03.020
Allard, P., Burton, M., and Muré, F. (2005). Spectroscopic evidence for a lava fountain driven by previously accumulated magmatic gas. Nature 433, 407–410. doi: 10.1038/nature03246
Alletti, M., Baker, D., Scaillet, B., Aiuppa, A., Moretti, R., and Ottolini, L. (2009). Chlorine partitioning between a basaltic melt and H2O–CO2 fluids at Mount Etna. Chem. Geol. 263, 37–50. doi: 10.1016/j.chemgeo.2009.04.003
Andújar, J., Martel, C., Pichavant, M., Samaniego, P., Scaillet, B., and Molina, I. (2017). Structure of the plumbing system at Tungurahua volcano, Ecuador: insights from phase equilibrium experiments on July–August 2006 eruption products. J. Petrol. 58, 1249–1278. doi: 10.1093/petrology/egx054
Arellano, S., Hall, M., Samaniego, P., Pennec, J.-L. L., Ruiz, A., Molina, I., et al. (2008). Degassing patterns of Tungurahua volcano (Ecuador) during the 1999–2006 eruptive period, inferred from remote spectroscopic measurements of SO2 emissions. J. Volcanol. Geotherm. Res. 176, 151–162. doi: 10.1016/j.jvolgeores.2008.07.007
Bablon, M., Quidelleur, X., Samaniego, P., Le Pennec, J.-L., Lahitte, P., Liorzou, C., et al. (2018). Eruptive chronology of Tungurahua volcano (Ecuador) revisited based on new K-Ar ages and geomorphological reconstructions. J. Volcanol. Geotherm. Res. 357, 378–398. doi: 10.1016/j.jvolgeores.2018.05.007
Beermann, O., Botcharnikov, R., and Nowak, M. (2015). Partitioning of sulfur and chlorine between aqueous fluid and basaltic melt at 1050°C, 100 and 200 MPa. Chem. Geol. 418, 132–157. doi: 10.1016/j.chemgeo.2015.08.008
Bobrowski, N., and Giuffrida, G. (2012). Bromine monoxide / sulphur dioxide ratios in relation to volcanological observations at Mt. Etna 2006 - 2009. Solid Earth 3, 433–445. doi: 10.5194/se-3-433-2012
Bobrowski, N., Giuffrida, G., Yalire, M., Lübcke, P., Arellano, S., Balagizi, C., et al. (2017). Multicomponent gas emission measurements of the active lava lake of Nyiragongo, DR Congo. J. Afr. Earth Sci. 134, 856–865. doi: 10.1016/j.jafrearsci.2016.07.010
Bobrowski, N., Hönniger, G., Galle, B., and Platt, U. (2003). Detection of bromine monoxide in a volcanic plume. Nature 423, 273–276. doi: 10.1038/nature0162
Bobrowski, N., and Platt, U. (2007). SO2/BrO ratios studied in five volcanic plumes. J. Volcanol. Geotherm. Res. 166, 147–160. doi: 10.1016/j.jvolgeores.2007.07.003
Bobrowski, N., von Glasow, R., Aiuppa, A., Inguaggiato, S., Louban, I., Ibrahim, O. W., et al. (2007). Reactive halogen chemistry in volcanic plumes. J. Geophys. Res. 112:D06311. doi: 10.1029/2006JD007206
Boichu, M., Oppenheimer, C., Roberts, T. J., Tsanev, V., and Kyle, P. R. (2011). On bromine, nitrogen oxides and ozone depletion in the tropospheric plume of Erebus volcano (Antarctica). Atmos. Environ. 45, 3856–3866. doi: 10.1016/j.atmosenv.2011.03.027
Bureau, H., Foy, E., Raepsaet, C., Somogyi, A., Munsch, P., Simon, G., et al. (2010). Bromine cycle in subduction zones through in situ Br monitoring in diamond anvil cells. Geochim. Cosmochim. Acta 74, 3839–3850. doi: 10.1016/j.gca.2010.04.001
Bureau, H., Keppler, H., and Métrich, N. (2000). Volcanic degassing of bromine and iodine: experimental fluid/melt partitioning data and applications to stratospheric chemistry. Earth Planet. Sci. Lett. 183, 51–60. doi: 10.1016/S0012-821X(00)00258-2
Burrows, J., Richter, A., Dehn, A., Deters, B., Himmelmann, S., Voigt, S., et al. (1999). Atmospheric remote-sensing reference data from GOME-2. Temperature-dependent absorption cross sections of O3 in the 231-794 nm range. J. Quant. Spectrosc. Radiat. Transf. 61, 509–517. doi: 10.1016/S0022-4073(98)00037-5
Burton, M., Allard, P., Muré, F., and La Spina, A. (2007). Magmatic gas composition reveals the source depth of slug-driven strombolian explosive activity. Science 317, 227–230. doi: 10.1126/science.1141900
Cadoux, A., Iacono-Marziano, G., Scaillet, B., Aiuppa, A., Mather, T. A., Pyle, D. M., et al. (2018). The role of melt composition on aqueous fluid vs. silicate melt partitioning of bromine in magmas. Earth Planet. Sci. Lett. 498, 450–463. doi: 10.1016/j.epsl.2018.06.038
Cantrell, C. A. (2008). Technical note: review of methods for linear least-squares fitting of data and application to atmospheric chemistry problems. Atmos. Chem. Phys. 8, 5477–5487. doi: 10.5194/acp-8-5477-2008
Carn, S., Krueger, A., Arellano, S., Krotkov, N., and Yang, K. (2008). Daily monitoring of Ecuadorian volcanic degassing from space. J. Volcanol. Geotherm. Res. 176, 141–150. doi: 10.1016/j.jvolgeores.2008.01.029
Carrol, M. R., and Holloway, J. R. (1994). Volatiles in Magmas, Vol. 30. Washington, D.C: Mineralogical Society of America.
Cochain, B., Sanloup, C., de Grouchy, C., Crépisson, C., Bureau, H., Leroy, C., et al. (2015). Bromine speciation in hydrous silicate melts at high pressure. Chem. Geol. 404, 18–26. doi: 10.1016/j.chemgeo.2015.03.015
Dinger, F., Bobrowski, N., Warnach, S., Bredemeyer, S., Hidalgo, S., Arellano, S., et al. (2018). Periodicity in the BrO/SO2 molar ratios in the volcanic gas plume of Cotopaxi and its correlation with the Earth tides during the eruption in 2015. Solid Earth 9, 247–266. doi: 10.5194/se-9-247-2018
Edmonds, M., Gerlach, T. M., and Herd, R. A. (2009). Halogen degassing during ascent and eruption of water-poor basaltic magma. Chem. Geol. 263, 122–130. doi: 10.1016/j.chemgeo.2008.09.022
Fleischmann, O. C., Hartmann, M., Burrows, J. P., and Orphal, J. (2004). New ultraviolet absorption cross-sections of BrO at atmospheric temperatures measured by time-windowing Fourier transform spectroscopy. J. Photochem. Photobiol. A Chem. 168, 117–132. doi: 10.1016/j.jphotochem.2004.03.026
Galle, B., Johansson, M., Rivera, C., Zhang, Y., Kihlman, M., Kern, C., et al. (2010). Network for observation of volcanic and atmospheric change (NOVAC) - a global network for volcanic gas monitoring: network layout and instrument description. J. Geophys. Res. 115:D05304. doi: 10.1029/2009JD011823
Grainger, J. F., and Ring, J. (1962). Anomalous Fraunhofer line profiles. Nature 193, 762–762. doi: 10.1038/193762a0
Gutmann, A., Bobrowski, N., Roberts, T. J., Rüdiger, J., and Hoffmann, T. (2018). Advances in bromine speciation in volcanic plumes. Front. Earth Sci. 6:213. doi: 10.3389/feart.2018.00213
Hall, M. L., Robin, C., Beate, B., Mothes, P., and Monzier, M. (1999). Tungurahua volcano, Ecuador: structure, eruptive history and hazards. J. Volcanol. Geotherm. Res. 91, 1–21. doi: 10.1016/S0377-0273(99)00047-5
Hermans, C., Vandaele, A., Fally, S., Carleer, M., Colin, R., Coquart, B., et al. (2003). “Absorption cross-section of the collision-induced bands of oxygen from the UV to the NIR,” in Weakly Interacting Molecular Pairs: Unconventional Absorbers of Radiation in the Atmosphere, Vol. 27, eds C. Camy-Peyret and A. Vigasin (Netherlands: Springer), 193–202. doi: 10.1007/978-94-010-0025-3_16
Hidalgo, S., Battaglia, J., Arellano, S., Sierra, D., Bernard, B., Parra, R., et al. (2018). Evolution of the 2015 Cotopaxi eruption revealed by combined geochemical & seismic observations. Geochem. Geophys. Geosyst. 19, 2087–2108. doi: 10.1029/2018GC007514
Hidalgo, S., Battaglia, J., Arellano, S., Steele, A., Bernard, B., Bourquin, J., et al. (2015). SO2 degassing at Tungurahua volcano (Ecuador) between 2007 and 2013: transition from continuous to episodic activity. J. Volcanol. Geotherm. Res. 298, 1–14. doi: 10.1016/j.jvolgeores.2015.03.022
Hörmann, C., Sihler, H., Bobrowski, N., Beirle, S., Penning de Vries, M., Platt, U., et al. (2013). Systematic investigation of bromine monoxide in volcanic plumes from space by using the GOME-2 instrument. Atmos. Chem. Phys. 13, 4749–4781. doi: 10.5194/acp-13-4749-2013
Johnson, J. (2003). Generation and propagation of infrasonic airwaves from volcanic explosions. J. Volcanol. Geotherm. Res. 121, 1–14. doi: 10.1016/S0377-0273(02)00408-0
Kelly, P. J., Kern, C., Roberts, T. J., Lopez, T., Werner, C., and Aiuppa, A. (2013). Rapid chemical evolution of tropospheric volcanic emissions from Redoubt volcano, Alaska, based on observations of ozone and halogen-containing gases. J. Volcanol. Geotherm. Res. 259, 317–333. doi: 10.1016/j.jvolgeores.2012.04.023
Kern, C., Sihler, H., Vogel, L., Rivera, C., Herrera, M., and Platt, U. (2009). Halogen oxide measurements at Masaya volcano, Nicaragua using active long path differential optical absorption spectroscopy. Bull. Volcanol. 71, 659–670. doi: 10.1007/s00445-008-0252-8
Kutterolf, S., Hansteen, T. H., Freundt, A., Wehrmann, H., Appel, K., Krüger, K., et al. (2015). Bromine and chlorine emissions from Plinian eruptions along the Central American Volcanic Arc: from source to atmosphere. Earth Planet. Sci. Lett. 429, 234–246. doi: 10.1016/j.epsl.2015.07.064
Lübcke, P. (2014). Optical Remote Sensing Measurements of Bromine and Sulphur Emissions: Investigating their Potential as Trace of Volcanic Activity. Ph.D. thesis. Heidelberg: Universität Heidelberg.
Lübcke, P., Bobrowski, N., Arellano, S., Galle, B., Garzón, G., Vogel, L., et al. (2014). BrO/SO2 molar ratios from scanning DOAS measurements in the NOVAC network. Solid Earth 5, 409–424. doi: 10.5194/se-5-409-2014
Malinconico, L. L. (1979). Fluctuations in SO2 emission during recent eruptions of Etna. Nature 278, 43–45. doi: 10.1038/278043a0
McCormick, B., Herzog, M., Yang, J., Edmonds, M., Mather, T. A., Carn, S. A., et al. (2014). A comparison of satellite- and ground-based measurements of SO2 emissions from Tungurahua volcano, Ecuador. J. Geophys. Res. Atmos. 119, 4264–4285. doi: 10.1002/2013JD019771
Meller, R., and Moortgat, G. K. (2000). Temperature dependence of the absorption cross sections of formaldehyde between 223 and 323K in the wavelength range 225 - 375 nm. J. Geophys. Res. Atmos. 105, 7089–7101. doi: 10.1029/1999JD901074
Menyailov, I. A. (1975). Prediction of eruptions using changes in composition of volcanic gases. Bull. Volcanol. 39, 112–125. doi: 10.1007/BF02596951
Myers, M. L., Geist, D. J., Rowe, M. C., Harpp, K. S., Wallace, P. J., and Dufek, J. (2014). Replenishment of volatile-rich mafic magma into a degassed chamber drives mixing and eruption of Tungurahua volcano. Bull. Volcanol. 76, 872–888. doi: 10.1007/s00445-014-0872-0
Noguchi, K., and Kamiya, H. (1963). Prediction of volcanic eruption by measuring the chemical composition and amounts of gases. Bull. Volcanol. 26, 367–378. doi: 10.1007/BF02597298
Olmos, R., Barrancos, J., Rivera, C., Barahona, F., López, D. L., Henriquez, B., et al. (2007). Anomalous emissions of SO2 during the recent eruption of Santa Ana volcano, El Salvador, Central America. Pure Appl. Geophys. 164, 2489–2506. doi: 10.1007/s00024-007-0276-6
Oppenheimer, C., Tsanev, V. I., Braban, C. F., Cox, R. A., Adams, J. W., Aiuppa, A., et al. (2006). BrO formation in volcanic plumes. Geochim. Cosmochim. Acta 70, 2935–2941. doi: 10.1016/j.gca.2006.04.001
Pennec, J.-L. L., Jaya, D., Samaniego, P., Ramón, P., Yánez, S. M., Egred, J., et al. (2008). The AD 1300–1700 eruptive periods at Tungurahua volcano, Ecuador, revealed by historical narratives, stratigraphy and radiocarbon dating. J. Volcanol. Geotherm. Res. 176, 70–81. doi: 10.1016/j.jvolgeores.2008.05.019
Pennisi, M., and Cloarec, M.-F. L. (1998). Variations of Cl, F, and S in Mount Etna’s plume, Italy, between 1992 and 1995. J. Geophys. Res. 103, 5061–5066. doi: 10.1029/97JB03011
Platt, U., and Bobrowski, N. (2015). “Quantification of volcanic reactive halogen emissions,” in Volcanism and Global Environmental Change, eds A. Schmidt, K. Fristad, and L. Elkins-Tanton (Cambridge: Cambridge University Press), 115–132. doi: 10.1017/cbo9781107415683.011
Platt, U., and Stutz, J. (2008). Differential Optical Absorption Spectroscopy: Physics of Earth and Space Environments. Berlin: Springer. doi: 10.1007/978-3-540-75776-4
Roberts, T. J., Martin, R. S., and Jourdain, L. (2014). Reactive bromine chemistry in Mount Etna’s volcanic plume: the influence of total Br, high-temperature processing, aerosol loading and plume–air mixing. Atmos. Chem. Phys. 14, 11201–11219. doi: 10.5194/acp-14-11201-2014
Samaniego, P., Pennec, J.-L. L., Robin, C., and Hidalgo, S. (2011). Petrological analysis of the pre-eruptive magmatic process prior to the 2006 explosive eruptions at Tungurahua volcano (Ecuador). J. Volcanol. Geotherm. Res. 199, 69–84. doi: 10.1016/j.jvolgeores.2010.10.010
Seo, J. H., and Zajacz, Z. (2016). Fractionation of Cl/Br during fluid phase separation in magmatic–hydrothermal fluids. Geochim. Cosmochim. Acta 183, 125–137. doi: 10.1016/j.gca.2016.04.009
Spilliaert, N., Métrich, N., and Allard, P. (2006). S–Cl–F degassing pattern of water-rich alkali basalt: modelling and relationship with eruption styles on Mount Etna volcano. Earth Planet. Sci. Lett. 248, 772–786. doi: 10.1016/j.epsl.2006.06.031
Spina, A. L., Burton, M., Allard, P., Alparone, S., and Muré, F. (2015). Open-path FTIR spectroscopy of magma degassing processes during eight lava fountains on Mount Etna. Earth Planet. Sci. Lett. 413, 123–134. doi: 10.1016/j.epsl.2014.12.038
Theys, N., Roozendael, M. V., Dils, B., Hendrick, F., Hao, N., and Mazière, M. D. (2009). First satellite detection of volcanic bromine monoxide emission after the Kasatochi eruption. Geophys. Res. Lett. 36:L03809.
Vandaele, A., Hermans, C., and Fally, S. (2009). Fourier transform measurements of SO2 absorption cross sections: II.: temperature dependence in the 29 000 - 44 000 cm−1 (227 - 345 nm) region. J. Quant. Spectrosc. Radiat. Transf. 110, 2115–2126. doi: 10.1016/j.jqsrt.2009.05.006
Vandaele, A., Hermans, C., Simon, P., Carleer, M., Colin, R., Fally, S., et al. (1998). Measurements of the NO2 absorption cross-section from 42 000 cm−1 to 10 000 cm-1 (238-1000 nm) at 220K and 294 K. J. Quant. Spectrosc. Radiat. Transf. 59, 171–184. doi: 10.1016/S0022-4073(97)00168-4
Villemant, B., and Boudon, G. (1999). H2O and halogen (F, Cl, Br) behaviour during shallow magma degassing processes. Earth Planet. Sci. Lett. 168,271–286. doi: 10.1016/S0012-821X(99)00058-8
Vogel, L., Sihler, H., Lampel, J., Wagner, T., and Platt, U. (2013). Retrieval interval mapping: a tool to visualize the impact of the spectral retrieval range on differential optical absorption spectroscopy evaluations. Atmos. Meas. Tech. 6, 275–299. doi: 10.5194/amt-6-275-2013
von Glasow, R. (2010). Atmospheric chemistry in volcanic plumes. Proc. Natl. Acad. Sci. U.S.A. 107, 6594–6599. doi: 10.1073/pnas.0913164107
Wagner, T., Beirle, S., and Deutschmann, T. (2009). Three-dimensional simulation of the Ring effect in observations of scattered sun light using Monte Carlo radiative transfer models. Atmos. Meas. Tech. 2, 113–124. doi: 10.5194/amt-2-113-2009
Webster, J., Sintoni, M., and Vivo, B. D. (2009). The partitioning behavior of Cl, S, and H2O in aqueous vapor- saline-liquid saturated phonolitic and trachytic melts at 200 MPa. Chem. Geol. 263, 19–36. doi: 10.1016/j.chemgeo.2008.10.017
Wright, H. M., Cashman, K. V., Mothes, P. A., Hall, M. L., Ruiz, A. G., and Le Pennec, J. (2012). Estimating rates of decompression from textures of erupted ash particles produced by 1999–2006 eruptions of Tungurahua volcano, Ecuador. Geology 40, 619–622. doi: 10.1130/G32948.1
Keywords: Tungurahua, SO2, BrO, ratio, degassing, volcano, DOAS, NOVAC
Citation: Warnach S, Bobrowski N, Hidalgo S, Arellano S, Sihler H, Dinger F, Lübcke P, Battaglia J, Steele A, Galle B, Platt U and Wagner T (2019) Variation of the BrO/SO2 Molar Ratio in the Plume of Tungurahua Volcano Between 2007 and 2017 and Its Relationship to Volcanic Activity. Front. Earth Sci. 7:132. doi: 10.3389/feart.2019.00132
Received: 31 July 2018; Accepted: 14 May 2019;
Published: 02 July 2019.
Edited by:
Alessandro Aiuppa, University of Palermo, ItalyReviewed by:
Mattia Pistone, Université de Lausanne, SwitzerlandStefan Bredemeyer, Helmholtz Centre Potsdam, Germany
Copyright © 2019 Warnach, Bobrowski, Hidalgo, Arellano, Sihler, Dinger, Lübcke, Battaglia, Steele, Galle, Platt and Wagner. This is an open-access article distributed under the terms of the Creative Commons Attribution License (CC BY). The use, distribution or reproduction in other forums is permitted, provided the original author(s) and the copyright owner(s) are credited and that the original publication in this journal is cited, in accordance with accepted academic practice. No use, distribution or reproduction is permitted which does not comply with these terms.
*Correspondence: Simon Warnach, cy53YXJuYWNoQG1waWMuZGU=