 Merily Lakson
 Piia Post
 Mait Sepp
- 1Department of Geography, University of Tartu, Tartu, Estonia
- 2Institute of Physics, University of Tartu, Tartu, Estonia
In comparison to the global average, the climate in the Baltic Sea region, including in Estonia, has warmed particularly fast. From synoptic climatology’s point of view, a question can be posed: is this warming caused by changes in the frequency of particular circulation types or has warmer weather started accompanying these types? The main aim of the present study is to analyze the relationship between the increase of air temperature and changes in atmospheric circulation during the period of 1966–2015. Changes in the frequency of circulation types belonging to 12 classifications from the COST733 data set and changes in accompanying air temperature were analyzed. The circulation types were divided into “warm” and “cold” for a given season according to daily temperature anomalies in three Estonian meteorological stations. On the basis of the similar air flow direction, circulation types from different classifications were selected for inter-comparison. Linear trend analysis showed that there were only a few statistically significant (p < 0.05) changes in the frequency of circulation types. The major changes occurred in spring – the frequency of eastern and northeastern flow types decreased, and the frequency of types related to northwestern flow increased. However, the positive temperature anomalies increased for practically all circulation types. Particularly strong warming has taken place in winter “cold” types. In conclusion, the increase of Estonian air temperature during the analyzed period is more likely associated with the changes of temperature within circulation types than of their frequency.
Introduction
Climate change, especially global warming is one of the major challenges of our time. The average global air temperature of the last decades is already about 0.8°C above the 20th century average of 13.9°C (IPCC, 2014; NOAA, 2018). However, the air temperature in the Baltic Sea basin is warming even more rapidly. In the Northern part of the Baltic Sea basin (north of 60°N) the annual mean temperature anomalies from 1871 to 2011 were 0.11°C per decade and in the Southern part (south of 60°N) 0.08°C per decade (BACC Author Team, 2015). Studies on Estonia have shown that the air temperature in Estonia has risen about 2°C during the last half century (Jaagus, 2006; Jaagus et al., 2014).
Estonia lies in the transition zone between maritime and continental climate on the eastern coast of the Baltic Sea (Figure 1). As the Baltic Sea and Estonia are situated in relatively high latitudes, atmospheric circulation is one of the principal factors that determines the climate variability here (Keevallik, 2003; Jaagus, 2006). The Baltic Sea region is mainly controlled by the North Atlantic Oscillation (NAO) and the impact of the NAO is most pronounced during the cold half-year from November to March (Hurrell, 1995; Hurrell et al., 2003; Keevallik, 2003; Kyselý and Huth, 2006; BACC Author Team, 2015). There are numerous studies linking changes in NAO indexes with changes in climate variables in Estonia (e.g., Keevallik, 2003; Jaagus, 2006; Jaagus et al., 2008; Jaagus and Suursaar, 2013). In general, rainy, and mild winters in Estonia, as well as decrease of the Baltic Sea ice (Jevrejeva et al., 2004) or increased storminess (Jaagus et al., 2008; Jaagus and Suursaar, 2013), can be explained by the domination of the positive phase of the NAO index. However, those connections are not persistent in time and space (Jevrejeva et al., 2004; Lehmann et al., 2017; Sepp et al., 2018) and contain some contradictions. For example, it is known that the NAO index shows long-term variability, but from the mid-1960s to the mid-1990s it was in a generally positive phase (Hurrell, 1995; Hurrell et al., 2003). After the mid-1990s, there was a trend toward more negative NAO index values (Hurrell et al., 2003; Kyselý and Huth, 2006), meaning that mild winters should have been replaced by severe winters. But this has not happened.
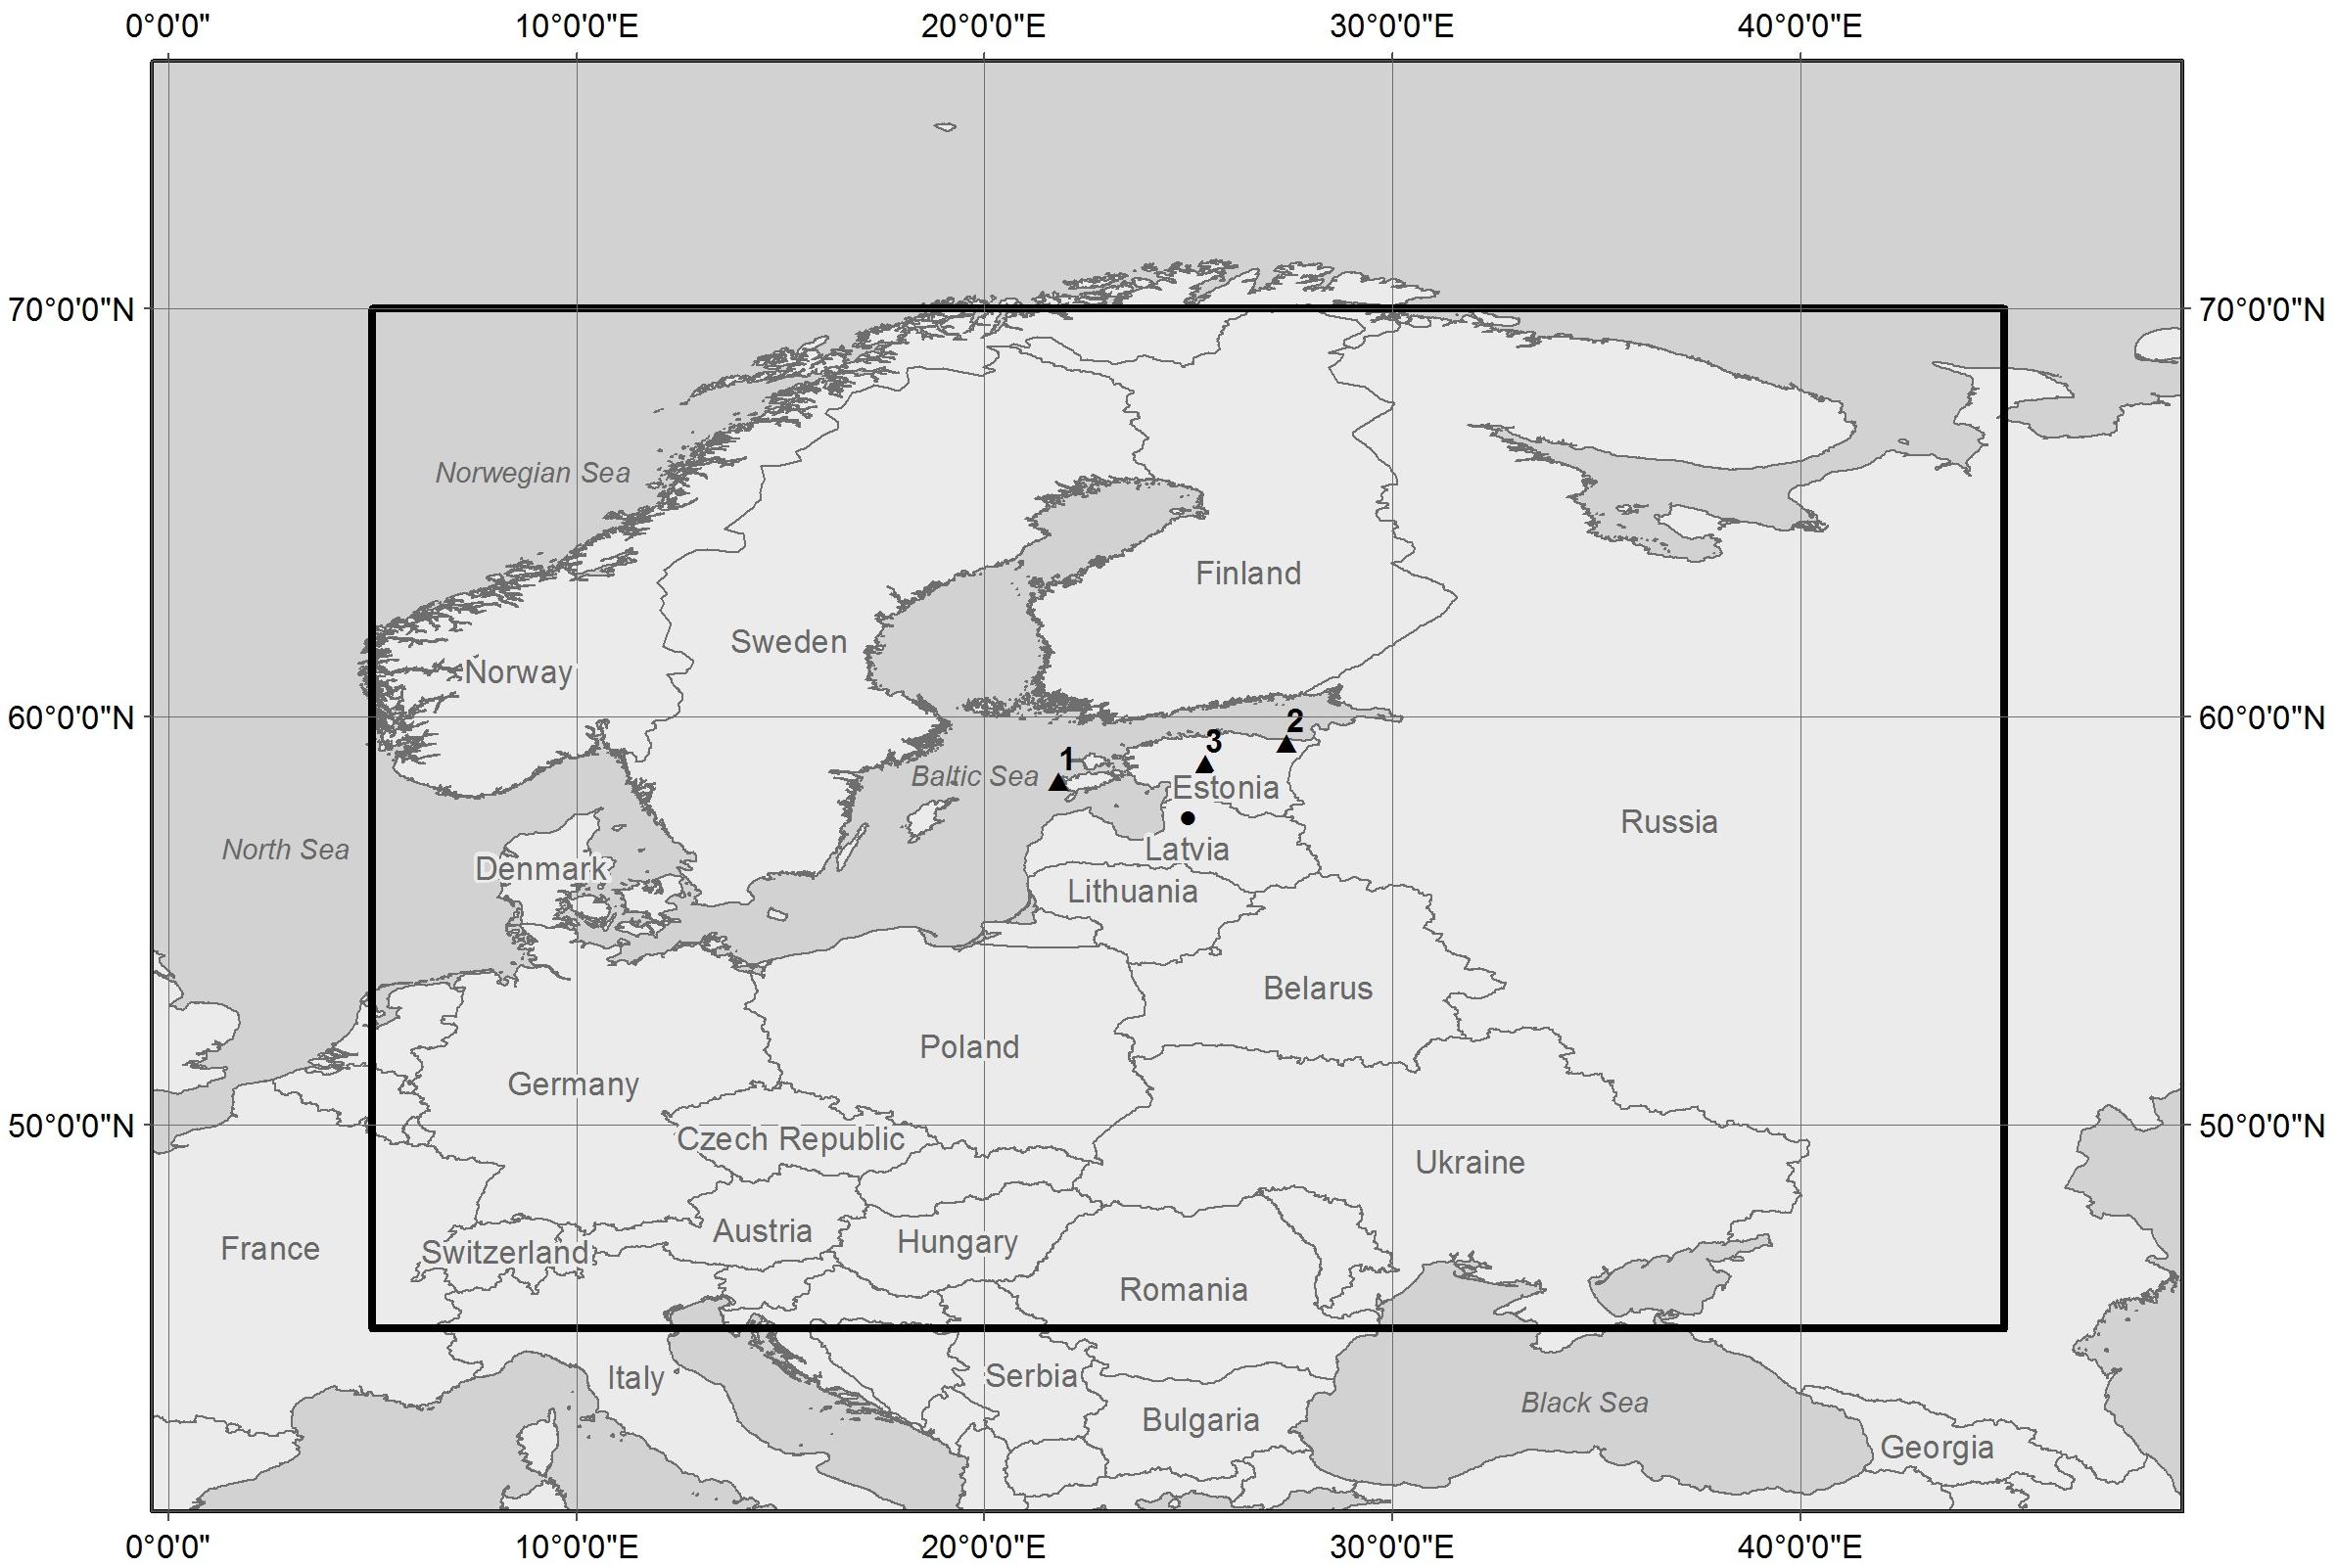
Figure 1. Study area. Dark line: the border of the domain. Black dot: the center of the domain. Triangles: positions of meteorological stations (1, Vilsandi; 2, Jõhvi; 3, Türi).
Various studies (Jaagus, 2006; Hoy et al., 2013; Cahynová and Huth, 2016) suggest that the changes in air temperature over the last decades have been due to the changes in atmospheric circulation. From synoptic climatology’s point of view, air temperature rise may either be caused by increased frequency of particular “warm” circulation patterns or they started to bring warmer air masses. As mentioned in the previous section, many studies (e.g., Sepp and Jaagus, 2002; Jaagus, 2006; Hoy et al., 2013; Cahynová and Huth, 2016) indicate that warming in winter is mainly caused because the frequency of westerly circulation types that bring warm air from the ocean during winter have increased.
On the other hand, the internal variability of circulation types – for example, whether the types themselves have warmed up – has been rarely studied. Results from Beck et al. (2007) and Cahynová and Huth (2016) indicate that the long-term variations in climate and seasonal temperature trends can only partly be explained by the changing frequency of circulation types. They suggest that both frequency-related and within-type changes play a certain role in the observed climatic trends. However, Cahynová and Huth (2016) also emphasized that the observed climatic trends are rather caused by changing climate within circulation types in spring, summer and autumn.
The main objective of the present study is to analyze the relationships between the air temperature rise and changes in atmospheric circulation in Estonia during the period of 1966–2015. The questions we pose are (1) whether the air temperature change in Estonia is related to changes in the frequency of circulation types, and (2) has the air temperature relative to circulation types changed. In addition, we try to explain the reasons under the trends that have emerged in our study.
Data and Methods
Air Temperature Data
We used temperatures from three meteorological stations – Vilsandi, Türi, and Jõhvi (Figure 1). Vilsandi is a coastal station representing the maritime climate region of Estonia, while Türi and Jõhvi are inland stations; the latter one represents a slightly more continental climate (Jaagus and Truu, 2004). Due to the non-homogeneity and missing data issues in earlier time series of these three meteorological stations, our data set consisted of daily average air temperature from the period of 1966–2015 obtained from the Estonian Weather Service.
Circulation Classifications
The variety of methods and algorithms used to classify daily circulation patterns is large (Yarnal, 1993; Huth et al., 2008). COST Action 733 “Harmonization and Applications of Weather Type Classifications for European Regions” gathered and analyzed a set of 33 methods or algorithms that have been used to classify daily circulation patterns (Philipp et al., 2016; Tveito et al., 2016). This comprehensive set consists of well-known manual classifications, where the expertise of meteorologists has been applied up to methods that are used in data mining and machine learning. A lack of inherent structure in the daily fields of classified variables is the reason why there is no clear statistical ground to prefer any of these known methods (Philipp et al., 2016). Huth et al. (2016) conclude that different classification methods tend to perform differently, depending on number of classes, season, climate variable, size of the domain and the region. This means that for a certain purpose a variety of methods should be assessed to obtain unbiased and generalizable results.
We selected seven circulation classification methods which performed best with temperature in small domains (Huth et al., 2016) from this COST733 data set (see Table 1). These classifications belong to the following methodological groups: threshold-based classifications, principal component analysis-based and optimization methods. Threshold-based classifications rely on the concept of subjectively pre-defined types, which are assigned automatically by using threshold values for certain indices. Most often the indices characterize the strength of large-scale air flow meridional and zonal components and vorticity. Principal component analysis-based classifications are grounded in empirical orthogonal functions of various matrixes, either in S- or T-mode [KRZ uses S-mode, i.e., grid points correspond to rows of the data matrix and time realizations (days) to its columns]. The idea of optimization methods is to arrange the whole set of objects under study (the objects here are days with different circulation patterns) into groups (circulation types) in such a way that a certain function is optimized. In most circulation classifications based on optimization methods, the purpose of this optimization is to minimize the within-type variability measured as the overall sum of the Euclidean distances between the member objects of a type and the average of the type (centroid). Here are represented k-means clustering algorithm (CKM, CAP) as well as hierarchical clustering (HLC) (Philipp et al., 2016; Tveito et al., 2016).
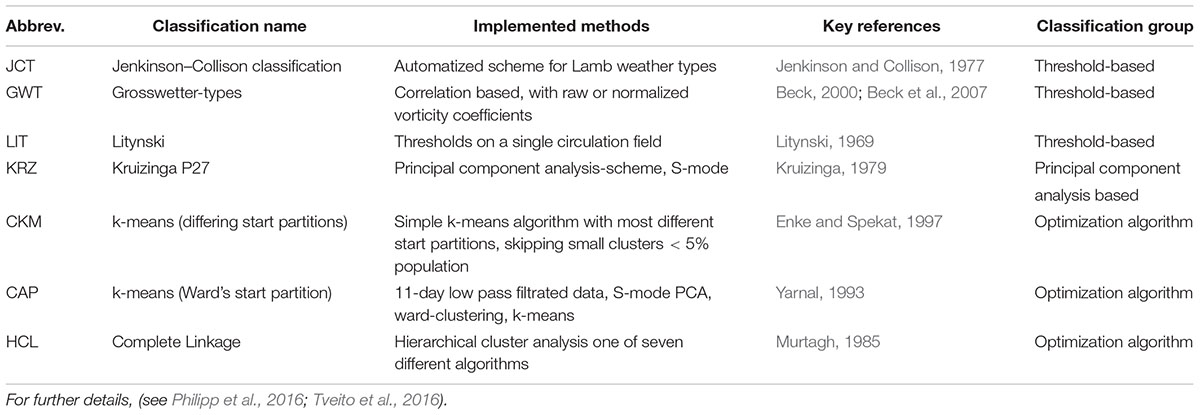
Table 1. Classification methods applied in the present study, the list includes abbreviations used within this paper, commonly used names of the methods, the key references of methods and the methodological group.
Daily fields of mean sea level pressure fields from NCEP/NCAR reanalysis (Kalnay et al., 1996) are classified into circulation types for the period 1948–2015. As we need to use a rather large sample of methods that are applied in the same way to the same data set, then we used a cost733class software (Philipp et al., 2016). Cost733class is an open source software package that has been developed especially for creating, comparing and evaluating classifications in various versions (Philipp et al., 2016). All methods from the COST733 data set have been programmed there as subroutines in order to apply it to the same input data. This software enables people to use their own data files, to vary the number of types, to classify the whole year or only by season, etc. If the same parameters are used for all the methods, then the differences among classification results may be ascribed to the classification algorithm itself and not to the different ways they are used (Philipp et al., 2016). We used the nine type versions of classifications only. However, several classifications have two versions, either with 8 and 10 (GWT) or 9 and 10 types (CKM, CAP, HCL), thus altogether 12 classifications (Table 1) were compared here.
The calculations produced catalogs of classifications, where each day is specified by one certain circulation type from every classification. As we used only Estonian air temperature point measurements, and the types characterize circulation best in the center of the domain, we calculated classifications for the domain 5° E – 45° E and 45°N – 70° N, centered in 25° E and 57.5° N (Figure 1). Our domain size is remarkably smaller than the area that is characteristic for the NAO type of atmospheric teleconnections, which are known not to influence local weather in summer. However, we can assume that circulation types, created specifically for a small domain, reflect local specificities as well.
The maps of GWT10 circulation types for our domain are shown in Figure 2. Presented are eight main directional types plus the cyclonic (C) and anticyclonic types (AC). The size of the domain suits the synoptic scale: the positions of one cyclone and anticyclone determine the geostrophic air flow over the domain. The circulation types are derived by calculating correlations with prototype fields of zonal flow, meridional flow and cyclone in the center of the domain (Beck et al., 2007). Types are easily interpretable and the days belong to the same types regardless of whether a different period is used for classification.
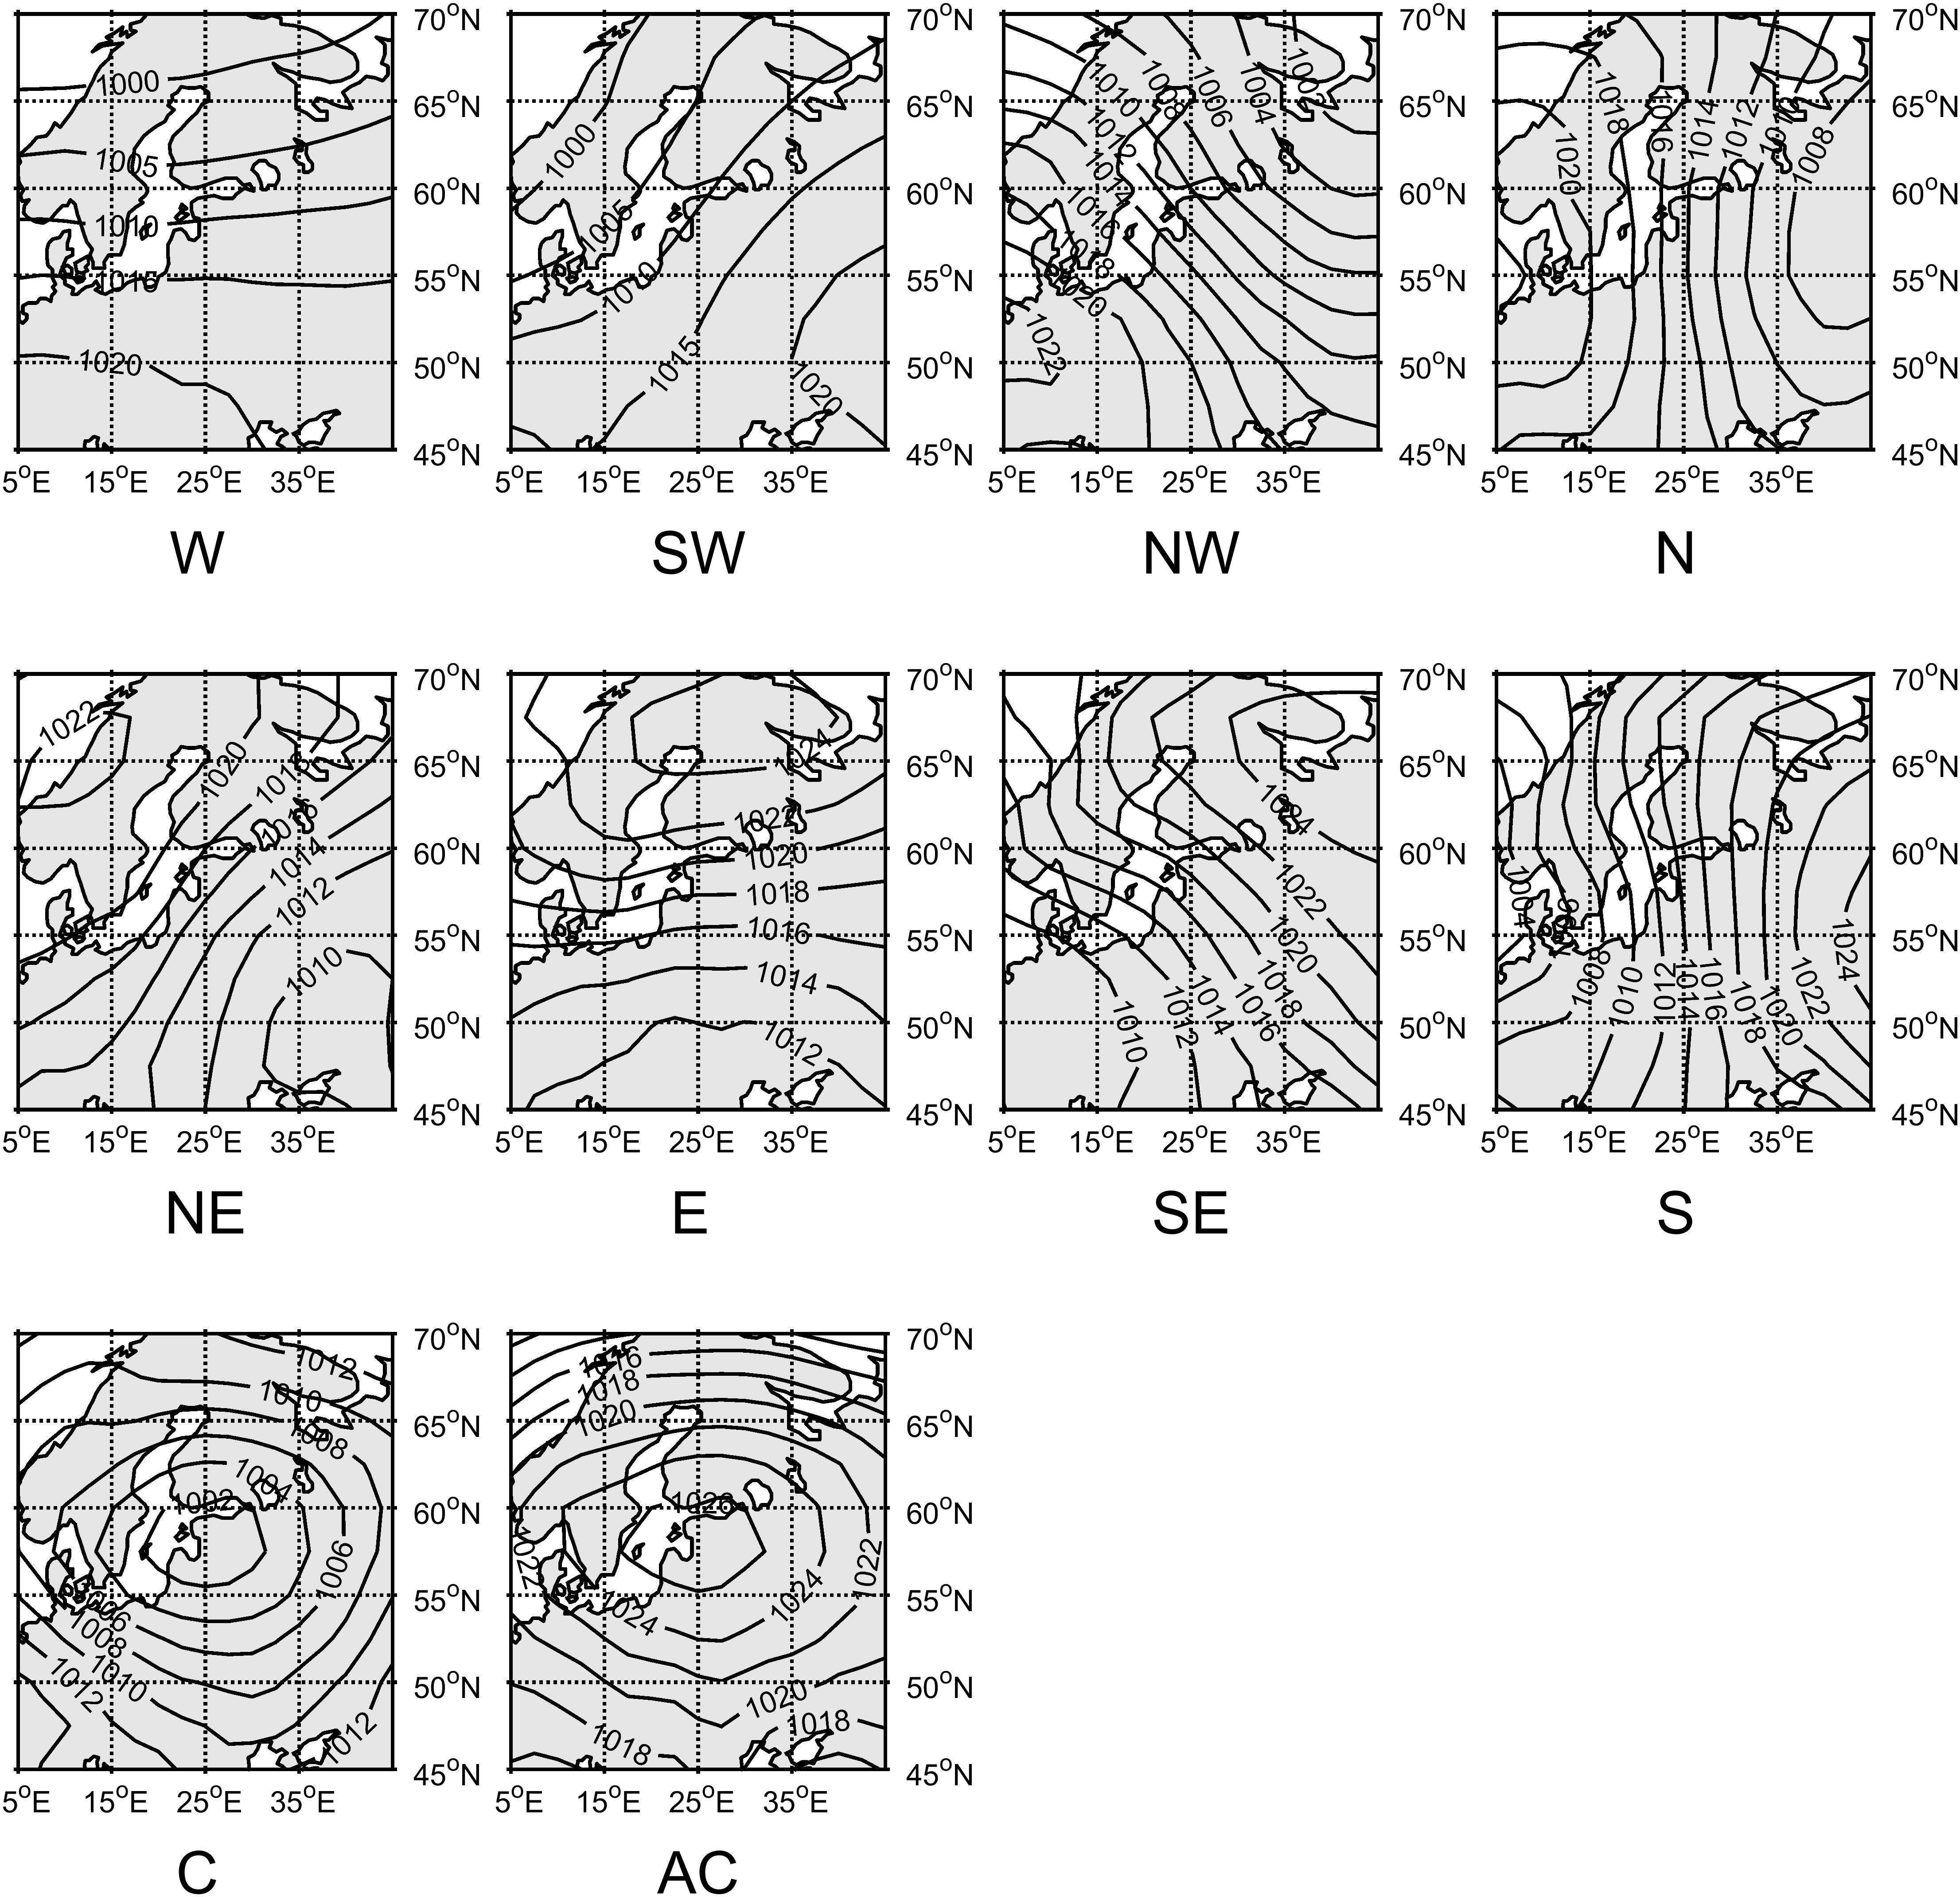
Figure 2. Mean sea level pressure values for GWT10 weather types estimated from daily values for 1948–2015. Directional types W, SW, NW, N, NE, E, SE, S, and C – cyclonic and AC – anticyclonic type.
Methods
All the analysis is carried out using the common seasons – spring (MAM), summer (JJA), autumn (SON), and winter (DJF). December belongs to the preceding year and because of that, the winter time series is shorter by 1 year (1967–2015). Annual averages were not used here as the same circulation type can cause warm weather in summer and extreme cold in winter.
As a first step we defined “warm” and “cold” circulation types – i.e., types that are accompanied by either positive (warm) or negative (cold) air temperature anomalies during the given season. For that we calculated the daily long-term average temperatures for the period of 1966–2015; the 29 of February was left out. As the daily average air temperature varies highly between years (especially in winter), some random extreme values can significantly bias circulation types’ long-term average temperatures. Thus, we approximated annual air temperature by cosine function (Figure 3). The Excel function “Solver” was used to find the optimal parameters for the function.
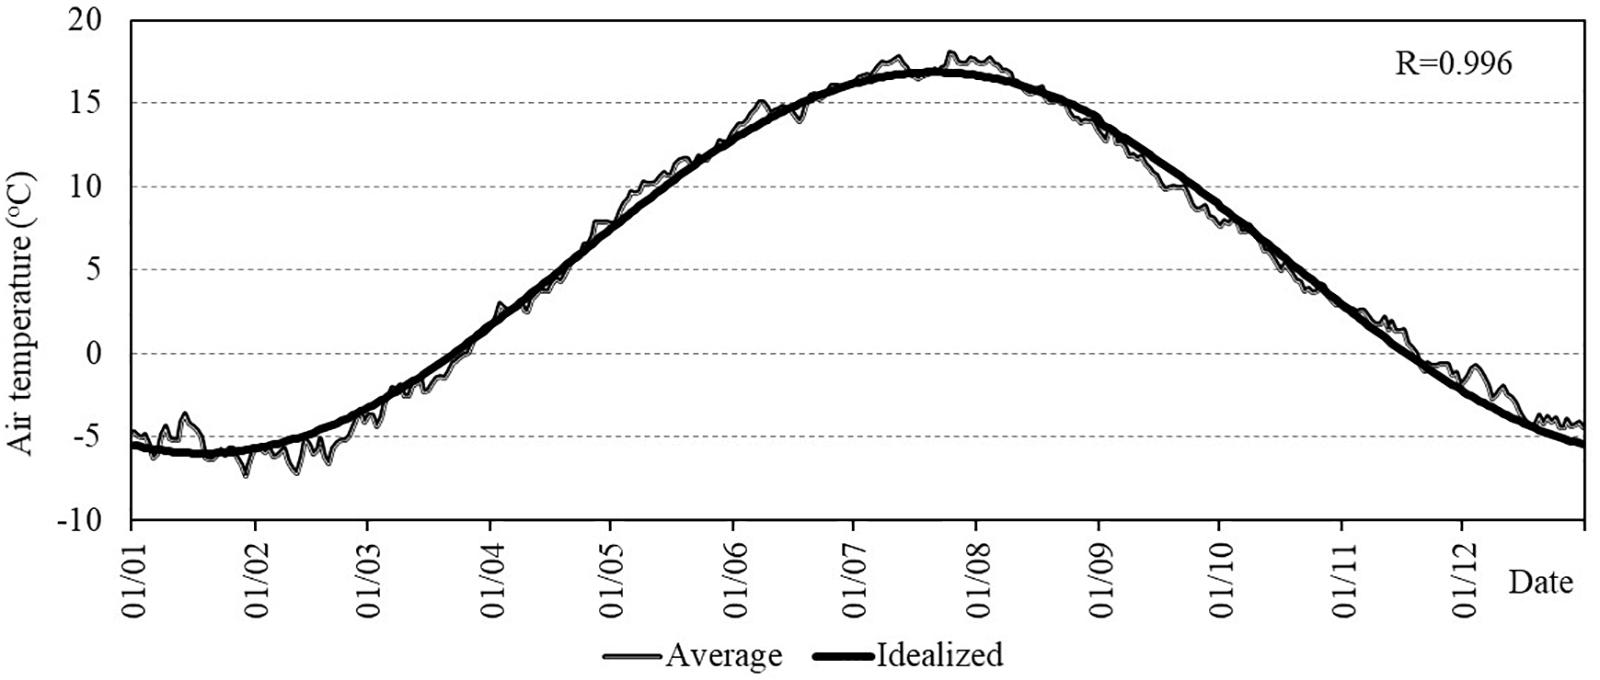
Figure 3. The modeled (idealized) daily average temperature of Türi station for the period 1966–2015 and the daily long-term average temperature of the same period. The correlation coefficient R was found between the model and the average temperature for each calendar day averaged over all years. Türi idealized temperature X was calculated using the following equation:
X = -11.429 ⋅ cos(0.017098 · t + (−2.40077)), (1)
where t is the day of year.
Thus, the temperature anomaly is a deviation from the idealized air temperature curve. As a next step we sorted out daily temperature anomalies for each given circulation type. If the long-term average temperature anomaly for a season was positive, the circulation type was considered as “warm” – if negative, then “cold.”
We wanted to intercompare the circulation types from various classifications from the side of airflow direction that is considered, in our minds, to represent either cold or warm advection. We calculated a catalog of circulation types that in most cases are somewhat anonymous, i.e., the name of the type is just a number. The task of circulation classifications is to describe the highly variable atmospheric circulation by dividing the daily airflow patterns into a quite small number of characteristic classes/types. In this study we used classifications with nine types. It is reasonable to assume that if these kinds of discrete states really exist, then all classifications should contain types with similar flow patterns according to the positions of low- and high-pressure areas. In order to understand which types represent similar circulation conditions we, at first, visually intercompared mean sea level maps of all circulation types from all classifications. We classified the circulation types according to the similarity of air flow directions and used GWT10 types as the reference due to the straightforward interpretation of its ten circulation types (Cahynová and Huth, 2016).
As the numbers of types in classifications were the same and the majority of patterns in different classifications were visually very similar, an overlap analysis was conducted. The main aim of this analysis was to understand whether the types of similar airflow from different classifications occur at the same day. We compared GWT10 types with other classifications’ similar circulation types and counted in how many days similar types co-occurred.
Linear trend analysis (p < 0.05) was used to describe changes in time series of circulation types and air temperature in the period of 1966–2015 as well as in the sub-periods 1966–1991 and 1992–2015. In addition, we analyzed trends for 30-year sub-periods to show how sensitive the sign and magnitude of the trend are depending on the starting and ending point.
Results and Discussion
Although the Türi, Vilsandi, and Jõhvi meteorological stations represent different microclimatic regions of Estonia, no substantial differences occurred in the results of these three stations. Thus, here we demonstrate only the results of Türi station as it represents the majority of air temperature variations on the Estonian mainland.
The overlap analyses showed somewhat controversial results. On one hand the patterns of circulation types of different classifications are visually very similar with each other and well compatible with the corresponding patterns of the GWT10 types. Still, some classifications do not contain certain patterns and some patterns are not comparable with GWT10 patterns. The percentage of co-occurrence of similar circulation type with a corresponding GWT10 type is also relatively low (Table 2). These results suggest that although the averaged maps of circulation types may look similar, the sets consist of actually quite variable circulation conditions. This supports the understanding (Philipp et al., 2016; Tveito et al., 2016) of why so many different methods are needed to classify circulation patterns, and there is not just one best classification that exists. Philipp et al. (2016) found that even the same group classification methods show often low similarity. This is also the reason why the following results are presented in a generalized mode, and analysis of any exact circulation type is avoided if possible.
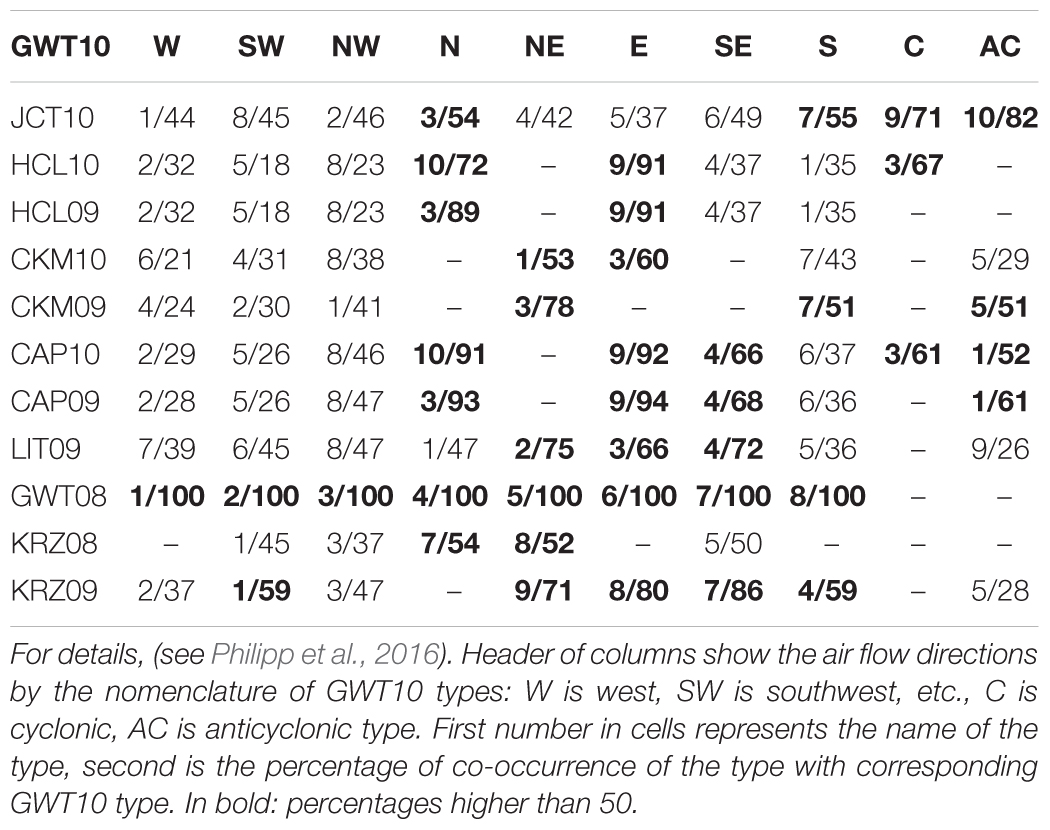
Table 2. Visually similar circulation types and percentage of co-occurrence. First column: names of classifications.
Defining “warm” and “cold” types gave rather expected results (Table 3). Air temperature anomalies showed clearly the advection of relatively cold or warm air masses. Thus, Northern types (N) are accompanied by negative temperature anomalies in every season and South-Western types (SW) are “warm” types all year around. Western types (W) represent the advection of maritime air masses from the North Atlantic that are relatively warm in winter but cold in summer. In general, Eastern types (E, NE, and SE) can be associated with the advection of continental air masses being extra cold in winter and extra warm in summer. In the case of the AC, a high pressure area is located in the middle of the domain, taking along radiative cooling in winter and warming in summer.
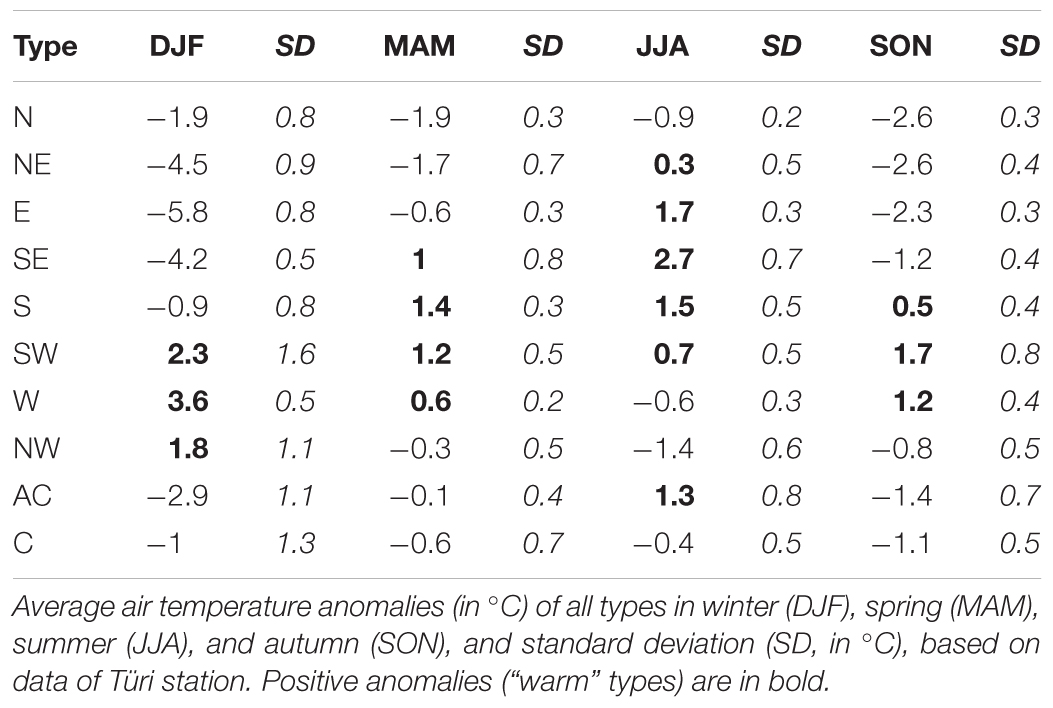
Table 3. “Warm” and “cold” types.
Values of air temperature anomalies shown in Table 3 are averages of long-term mean anomalies of all classifications. The relatively high standard deviation suggests again that similar types represent slightly different circulation conditions and may cause somewhat different weather. For example, CKM10 type SW is accompanied by a temperature anomaly of -0.6°C and the same SW type of CAP10, CAP09, and LIT09 by +3.8°C in winter. However, in general, there are only a few types whose “cold” or “warm” status would differ from the one presented in Table 3.
As several circulation types showed opposite air temperature anomalies in winter and summer, we analyzed trends in frequency and air temperature anomalies by seasons.
Winter
Based on the literature, the most drastic climate changes in Estonia have occurred in winter. For example, the long-term average air temperature has increased by 4°C in January during the last half century (Jaagus, 2006; Jaagus et al., 2017). All those changes have been reported both in Estonia (Tomingas, 2002; Jaagus, 2006; Jaagus et al., 2008) and in Europe (Kyselý and Huth, 2006; Cahynová and Huth, 2010, 2016; Küttel et al., 2011; Hoy et al., 2013; Kučerová et al., 2017) to be concurrent with the increase in the frequency and magnitude of western circulation. The increase in the frequency of the Western type has been explained by the NAO positive phase after the 1960s (Hurrell, 1995; Jaagus, 2006). Jaagus et al. (2008) found that the Western type became more frequent in winter at the expense of the cold eastern type. However, our analysis showed no such tendencies. Statistically significant changes in the frequencies of circulation types occurred only in a few classifications during the period of 1967–2015. Virtually no changes occurred in Western types (SW, W, NW, Table 4).
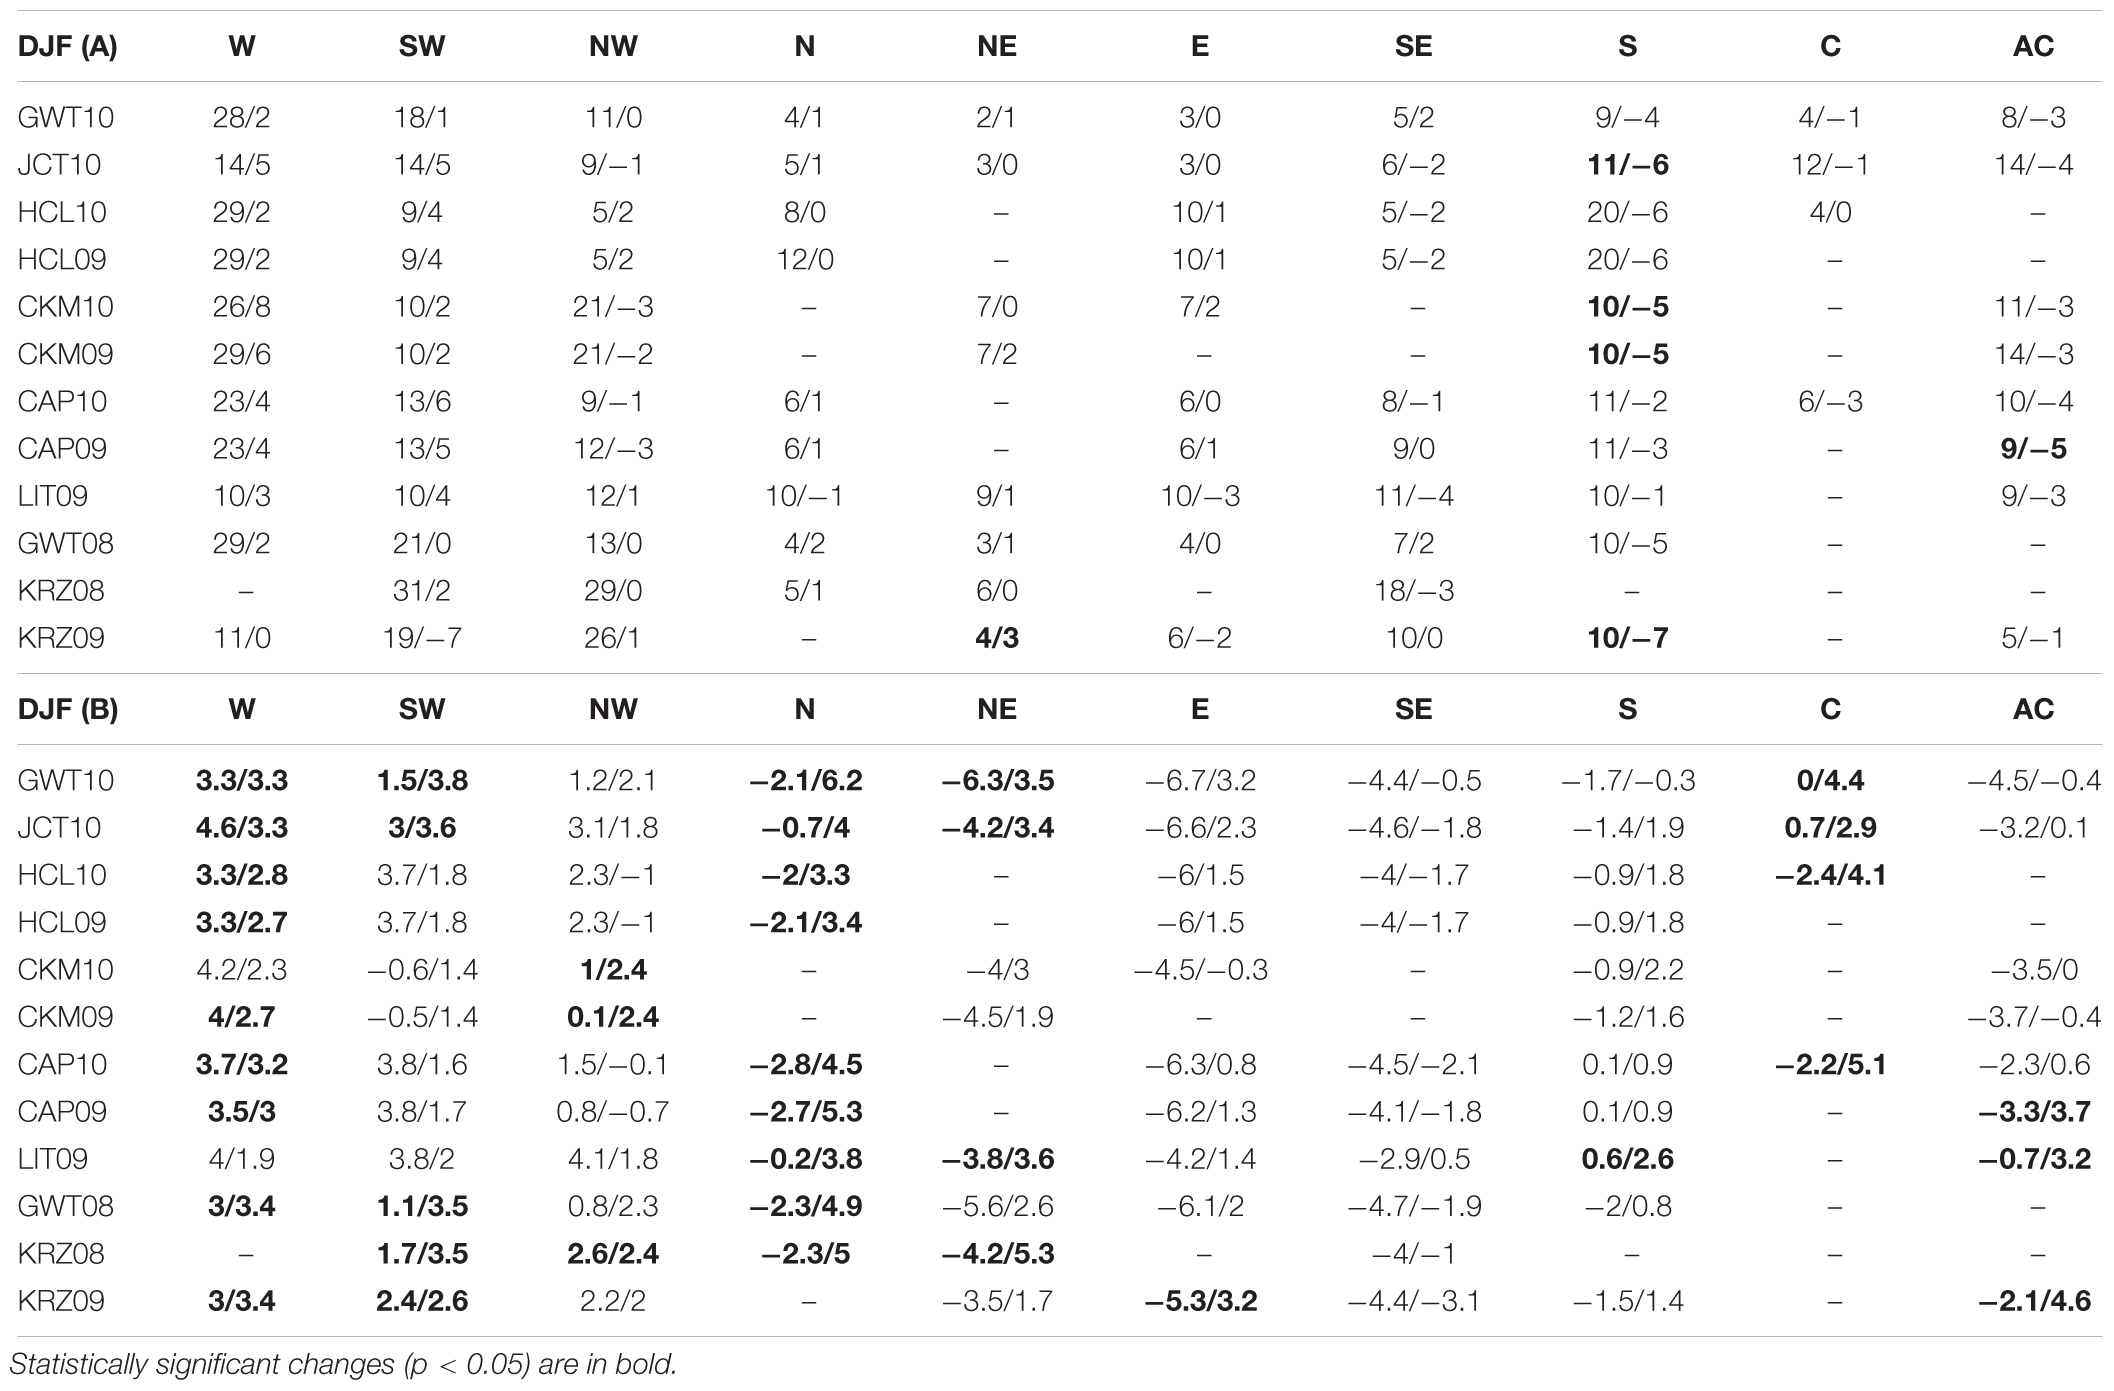
Table 4. Long-term average (1966–2015) frequency of circulation types (in days) and changes by trend line in days per the period in winter [DJF (A)] and long-term average air temperature anomalies (in °C) at Türi station associated with particular circulation types and changes by trend line in °C in winter [DJF (B)].
When looking at the temperature anomalies associated with circulation types at Türi station, the majority of analyzed time series show drastic increasing trends (Table 4). It is important to note that “cold” types have warmed up relatively more than “warm” ones, especially N and NE types. In general, those two types represent the advection of Arctic air masses. Some negative trends occurred in types of NW group.
Spring
As the winters become warmer and shorter, the springs start earlier and are warmer in Estonia (Keevallik, 2003; Ahas and Aasa, 2006; Jaagus, 2006; Schwartz et al., 2006; Jaagus et al., 2017). Our analysis showed that most of the statistically significant changes in the frequency of circulation types occurred in spring. Based on trends, we can observe certain shifts in atmospheric circulation: the occurrence of E and SE types have decreased while the frequency of extra cold N and cold NW types have increased (Table 5). This suggests that springs must have become cooler. However, the trends in the air temperature time series indicate exactly the opposite (Table 5). Basically, all circulation types have become significantly warmer during the period 1966–2015.
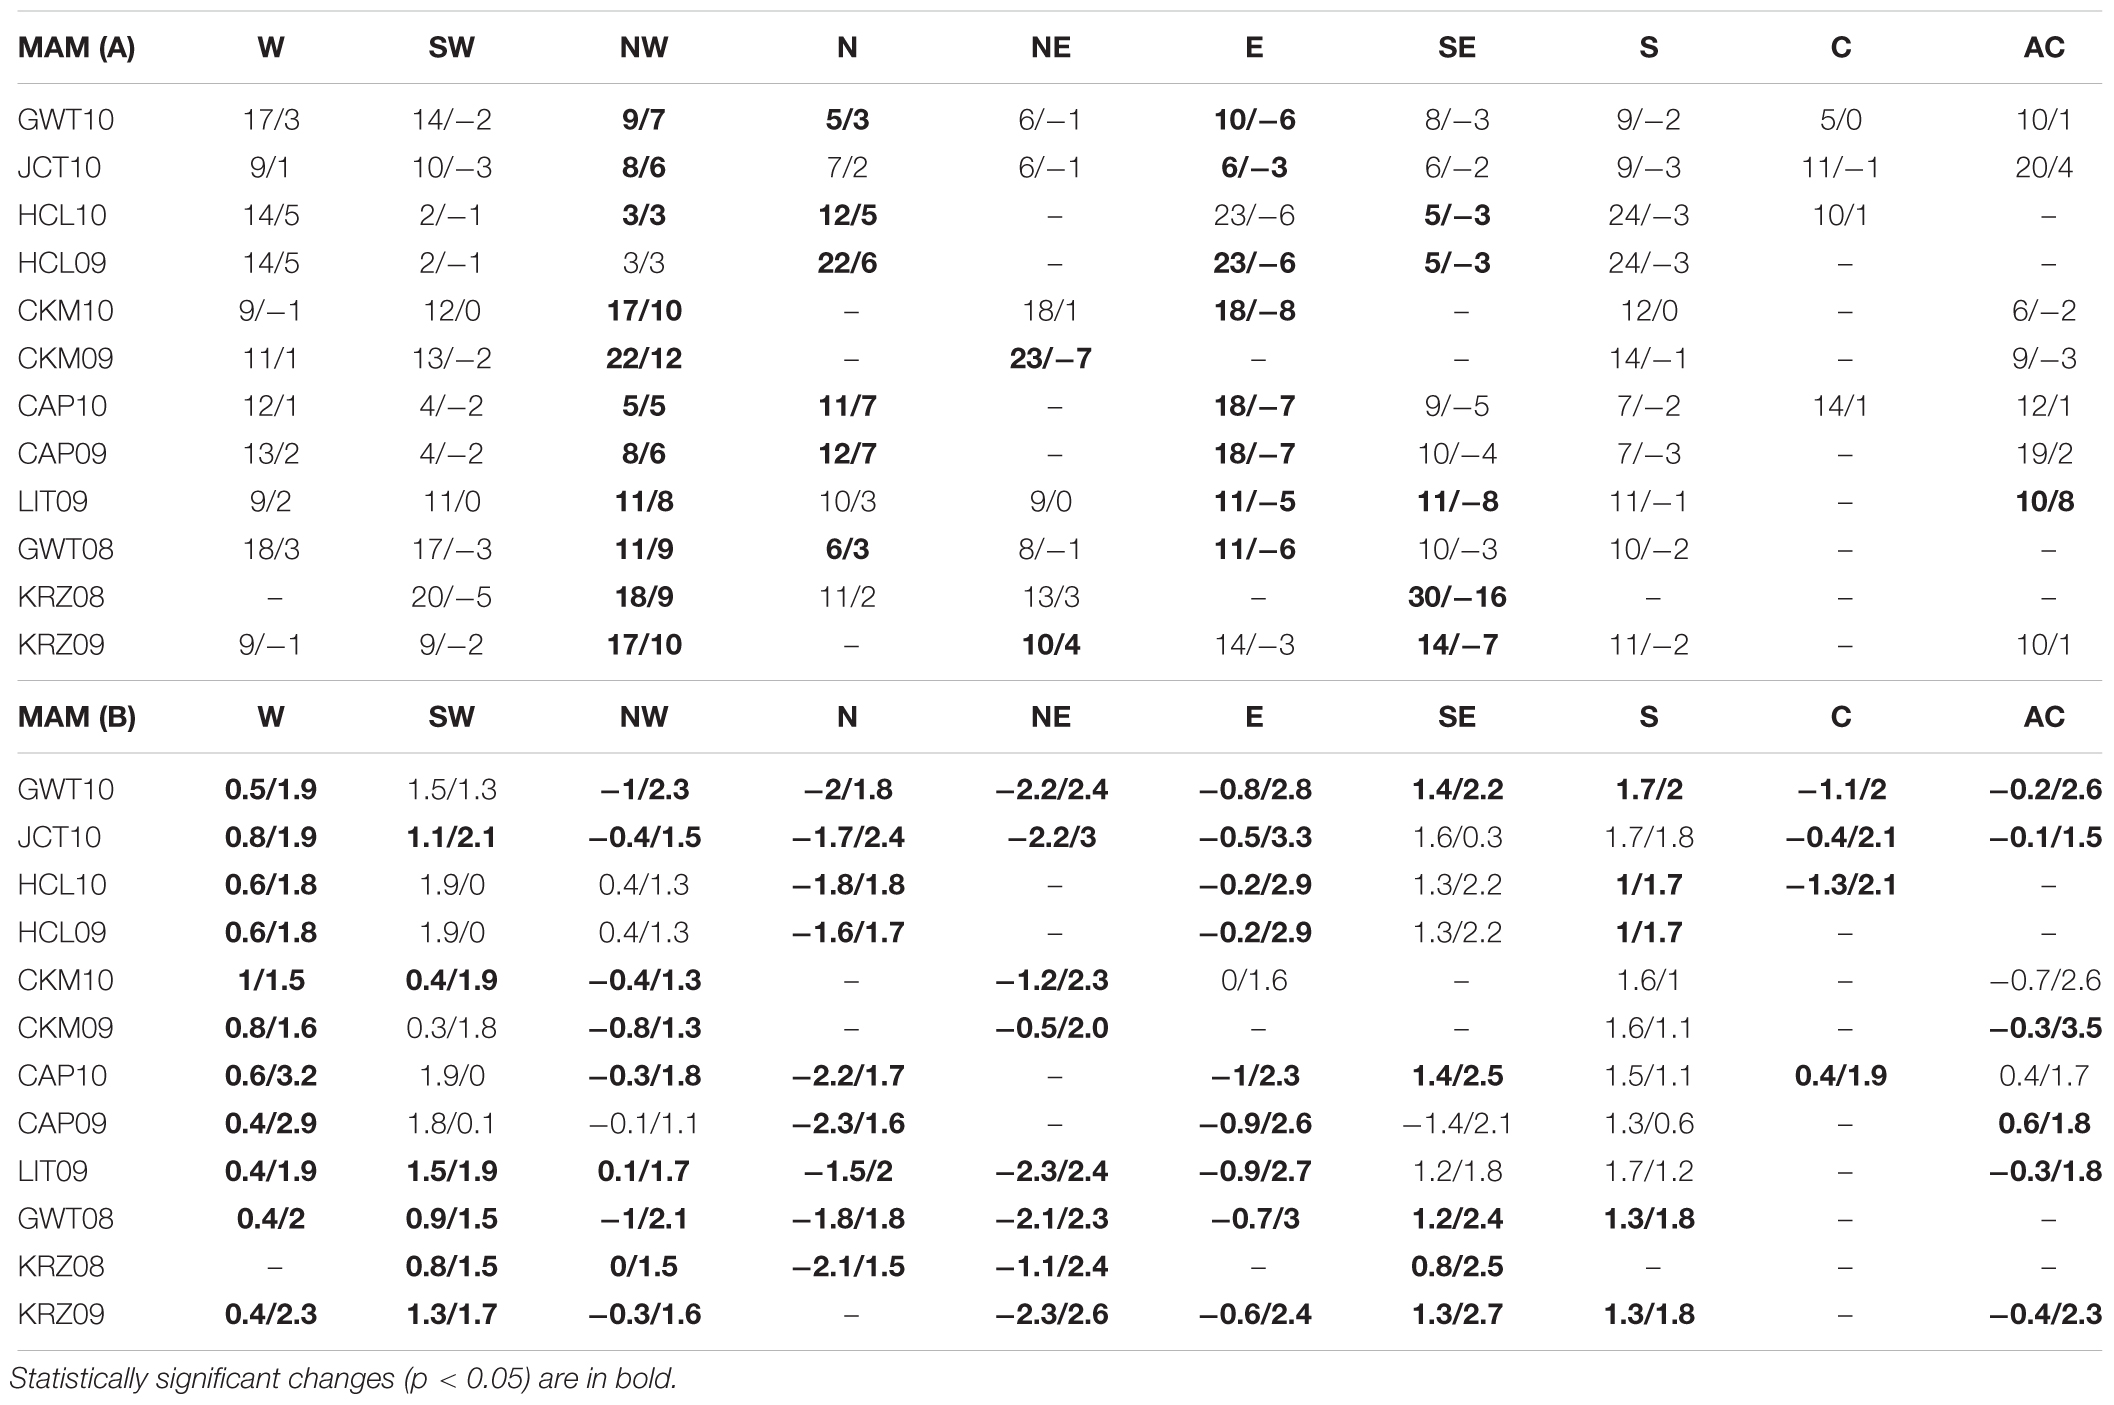
Table 5. Long-term average (1966–2015) frequency of circulation types (in days) and changes by trend line in days in spring [MAM (A)] and long-term average air temperature anomalies associated with circulation types at Türi station and changes by trend line in °C in spring [MAM (B)].
Summer
No significant changes in Estonian summer climate have been reported. The exception is the cooling tendency in June (Jaagus, 2006). Also, there were only a few statistically significant changes during 1966–2015 in our analysis. In general, we can talk only of some decrease (by ca 6 days) of NE type frequency and increasing tendencies of SE and S types’ frequencies (by 3–4 days). Those mentioned above are all warm types. The average temperature anomaly that accompanies the SE, S, and NE types is +2.7°C, +1.5°C, and +0.3°C, respectively.
Changes in air temperature indicate that almost all “warm” types have become cooler (except NE) and “cold” types warmer (except C) by about 1.5°C.
Autumn
Similar to summer, signals of climate change in autumn are reported to be somewhat vague (Jaagus, 2006). Our analysis also revealed just a few statistically significant changes in the frequency of types. Only the frequency of NW types has decreased by up to 6 days. However, almost all circulation types show positive trends in air temperature anomalies. In general, most intensive warming is characteristic for “warm” autumn types (S, SW, and W) which have become warmer by 1.7–2.9°C.
Plausible Reasons
The results of our trend analysis are somewhat contradictory. On one hand, the general lack of trends in time series of circulation types of COST733 classifications is concurrent with similar findings from Cahynová and Huth (2010, 2016) and Kučerová et al. (2017). At the same time, the lack of trends, especially in Western types in winter and the abundance of changes in spring, somewhat contradict the results of Kučerová et al. (2017) and many other works (e.g., Tomingas, 2002; Kyselý and Huth, 2006; Jaagus et al., 2008; Cahynová and Huth, 2010, 2016; Küttel et al., 2011; Keevallik, 2011; Hoy et al., 2013). Differences in the winter are so fundamental that they cannot be explained by differences in domain location or in the input database. For example, Kučerová et al. (2017) used air pressure data from ERA40 (Uppala et al., 2005) and domain 05 by COST733 Action (8°E – 34°E; 53°N – 68N), although the usage of different databases can cause substantial differences in classifications (Stryhal and Huth, 2017).
The search for the root cause of differences would be a separate topic for research and goes beyond the scope of the present paper. However, some conclusions can already be drawn by looking at trends in the frequency of types for the sub-periods 1966–1991 and 1992–2015. There are altogether only five statistically significant trends in the frequency of circulation types in the winters of 1967–2015 (Table 4), but 29 in the period of 1967–1991 and 52 in the period of 1992–2015. The most drastic changes occurred in the SE and especially in S types in the first half period. The frequency of those types decreased by up to 14 days (classifications HCL09, KRZ09, and HCL10). At the same time, the frequency of W types increased by up to 15 days (CAP09). In the second sub-period, however, the trends are opposite – i.e., the occurrence of E, SE, and S types have drastically increased (up to 19 days; KRZ08 E type) and the frequency of W, NW, and N types have steeply decreased (up to 21 days, W type of HCL09, and HCL10). All in all, the opposite tendencies of sub-periods tend to cancel trends of whole period (Figures 4, 5). The trends in the W type from the CAP09 classification calculated for 30-year running periods show clearly a strong rise up to the year 2000, while the trends from the 1980s are negative (Figure 5). A similar mismatch is between periods in other seasons. For example, the decrease of E and SE types in spring are mostly caused by negative trends in 1966–1991. However, the drastic increase of NW types (Table 5) is noticeable only in the period 1992–2015.
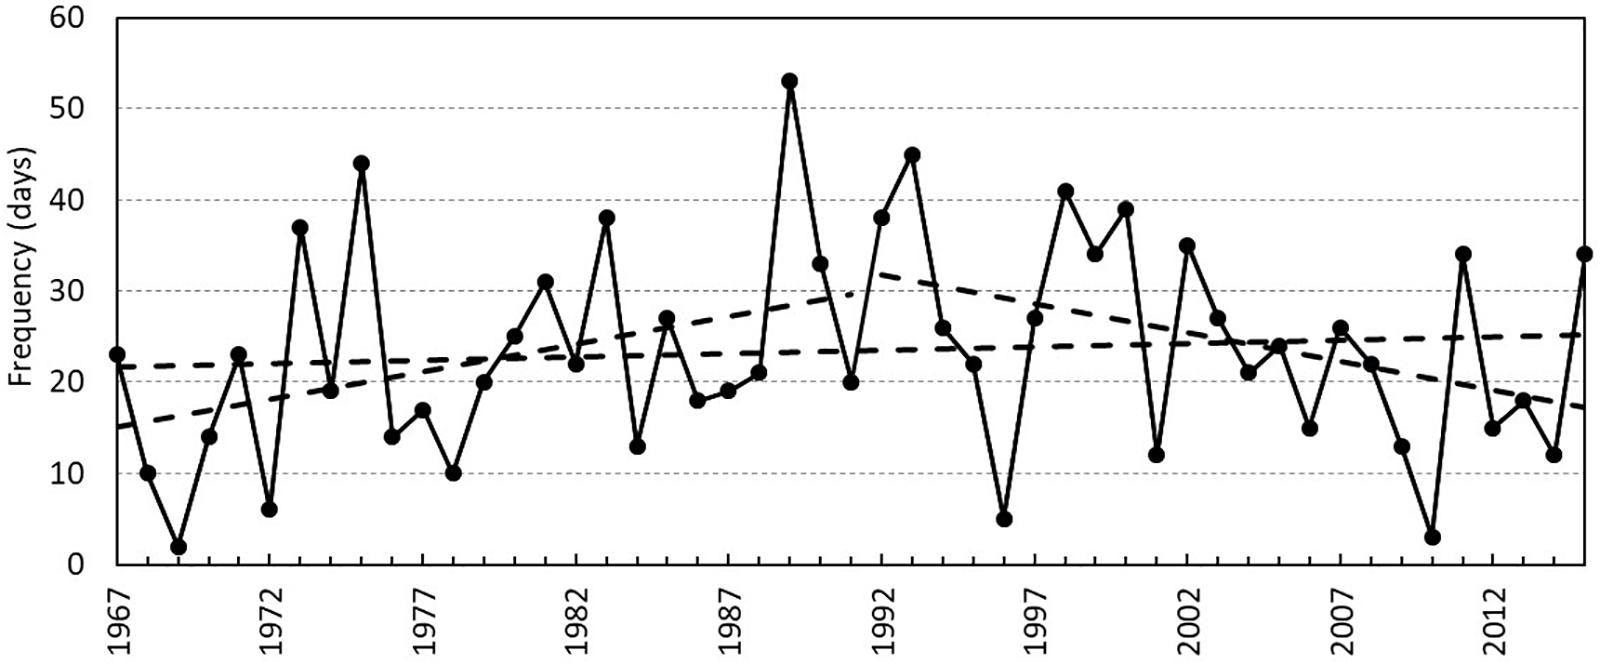
Figure 4. Frequency (in days) of CAP09 classification circulation type W and change by trend line in days in winter (1967–2015). Long trend line is for the whole period 1967–2015. Two shorter ones are for 1967–1991 and 1992–2015. Both short trend lines are statistically significant (p < 0.05), the long one is not.
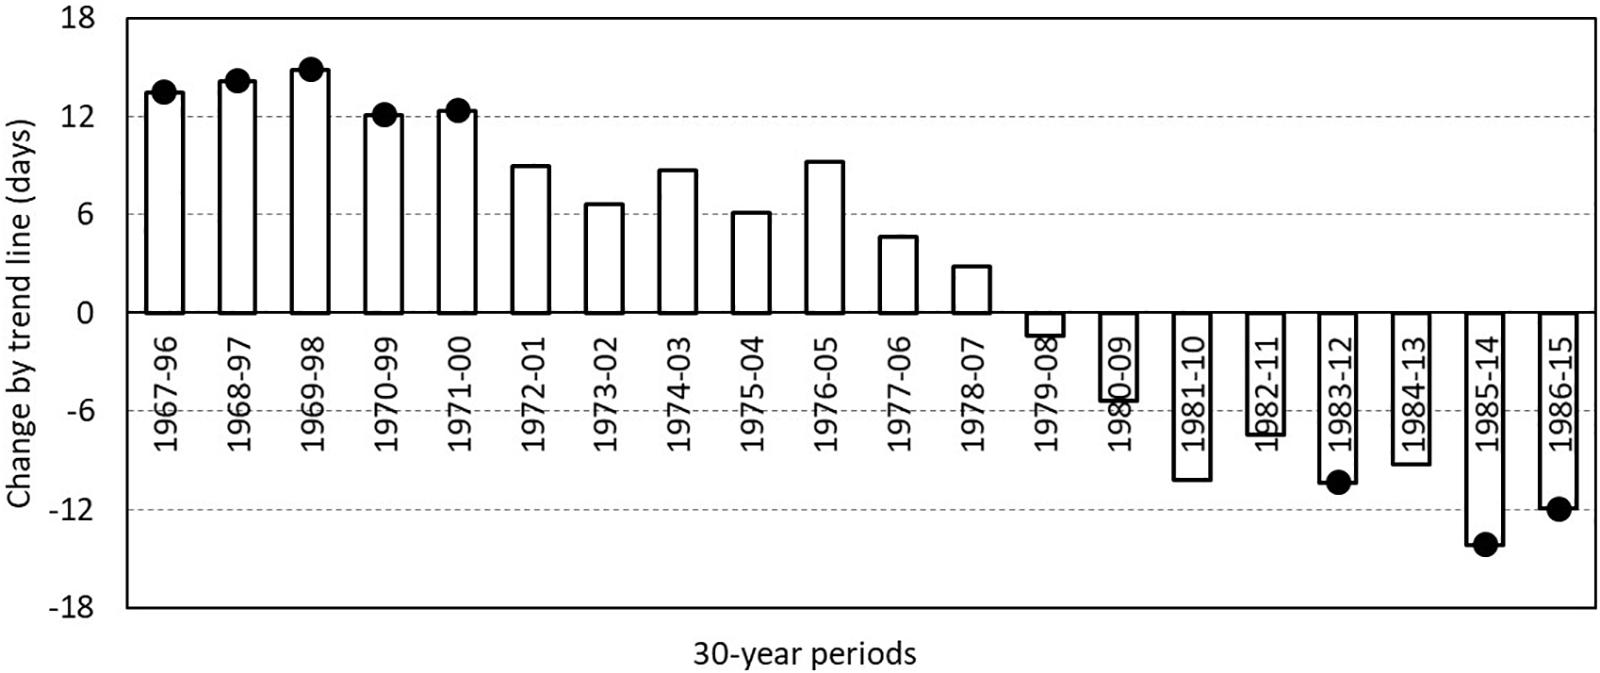
Figure 5. Running trends of frequency (in days) of CAP09 classification circulation type W for 30-year periods. Statistically significant (p < 0.05) trends are marked with black dots.
To some extent, the mentioned changes can be addressed as a sign of strengthening and an eastward shift of the NAO, and a north-eastward shift of storm tracks, reported in recent years (Jung et al., 2003; Pokorná and Huth, 2015; Kučerová et al., 2017). However, the issue of NAO interconnections with regional circulation patterns as well as with temperature is a complex subject that needs to be studied in more depth. One of the reasons for incomplete understanding is the non-stationarity of the NAO spatial pattern and the temporal correlations (Lehmann et al., 2011, 2017).
The increase in air temperature anomalies has been virtually univocal. Nevertheless, we may say that the warming in Estonia is only partly explainable by the changes in the frequency of circulation types. The other possibility is that the types themselves have become warmer either due to the changes in larger territory, meaning that the air advected here is already warmer, or due to the changes in other properties like cloudiness or humidity, which modify the energy budget and the heating takes place locally. It is a rather critical issue for synoptic climatology as the variation within types is rarely studied, because circulation types themselves are usually considered to be constant (Yarnal, 1993).
As mentioned, most drastic changes occurred in case of coldest types representing advection of Arctic air masses (N and NE) in winter and spring. Although still “cold” by long-term average anomalies, some Northern types can nowadays already be considered as “warm” (Figure 6). These positive temperature anomalies are found in years when this “cold” type has lower than average frequency, giving hints that lower persistence may mean warmer “cold” types.
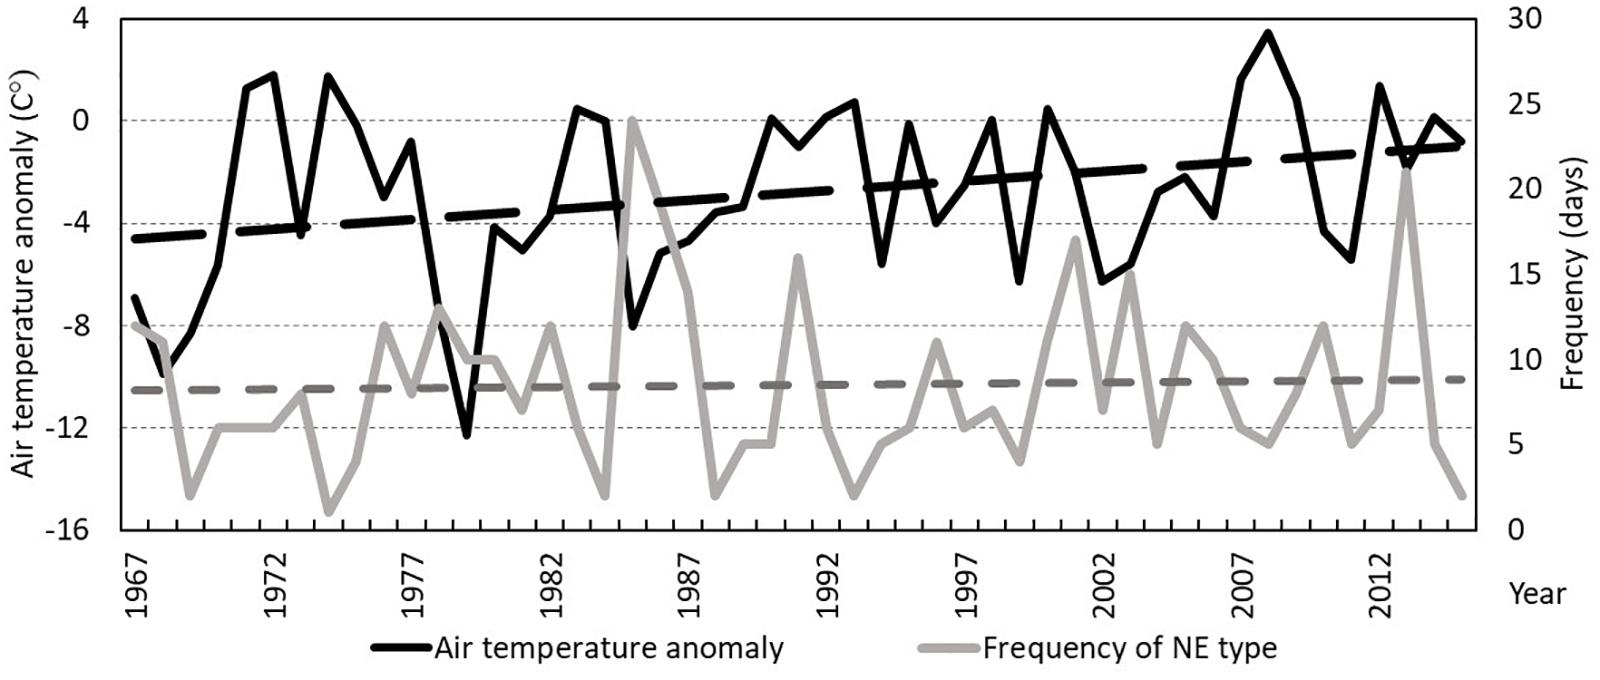
Figure 6. Frequency of LIT09 classification circulation type NE and change by trend line in days in winter (1967–2015). And long-term average air temperature anomaly associated with circulation types at Türi station and changes by trend line in °C in winter.
This kind of change may reflect, at least in some extent, the drastic warming and changes in the atmospheric circulation over the Arctic Basin, reported by numerous authors (e.g., Serreze et al., 2000; Bekryaev et al., 2010; Vihma, 2014; Walsh, 2014; Screen et al., 2018). At the same time, Küttel et al. (2011) argued that 70% of the variation in winter temperature in Europe can be explained by changes within types. But if, for example, the NE type has become warm in winter (Figure 6), it refers either to changes in the source domains of temperature advection or changes in pattern of the type. On the one hand it means that the territorial distribution of temperature in winter has changed in the larger European region. The airflow from this direction is now warm in this time of year. On the other hand, it can refer to the changes of positions of low- and high-pressure systems, defining the circulation type. Spatial fluctuation of those systems by several hundred kilometers does not necessarily redefine a type but can cause redirection of advection (Yarnal, 1993).
Conclusion
In order to examine how the rise in Estonian air temperature is associated with the changes in atmospheric circulation, circulation types from different classification methods were used. All the classifications vary to a degree and have their own specifics, so to understand if apparently similar types represent similar circulation conditions an overlap analysis was carried out. Analysis shows that north, northeast and eastern types are in the best overlapping, which in turn indicates that they describe atmospheric circulation situations, when a high-pressure system sets for several days. Western types are in the worst overlapping, from which we can conclude that each classification describes a slightly different circulation situation. This, however, means that the classifications are difficult to compare, and a relatively large number of different classifications must be used to obtain robust results.
Trends in circulation types’ frequency were studied by seasons and only few statistically significant trends can be observed during the whole period of 1966–2015. Most of the statistically significant changes in the frequency of circulation types occurred in spring. It contradicts with earlier studies, which have found an increase in the frequency and intensity of Western circulation types in winter and have explained with it the general tendency of winter warming in the Baltic Sea region. While analyzing the sub-periods 1967–1991 and 1992–2015 separately, we get trends with different directions. The frequency of Western types has increased rapidly (ca 12 days by trend line) in the period of 1967–1991, but since 1992, the frequency has decreased (-14 days). Altogether no statistically significant changes were given during 1967–2015 in winter.
We analyzed the changes in the mean air temperature of Jõhvi, Vilsandi, and Türi stations in 1966–2015. The average annual temperature rise in the three stations is in the range of 2–2.2°C. According to the trend line, the air temperature has risen most in winter, about 2.8°C. In spring, summer and autumn, the temperature rise is in the range of 1.5–1.9°C. However, it must be noticed that most drastic air temperature rise (up to 6°C by trend line) has occurred in the case of “cold” types (N and NE) in winter.
The general conclusion is that the warming in Estonia is only partly explained by the changes in the frequency of circulation types. Basically, the change in temperature is caused by the changes in the types itself. This, however, contradicts to the axiom of synoptic climatology and suggests the possibility that circulation types are not really constant.
Author Contributions
ML was responsible for collecting and analyzing the data, trend analyses, and preparing the manuscript. PP was responsible for calculations of circulation types and completing the manuscript. MS was responsible for the idea and methodology of the study.
Funding
This study was supported by the projects IUT2-16 and IUT20-11 of the Estonian Ministry of Education and Research, and the Estonian Research Council grant PUT1439.
Conflict of Interest Statement
The authors declare that the research was conducted in the absence of any commercial or financial relationships that could be construed as a potential conflict of interest.
Acknowledgments
We thank Evelyn Uuemaa for assistance. The software COST733class for calculating circulation types was worked out during COST action 733 “Harmonization and Applications of Weather Types Classifications for European Regions” and we are grateful to its creators.
References
Ahas, R., and Aasa, A. (2006). The effects of climate change on the phenology of selected Estonian plant, bird and fish populations. Int. J. Biometeorol. 51, 17–26. doi: 10.1007/s00484-006-0041-z
BACC Author Team. (2015). Second Assessment of Climate Change for the Baltic Sea Basin. New York, NY: Springer.
Beck, C. (2000). Zirkulationsdynamische variabilität im bereich nordatlantik-europa seit 1780. Würzburger Geographische Arbeiten 95:350
Beck, C., Jacobeit, J., and Jones, P. D. (2007). Frequency and within-type variations of large-scale circulation types and their effects on low-frequency climate variability in Central Europe since 1780. Int. J. Climatol. 27, 473–491. doi: 10.1002/joc.1410
Bekryaev, R. V., Polyakov, I. V., and Alexeev, V. A. (2010). Role of polar amplification in long-term surface air temperature variations and modern arctic warming. J. Climate 23, 3888–3906. doi: 10.1175/2010JCLI3297.1
Cahynová, M., and Huth, R. (2010). Circulation vs. climatic change over the czech republic: a comprehensive study based on the COST733 database of atmospheric circulation classifications. Phys. Chem. Earth 35, 422–428. doi: 10.1016/j.pce.2009.11.002
Cahynová, M., and Huth, R. (2016). Atmospheric circulation influence on climatic trends in Europe: an analysis of circulation type classifications from the COST733 catalogue. Int. J. Climatol. 36, 2743–2760. doi: 10.1002/joc.4003
Enke, W., and Spekat, A. (1997). Downscaling climate model outputs into local and regional weather elements by classification and regression. Clim. Res. 8, 195–207. doi: 10.3354/cr008195
Hoy, A., Sepp, M., and Matschullat, J. (2013). Large-scale atmospheric circulation forms and their impact on air temperature in Europe and northern Asia. Theor. Appl. Climatol. 113, 643–658. doi: 10.1007/s00704-012-0813-9
Hurrell, J. W. (1995). Decadal trends in North Atlantic Oscillation: regional temperature and precipitation. Science 269, 676–679. doi: 10.1126/science.269.5224.676
Hurrell, J. W., Kushnir, Y., Ottersen, G., and Visbeck, M. (2003). An overview of the North Atlantic oscillation. the North Atlantic oscillation. climatic significance and environmental impact. AGU Geophy. Monogr. 134, 1–35. doi: 10.1029/GM134
Huth, R., Beck, C., and Kuèerová, M. (2016). Synoptic-climatological evaluation of the classifications of atmospheric circulation patterns over Europe. Int. J. Climatol. 36, 2710–2726. doi: 10.1002/joc.4546
Huth, R., Beck, C., Philipp, A., Demuzere, M., Ustrnul, Z., Cahynová, M., et al. (2008). Classifications of atmospheric circulation patterns: recent advances and applications. Ann. N. Y. Acad. Sci. 1146, 105–152. doi: 10.1196/annals.1446.019
IPCC (2014). “Climate change 2014,” in Synthesis Report. Contribution of Working Groups I, II and III to the Fifth Assessment Report of the Intergovernmental Panel on Climate Change, eds Core Writing Team, R. K. Pachauri, and L. A. Meyer (Geneva: IPCC).
Jaagus, J. (2006). Climatic changes in estonia during the second half of the 20th century in relationship with changes in large-scale atmospheric circulation. Theor. Appl. Climatol. 83, 77–88. doi: 10.1007/s00704-005-0161-0
Jaagus, J., Briede, A., Rimkus, E., and Remm, K. (2014). Variability and trends in daily minimum and maximum temperatures and in the diurnal temperature range in Lithuania. Latvia and Estonia in 1951–2010. Theor. Appl. Climatol. 118, 57–68. doi: 10.1007/s00704-013-1041-7
Jaagus, J., Post, P., and Tomingas, O. (2008). Changes in storminess on the western coast of Estonia in relation to large-scale atmospheric circulation. Clim. Res. 36, 29–40. doi: 10.3354/cr00725
Jaagus, J., Sepp, M., Tamm, T., Järvet, A., and Mõisja, K. (2017). Trends and regime shifts in climatic conditions and river runoff in Estonia during 1951–2015. Earth Syst. Dynam. 8, 963–976. doi: 10.5194/esd-8-963-2017
Jaagus, J., and Suursaar, Ü. (2013). Long–term storminess and sea level variations on the Estonian coast of the Baltic Sea in relation to large-scale atmospheric circulation. Estonian J. Earth Sci. 62, 73–92. doi: 10.3176/earth.2013.07
Jaagus, J., and Truu, J. (2004). “Climatic regionalisation of Estonia based on multivariate exploratory techniques,” in Estonia. Geographical Studies, eds K. Tiia and P. Jaan-Mati (Tallinn: Estonian Academy Publishers), 41–55.
Jenkinson, A. F., and Collison, F. P. (1977). An Initial Climatology of Gales Over the North Sea. Technical report Synoptic Climatology Branch Memorandum 62. Bracknell: Meteorological Office
Jevrejeva, S., Drabkin, V. V., Kostjukov, J., Lebedev, A. A., Leppäranta, M., Mirnov, Y. U., et al. (2004). Baltic Sea ice seasons in the twentieth century. Clim. Res. 25, 217–227. doi: 10.3354/cr025217
Jung, T., Hilmer, M., Ruprecht, E., Kleppek, S., Gulev, S. K., and Zolina, O. (2003). Characteristics of the recent eastward shift of interannual NAO variability. J. Clim. 16, 3371–3382.
Kalnay, E., Kanamitsu, M., Kistler, R., Collins, W., Deaven, D., Gandin, L., et al. (1996). The NCEP/NCAR 40-year reanalysis project. Bull. Amer. Meteorol. Soc. 77, 437–472.
Keevallik, S. (2003). Changes in spring weather conditions and atmospheric circulation in Estonia (1955–95). Int. J. Climatol. 23, 263–270. doi: 10.1002/joc.875
Keevallik, S. (2011). Shifts in meteorological regime of late winter and early spring in Estonia during recent decades. Theor. Appl. Climatol. 105, 209–215. doi: 10.1007/s00704-010-0356-x
Kruizinga, S. (1979). “Objective classification of daily 500 mbar patterns,” in Proceedings of the: Preprints Sixth Conference on Probability and Statistics in Atmospheric Sciences, (Boston, MA: American Meteorological Society), 126–129.
Kučerová, M., Beck, C., Philipp, A., and Huth, R. (2017). Trends in frequency and persistence of atmospheric circulation types over Europe derived from multitude of classifications. Int. J. Climatol. 37, 2502–2521. doi: 10.1002/joc.4861
Küttel, M., Luterbacher, J., and Wanner, H. (2011). Multidecadal changes in winter circulation-climate relationship in Europe: frequency variations, within-type modifications, and long-term trends. Clim. Dyn. 36, 957–972. doi: 10.1007/s00382-009-0737-y
Kyselý, J., and Huth, R. (2006). Changes in atmospheric circulation over Europe detected by objective and subjective methods. Theor. Appl. Climatol. 85, 19–36. doi: 10.1007/s00704-005-0164-x
Lehmann, A., Getzlaff, K., and Harlaß, J. (2011). Detailed assessment of climate variability in the Baltic Sea area for the period 1958 to 2009. Clim. Res. 46, 185–196. doi: 10.3354/cr00876
Lehmann, A., Höflich, K., Post, P., and Myrberg, K. (2017). Pathways of deep cyclones associated with large volume changes (LVCs) and major baltic inflows (MBIs). J. Mar. Syst. 167, 11–18. doi: 10.1016/j.jmarsys.2016.10.014
Litynski, J. (1969). A numerical classification of circulation patterns and weather types in Poland. Prace Panstwowego Instytutu Hydrologiczno-Meteorologicznego 97, 3–15.
Murtagh, F. (1985). Multidimensional Clustering Algorithms. Vol. 4 of COMPSTAT Lectures. Würzburg: Physica-Verlag.
NOAA. (2018). Global Climate Report - Annual 2017. Available at: https://www.ncdc.noaa.gov/sotc/global/201713 (accessed 4 December, 2018)
Philipp, A., Beck, C., Huth, R., and Jacobeit, J. (2016). Development and comparison of circulation type classifications using COST733 dataset and software. Int. J. Climatol. 36, 2673–2691. doi: 10.1002/joc.3920
Pokorná, L., and Huth, R. (2015). Climate impacts of the NAO are sensitive to how the NAO is defined. Theor. Appl. Climatol. 119, 639–652.
Schwartz, M. D., Ahas, R., and Aasa, A. (2006). Onset of spring starting earlier across the Northern Hemisphere. Glob. Change Biol. 12, 343–351.
Screen, J. A., Bracegirdle, T. J., and Simmonds, I. (2018). Polar Climate change as manifest in atmospheric circulation. Curr. Clim. Change 4:383. doi: 10.1007/s40641-018-0111-4
Sepp, M., and Jaagus, J. (2002). Frequency of circulation patterns and air temperature variations in Europe. Boreal Environ. Res. 7, 273–279.
Sepp, M., Post, P., Mändla, K., and Aunap, R. (2018). On cyclones entering the Baltic Sea region. Boreal Environ. Res. 23, 1–14.
Serreze, M. C., Walsh, J. E., Chapin, F. S., Osterkamp, T., Dyurgerov, M., Romanovsky, V., et al. (2000). Observational evidence of recent change in the northern high-latitude environment. Clim. Change 46:159. doi: 10.1023/A:1005504031923
Stryhal, J., and Huth, R. (2017). Classifications of winter Euro-Atlantic circulation patterns: an intercomparison of five atmospheric reanalyses. J. Clim. 30, 7847–7861. doi: 10.1175/JCLI-D-17-0059.1
Tomingas, O. (2002). Relationship between atmospheric circulation indices and climate variability in Estonia. Boreal Environ. Res. 7, 463–469.
Tveito, O. E., Huth, R., Philipp, A., Post, P., Pasqui, M., Esteban, P., et al. (2016). COST Action 733 Harmonization and Application of Weather Type Classifications for European Regions. Final Scientific Report. Augsburg, University of Augsburg.
Uppala, S. M., Kållberg, P. W., Simmons, A. J., Andrae, U., Da Costa Bechtold, V., Fiorino, M., et al. (2005). The ERA-40 re-analysis. Q. J. R. Meteorol. Soc. 131, 2961–3012. doi: 10.1256/qj.04.176
Vihma, T. (2014). Effects of Arctic sea ice decline on weather and climate: a review. Surv. Geophy. 35, 1175–1214. doi: 10.1007/s10712-014-9284-9280
Walsh, J. E. (2014). Intensified warming of the Arctic: causes and impacts on middle latitudes. Global Planet. Change 117, 52–63. doi: 10.1016/j.gloplacha.2014.03.003
Keywords: air temperature rise, atmospheric circulation, circulation types, Estonia, COST733
Citation: Lakson M, Post P and Sepp M (2019) The Impact of Atmospheric Circulation on Air Temperature Rise in Estonia. Front. Earth Sci. 7:131. doi: 10.3389/feart.2019.00131
Received: 04 December 2018; Accepted: 13 May 2019;
Published: 12 June 2019.
Edited by:
Markus Meier, Leibniz Institute for Baltic Sea Research (LG), GermanyReviewed by:
Anna Rutgersson, Uppsala University, SwedenDimitrios Melas, Aristotle University of Thessaloniki, Greece
Copyright © 2019 Lakson, Post and Sepp. This is an open-access article distributed under the terms of the Creative Commons Attribution License (CC BY). The use, distribution or reproduction in other forums is permitted, provided the original author(s) and the copyright owner(s) are credited and that the original publication in this journal is cited, in accordance with accepted academic practice. No use, distribution or reproduction is permitted which does not comply with these terms.
*Correspondence: Mait Sepp, bWFpdC5zZXBwQHV0LmVl