- 1Key Laboratory of Ocean and Marginal Sea Geology, South China Sea Institute of Oceanology, Chinese Academy of Sciences, Guangzhou, China
- 2University of Chinese Academy of Sciences, Beijing, China
- 3Guangzhou University, Guangzhou, China
Geochemical proxies in organic matter (OM) are considered to be reliable proxies for deciphering types of paleo-vegetation (C3 plants and C4 plants) and their abundance. The contributions of total organic carbon (TOC), stable carbon isotopes (δ13Corg), total nitrogen (TN) and organic carbon to total nitrogen ratios (C/N) were obtained from a gravity core NS07-25 (6°39.945′ N, 113°32.936′ E, water depth 2006 m), extracted from the southern South China Sea (SCS). These data were used to reconstruct the climate changes of the Nansha Trough since 40 ka B.P. by comparing them with pollen data from the same core, and this comparison provides better sediment provenance details in the study area. During the periods between 37 and 27 ka, and from 12.5 ka to modern day, the majority of terrestrial sediment received from Borneo, and some climatic events have been governed by aeolian fluxes from mid-latitude areas (mainland China). These periods were relatively humid, compared to 27–12.5 ka, where the majority of terrestrial sediment came from the Sunda Shelf through riverine pathways. This study serves as the first study to correlate deep oceanic pollen and geochemical proxies in order to identify the weaken terrestrial OM signals in the deep ocean.
Introduction
The past 37,000 years have been a dynamic period for vegetation cover around the southern South China Sea (SCS), due to global and regional climatic and geodynamic changes. During the Last Glacial Maximum (LGM), the paleo-environment faced observable changes through the exposure of the continental shelf as the sea level decreased. During this period, the SCS was connected to outer oceans only by the Bashi Channel (Shyu et al., 2001). Throughout the time of deglaciation, the southern SCS experienced regional climatic changes due to geo-dynamic events, such as the submergence of Sundaland and the opening of the Indonesian throughflow (Sun and Li, 1999; Li et al., 2018). Due to the changes that occurred in the landmass and the heat budget, wind and monsoonal patterns changed, affecting the terrestrial paleo-productivity history by altering vegetation cover and vegetation type (such as trees, shrubs, herbs, and grasses) (Broecker et al., 1988; Miao et al., 1994; Wang et al., 1999; Shyu et al., 2001; Huang and Tian, 2012). Studying paleo-productivity is important, in order to understand behavioral patterns of present-day vegetation toward an environmental pressure conditions such as climatic changes (global warming, rainfall pattern changes, etc.). Importantly, the terrestrial sediment input to the SCS has been previously considered to provide information related to paleo-environmental changes in the Southeast Asian continent (Wang et al., 1999; Liu et al., 2017). Therefore, the SCS serves as an ideal place to study how terrestrial paleo-productivity has behaved throughout this dynamic era of the Earth's history. Sediment provenance of marine sediments should have identified specially when doing a terrestrial paleo productivity study.
Oceanic sediment receives its organic matter (OM), along with the sediment from terrestrial environments, mainly through riverine pathways and from in-situ OM production. In a general view, oceans receive one-third of its OM through riverine pathways as terrestrial OM. Nearly 50% to 60% of TOC from terrestrial OM undergo re-mineralization or degradation (Burdige, 2005), which may reduce the strength of terrestrial OM signals in the ocean. The weakening proportion of these terrestrial OM signals in the marine environment depends on the proxy type, and this terrestrial OM has been used to interpret terrestrial paleo-productivity by many researchers globally. Geochemical proxies in OM such as carbon (TOC) and nitrogen (TN) elements, their stable isotopes (δ13Corg and δ15N), and ratios among elements (C/N, N/C) (Pelejero et al., 1999; Kienast et al., 2001; Steinke et al., 2003; Zheng et al., 2017) and carbon isotopic compositions in leaf wax (Hu et al., 2002; Huang and Tian, 2012; He et al., 2017; Liu et al., 2018) have been used for multiple studies in the SCS. Isotopic compositions in charcoal (produced by forest fires) have been used to reveal the connection between paleo-vegetation and past climate along with fire history (Jia et al., 2003). Furthermore, pollen distribution in marine sediment has also been used as a unique proxy to determine terrestrial paleo-productivity (Sun and Li, 1999; Sun et al., 2003; Wang et al., 2009; Dai et al., 2018; Luo et al., 2018; Miao et al., 2018).
The geochemical proxies trapped in OM in marine sediment represent numerous details about the paleo-environment and paleoclimate. While TOC, [which is frequently used as a paleo-productivity geochemical proxy (Berger et al., 1989; Wei et al., 2003), represents the paleo-productivity in a quantitative manner, while stable carbon isotopic composition tend to provide details about qualitative paleo-productivity (vegetation types). A number of studies have been conducted to identify the different values of δ13Corg and C/N ratios according to their sources (e.g., C3 Plants, C4 Plants, marine OM, and in a more specific manner such as marine phytoplankton, marine dissolved organic carbon, marine particulate carbon, freshwater algae, bacteria, etc.). Organic carbon isotopic compositions vary widely depending on various paths of different OM sources (Raymond and Bauer, 2001; Cloern et al., 2002; Megens et al., 2002; Lamb et al., 2006). C3 plants and C4 plants can be clearly distinguished according to their δ13Corg, and their C/N and N/C ratios, as they fix atmospheric carbon using two different processes [Calvin Benson cycle/C3 pathway for C3 plants (Craig, 1953) and Hatch-Slack pathway for C4 plants (Hatch and Slack, 1970). A better understanding of these paths is important when considering processes for OM preservation (Meyers, 1994), and it will aid in identifying the contribution of different OM sources via the global carbon cycle into the marine OM pool (Gaye et al., 2007; Yu et al., 2010).
δ13Corg and the C/N ratio are highly applicable in almost every type of paleo-environmental study where organic matter is present, even when microfossils are absent (Lamb et al., 2006). Even though δ13Corg and TOC show complex behavioral patterns in marine environments (Boutton, 1991; Jassby et al., 1993), this complexity allows TOC and δ13Corg to carry higher details about environmental and climatic changes, along with other elements and isotopes such as TN and d15N. A major challenge of using δ13Corg and the C/N ratio as paleo-environmental proxies is the degradation of δ13Corg and C/N ratio values, along the path, between the source and its fate, and this degradation causes a certain degree of shifting in δ13Corg and C/N values (Lamb et al., 2006; Yu et al., 2010). However, the value transformation is not considerable enough to prevent the application of δ13Corg and the C/N ratio as indicators for major vegetation type and sediment provenance (Yu et al., 2010). Importantly in the SCS, Kienast et al. (2001) has shown the possible thermal effects (Fontugne and Duplessy, 1986) on carbon isotopes are negligible, ensuring that the terrestrial OM signals are well-preserved in marine sediments by weakening the degradation of δ13Corg, which provides a better opportunity to study terrestrial paleo-vegetation around the SCS.
In considering the pollen records from marine sediments, these records tend to provide more specific details about vegetation types than OM geochemical proxies. However, the provenance of these pollen data become complex due to the patterns of pollen distribution via wind and riverine pathways. The ocean receives a majority of its terrestrial OM via riverine pathways, promising a better provenance of details for OM geochemical proxy data. By combining both geochemical proxy data and pollen data, better results can be obtained for the terrestrial paleo-vegetation changes due to climatic changes.
There are a lack of terrestrial paleo-productivity studies that compare OM geochemical data and pollen data worldwide. As an effort to fill this research gap, in this study, we are discussing the distribution of OM geochemical proxies (TOC, TN, C/N, and δ13Corg) and pollen data obtained from the NS07-25 southern SCS sediment core, as well as the connection of these paleo-productivity changes with the paleo-climatic history. Furthermore, δ13Corg data will be discussed from other sediment cores along a transect (Figure 1) from shallow ocean to deep ocean in the study area, in order to gain a better understanding of terrestrial OM distribution in the southern SCS via riverine pathways and the mixing with marine OM since 20 ka B.P.
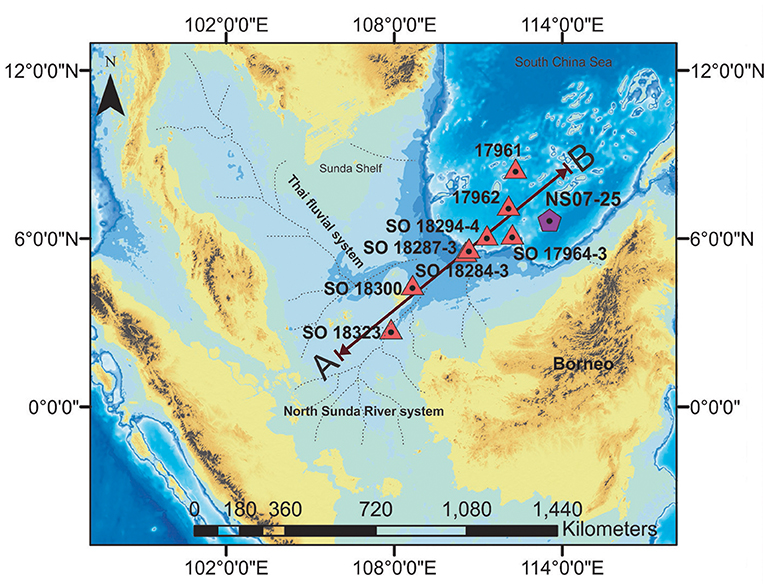
Figure 1. Map of the southern South China Sea showing the location of deep ocean sediment core (NS07 25) location and the other sediment core locations which are used in this paper. Major Paleo-rivers flows in to the southern South China Sea are marked according to Voris (2000). Sediment cores have been selected from the continental shelf, the continental slope and from the Deep Ocean (red triangle). Sediment cores alignments were chosen between the NS07-25 and two major paleo rivers (namely, the Saim River system and the North Sunda River system). Toward A to B direction, the water depth and the distance from the Sunda Shelf increases.
Study Area
Wind Patterns
The South China Sea (SCS) is the largest marginal sea and a semi-enclosed basin which exchanges water with the Pacific Ocean via the Luzon Strait, and with the Indian Ocean over the shallow Sunda Shelf via Indonesian throughflow (Xiang et al., 2009). According to the current atmospheric conditions, the East Asian Monsoon (EAM) regulates the SCS water hydrology by controlling the northern hemisphere's atmospheric heat budget (Jian et al., 2001; Wang et al., 2005). The East Asian summer monsoon (EASM) transports moist wind toward northern China, from the north of Australia through the Warm Pool (Figure 2B). The East Asian winter monsoon (EAWM) also carries cold and dry Siberian air southward along eastern China (Figure 2A) (An, 2000; Hu et al., 2000; Fernando et al., 2007). A major governing factor for this phenomenon is unequal surface distribution of land and ocean (Shaw and Chao, 1994). In other words, sea level has been a critical factor that determines monsoonal changes throughout history (Hu et al., 2002).
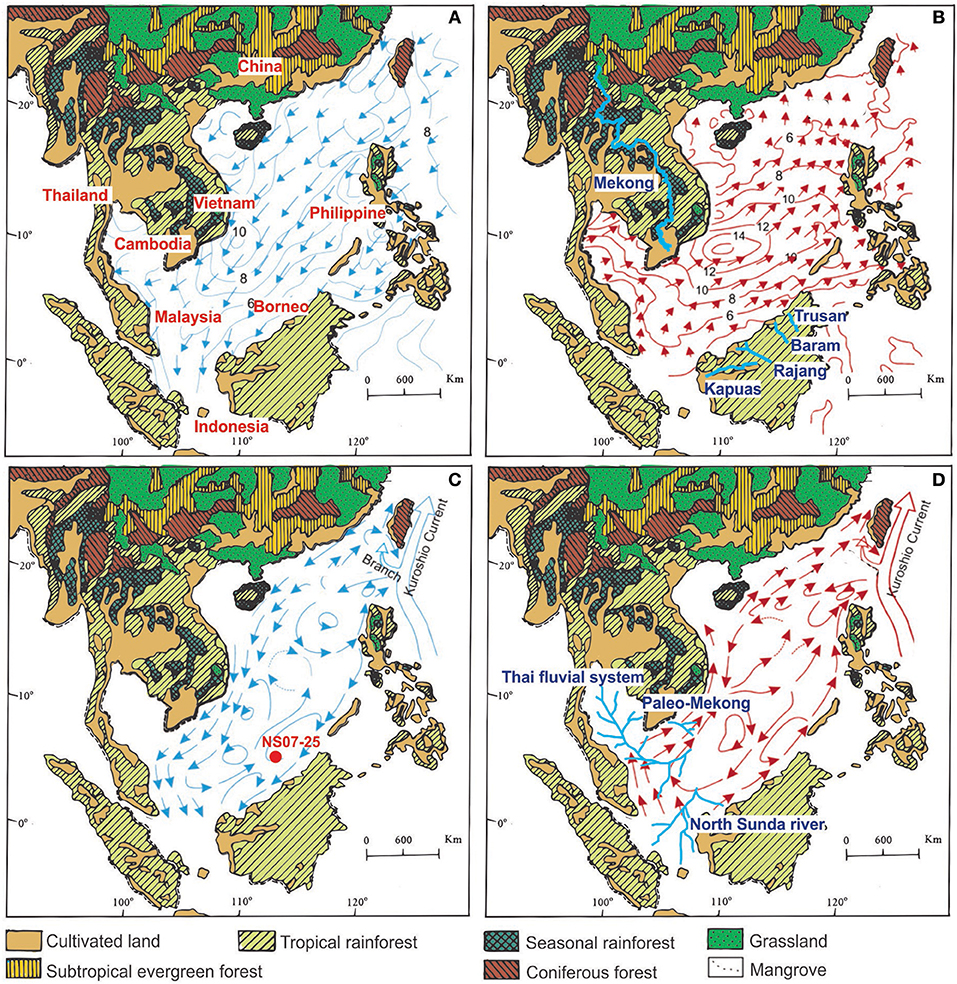
Figure 2. Maps showing major regional vegetation types (Sun and Li, 1999). Surface winds over the SCS with wind velocity in (A) winter (December–February) and in (B) Surface winds over the SCS with wind velocity in summer (June–August) (from Wang et al., 2009) and (B) modern river system (light blue); Surface circulation of the modern SCSin (C) winter and Surface circulation of the modern SCS in (D) summer (from Fang et al., 1998) with (D) paleo-river system (light blue) (Voris, 2000) Modified after (Li et al., 2018).
Currents Pattern
During the summer, surface currents of the southern SCS produce a coastal current from the southwest to the northeast along the coast, causing the East Asian monsoon and the western branches of the Kuroshio Current, which are formed due to the southwest monsoon (Figure 2D). A summer monsoon also leads to the formation of an anticyclonic vortex at the center of the SCS. During the winter, a periodic cyclonic vortex at the center of the SCS and a current from the northeast to southwest direction forms, caused by the northeast monsoon. On the east side of the cyclonic vortex, there is a weak anticyclonic vortex, and there is also a flow directed away from the Natuna islands, through the middle of two circulations, expanding to the north and opposite to the wind pattern (Fang et al., 1998) (Figure 2C).
Vegetation Distribution
Islands in the southern part of the SCS, such as Borneo, Indochina, The Malay Peninsula, Sumatra and the Philippine Islands, are covered with tropical and seasonal rainforests. Among those, the islands around the Sunda Shelf are covered with tropical rainforests, such as Borneo, Java and Sumatra (Florin, 1963) (Figure 2). In these tropical rainforests, herbs can be seen as a lower layer of the forest (Zhang et al., 2011). At the same time, woody vines are abundant in the tropical rainforests. Coastal regions of these islands are dominated by shrubs and herbs (Poliakova and Behling, 2016) (Figure 2).
Materials and Methods
Materials
Gravity core NS07-25 (6°39.945′ N, 113°32.936′ E) was extracted from the northwest slope of the Nansha Trough, southern SCS, at a water depth of 2,006 m (Figure 1). The core was 556 cm in length and consisted of greenish gray to olive-gray silty-clay. Planktonic foraminifera from 11 horizons in core NS07-25 were chosen for AMS14C dating at the Xi-an Accelerator Mass Spectrometry (AMS) Center, China, and approximately 20 mg of shells were obtained from the N150 μm fraction of the measurements. The 556 cm of the core has been dated to 37 ka B.P. The age model of the gravity core NS07-25 based on the AMS14C dates (Xiang et al., 2009) are presented in Table 1. Global reservoir effect of ~400 years, was assumed to have no effect (Bard, 1988) in the southern SCS.
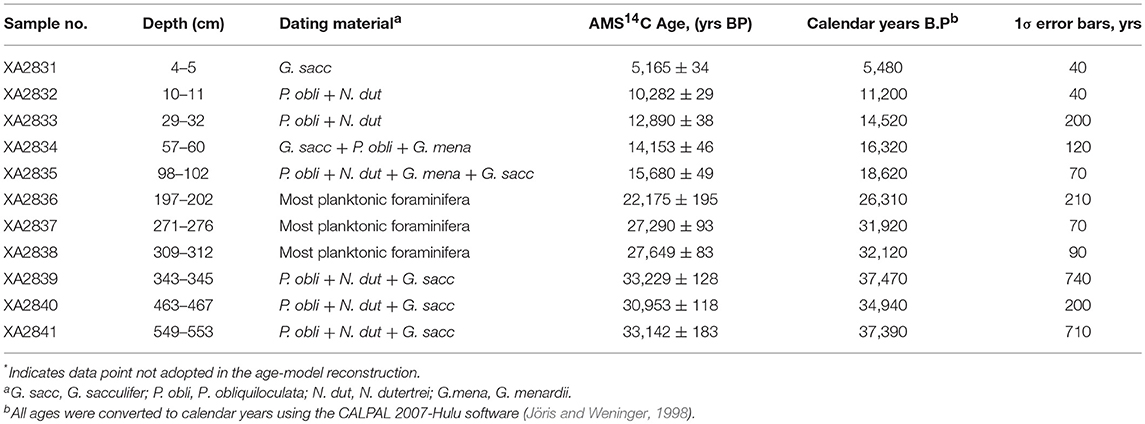
Table 1. AMS14C age data for core NS07-25 (Xiang et al., 2009).
Methods
The core was sub-sampled at 1 cm length intervals, and 27 sub-samples were chosen (representing major climatic changes during the past 37,000 years) for the element (C and N) and isotope (δ13Corg) analyses at the Sun Yat-sen University, Guangzhou. The sub-samples were freeze-dried, powdered and homogenized. The TOC, TN and δ13Corg were analyzed after sieving through an 80 μm mesh to remove large debris, acidified with 10% HCl to remove inorganic carbon, rinsed with deionized water to remove salts, and then dried. The samples were fed to the combustion tube from a solid sample tray and were rapidly converted to CO2 by dynamic combustion at 1,800°C. The water was removed and then separated by gas chromatography and magnetic fields. The isotope ratio was determined by 13C/12C isotope ratio mass spectrometer (IRMS). The precisions of duplicate analyses of samples were ±2 and ±3% of the means for TOC and TN, respectively. Stable carbon compositions were determined with a Delta V Advantage isotope ratio mass spectrometer and expressed in the delta notation (δ13Corg) relative to Peedee belemnite (PDB). The precision of duplicate analyses was 0.06‰ for δ13Corg. The precision of the duplicate analyses was 0.01% for TOC and TN.
Results
Vertical profiles of geochemical variables in the NS07-25 sediment core showed that TOC varied from 2.15 to 0.87% in the sub-samples, and the lowest and highest values appear at 218 cm (27.7 cal. ka B.P.) and 5 cm (6.4 cal. ka B.P.), respectively. TOC content in the upper layers of the core was higher than the deeper layers in the deep oceanic sediment core (Figure 3). TN ratio varied from 0.169 to 0.111% of the core sub-samples. The lowest and highest values appear at 270 cm (31.7 cal. ka B.P.) and 5 cm (6.4 cal. ka B.P.), respectively. TN also shows higher availability at the top of the core rather than in the deeper layers (Figure 3). C/N molar ratios, which varied from 7.6 to 12.7, were higher in the upper layers of the core compared to the deeper layers. Among them, the depth (years) of the lowest value was at 218 cm (27.7 cal. ka B.P.), and the highest value was at 5 cm (6.4 cal. ka B.P.). δ13Corg was found to be relatively negative, ranging from −21.6 to −26.4‰ in the ocean; the maximum value of δ13Corg was −21.6‰, occurring at 302 cm (32.3 cal. ka B.P.). The most negative value was −26.4‰, occurring at 1 cm (2.6 cal. ka B.P.) (Figure 3).
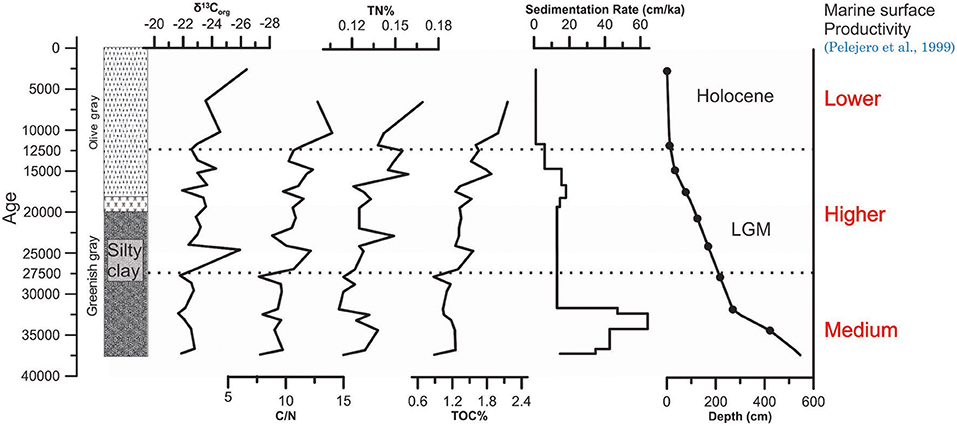
Figure 3. Distribution of four geochemical proxies obtained from NS07-25 since 37ka B.P. Sedimentation rates, Lithology and the AMS14C-based age model in core were from Xiang et al. (2009).
Discussion
The reliable representation of primary production by different proxies should be discussed. Generally, the unit area biomass of a tropical rain forest (C3) is higher than the unit area biomass of a grassland (C4 plants). At low temperatures, the photosynthetic intensity of C3 and C4 plants is nearly the same, and the photosynthetic intensity of C4 plants increases significantly with the increase in temperature. At 30–35°C, the photosynthetic intensity of C4 plants is about twice that of C3 plants (Tieszen et al., 1979). Additionally, the pollen and the OM production ratios of different vegetation types are not similar. However, the trends of pollen and the OM production through time for a considered vegetation (C4 or C3) are similar. For example, the sediment core BM6, from Lake BarombiMbo, showed similar distribution trends for the δ13Corg curve and the C4 type pollen distribution curve during a C4 plant-dominated time period (Giresse et al., 1994).
Climate Derived Terrestrial Paleo-Vegetation Variations
Distributions of TOC, TN, C/N and δ13Corg from the NS07-25 southern SCS sediment core was clearly divided into three stages, where pollen data strongly confirmed these three stages by Hierarchical Cluster Analysis using Coniss (Figure 4). These stages are strongly correlated with climate-derived marine isotope stages. During these stages sediment provenance varies according to the geodynamic and climatic events, such as rainfall pattern and sea level changes. Similarly vegetation type and vegetation distribution also followed these geodynamic and climatic changes. The C/N and δ13Corg distribution patterns could be used as a source identification method for organic matter (Meyers, 1994; Lamb et al., 2006; Mackie et al., 2007) while some studies have used N/C ratios with δ13Corg distribution (Zheng et al., 2017) (Figure 6). δ13Corg of marine particulate organic carbon (mainly plankton) varies between −18 and −21‰ (Peters et al., 1978) and C3 plant δ13Corg varies between −21 and −32‰ (Tieszen et al., 1979), whereas in the NS07-25 core, δ13Corg data ranges between −21.6 and −26.4‰, revealing the availability of both marine OM and terrestrial C3 plant OM (Figure 6). δ13Corg value of C4 plants varies between −16 and −10‰ (Tieszen et al., 1979). The C/N ratio values from sediment cores are distributed in an intermediate value of 24.9 to 7.6 between marine particulate organic carbon and C3 plants. [C3 plants have C/N values above 12 (Tyson, 1995) and marine phytoplankton varies between 5 and 7 (Meyers, 1994)].
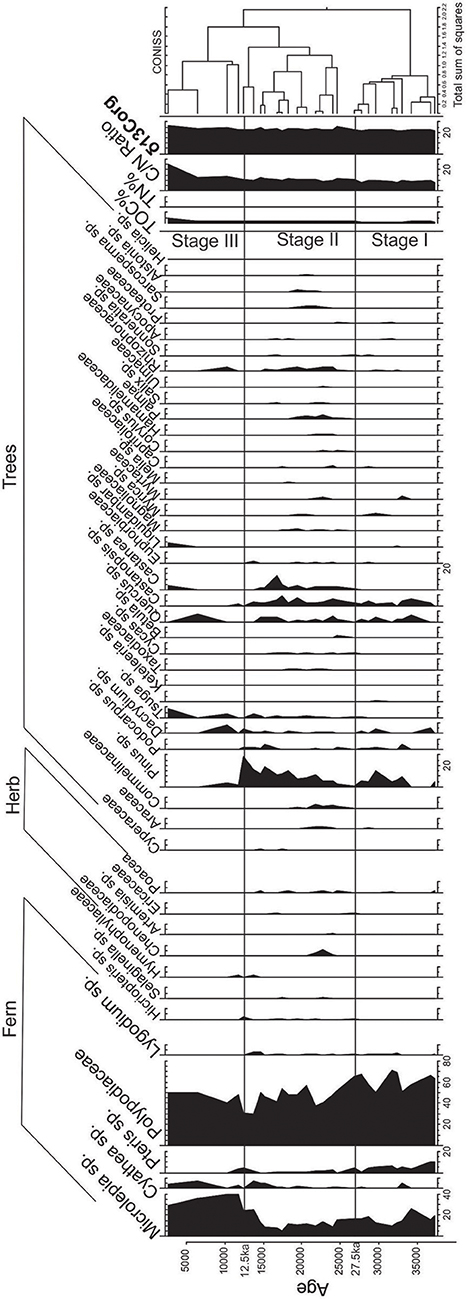
Figure 4. Diagram of pollen and the geochemical data of the core NS07-25 in the NanshaTough. Pollen data has divided in to three zonation according to the Hierarchical Cluster Analysis using Coniss, in where geochemical data also follow the same zonetion clearly.
Stage I (27.5–37 ka)
TOC during this period shows the lowest values (average value of 1.08%) (Figure 3) among the three stages, suggesting a lower OM input to the marine sediment. Furthermore, surface primary productivity in the marine environment shows lower values than during the glacial period but higher than during the Holocene (Pelejero et al., 1999). During this stage (27.5–37 ka), an abnormally elevated sedimentation rate of 50.6 cm/ka can be observed (Xiang et al., 2009). This higher sedimentation rate could be the result of higher marine productivity, higher terrestrial input or higher aeolian flux. If terrestrial OM input were higher, marine OM production also would become higher and TOC influx to the sediment would increase. Additionally, δ13Corg values show (Figure 3) greater marine contributions than terrestrial OM inputs, where marine productivity is also not high, as evidenced by the low TOC values. The highest sedimentation rate may have occurred due to a higher aeolian flux approximately 35 ka B.P., tentatively assigned to (cold) Heinrich event 4 (Bond and Lotti, 1995; Fang et al., 1998). This sediment input represents a short term continental aridity of China (Wang et al., 1999) with mean moisture values noticeably decreasing in monsoonal Central Asia (Herzschuh, 2006). In addition, the sudden decrease in fern spore at around 35 ka in samples represents the aridity. This sediment input is significantly higher, and it may decrease the marine productivity due to the low penetration of sunlight in the ocean. Aeolian fluxes from an arid land area/deserted area could trigger such a phenomenon with a low nutrient sediment input. When considering stage I, the pollen and spores may have been transported from northern Borneo area (around equator) (Luo et al., 2019) and as Aeolian flux, mainly from the mainland China. In an overall view, tropical lowland montane vegetation and ferns have increased (Figure 5), which may have been transported mainly from Borneo through the riverine pathway.

Figure 5. Diagram of simplified pollen percentage and the distribution of geochemical proxies of the NS07-25 core.
Stage II (12.5–27.5 ka)
Geochemical and pollen distributions of stage II of core NS25-07 belong to the most dynamic time period of the three stages. δ13Corg shows (avg: −23.32‰) terrestrial contribution and TOC has increased significantly (avg: 1.44%) (Figure 3). Marine productivity increased during this time period due to the higher nutrient input from terrestrial sources (Pelejero et al., 1999). However, in carbon isotope data, marine contribution seems to be insignificant or absent. This finding could be due to the high influx of terrestrial OM (which is similar or higher than marine OM production) from the Sunda Shelf in to the ocean. Distribution patterns of N/C and δ13Corg from the core NS25-07 total sample distribution led toward marine OM and C3 plants, evident from the availability of high C3 plant signals in terrestrial OM. However, at the LGM (last glacial maximum) samples, this distribution tends to skew away from marine OM and toward C4 plants. The possible reason for this phenomenon is the considerably high C4 OM influx through paleo-sunda and thai-fluvial river systems, which were close to the NS07-25 core location during the LGM. A higher abundance of herb pollen could be observed during the LGM as well (Figure 5). Even though the N/C and δ13Corg distributions of LGM skewed toward C4 plants, they are closer to the C3 plants region, implying that, during the LGM, the most prominent vegetation type on the Sunda Shelf was C3 plants. C4 plants may have been available along paleo-river banks, the upper region of the Thai-fluvial system and low land coastal regions (Figure 6). The effects of the LGM on the vegetation, such as reducing the biomass, may be unobservable in low latitude areas. The amount of fern pollen decreased during stage II, especially in the LGM, symbolizing the arid environment. The presence of mangrove taxa (Rhizophoraceae and Sonneratia sp.) in stage II (Figure 4) indicates that the coastline had close proximity to the core location.
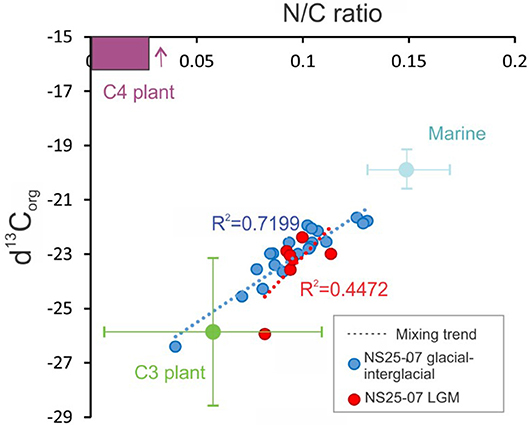
Figure 6. The δ13Corg and N/C scatter plot (Zheng et al., 2017) for the samples from NS07-25 sediment. Blue dots indicate the time period other than the LGM. Red dots indicate the LGM time period. Dashed lines indicate the mixing trend or the contribution to the OM of NS07-25t from C3 plants (green) C4 plant (purple) and marine OM (light blue).
Stage III (0–12.5 ka)
During stage III, tropical low land vegetation disappeared as Sundaland was submerged. Fern pollen and high montane rainforest pollen increased, representing the humid environment (Figure 5). Marine productivity was lowest during this period (Pelejero et al., 1999), but we can observe the highest TOC values (2.43%) for NS07-25 stage III samples (Figure 3). This finding may be due to the higher rainfall in the Holocene, which washed large amounts of terrestrial OM from the Borneo region, through the riverine pathway. In addition, the majority of pollen recorded in stage III was received from Borneo region through riverine pathways (Luo et al., 2019). Representing the higher abundance of C3 plants in the terrestrial OM, average δ13Corg shows a smaller value of−24.01‰, and the signal of C3 plants is more prominent in δ13Corg records during this stage (Figure 3).
Correlation Between Pollen and Geochemical Proxies in Deep Ocean
In the terrestrial environment, pollen and geochemical proxies (TOC, TN, C/N, and δ13Corg) show a higher correlation signified by their same origin [δ13Corg from C4 plant prominent OM, and the total herb pollen from the same core shows a higher correlation of R = 0.615, from Lake BarombiMbo, West Cameroon (Giresse et al., 1994)]. In the deep ocean sediment, above correlation only depends on two factors being assumed; (1) Different distribution methods of pollen and geochemical proxies between source and fate effect the correlation. Similar distribution pattern increased the correlation while different distribution patterns decrease the correlation [pollen: wind and hydrological pathways, geochemical proxies: mainly hydrological pathways (Blair and Aller, 2012)]. (2) Alteration of terrestrial plant geochemical proxy values due to the mixing of in situ and ex situ OM sources (phytoplankton, algae, etc.…).
According to our findings, in marine environments, the correlation between these vegetation proxies tend to decrease due to complex mixing and different distribution patterns, even though the terrestrial vegetation signal is still observable in the deep ocean. In this study, we have corrected bulk data according to the similar distribution patterns for pollen and geochemical proxies (separated the pollen and geochemical data for riverine pathway prominent time periods).
As geochemical proxies are mainly distributed through riverine pathways, the same distribution patterns for the pollen were considered. Among three zones of geochemical and pollen data, during stage I, wind and riverine distribution were contributed. In Stage II, the riverine pathway was prominent, except during the LGM, where distribution through wind has similarly contributed. During stage III, the riverine pathway was prominent. Even during the time periods where the riverine path is prominent, there is a considerable distribution of pollen through aeolian influx, altering the correlation (Figure 7).
Even though terrestrial plant and geochemical proxies influence their values due to mixing, generally, some proxies such as marine TOC and marine TN maintain a positive correlation with the terrestrial OM. This positive correlation occurs, firstly when terrestrial OM input is increased in the marine environment, the preserved portion of terrestrial TOC in the marine environment also increases. And secondly, along with the higher OM input, the ocean receives a higher inorganic nutrient content as well, leading to a higher marine productivity that results in a higher marine TOC. (Terrestrial OM inputs to the ocean increase in humid periods). According to these two factors, when terrestrial OM inputs are increasing, marine TOC also increased, showing the positive correlation between terrestrial OM and marine TOC.
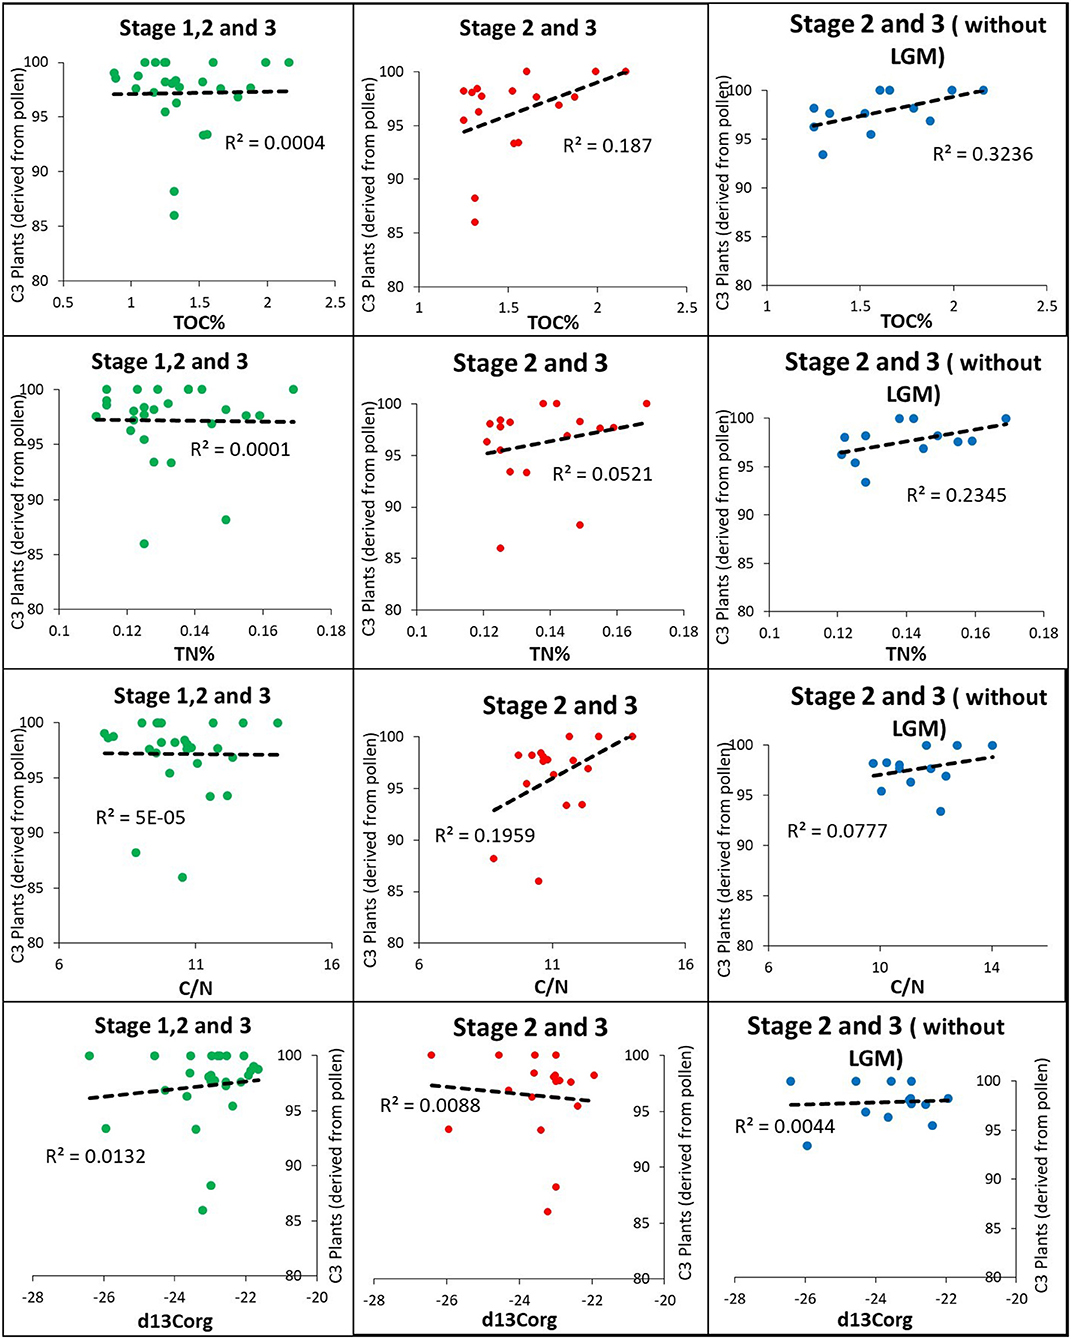
According to the correlation between pollen and geochemical proxies, it was evident that the total abundance of C4 plant pollen and TOC shows a very low correlation of R2 = 0.0004 for data that contains three stages (including all distribution methods) (Figure 7). The stage III and II have a calculated correlation of R2 = 0.187. In these two stages, the majority of pollen has been distributed to the ocean through the riverine pathway, similar to the organic matter. When the data are corrected further by removing the LGM data, the correlation (R2 = 0.3236) increases, revealing the importance of similar distribution patterns for the two proxies (Figure 7). TN also follows a similar correlation pattern with C4 plant pollen, as indicated by TOC. When the pollen data are correlated with the ratios between two elements (TOC and TN), it does not indicate a similar pattern with that of pollen data, where it is correlated with the elements separately. Importantly, δ13Corg does not show any correlation with the pollen data, as marine δ13Corg does not have a positive correlation with terrestrial OM (Figure 7). Correlations between C4 plant pollen and geochemical proxies reveal the availability of terrestrial plant OM signals in the oceanic environment in the study area. Pollen data was corrected by removing C3 plant pollen data. According to the observations, the relative abundance of C3 plant pollen increases with arid time periods (Figure 5), and during these arid windy periods, wind considerably affects pollen similar to riverine pathways.
Area Comparison
We have compared δ13Corg along the AB axis (Figure 1) from the shallow ocean to the deep ocean for the last 20 ka. SO 18323 and SO 18300 represent the continental shelf while SO 18323 is located closer to the paleo-North Sunda River (Wang et al., 2009). These sites may not have experienced the sea level incensement beginning at 17 ka. The terrestrial environment of these sites might have changed to a marine environment at ≈15 ka (Figure 1) due to their submergence by ocean according to the bathymetry of the shelf. Both SO 18323 and SO 18300 sites have almost similar water depths (92 and 91 m).
Terrestrial OM mainly comes through hydrological pathways, unlike pollen that are dispersed through riverine paths and air. Therefore, the δ13Corg values of SO 18323 and SO 18300 was mainly affected by the hydrology of the area (before submergence, fresh water hydrology and after submergence marine hydrology) and the pre-submergence in situ vegetation. Core SO 18300 is situated near the coastal low land area in a river bank, where we may find C4 vegetation rather than C3 vegetation (Wang et al., 2009). When the shore line retreated, at the beginning of deglaciation after 17 ka, increasing δ13Corg values were observed in SO 18300. However, after the submergence at 15 ka, SO 18300 showed a stable C3 plant signal due to the OM input from above river catchments and the distribution in marine environment. When observing SO 18323, which is located deeper in the shelf, more C3 plant-based OM distribution is shown locally. In addition, after submergence of core location, the signal of δ13Corg tends to decrease toward C3-δ13Corg values. If there were C4 plants in the North Sunda River catchment, approximately 15 ka, the δ13Corg signal of SO 18323 should shift toward C4 plants (higher δ13Corg values) (Figure 8).
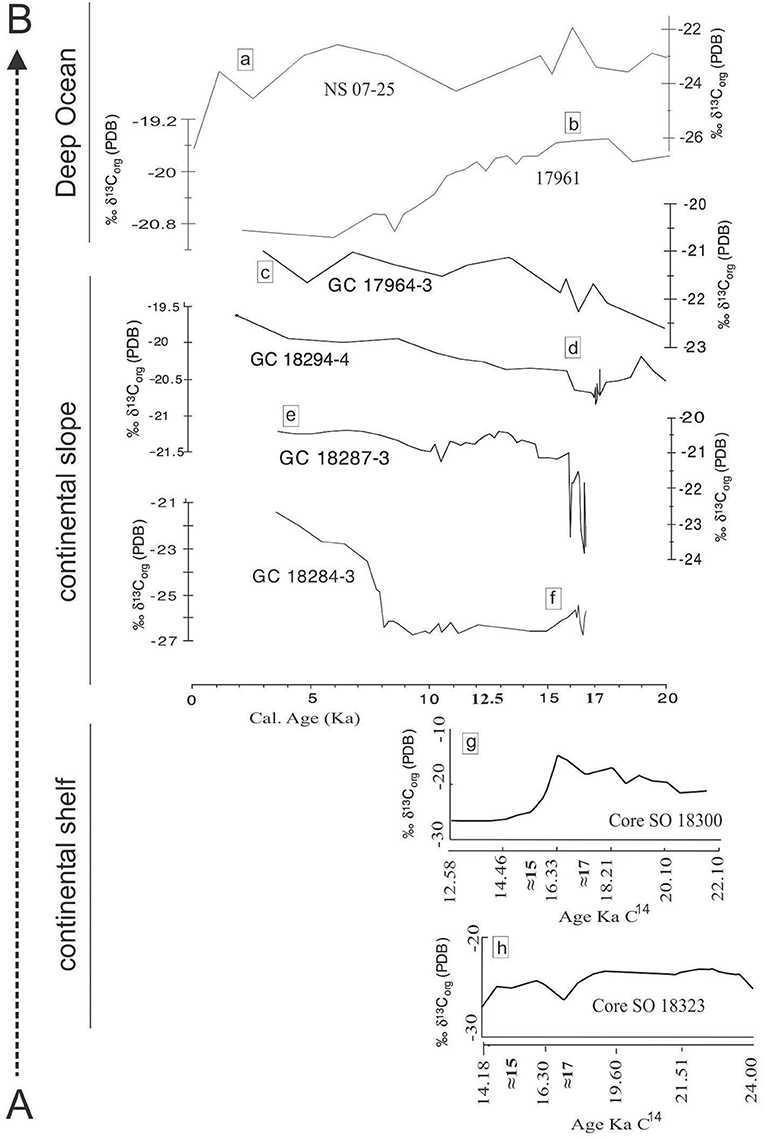
Figure 8. δ13Corg variation patterns along the transect AB (Figure 1) from continental shelf to deep ocean for last 20Ka. Graph (8a) this study (NS 07-25) and Graph (8b) (Kienast et al., 2001) 17961 are from deep ocean. 8c–h were modified using original delta C13 graphs from research articles as mentioned below. 8c (GC 18284-3), 8d (GC 17964-3), 8e (GC 18294-4) and 8f (GC 18287-3) were taken from Steinke et al. (2003) representing continental slope. Figure 8g (SO 18300) and 8h (SO 18323) were taken from Wang et al. (2009) representing continental shelf.
Continental slope is a more dynamic environment than the continental shelf and the deep ocean. Sediment core 18284-3 (226 m) and GC 18287-3 (598 m) was in a costal environment when sea level was lower at 17 ka. Both North Sunda River and Saim River fell into the ocean through this area. Submergence of the majority of the Sunda shelf was recorded in pollen data within 12 to 17 ka (Wang et al., 2009). δ13Corg distribution patterns on the Continental slope was discussed using previously published data of core GC 18284-3 (226 m), GC 18287-3 (598 m) and GC 18294-4 (849 m) (Steinke et al., 2003). A lower δ13Corg value (≈-27‰) from the shallower core GC 18284-3 (226 m) can be observed at the beginning of Sundaland submergence. Advancing deeper into the ocean, δ13Corg values become heavier due to the mixing with marine organic matter, GC 18287-3 (≈-24‰) and GC 18294-4 (≈-21‰).
Continental rise sediment core GC 17964-3 is located near the Paleo Baram river mouth area, northwest of Borneo (Figure 1). This core shows a more deviated pattern for pollen distribution. The total pollen count of this core is lower, and pollen usually do not show a decreasing trend after 12 ka. The presence of pollen from Borneo and Sumatra area could be the reason for this observation (Sun et al., 2000). δ13Corg from this sediment core varies similarly to that of GC 18294-4 but with lighter δ13Corg values, showing another riverine input with higher C3 plant materials, other than north Sunda River the Saim River (Steinke et al., 2003), and Paleo Baram River which should have the accountability of this signal.
δ13Corg distribution in the deep ocean shows an opposite pattern to that of continental slope's distribution. Two deep ocean cores were selected. Core 17961 (Kienast et al., 2001), located in the middle of the southern SCS, has a lesser impact from land areas and shows heavier δ13Corg values, during the glacial period (≈-19.5‰) and the Holocene period (≈-20‰). Core NS07-25, located landward in comparison, is closer to northern Borneo (Figure 1). Core NS07-25 tends to show more negative values compared with core 17961 possibly due to the C3 plant signal from Borneo and the Sumatra region as discussed.
Conclusion
Based on the δ13Corg, TOC, TN and N/C analysis data of core NS07-25 and the comparison of these geochemical proxies, along with pollen data from the same core, it is found that terrestrial OM and the sediment in the core came mainly from northern Borneo as a riverine pathway and from mainland China as aeolian fluxes, during the period of 37 ~ 27 ka B.P. In addition, during stage II (27 ~ 12.5 ka B.P.), terrestrial OM might have come from Sundaland from the riverine pathway. During the LGM, pollen came as aeolian fluxes, according to the pollen and TOC correlation results. During stage III (12.5 ~ 2.62 ka B.P.), terrestrial sediment again came from the northern Borneo.
Comparisons between pollen and geochemical proxies show higher linear correlation, and this correlation depends on two conditions, for the two proxy types. (1) Two proxies should be distributed via the same distribution method (riverine distribution prominent time periods for pollen shows higher correlation). (2) Even though geochemical proxy value is altered during the distribution, two different values in the marine and terrestrial environment needed to be positively correlated (such as TOC). This correlation method could be used to identify the prominent terrestrial sediment supplying method to the marine environments (riverine path or aeolian flux). As well it leads to better sediment provenance, especially for the deep oceanic sediment.
Data Availability
The raw data supporting the conclusions of this manuscript will be made available by the authors, without undue reservation, to any qualified researcher.
Author Contributions
VT and LC designed the study. LC and RX took the samples. VT, DD, and SD contributed to the data analysis. VT drafted the manuscript with contributions from LC, DD, and SD. Sample preparations was done by VT, WJ, AR, SK, and GA.
Conflict of Interest Statement
The authors declare that the research was conducted in the absence of any commercial or financial relationships that could be construed as a potential conflict of interest.
Acknowledgments
We would like to express our gratitude to Prof. Markus Kienast, National Oceanic and Atmospheric Administration and Global Multi-Resolution Topography Data Synthesis for making data available. This work was funded by the National Natural Science Foundation of China (grants 41676047), a research program of Guangzhou Science Technology and Innovation Commission (Contract Number 201510010043), and by the National Program on Global Change and Air-Sea Interaction (GASI-03-04-01- 03), and by the Strategic Priority Research Program of the Chinese Academy of Sciences with grant no. XDA11030104.
References
An, Z. (2000). The history and variability of the East Asian paleomonsoon climate. Quat. Sci. Rev. 19, 171–187. doi: 10.1016/S0277-3791(99)00060-8
Bard, E. (1988). Correction of accelerator mass spectrometry 14C agesmeasured in planktonic foraminifera: paleoceanographic implications. Paleoceanograph 3, 635–645. doi: 10.1029/PA003i006p00635
Berger, W., Smetacek, V., and Wefer, G. (1989). Ocean Productivity and Paleoproductivity—An Overview. Productivity of the Ocean: Present and Past. (New York, NY: Wiley).
Blair, N. E., and Aller, R. C. (2012). The fate of terrestrial organic carbon in the marine environment. Annu. Rev. Mar. Sci. 4, 401–423. doi: 10.1146/annurev-marine-120709-142717
Bond, G. C., and Lotti, R. (1995). Iceberg discharges into the North Atlantic on millennial time scales during the last glaciation. Science 267, 1005–1010. doi: 10.1126/science.267.5200.1005
Boutton, T. W. (1991). Stable carbon isotope ratios of natural materials: II. Atmospheric, terrestrial, marine, and freshwater environments. Carbon Isotope Tech. 1:173. doi: 10.1016/B978-0-12-179730-0.50016-3
Broecker, W., Andree, M., Klas, M., Bonani, G., Wolfli, W., and Oeschger, H. (1988). New evidence from the South China Sea for an abrupt termination of the last glacial period. Nature 333:156. doi: 10.1038/333156a0
Burdige, D. J. (2005). Burial of terrestrial organic matter in marine sediments: a re-assessment. Glob. Biogeochem. Cycles 19, 4011–4018. doi: 10.1029/2004GB002368
Cloern, J. E., Canuel, E. A., and Harris, D. (2002). Stable carbon and nitrogen isotope composition of aquatic and terrestrial plants of the San Francisco Bay estuarine system. Limnol. Oceanograp. 47, 713–729. doi: 10.4319/lo.2002.47.3.0713
Craig, H. (1953). The geochemistry of the stable carbon isotopes. Geochimica et Cosmochimica Acta 3, 53–92. doi: 10.1016/0016-7037(53)90001-5
Dai, L., Hao, Q., and Mao, L. (2018). Morphological diversity of quercus fossil pollen in the northern South China Sea during the last glacial maximum and its paleoclimatic implication. PLoS ONE 13:e0205246. doi: 10.1371/journal.pone.0205246
Fang, G., Fang, W.-D., Fang, Y., and Wang, K. (1998). A survey of studies on the South China Sea upper ocean circulation. Acta Oceanographica Taiwanica 37, 1–16.
Fernando, A. G. S., Peleo-Alampay, A. M., and Wiesner, M. G. (2007). Calcareous nannofossils in surface sediments of the eastern and western South China Sea. Mar. Micropaleontol. 66, 1–26. doi: 10.1016/j.marmicro.2007.07.003
Florin, R. (1963). The distribution of conifer and taxad genera in time and space. Acta Horti Bergiani 20, 121–312.
Fontugne, M. R., and Duplessy, J.-C. (1986). Variations of the monsoon regime during the upper quaternary: evidence from carbon isotopic record of organic matter in North Indian Ocean sediment cores. Palaeogeogr. Palaeoclim. Palaeoecol. 56, 69–88.
Gaye, B., Fahl, K., Kodina, L. A., Lahajnar, N., Nagel, B., Unger, D., et al. (2007). Particulate matter fluxes in the southern and central Kara Sea compared to sediments: bulk fluxes, amino acids, stable carbon and nitrogen isotopes, sterols and fatty acids. Cont. Shelf Res. 27, 2570–2594. doi: 10.1016/j.csr.2007.07.003
Giresse, P., Maley, J., and Brenac, P. (1994). Late quaternary palaeoenvironments in the Lake Barombi Mbo (West Cameroon) deduced from pollen and carbon isotopes of organic matter. Palaeogeogr. Palaeoclim. Palaeoecol. 107, 65–78.
Hatch, M., and Slack, C. (1970). Photosynthetic CO2-fixation pathways. Ann. Rev. Plant Physiol. 21, 141–162.
He, J., Jia, G., Li, L., and Wang, P. (2017). Differential timing of C4 plant decline and grassland retreat during the penultimate deglaciation. Glob. Planet. Change 156, 26–33. doi: 10.1016/j.gloplacha.2017.08.001
Herzschuh, U. (2006). Palaeo-moisture evolution in monsoonal Central Asia during the last 50,000 years. Quat. Sci. Rev. 25, 163–178. doi: 10.1016/j.quascirev.2005.02.006
Hu, J., Kawamura, H., Hong, H., and Qi, Y. (2000). A review on the currents in the South China Sea: seasonal circulation, South China Sea warm current and kuroshio intrusion. J. Oceanogr. 56, 607–624. doi: 10.1023/A:1011117531252
Hu, J., Peng, P. A., Jia, G., Fang, D., Zhang, G., Fu, J., et al. (2002). Biological markers and their carbon isotopes as an approach to the paleoenvironmental reconstruction of Nansha area, South China Sea, during the last 30 ka. Org. Geochem. 33, 1197–1204. doi: 10.1016/S0146-6380(02)00082-7
Huang, E., and Tian, J. (2012). Sea-level rises at heinrich stadials of early marine isotope stage 3: evidence of terrigenous n-alkane input in the southern South China Sea. Glob. Planet. Change 94, 1–12. doi: 10.1016/j.gloplacha.2012.06.003
Jassby, A. D., Cloern, J. E., and Powell, T. M. (1993). Organic carbon sources and sinks in San Francisco Bay: variability induced by river flow. Mar. Ecol. Prog. Ser. 39–54.
Jia, G., Peng, P. A., Zhao, Q., and Jian, Z. (2003). Changes in terrestrial ecosystem since 30 ma in East Asia: stable isotope evidence from black carbon in the South China Sea. Geology 31, 1093–1096. doi: 10.1130/G19992.1
Jian, Z., Huang, B., Kuhnt, W., and Lin, H.-L. (2001). Late quaternary upwelling intensity and East Asian monsoon forcing in the South China Sea. Quat. Res. 55, 363–370. doi: 10.1006/qres.2001.2231
Jöris, O., and Weninger, B. (1998). Extension of the 14C calibration curve to ca. 40,000 cal BC by synchronizing Greenland 18O/16O ice core records and North Atlantic foraminifera profiles: a comparison with U/Th coral data. Radiocarbon 40, 495–504.
Kienast, M., Calvert, S. E., Pelejero, C., and Grimalt, J. O. (2001). A critical review of marine sedimentaryδ13Corg-pCO2 estimates: new palaeorecords from the South China Sea and a revisit of other low-latitude δ13Corg-pCO2 records. Glob. Biogeochem. Cycles 15, 113–127. doi: 10.1029/2000GB001285
Lamb, A. L., Wilson, G. P., and Leng, M. J. (2006). A review of coastal palaeoclimate and relative sea-level reconstructions using δ13C and C/N ratios in organic material. Earth Sci. Rev. 75, 29–57. doi: 10.1016/j.earscirev.2005.10.003
Li, J., Dodson, J., Yan, H., Wang, W., Innes, J. B., Zong, Y., et al. (2018). Quantitative holocene climatic reconstructions for the lower Yangtze region of China. Clim. Dyn. 50, 1101–1113. doi: 10.1007/s00382-017-3664-3
Liu, F., Chang, X., Liao, Z., and Yang, C. (2018). n-Alkanes as indicators of climate and vegetation variations since the last glacial period recorded in a sediment core from the northeastern South China Sea (SCS). J. Asian Earth Sci. 171, 134–143. doi: 10.1016/j.jseaes.2018.09.018
Liu, J., Steinke, S., Vogt, C., Mohtadi, M., De Pol-Holz, R., and Hebbeln, D. (2017). Temporal and spatial patterns of sediment deposition in the northern South China Sea over the last 50,000 years. Palaeogeogr. Palaeoclim. Palaeoecol. 465, 212–224. doi: 10.1016/j.palaeo.2016.10.033
Luo, C., Chen, C., Xiang, R., Jiang, W., Liu, J., Lu, J., et al. (2018). Study of modern pollen distribution in the northeastern Indian and their application to paleoenvironment reconstruction. Rev. Palaeobot. Palynol. 256, 50–62. doi: 10.1016/j.revpalbo.2018.05.007
Luo, C., Haberle, S., Zheng, Z., Xiang, R., Chen, C., Lin, G., et al. (2019). Environmental changes in the north-east Sunda region over the last 40 000 years. J. Quat. Sci. doi: 10.1002/jqs.3093. [Epub ahead of print].
Mackie, E. A., Lloyd, J. M., Leng, M. J., Bentley, M. J., and Arrowsmith, C. (2007). Assessment of δ13C and C/N ratios in bulk organic matter as palaeosalinity indicators in holocene and lateglacial isolation basin sediments, northwest Scotland. J. Quat. Sci. 22, 579–591. doi: 10.1002/jqs.1081
Megens, L., Van Der Plicht, J., De Leeuw, J., and Smedes, F. (2002). Stable carbon and radiocarbon isotope compositions of particle size fractions to determine origins of sedimentary organic matter in an estuary. Org. Geochem. 33, 945–952. doi: 10.1016/S0146-6380(02)00060-8
Meyers, P. A. (1994). Preservation of elemental and isotopic source identification of sedimentary organic matter. Chem. Geol. 114, 289–302.
Miao, Q., Thunell, R. C., and Anderson, D. M. (1994). Glacial-Holocene carbonate dissolution and sea surface temperatures in the south China and Sulu seas. Paleoceanogr. Paleoclimatol. 9, 269–290.
Miao, Y., Warny, S., Clift, P. D., Gregory, M., and Liu, C. (2018). Climatic or tectonic control on organic matter deposition in the South China Sea? A lesson learned from a comprehensive neogene palynological study of IODP Site U1433. Int. J .Coal Geol. 190, 166–177. doi: 10.1016/j.coal.2017.10.003
Pelejero, C., Kienast, M., Wang, L., and Grimalt, J. O. (1999). The flooding of Sundaland during the last deglaciation: imprints in hemipelagic sediments from the southern South China Sea. Earth Planet. Sci. Lett. 171, 661–671.
Peters, K., Sweeney, R., and Kaplan, I. (1978). Correlation of carbon and nitrogen stable isotope ratios in sedimentary organic matter 1. Limnol. Oceanogr. 23, 598–604.
Poliakova, A., and Behling, H. (2016). Pollen and fern spores recorded in recent and late Holocene marine sediments from the Indian Ocean and Java Sea in Indonesia. Quat. Int. 392, 251–314. doi: 10.1016/j.quaint.2015.06.046
Raymond, P. A., and Bauer, J. E. (2001). Use of 14C and 13C natural abundances for evaluating riverine, estuarine, and coastal DOC and POC sources and cycling: a review and synthesis. Org. Geochem. 32, 469–485. doi: 10.1016/S0146-6380(00)00190-X
Shaw, P.-T., and Chao, S.-Y. (1994). Surface circulation in the South China sea. Deep Sea Research Part I. Oceanogr. Res. Papers 41, 1663–1683.
Shyu, J.-P., Chen, M.-P., Shieh, Y.-T., and Huang, C.-K. (2001). A pleistocene paleoceanographic record from the north slope of the Spratly Islands, southern South China Sea. Mar. Micropaleontol. 42, 61–93. doi: 10.1016/S0377-8398(01)00009-3
Steinke, S., Kienast, M., and Hanebuth, T. (2003). On the significance of sea-level variations and shelf paleo-morphology in governing sedimentation in the southern South China Sea during the last deglaciation. Mar. Geol. 201, 179–206. doi: 10.1016/S0025-3227(03)00216-0
Sun, X., and Li, X. (1999). A pollen record of the last 37 ka in deep sea core 17940 from the northern slope of the South China Sea. Mar. Geol. 156, 227–244.
Sun, X., Li, X., Luo, Y., and Chen, X. (2000). The vegetation and climate at the last glaciation on the emerged continental shelf of the South China Sea. Palaeogeogr. Palaeoclimatol. Palaeoecol. 160, 301–316. doi: 10.1016/S0031-0182(00)00078-X
Sun, X., Luo, Y., Huang, F., Tian, J., and Wang, P. (2003). Deep-sea pollen from the South China Sea: pleistocene indicators of East Asian monsoon. Mar. Geol. 201, 97–118. doi: 10.1016/S0025-3227(03)00211-1
Tieszen, L. L., Senyimba, M. M., Imbamba, S. K., and Troughton, J. H. (1979). The distribution of C 3 and C 4 grasses and carbon isotope discrimination along an altitudinal and moisture gradient in Kenya. Oecologia 37, 337–350. doi: 10.1007/BF00347910
Tyson, R. V. (1995). Bulk Geochemical Characterization and Classification of Organic Matter: Stable Carbon Isotopes (δ 13 C). Sedimentary Organic Matter (Dordrecht: Springer).
Voris, H. K. (2000). Maps of Pleistocene sea levels in Southeast Asia: shorelines, river systems and time durations. J. Biogeogr. 27, 1153–1167. doi: 10.1046/j.1365-2699.2000.00489.x
Wang, L., Sarnthein, M., Erlenkeuser, H., Grimalt, J., Grootes, P., Heilig, S., et al. (1999). East Asian monsoon climate during the late pleistocene: high-resolution sediment records from the South China Sea. Mar. Geol. 156, 245–284.
Wang, X., Sun, X., Wang, P., and Stattegger, K. (2009). Vegetation on the sunda shelf, South China Sea, during the last glacial maximum. Palaeogeogr. Palaeoclimatol. Palaeoecol. 278, 88–97. doi: 10.1016/j.palaeo.2009.04.008
Wang, Y., Cheng, H., Edwards, R. L., He, Y., Kong, X., An, Z., et al. (2005). The holocene Asian monsoon: links to solar changes and North Atlantic climate. Science 308, 854–857. doi: 10.1126/science.1106296
Wei, G., Liu, Y., Li, X., Chen, M., and Wei, W. (2003). High-resolution elemental records from the South China Sea and their paleoproductivity implications. Paleoceanogr. Paleoclimatol. 18, 1054–1065. doi: 10.1029/2002PA000826
Xiang, R., Chen, M., Li, Q., Liu, J., Zhang, L., and Lu, J. (2009). Planktonic foraminiferal records of East Asia monsoon changes in the southern South China Sea during the last 40,000 years. Mar. Micropaleontol. 73, 1–13. doi: 10.1016/j.marmicro.2009.06.004
Yu, F., Zong, Y., Lloyd, J. M., Huang, G., Leng, M. J., Kendrick, C., et al. (2010). Bulk organic δ13C and C/N as indicators for sediment sources in the Pearl River delta and estuary, southern China. Estuar. Coast. Mar. Sci. 87, 618–630. doi: 10.1016/j.ecss.2010.02.018
Zhang, Y., Peng, X., and Zhao, J. (2011). High-resolution palynological record and evolution of vegetation and climate in the low latitude of the South China Sea since 15 ka BP. J. Trop. Oceanogr. 30, 67–73.
Zheng, L. W., Ding, X. D., Liu, J. T., Li, D. W., Lee, T. Y., Zheng, X. F., et al. (2017). Isotopic evidence for the influence of typhoons and submarine canyons on the sourcing and transport behavior of biospheric organic carbon to the deep sea. Earth Planet. Sci. Lett. 465, 103–111. doi: 10.1016/j.epsl.2017.02.037
Keywords: Southern South China Sea, TOC, δ13Corg, pollen, deep ocean, sediment provenance
Citation: Thilakanayaka V, Chuanxiu L, Xiang R, Devendra D, Dasanayaka SAHK, Jiang W, Rahman A, Kumar S and Ariful GM (2019) Sediment Provenance of the Nansha Trough Since 40 ka B.P. in the South China Sea: Evidence From δ13Corg, TOC and Pollen Composition. Front. Earth Sci. 7:110. doi: 10.3389/feart.2019.00110
Received: 13 March 2019; Accepted: 29 April 2019;
Published: 31 May 2019.
Edited by:
Giancarlo Scardia, São Paulo State University, BrazilReviewed by:
Mingrui Qiang, South China Normal University, ChinaLi Wu, Anhui Normal University, China
Copyright © 2019 Thilakanayaka, Chuanxiu, Xiang, Devendra, Dasanayaka, Jiang, Rahman, Kumar and Ariful. This is an open-access article distributed under the terms of the Creative Commons Attribution License (CC BY). The use, distribution or reproduction in other forums is permitted, provided the original author(s) and the copyright owner(s) are credited and that the original publication in this journal is cited, in accordance with accepted academic practice. No use, distribution or reproduction is permitted which does not comply with these terms.
*Correspondence: Luo Chuanxiu, eGl1MTA0QHNjc2lvLmFjLmNu
 Vidusanka Thilakanayaka
 Luo Chuanxiu
 Rong Xiang1,2
 Dhanushka Devendra