 Simon A. Martin
 Janine L. Kavanagh
 Andrew J. Biggin
 James E. P. Utley
- Department of Earth, Ocean and Ecological Sciences, University of Liverpool, Liverpool, United Kingdom
Studying extinct volcanoes where erosion has exposed dykes and sills provides direct access to the fossil remnants of magma movement, however, linking crystallized magma to emplacement dynamics is challenging. This study investigates how magma flow varies across the thickness of a thin (6 m thick) mafic sill. We use a high-resolution sampling regime to measure micro-scale variations in magnetic anisotropy, which is associated with the orientation of the magnetic particles present within the crystalline rock. Fieldwork was conducted on exposed sills of the British and Irish Palaeogene Igneous Province, Isle of Skye, Scotland. Here Jurassic sedimentary rocks have been intruded by a series of sills, of picrite to crinanite composition, from the Little Minch Sill Complex (c.60 Ma). Anisotropy of magnetic susceptibility (AMS) and anisotropy of anhysteretic remanent magnetization (AARM) signals have been used to separate a crinanite sill into distinct magnetic groupings. We identified two AMS groups (the upper and lower sill margins, and the central region) and four AARM groups (the lower margin, the middle region, a region just below the upper margin, and the upper margin). Both AMS and AARM signals originate from titanomagnetite of multi-domain or vortex-state to single-domain sized grains, respectively. The AMS and AARM fabrics are aligned with each other in the margin regions preserving a history of magma flow toward the North during initial emplacement. However, in the sill interior the magnetic fabrics are oblique to each other, thus reflecting multiple origins. We suggest the AMS fabrics have recorded magma flow during sill growth, and AARM fabrics have recorded melt percolation flow as the interstitial melt migrated upward through a solidifying crystal mush. We demonstrate that when AMS and AARM are used in combination they enable a detailed understanding of magma flow and solidification dynamics to be obtained, from initial emplacement to solidification. Overall, our detailed sampling and analysis indicates that magnetic fabrics can be highly variable over small distances, supporting the suggestion of horizontal flow restriction and propagation path migration within growing sills, and that previous reports of magma flow and solidification dynamics based on under-sampled bodies may require reconsideration.
Introduction
Determining the physical, chemical and thermal processes that occur during the propagation, transport and emplacement of magma within magmatic intrusions is necessary for understanding how volcanic systems develop (e.g., Magee et al., 2018b). Magma is transported through the crust in a series of sheet intrusions called dykes, inclined sheets, and sills (e.g., Mathieu et al., 2008). These sheet intrusions are an important structure for the transport and storage of magma in the crust, helping to build large magma reservoirs at depth, and are a key contributor to crustal growth (see review by Putirka, 2017; and references therein). The importance of dykes as feeders of magma to the surface is well known (e.g., Geshi et al., 2010; Gudmundsson et al., 2014), with sills also providing pathways for magma to travel many kilometers from their source regions (e.g., Airoldi et al., 2016). Understanding magma intrusion dynamics that occurred in the past is therefore important for mitigating volcanic hazards in the future through monitoring of active volcanoes (e.g., Sparks and Cashman, 2017). Sills are also of economic importance as they can be associated with maturing petroleum source rocks or creating traps (e.g., Monreal et al., 2009; Schofield et al., 2018). Some kimberlitic sills are also hosts to diamonds (e.g., Sparks, 2013).
Traditionally the factors that influence the propagation of sheet intrusions through the crust, and their tendency to arrest or erupt, primarily consider deformation of the host rock, with intrusion propagation linked to: mode of fracture propagation (i.e., tensile, shear or mixed mode; Rubin, 1995), strength and rheology of the host rock (e.g., Geshi et al., 2012; Galland et al., 2014), mechanical layering of crustal strata (e.g., Kavanagh et al., 2006), interface strength between rock layers (e.g., Baer, 1991; Kavanagh and Pavier, 2014), and tectonic stresses (e.g., Paquet et al., 2007; Menand et al., 2010; Stephens et al., 2017). However, the physical properties of the magma can also affect the ability of a magma to intrude rather than erupt. These include magma overpressure (e.g., Lister and Kerr, 1991), flux (e.g., Fujita et al., 2004), rheology (including melt composition and the relative proportions of melt, bubbles and crystals, e.g., Castro et al., 2016), heat transfer (e.g., Annen and Sparks, 2002), and the coupling of magma and host-rock through magma buoyancy (e.g., Lister, 1991). How magmas flow, and how flow is preserved in the rock record during the emplacement and evolution of sheet intrusions, is not often considered when investigating their formation. This contrasts with the study of larger igneous bodies, such as plutons, where the focus has been on magmatic processes and less with the interaction with the host-rock (e.g., Bons et al., 2015; Holness et al., 2017; Kavanagh et al., 2018b).
There are two dominant models that explain the solidification of sheet intrusions, which has primary influence on how evidence of flow is preserved. The first model is typically applied to thin sills (<10 m) comprising a single pulse of magma which intrudes a colder host-rock and solidifies as a single unit via conductive cooling from the contact regions (e.g., Huppert and Sparks, 1989; Wartho et al., 2001; Petcovic and Dufek, 2005). This is often inferred from the presence of chilled margins at the contacts, and from symmetrical patterns of magma composition and mineral proportions across the interior of the solidified magma (e.g., Holness and Humphreys, 2003; Féménias et al., 2004). The second model is typically applied to thick intrusions (>10 m) where large volumes of magma are emplaced by multiple pulses which intrude in rapid succession into the same intrusion and homogenize (e.g., Annen, 2011; Menand, 2011; Holness et al., 2017). There is good evidence that these relatively large volumes of magma can cool by convection (e.g., Holness et al., 2017). Evidence of convection includes asymmetrical changes in chemistry, mineralogy, crystal preferred orientation and grain size distribution across the breadth of an intrusion (e.g., Holness and Humphreys, 2003; Holness et al., 2017; Nicoli et al., 2018).
Rock structures such as macroscopic ropey surface textures (Liss et al., 2002; Schofield, 2009; Hoyer and Watkeys, 2017), strained and elongated vesicles (e.g., Coward, 1980; Varga et al., 1998; Hoyer and Watkeys, 2017), surface grooves and striations (e.g., Smith, 1987; Varga et al., 1998) and steps, bridges and broken bridges (e.g., Thomson, 2007; Schofield, 2009; Magee et al., 2018a) have been used to interpret local magma flow direction in ancient eroded magmatic intrusions. Microscale fabrics that potentially record magma flow include crystal preferred orientations (e.g., Geoffroy et al., 2002; Holness and Humphreys, 2003) and rock magnetic fabrics (e.g., Knight and Walker, 1988; Staudigel et al., 1992; Chadima et al., 2009; Magee et al., 2012). These microscopic fabrics are useful as they can record processes such as simple shear (e.g., Correa-Gomes et al., 2001), which can occur within both stationary and moving material (e.g., Holness et al., 2017; Kendrick et al., 2017). When macroscale and microscale observations are used in combination (e.g., Mattsson et al., 2018), more complex emplacement histories can be unraveled. Studying two or (pseudo) three dimensional sections through crystallized bodies exposed by erosion (e.g., Summer Coon volcano, Colorado; Poland et al., 2004), can help to reconcile intrusion geometries and flow patterns inferred from geophysical surveys (e.g., Thomson and Hutton, 2004; Thomson, 2007; Chadwick et al., 2011; Magee et al., 2018b) and scaled analog models (e.g., Kavanagh et al., 2006, 2015; Závada et al., 2009; Abdelmalak et al., 2012; Arbaret et al., 2013). An example of variable flow has recently been characterized in the analog models of Kavanagh et al. (2018a) who identified flow circulation and channel development in a growing model dyke using particle image velocimetry.
Rock magnetic techniques, such as Anisotropy of Magnetic Susceptibility (AMS) or Anisotropy of Anhysteretic Remanent Magnetization (AARM), are commonly used to determine magma flow trajectories, with many studies applying one or both techniques to rock samples collected from dykes (e.g., Knight and Walker, 1988; Staudigel et al., 1992; Poland et al., 2004; Chadima et al., 2009; Silva et al., 2010) and sills (e.g., Liss et al., 2002; Polteau et al., 2008; Hrouda et al., 2015; Hoyer and Watkeys, 2017) of a wide range of magma composition and from various tectonic settings. However, these studies predominantly focus on measuring the initial magma flow direction by sampling near the intrusion contacts, resulting in a simplification and a potentially limited understanding of the overall emplacement history and how this changes through time. Problems can also arise deciphering the origin of the fabrics if other processes, such as shear along the fracture during emplacement (e.g., Correa-Gomes et al., 2001) or post-emplacement alteration (e.g., Trindade et al., 2001; Archanjo and Launeau, 2004), have occurred.
This paper investigates how magnetic fabrics vary across the thickness of a relatively thin sill (6 m thick) from the Isle of Skye, Scotland. Rock magnetic analyses of closely spaced rock samples of crystalline magma collected along the length and thickness of the sill provides a detailed account of how magnetic fabrics can vary spatially. We also present what we believe is one of the first applications of the AARM technique to understand sill emplacement histories. The AARM signals are compared with AMS fabrics and interpreted based on some basic petrographic analysis and simple thermal modeling to better our understanding of how syn- and post-emplacement processes are recorded in magmatic intrusions, from sill propagation to solidification. We also make recommendations on how these techniques should be used to study magma flow in fossilized magma intrusions in the future.
Geological Setting
To investigate how magnetic fabrics vary across the thickness of a sill we required a field location which provided a well exposed sill, with basal and upper contacts exposed, and a site that was easily accessible. As our study aimed to collect rock samples at very high density, we also required an intrusion that was relatively thin (<10 m thick). To aid our interpretation of our magnetic results we also required a site that had detailed petrographic work already available in the literature. Sills from the Trotternish Peninsula in the Isle of Skye fulfilled all these criteria, and was therefore the ideal site where to conduct our study.
The Trotternish Peninsula is located in the north of the Isle of Skye, Northwest Scotland (Figure 1A). It is a 33 km long peninsula comprising a succession of Middle Jurassic sandstones and mudstones (∼168 Ma) (Hudson and Trewin, 2002) capped by basaltic lava flows of the Skye Lava Group (∼60 Ma) (Harris and Hudson, 1980; Gibb and Gibson, 1989; Emeleus and Bell, 2005). The sedimentary rocks were intruded by a series of sills which comprise the Little Minch Sill Complex (LMSC), and are part of the British and Irish Palaeogene Igneous Province. The LMSC is considered to post-date the Skye Lava Group (Schofield, 2009; Hughes et al., 2015). The sills vary in composition from picrite (>40% olivine) to picrodolerite (15–40% olivine) to crinanite (analcime bearing olivine dolerite with <15% olivine) (Gibb and Henderson, 1984; Gibson and Jones, 1991; British Geological Survey, 2007). At a later stage, the region was crosscut by a series of NW-SE trending mafic dykes from the Skye Dyke Swarm (Hughes et al., 2015), a part of the North Britain Palaeogene Dyke Suite (Emeleus and Bell, 2005).
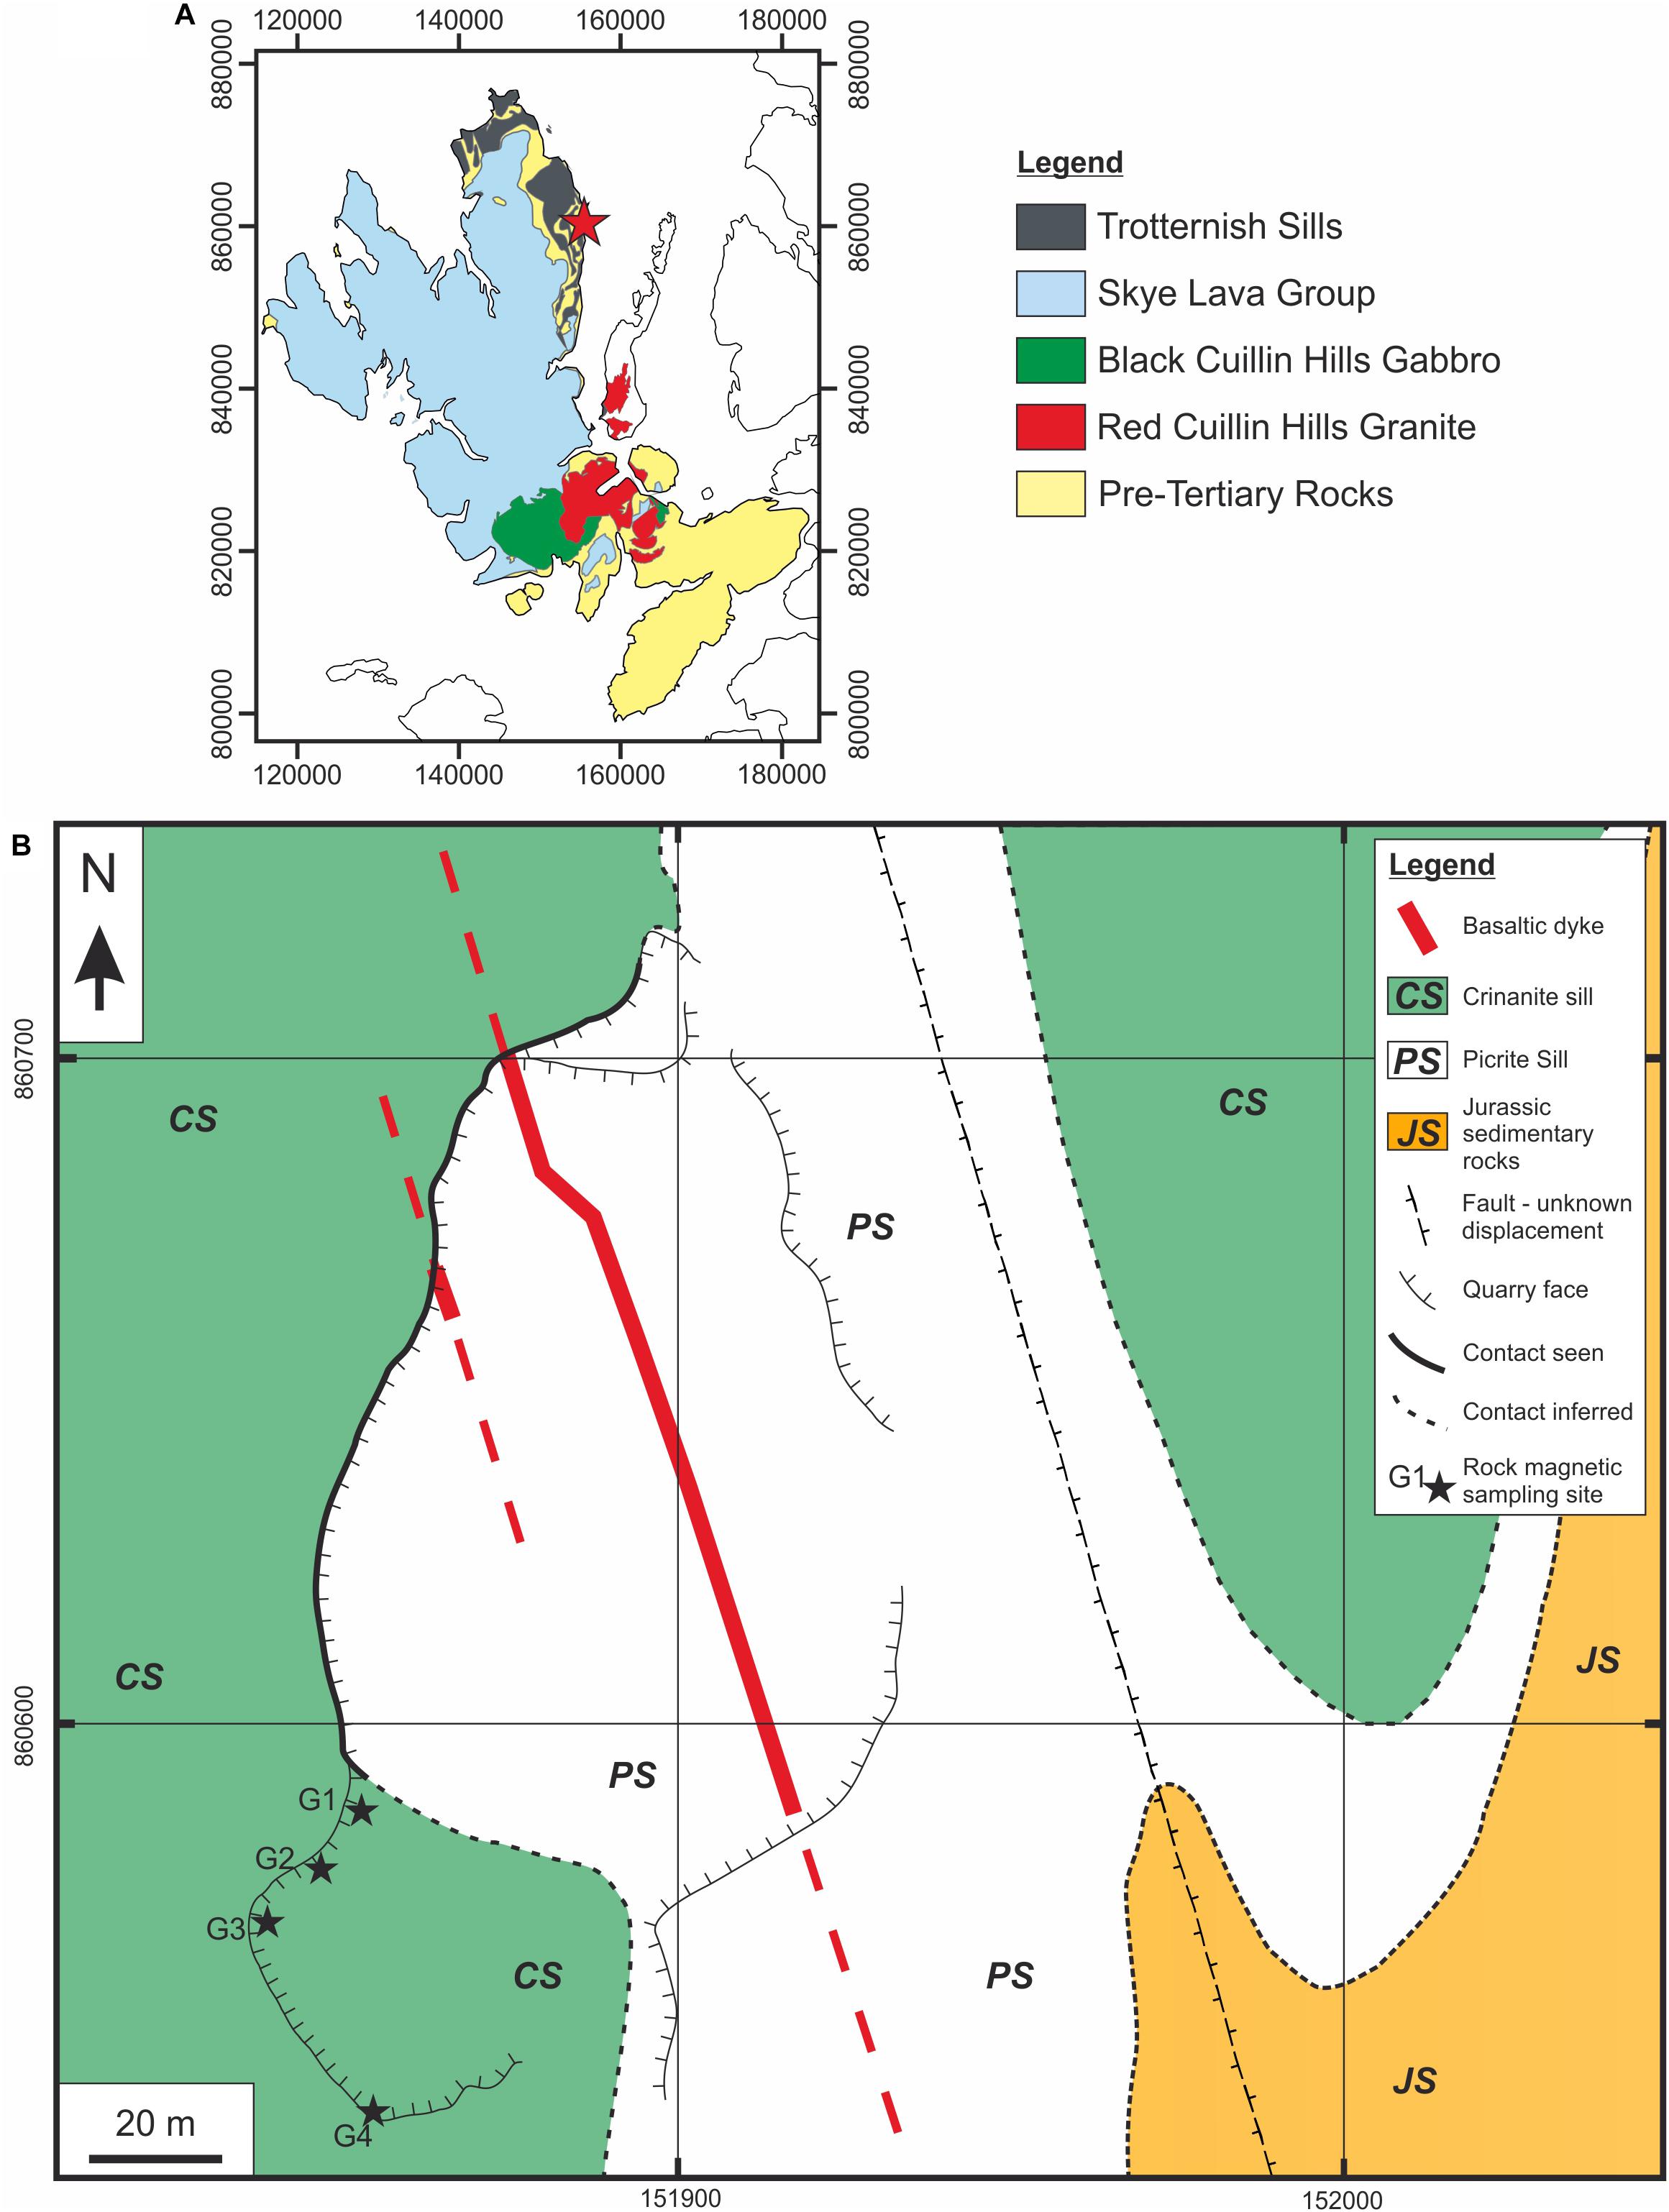
Figure 1. (A) Simplified geological map of the Isle of Skye (modified after EDINA Geology Digimap Service, 2008) showing location of Inver Tote (Red Star). (B) Geological map of disused quarry near Inver Tote, Isle of Skye, Scotland. Palaeogene age crinanite (CS) and picrite sills (PS) (green and white respectively) of the Little Minch Sill Complex, British and Irish Palaeogene Igneous Province, have intruded Jurassic sedimentary rocks (JS, orange). Cross cutting the area are two basaltic dykes (red). Locations of magnetic sampling sites are marked G1-4 in the SW end of the quarry.
Structural mapping and rock sampling were conducted in an easily accessible quarry near Inver Tote (NG 51863 60609) (Figure 1) where a crinanite sill and a picrite sill (Figures 2A,B) have intruded sandstones and mudstones of the Elgol Sandstone Formation (Harris and Hudson, 1980). A combination of partially evolved olivine-bearing alkali-basalt parental magma and assimilated Lewisian Gneiss basement rocks have produced the crinanite composition (Gibson, 1990). At the site, and in the surrounding area, there are a series of NNW-SSE trending faults that cross-cut the sills (British Geological Survey, 2007). Within the quarry, two dykes from the Skye Dyke Swarm crop out parallel to the NNW-SSE striking faults.
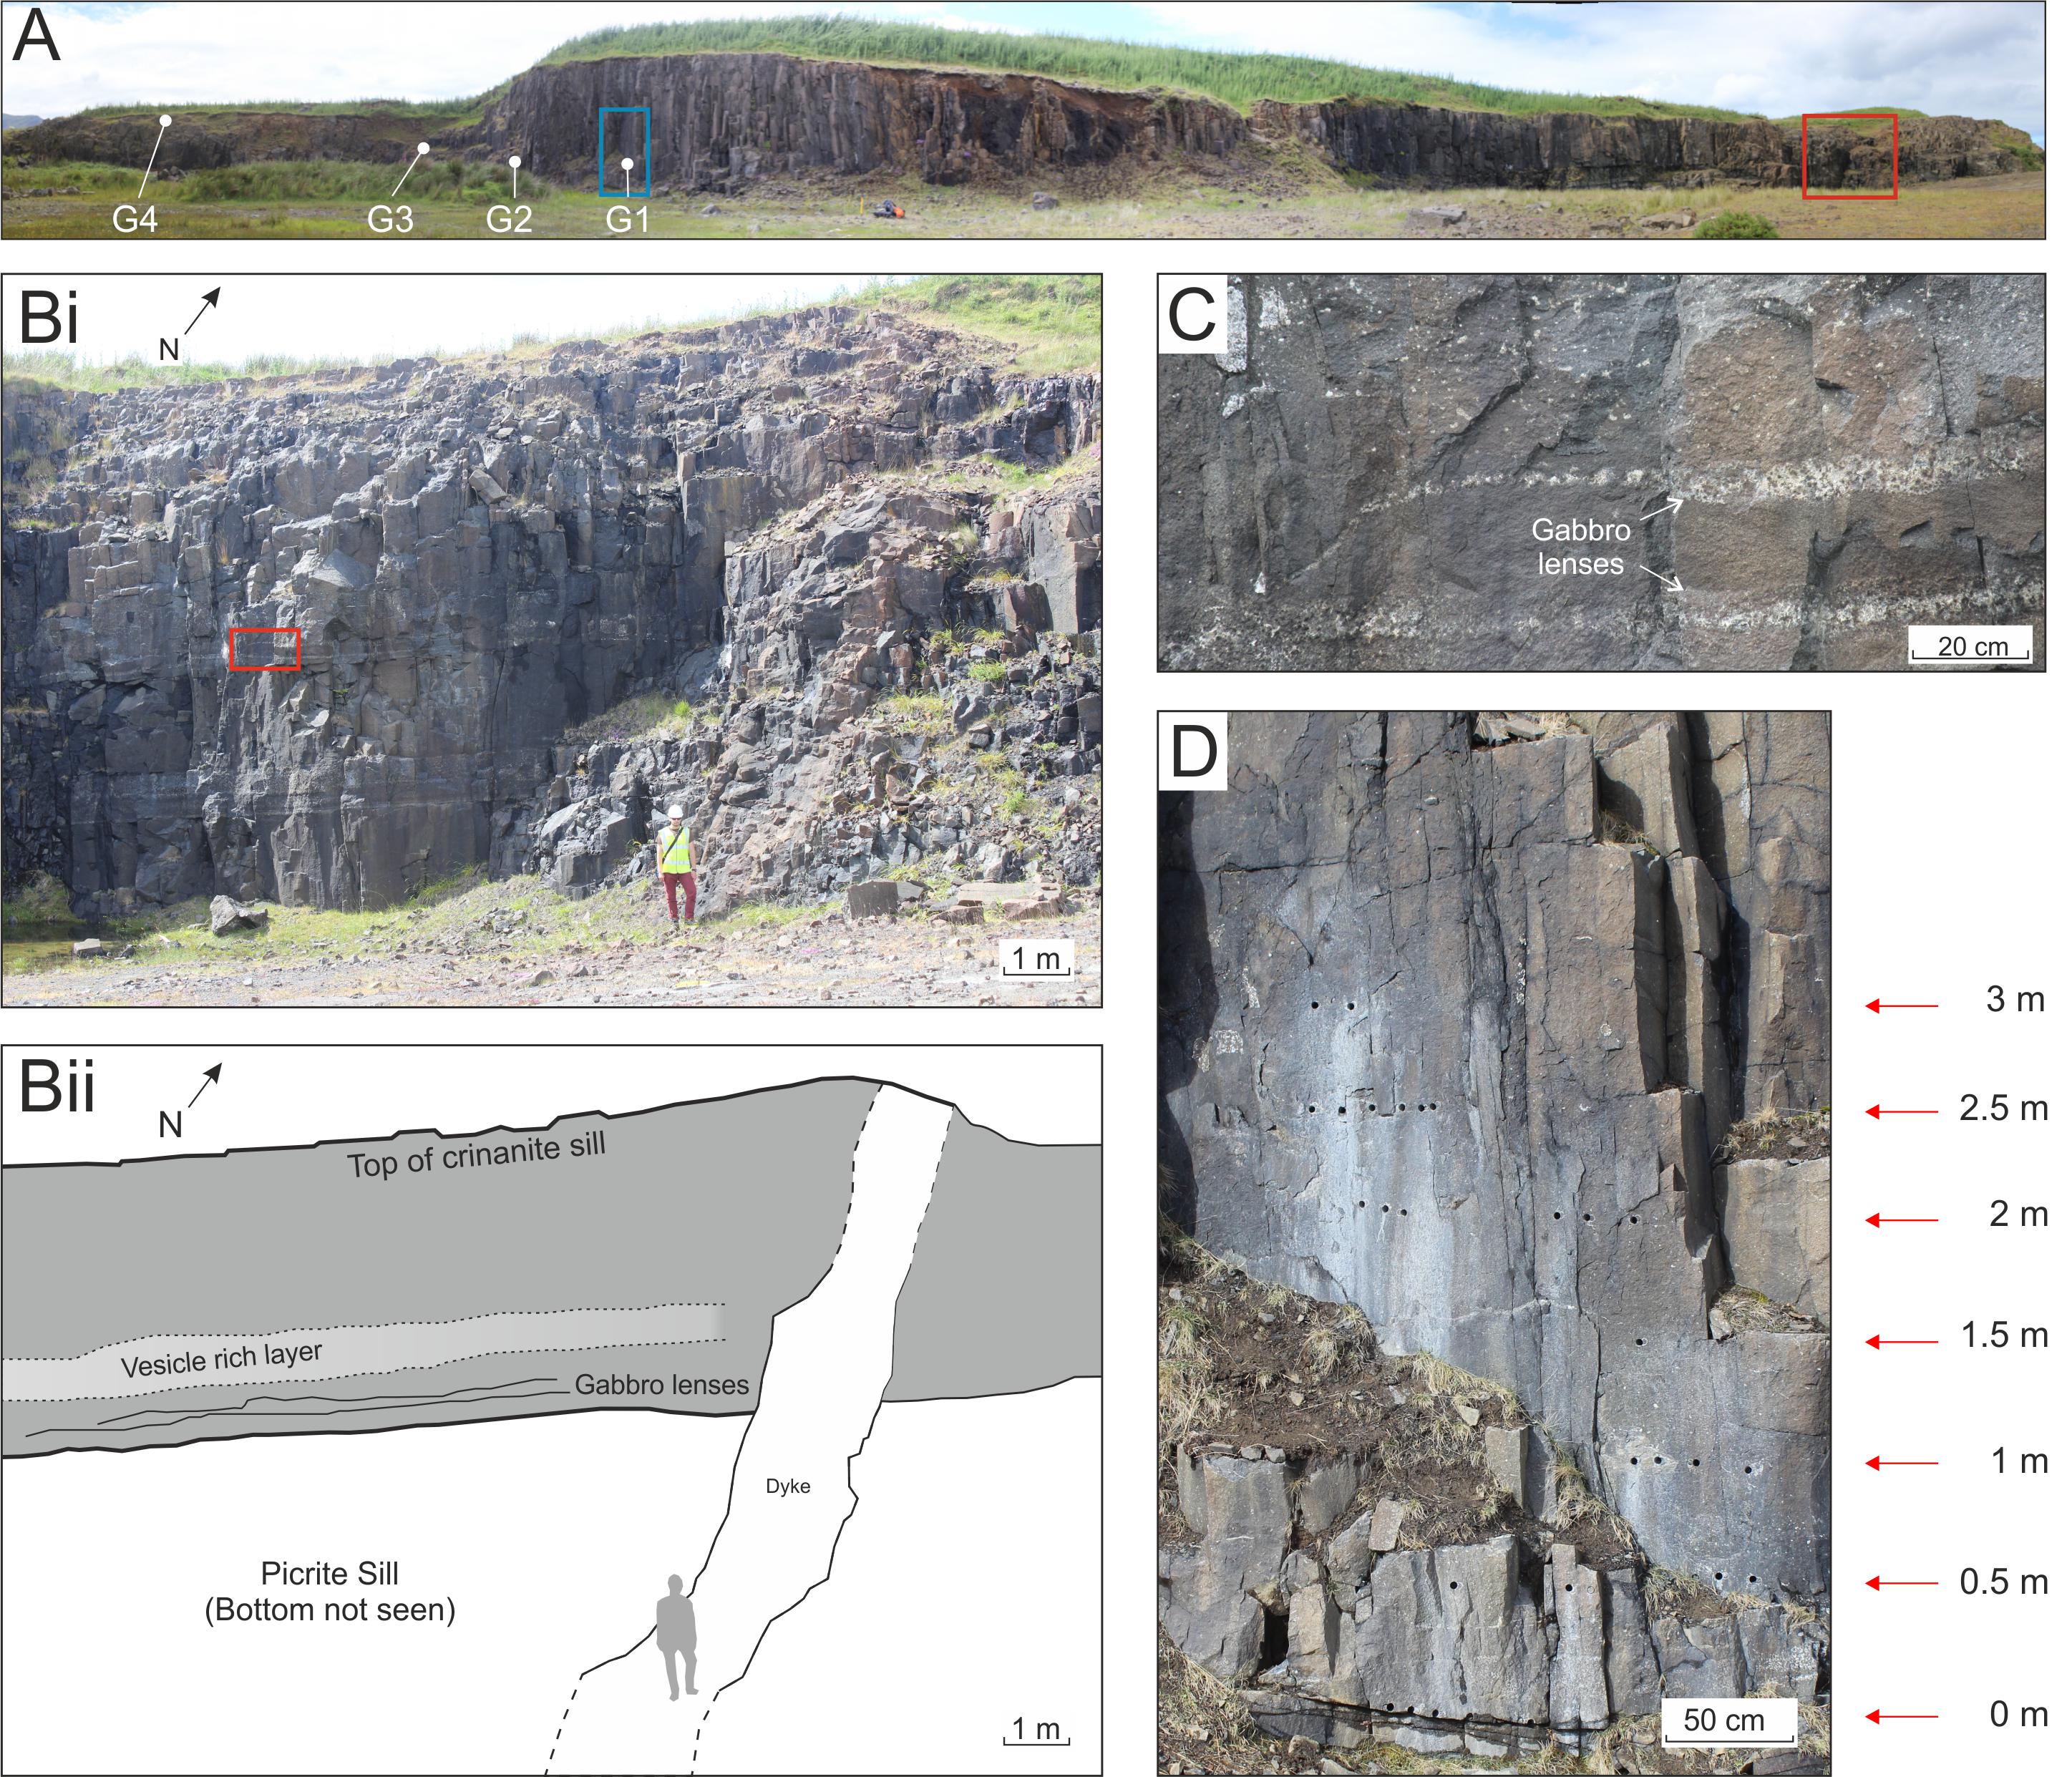
Figure 2. Field photographs of crinanite and picrite sills that crop out in a quarry at Inver Tote. (A) Overview panoramic photograph showing magnetic sampling sites (G1-4), and the blue and red boxes are the locations of photos (B,D). (Bi) Photograph showing a crinanite sill, a picrite sill and a basaltic dyke. The red box is the location of photograph (C), and (Bii) is an interpretive drawing of (Bi) which shows the location of the units present. (C) Photograph of the lower portion of the crinanite sill showing the gabbro lenses. (D) Photograph of drill holes across the lowest 3 m of sampling heights in the crinanite sill (location G1).
The crinanite sill overlies the picrite sill and underlies Jurassic sedimentary rocks (Figure 2A). Its upper contact was not directly observed as the Jurassic host rocks have since been eroded, however, following Gibson and Jones (1991) we infer that the resistant and exposed upper flat-lying surface of the quarry is the top of the sill. In the quarry, the crinanite sill has a thickness varying between 5 and 6 m, with the upper surface being undulatory, as suggested by Schofield (2009). He also suggested that the sill propagated as a series of fingers from a NNW to SSE direction, and that these fingers then merged during sill inflation. The lower contact of the crinanite sill has an overall strike of approximately 000/05° W, however, it is undulose and trends 143/13° SW in the southern part of the quarry and 039/10° NW in the northern part. The underlying picrite sill is >15 and up to 42 m thick (Gibson and Jones, 1991). There is a chilled margin at the base of the crinanite sill, however, columnar jointing is continuous across the margin (Figure 2B).
Within the crinanite, there are a series of horizontally elongate and laterally extensive gabbro lenses up to 10 cm in thickness (Figures 2B,C). These are similar in composition to pegmatitic gabbro lenses mentioned by other authors who have published on the area (e.g., Gibson and Jones, 1991; Nicoli et al., 2018). There are also occasional amygdale rich bands throughout the thickness of the sill (Figure 2Bii). Vesicles are up to several centimeters in size; the smaller ones are spherical, but larger ones are flatter and elongate, with their short axes perpendicular to the sill plane. The largest vesicle observed was 20 cm long and 8 cm wide, and had a long axis oriented approximately ENE. Analcime is present as vesicle infill. Previous work in the area does not mention a crystal cargo within the crinanite at Inver Tote (e.g., Gibson and Jones, 1991), however, it is present in other sills in the region such as the Shiant Isles picrodoleritie/crinanite unit (Holness et al., 2017) and the Dun Raisburgh crinanite (Nicoli et al., 2018) which have an approximant 3% crystal cargo consisting of olivine and plagioclase.
Rock Magnetism and Its Application to Volcanic Rocks
Rock magnetism and magnetic anisotropy are commonly used in sedimentology, paleontology, tectonics and volcanology to understand formational processes, determine rock ages, and paleocurrent or flow trajectories (e.g., Blundell, 1957; Tauxe, 2010). Rock magnetism is often used to determine models of emplacement of dykes and sills, magma flow trajectories, and to infer intrusion source locations (e.g., Olazabal et al., 1999; Poland et al., 2004; O’Driscoll et al., 2006; Magee et al., 2018b). In this study, we use AARM and anisotropy of anhysteretic magnetization (AARM) to understand variations in magma flow trajectories, and to decipher magma flow and solidification processes across the breadth of the crinanite sill.
Anisotropy of magnetic susceptibility (AMS) is the study of how susceptible a sample is to gaining an induced magnetic field (Knight and Walker, 1988; Raposo and Ernesto, 1995). The induced field is affected by the strength, size, domain state and orientation of all magnetic minerals (dia-, para- and ferro-magnetic) present in the sample (Khan, 1962), however, some phases dominate the magnetic signal when present, for example magnetite (e.g., Hargraves et al., 1991). AARM differs from AMS in that it is used to study the fabric originating from magnetic remanence carrying grains, which tend to be single-domain (SD) or vortex-state (VS) in nature (McCabe et al., 1985; Jackson, 1991). The fabric that the ferromagnetic minerals exhibit is linked to their ability to obtain an anhysteretic remanence (laboratory magnetization). The ferromagnetic minerals that give rise to the AARM signal often occur as silicate mineral-hosted magnetites (Cheadle and Gee, 2017).
Magnetic susceptibility (K) is defined as;
where Mi is the degree of induced magnetization and H is the strength of the magnetic field. The magnetic susceptibility of a sample is characterized by a second order ellipsoid tensor (Khan, 1962), which has three principle eigenvectors: K1, K2 and K3, where K1 is the longest axis, K2 is the intermediate axis and K3 is the shortest axis (Knight and Walker, 1988). The ratio between the magnitudes of the different tensor axes gives rise to a range of ellipsoid properties: lineation (L), foliation (F), degree of anisotropy (Pj) and shape parameter (T). There are four different shapes exhibited by an AMS ellipsoid: spheroidal (K1 = K2 = K3), oblate (K1 > K2 = K3), prolate (K1 = K2 > K3) and tri-axial (K1 > K2 > K3) (Tauxe, 2010). Ellipsoid tensor shapes can be used to interpret magmatic fabrics (e.g., Knight and Walker, 1988). Prolate shaped ellipsoids are commonly known as magnetic lineation (Table 1), being similar to the long axis of elongate crystals in magmatic rocks (Geoffroy et al., 2002). In comparison, oblate shaped ellipsoids give rise to magnetic foliation (Table 1), similar to the planar arrangement of tabular phenocrysts. AARM also utilizes a second order ellipsoid tensor, with the same ellipsoid descriptions, and is defined as K(rem) which is calculated by averaging different directions of imparted anhysteretic remanent magnetizations (Table 1).
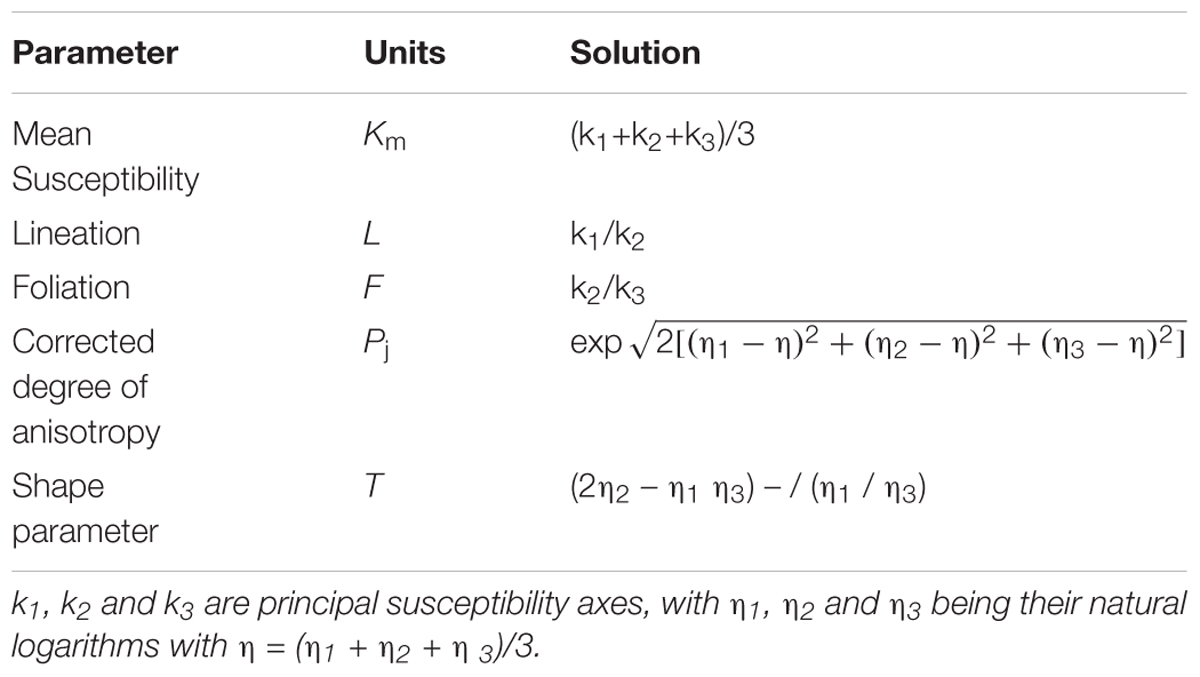
Table 1. Anisotropy parameters used by Anisoft software and can be found in Jelinek (1981).
Combining the measured magnitude and orientation of ellipsoid tensors with field and petrological observations is used to infer magma flow that built now static, solidified magma bodies (e.g., Varga et al., 1998; Liss et al., 2002; Chadima et al., 2009). AMS has commonly been used to understand intrusive processes with many studies implementing the technique to interpret the observed fabrics (e.g., Knight and Walker, 1988; Staudigel et al., 1992; Roni et al., 2014). AARM has been used in many studies to infer the emplacement processes of dykes (e.g., Chadima et al., 2009; Silva et al., 2010; Soriano et al., 2016) and the Stillwater Igneous Complex, MT, United States (Selkin et al., 2014), with only one study applying the technique to study sill emplacement (Hrouda et al., 2015).
When the AMS K1 axis is aligned with the long axis of the magnetic crystals (and phenocrysts when present) or with AARM K1 axis, and these are parallel to intrusion margins, this is known as a normal fabric (Rochette et al., 1992; Ferre, 2002; Chadima et al., 2009). In this case the K3 axis is also parallel to the short axis of a crystal or the AARM K3 axis, i.e., magnetic lineation and magnetic foliation are both parallel, and can be used to infer the magma flow direction. At the margin regions of mafic intrusions AMS fabrics can be inclined, which suggests that the magnetic minerals have been inclined reoriented by simple shear conditions imparted by the flowing magma experiencing variations in strain rate imparted at a no-slip boundary with the host-rock (e.g., Knight and Walker, 1988; Rochette et al., 1992). In these situations, the imbricated magnetic lineation and foliation can be used to interpret the sense of magma flow during initial emplacement (Geoffroy et al., 2002; Chadima et al., 2009). Inverse fabrics occur when the AMS K1 and K3 axes are inverted with respect to crystal long axes or AARM K1 and K3 axes and the intrusion margins. In these situations, the origin of inverse fabrics is often related to SD crystals dominating the magnetic fabric (Potter and Stephenson, 1988; Rochette et al., 1992; Ferre, 2002). Anomalous fabrics are characterized by AMS and AARM ellipsoids with axes in orientations that fit neither a normal or inverse fabric (Soriano et al., 2016), the origins of which have been widely debated. Examples include: combinations of SD and multi-domain (MD) particles that produce the fabrics (Potter and Stephenson, 1988; Rochette et al., 1991), and processes such as syn- or post-emplacement shear along the crack (Dragoni et al., 1997; Clemente et al., 2007), alteration (Rochette et al., 1991), or cooling contraction (Hrouda et al., 2015).
Methodology
Sampling
The crinanite sill was chosen as the ideal candidate to sample for our magnetic analysis. The quarry outcrop provides excellent exposure and access to the entire sill thickness, spanning the top and bottom contacts (6 m in total) and extending over ∼45 m of sill length due to sampling logistics and field safety. Sampling was also conducted along the inferred axis of a finger-like morphology described by Schofield (2009).
Seventy-eight 2 cm diameter cores, up to 10 cm long, were collected at 50 cm intervals spanning the 6 m thickness of the crinanite sill and spread laterally across 4 sample sites (G1-4 in Figures 1, 2A). The samples were collected using a chainsaw motor-driven Stihl BT45 core drill. Six cores were collected at each 50 cm height interval (Figure 2D and Table 2). There was overlap in the sampled heights at the sites to enable correlation between them to be assessed during subsequent data processing and analysis. Cores were drilled horizontally, approximately in-plane with the sill, and were oriented in situ using both sun and magnetic compasses. In the laboratory, the rock cores were sliced into 2.2 cm long specimens, with each core producing one to three specimens, yielding a total of 147 specimens which were used for magnetic anisotropy analyses. Additional hand-sized oriented and unoriented rock samples were taken for basic petrographic analysis (Table 2).
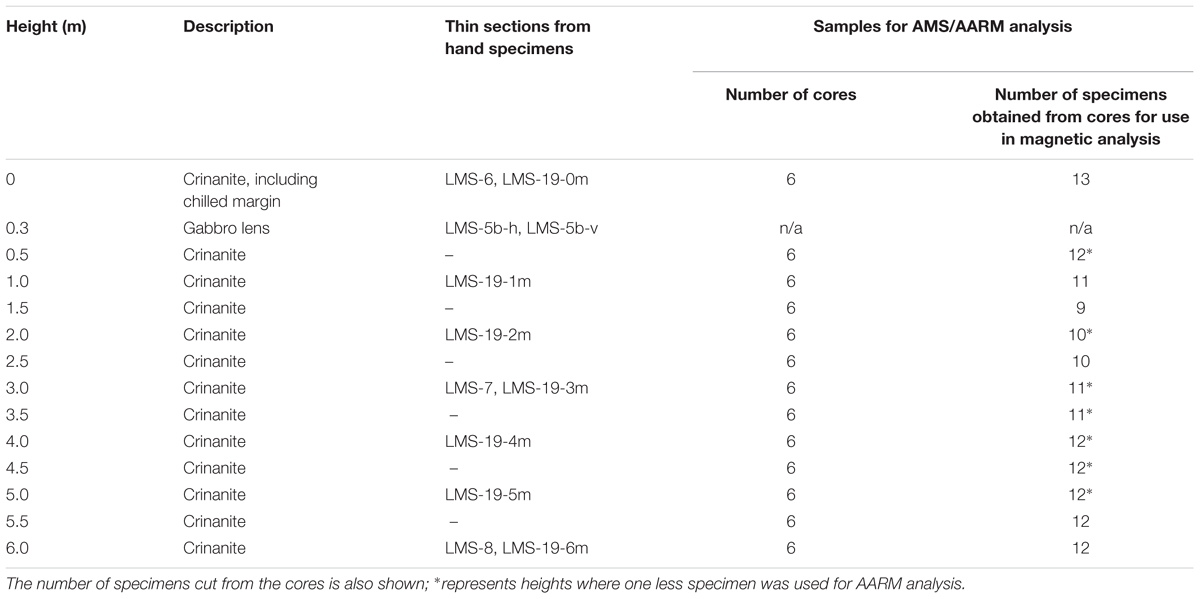
Table 2. Table showing the location and heights of thin sections for petrology and the number of cores collected for magnetic anisotropy studies.
Characterization of Magnetic Carriers
A key step in any rock magnetism study is accurate identification of the magnetic carriers that produce the AMS or AARM fabrics. Identification of the magnetic carriers in the Invertote crinanite sill was undertaken using core offcuts at each sampling height and taking three approaches: (1) multi-technique analysis using a variable field translation balance (VFTB), (2) high temperature susceptibility, and (3) three-component thermal demagnetization, known as the Lowrie method (Lowrie, 1990).
VFTB measures the isothermal remanent magnetization (IRM) acquisition and backfield demagnetization curves, hysteresis loops, and thermomagnetic curves of a sample to characterize the properties of its magnetic carriers and thus help identify the mineral populations giving rise to the observed fabrics. Masses of 150 mg of fine powdered rock from core offcuts were measured for their IRM by applying a magnetic field, removing the field and then measuring to see how well the sample has taken the applied field, stepwise to +800 mT. Backfield measurements were then made in a similar way but with an oppositely directed field of up to -800 mT. Hysteresis was then measured during the application of a field in one direction, then when it was inverted and then in the original direction. Finally, each sample underwent cyclic heating and cooling in a constant high field of 240 mT from 50°C to 700°C in 100°C intervals (starting at 200°C). This determined the Curie temperatures of each of the magnetic carriers, which are specific to mineral composition. Data was subsequently analyzed using the RockMagAnalyzer 1.0 software (Leonhardt, 2006).
High temperature susceptibility measurements were performed on fresh crushed samples from the core offcuts using the MFK-1A Kappabridge from AGICO (Advanced Geoscience Instruments Company). The temperature was incrementally increased from 30 to 700°C and then decreased back to 40°C with the magnetic susceptibility measured incrementally. The data was then analyzed using the Cureval8 software from AGICO (Chadima and Hrouda, 2012).
Three-component thermal demagnetization experiments using a modified version of the Lowrie (1990) method were conducted to identify unblocking temperatures of magnetic carriers giving rise to the signal observed in the AARM analyses. Unblocking temperatures are the temperature at which the coercive force of a grain is overcome by thermal fluctuations resulting in its demagnetization. In these experiments, the different strength fields were applied to a core specimen, after AMS and AARM analyses were performed on the specimen, in decreasing magnitudes and orientations. The field strengths used were: x-axis of 1.5 T, y-axis of 0.4 T, and z-axis of 0.02 T, which are the limits of the pulse magnetizers used. Each specimen was then heated and cooled in steps of between 20 and 50°C, to a maximum of 620 °C, which correspond with temperatures where we believe the magnetic remanence is changing the fastest, i.e., just below the Curie temperatures of minerals that are believed to give rise to the magnetic signals.
Magnetic Anisotropy
Anisotropy of magnetic susceptibility analyses were undertaken using a MFK1-A Kappabridge from AGICO, where each specimen was rotated along three axes whilst a magnetic field was induced and the subsequent susceptibility measured using AGICO’s Safyr7 software (Chadima et al., 2018b). The AMS tensor three-axes orientations were analyzed in AGICO’s Anisoft4.2 software (Chadima and Jelinek, 2009) for processing anisotropy data, utilizing Jelinek statistics (Jelinek, 1977). Susceptibilities are accurate to within 1% error.
Measurement of AARM was undertaken using a JR-6A dual speed spinner magnetometer, LDA5 alternating field (AF) demagnetizer and PAM1 anhysteretic and pulse magnetizer from AGICO. Each specimen underwent a multi-stage manual measurement of the natural remanent magnetization, demagnetization and subsequent remagnetization procedure. Initial measurement of the natural remanent magnetization (NRM) was made using the JR-6A spinner magnetometer and Rema6 instrument control software (Chadima et al., 2018a), before demagnetization in a 100 mT alternating current (AC) field using the LDA5 AF demagnetizer. An anhysteretic remanent magnetization was then applied to each sample in incrementally increasing direct current (DC) fields up to 500 mT, with subsequent measurements using the JR-6A and Rema6 software to determine the saturation magnetization for each specimen. As the peak capable field, but one still below the saturation values of the field, 500 mT was used as the DC field strength for AARM acquisition. A six-position bias field application and measurement sequence was used for each specimen, with the data subsequently analyzed using the Anisoft42 software (Chadima and Jelinek, 2009) to determine AARM tensor orientations.
Petrographic Characterization
Basic characterization of the petrological textures of the crinanite was undertaken by analyzing thin sections from 12 samples (Table 2) using Meiji MT9000 and NIKON Eclipse LV100Pol polarizing microscopes. Seven of these samples, collected at 1 m intervals across the sill thickness, were oriented during collection and their thin sections were made in a N-S orientation that was perpendicular to the sill plane. Three additional un-oriented samples were collected from the central region, upper and lower contacts of the sill, and two samples were analyzed from the gabbro lenses. Micro-scale imaging was completed by scanning electron microscopy using a Meiji TM3000 with a 15 eV beam current, and images processed using the Bruker Quantax 70 software. Quantitative Element Mapping using Scanning Electron Microscopy (QEMSCAN) was conducted on a FEI WellSite QEMSCAN for analysis of geochemistry from energy dispersive X-ray spectrometry. The Wellsite QEMSCAN SEM used a W-filament, operating at 15 kV. Two different measurement resolutions of 2 and 20 μm were used for QEMSCAN elemental mapping of the entire thin sections (up to 2 mm from each side).
Results
Rock Magnetism
Thermomagnetic Experiments
Thermomagnetic curves of in-field magnetization (Figures 3Ai–iv) show two significant changes in magnetization during cyclic heating of the crinanite sill samples. The first change occurred between 400 and 500°C, causing the cooling curve from 500°C to not overlay the heating curve, perhaps due to alteration associated with incomplete oxyexsolution and resulting in the production of a higher Ti-titanomagnetite during heating. A subsequent small drop in magnetization occurred at approximately 580°C, indicating the presence of a small portion of almost pure magnetite.
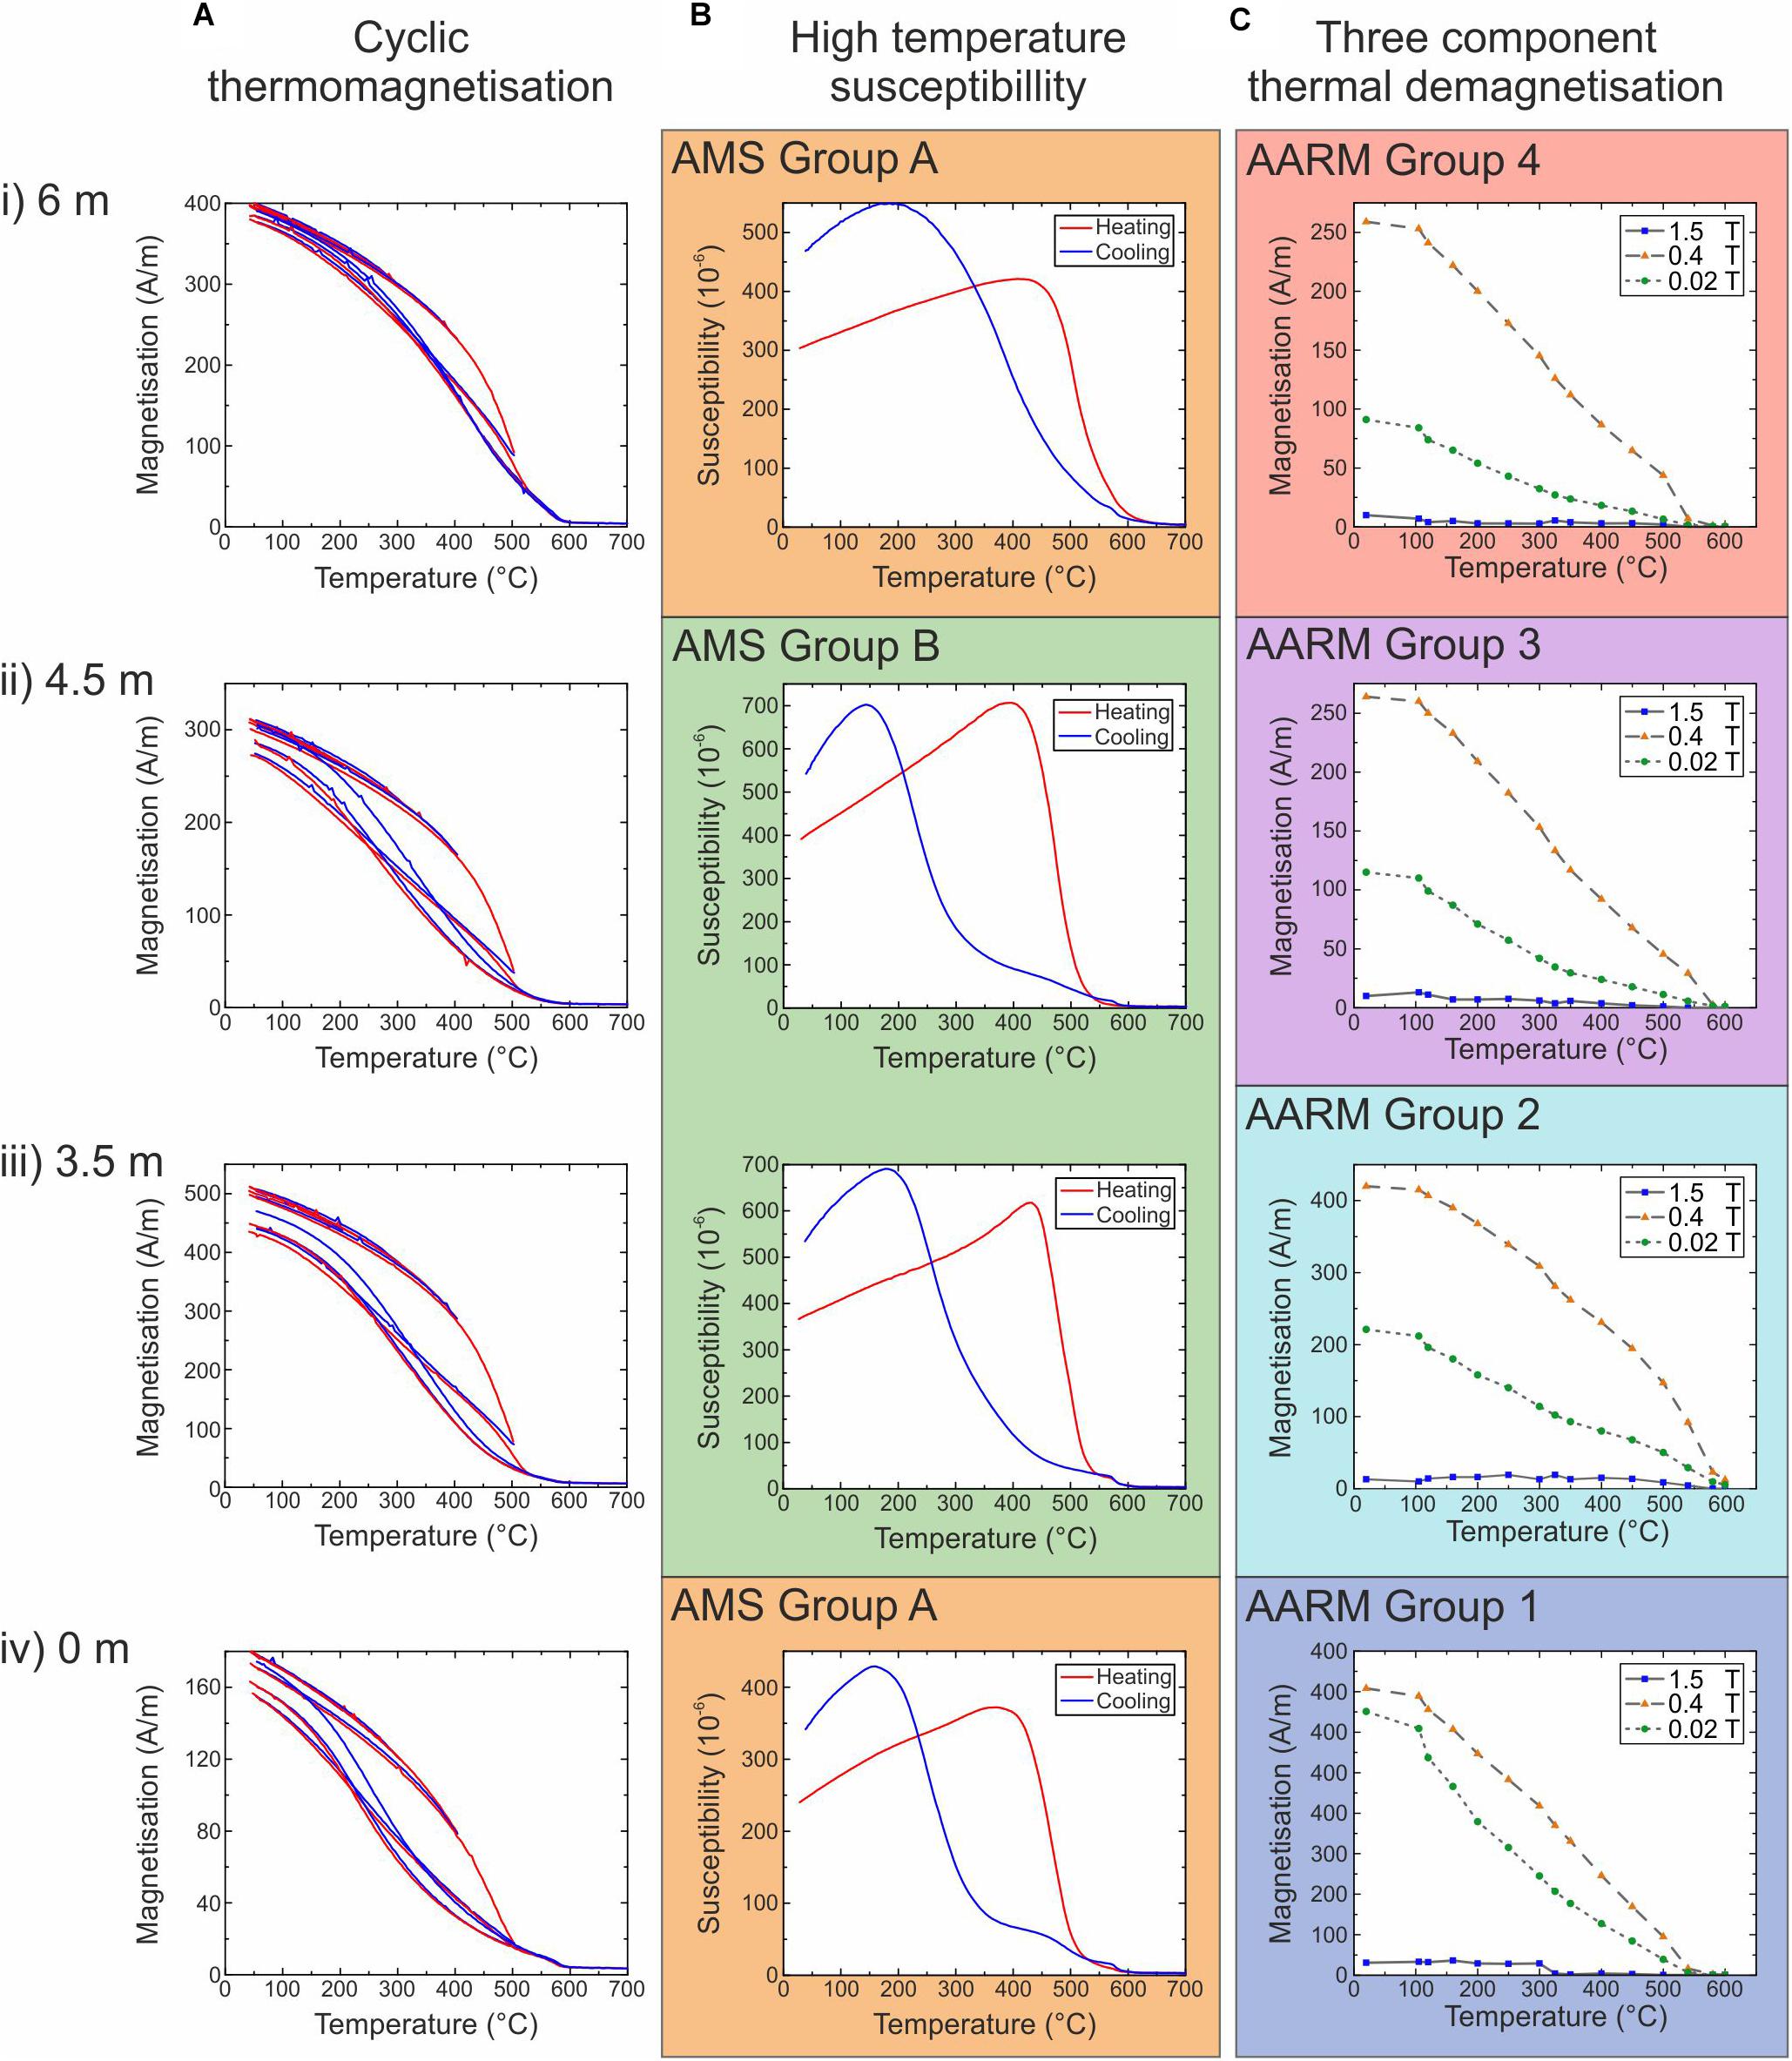
Figure 3. Graphs showing data from (A) cyclic thermomagnetization, (B) high temperature susceptibility and (C) three component thermal demagnetization experiments for identification of magnetic carriers at select heights through the crinanite sill (see Table 2): (i) 6 m (the upper contact, sample 6.0b-G4), (ii) 4.5 m (sample 4.5a-G3), (iii) 3.5 m (sample 3.5a-G3), and (iv) 0 m (the lower contact, sample 0.0a-G1). In (A,B) the red curves are heating measurements and blue curves are cooling measurements. Background colors in (B,C) represent the two AMS and four AARM groups.
High Temperature Susceptibility Experiments
High temperature susceptibility measurements on one sample from each height through the crinanite sill show similar patterns in both heating and cooling curves (Figures 3Bi–iv). During heating, the large drop in magnetization at around 480°C signifies the Curie temperature has been met and corresponds with the presence of low Ti-titanomagnetite (∼Ti10, i.e., titanomagnetite with approximately 10% Ti-content) for all samples. In all cases, the cooling curves do not follow the same trend as the heating curves, indicating that heating-induced alteration occurred. We interpret these results to mean a small amount of magnetite and a large amount of a Ti-rich titanomagnetite (possibly around Ti50) was produced during heating, however, some of the original low Ti-titanomagnetite remained (Figures 3Bi–iv).
Lowrie Experiments
Results from the modified Lowrie test show that the strongest components are in the 0.4 T range with gradually decreasing unblocking temperatures to a maximum of 580°C (Figures 3Ci–iv), which is indicative of a range of Ti-titanomagnetite compositions. There is also a decrease in the relative proportion of the 0.02 T signal compared to the 0.4 T signal with increasing height through the sill (Figures 3Ci–iv). This indicates a fining of the grain size due to a decrease in the amount of a softer, more multi-domain phase being detected by the 0.02 T strength signal. The unblocking temperature also increases from 560 to 570°C at the margins of the sill to 580–600°C toward the center of the sill (Figure 4A), which possibly relates to the longer cooling time away from the margins allowing oxyexsolution to progress further. The fining of the grain size with increased height through the sill can also be seen in a Day plot (Day et al., 1977) where all samples fall within the VS region, but the samples at 0–50 cm heights plot closer to the MD region (Figure 4B) and the rest of the samples cluster toward lower Bcr/Bc values and slightly higher Mrs/Ms values (where Bcr is coercivity of remanence, Bc is bulk coercivity, Mrs is the remanent magnetic saturation and Ms is magnetic saturation). Overall, the thermomagnetic results and Lowie experiments produce a consistent signal of a mixture of MD to SD titanomagnetite that is the dominant source of the rock magnetic signals.
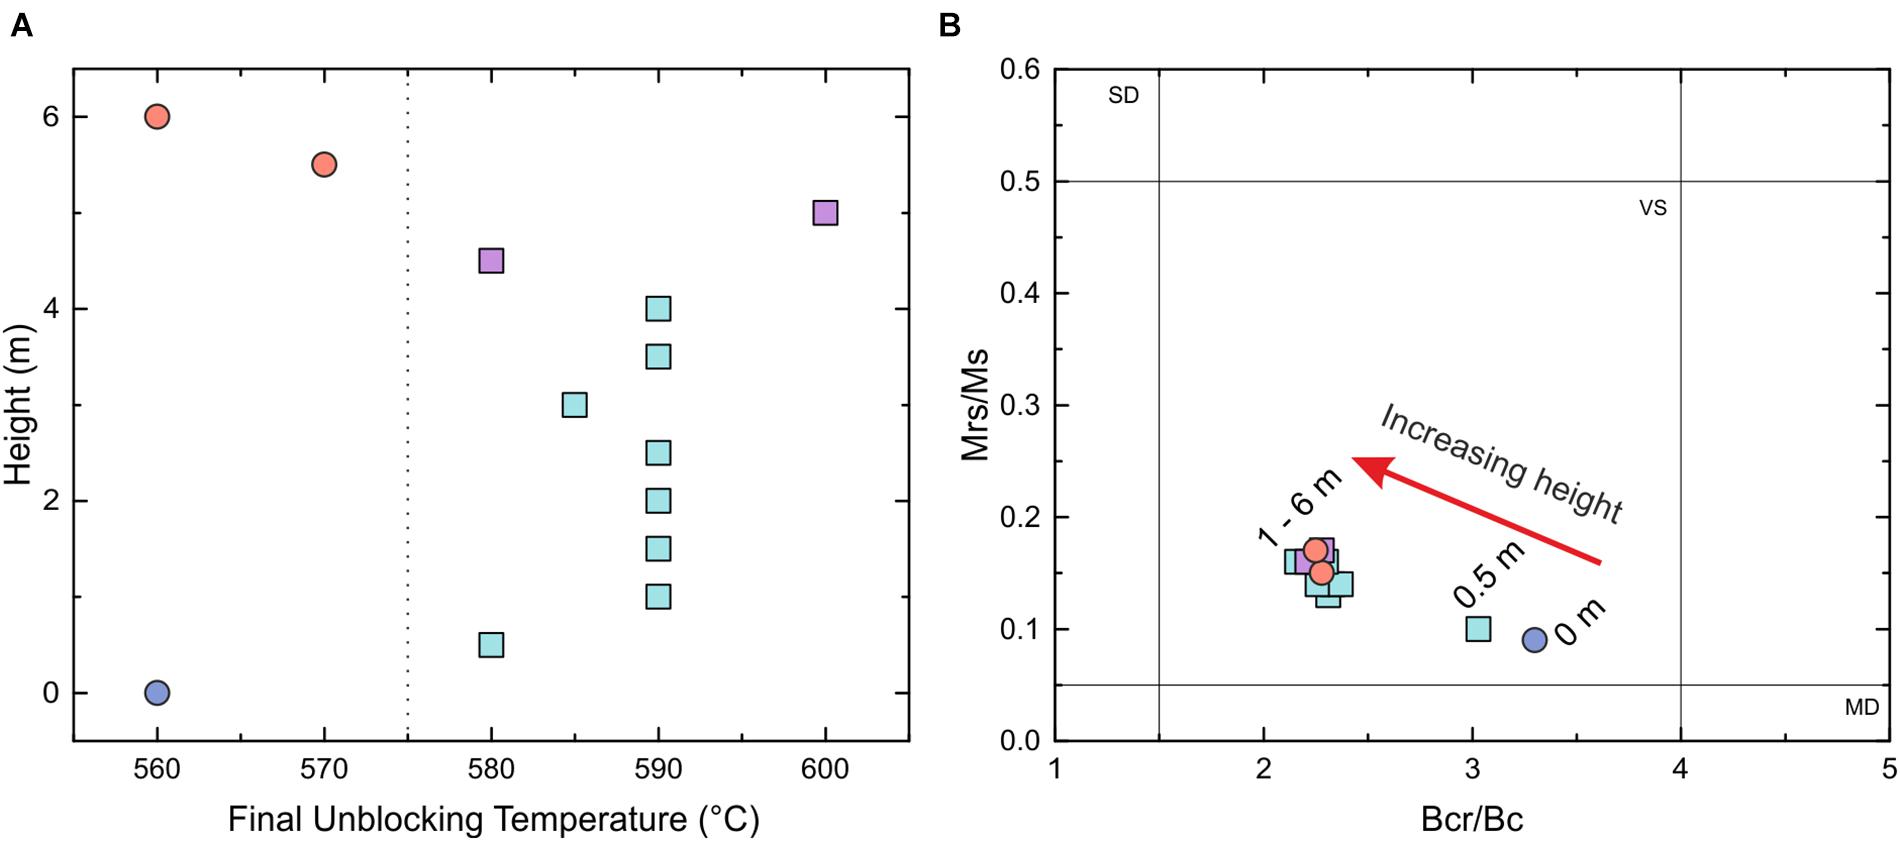
Figure 4. Graphs showing results from experiments to identify the magnetic carriers and their domain states at each 0.5 m height across the crinanite sill thickness. (A) Unblocking temperatures against height, obtained from three component demagnetization experiments (modified Lowrie method), where the vertical dashed line separates the AMS groupings, and (B) Day plot showing single-domain (SD), vortex-state (VS) and multi-domain (MD) states, where Bcr/Bc is coercivity of remanence relative to bulk coercivity and Mrs/Ms is the remanent magnetic saturation relative to magnetic saturation. In both plots, circles indicate AMS group A and squares indicate AMS group B, and the colors indicate the 4 AARM groupings.
Anisotropy of Magnetic Susceptibility
To visualize the AMS fabrics across the thickness of the crinanite sill a series of equal area diagrams are plotted, first presenting all of the measurements together to identify overall AMS patterns (Figure 5A). The combined measurements of all 147 specimens from the sill show an oblate AMS fabric, with the mean K1 axis showing a shallow inclination to the north east (Figure 5A). The overall mean K3 axis is almost vertical. Combining all data together allows for a general fabric to be observed, however, there is a lot of scatter evident across the individual specimens, as observed in the wide 95% confidence angles for each axes of ellipsoid, e.g., mean K1 orientation of 44.7°± 46.5° declination with an inclination of 6.9°± 21.5° (see Table 3).
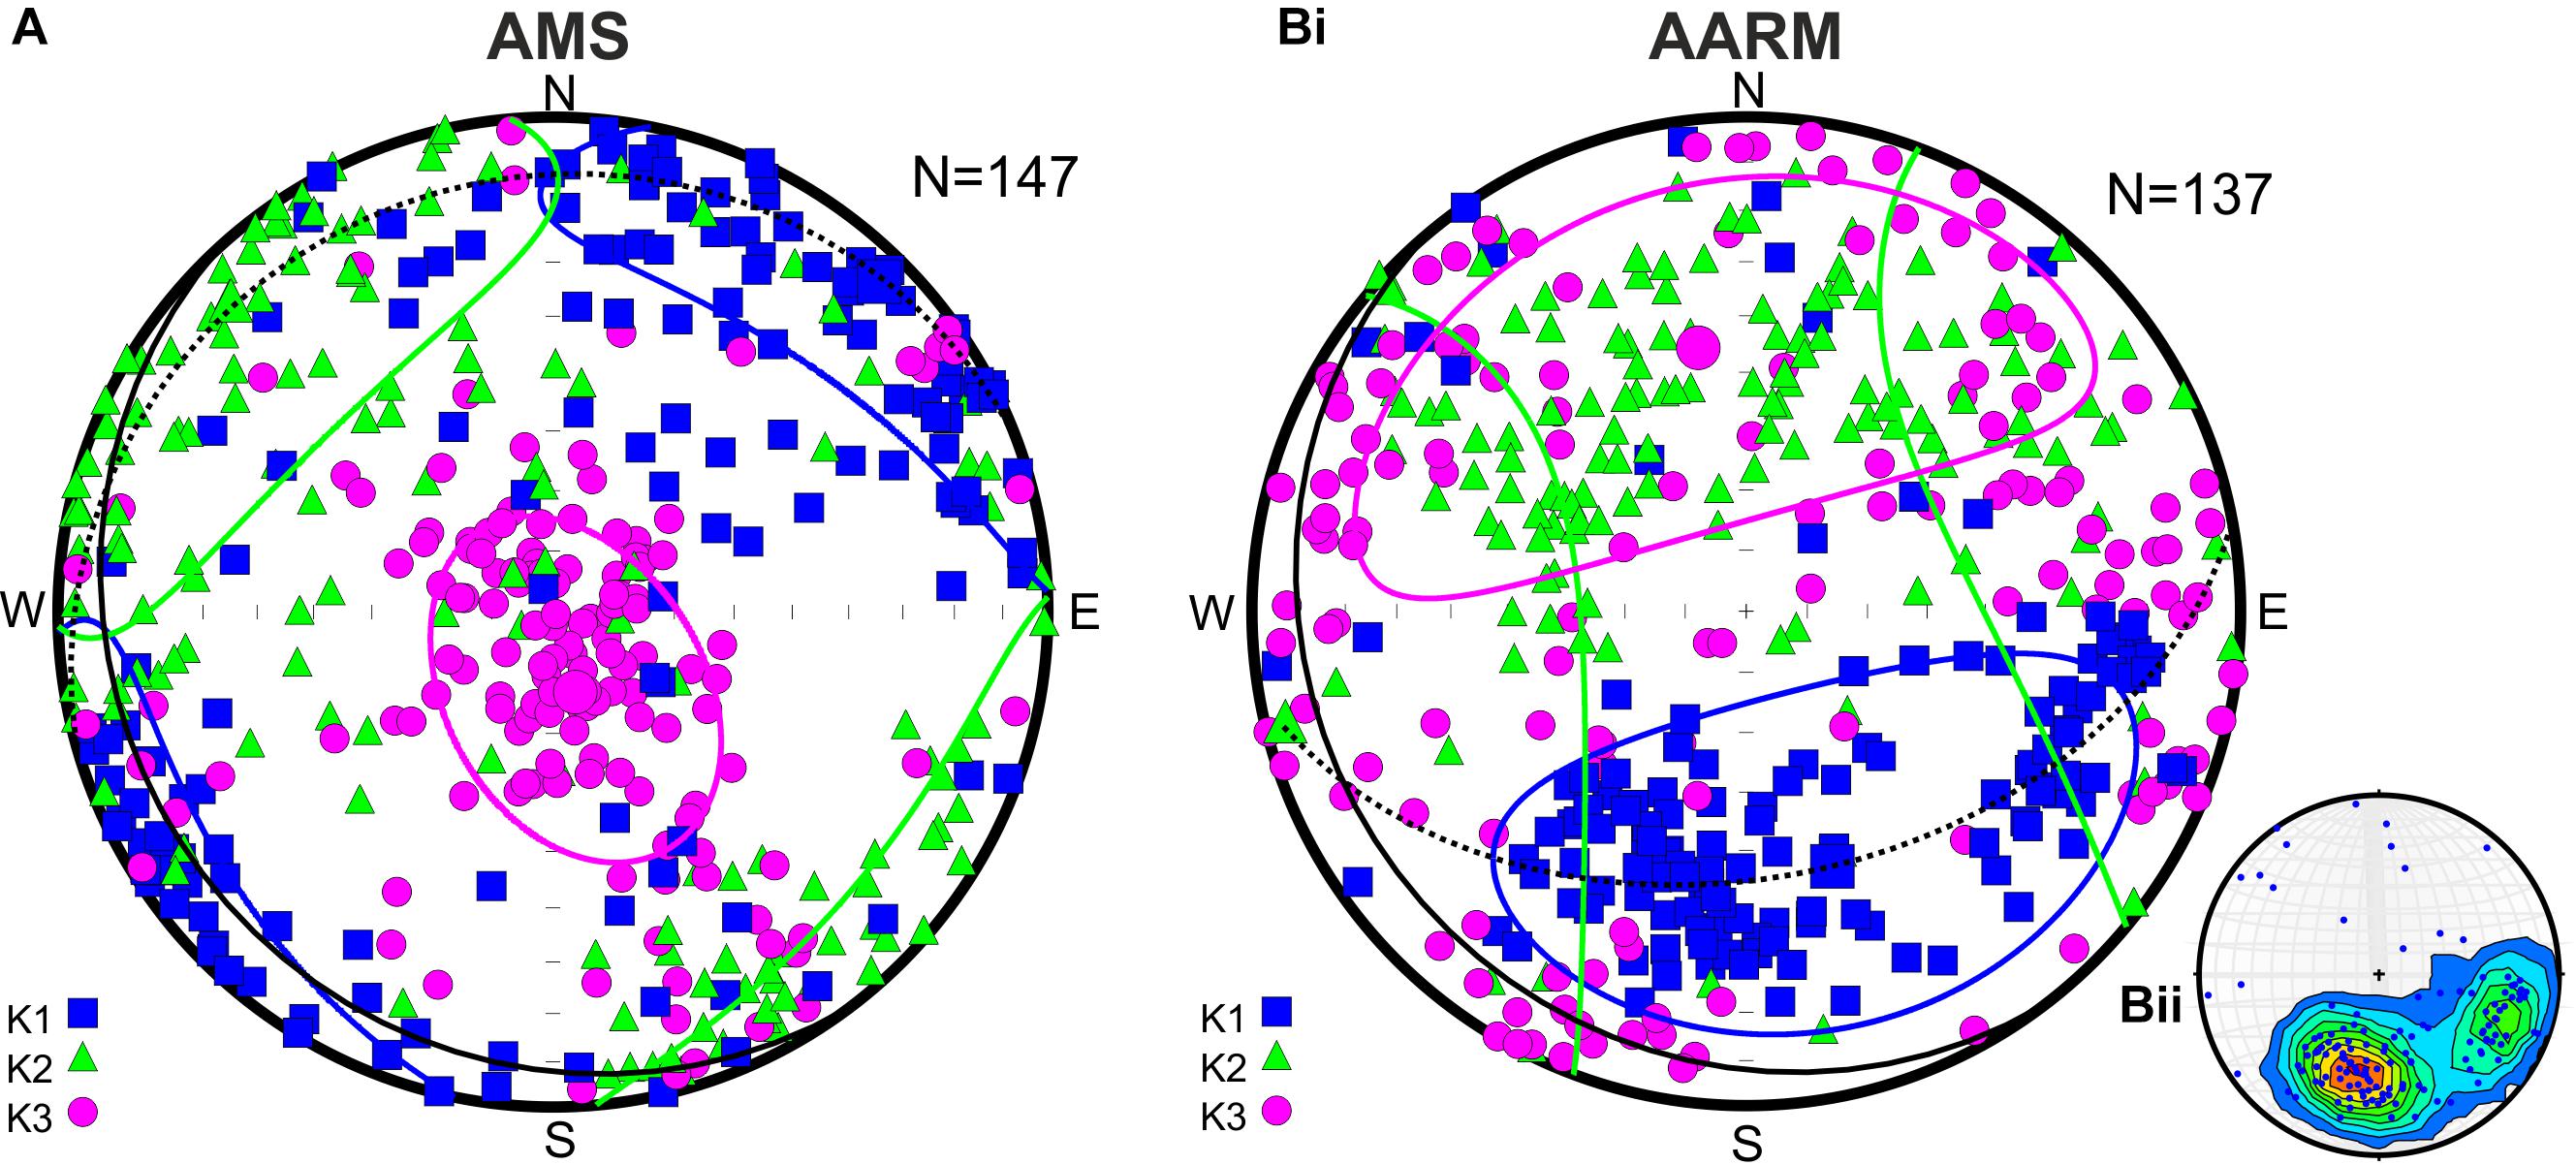
Figure 5. Equal area plots of data from all specimens for both (A) AMS data (N = 147) and (B) AARM data (N = 137) with (Bi) representing data for all axes and (Bii) showing a contour plot of K1 axes. K1 axes are blue squares, K2 axes are green triangles and K3 axes are purple circles. Solid lines are the 95% confidence ellipses calculated by Anisoft 4.2. Solid black line represents the sill plane and the dashed black line represents the magnetic foliation plane.
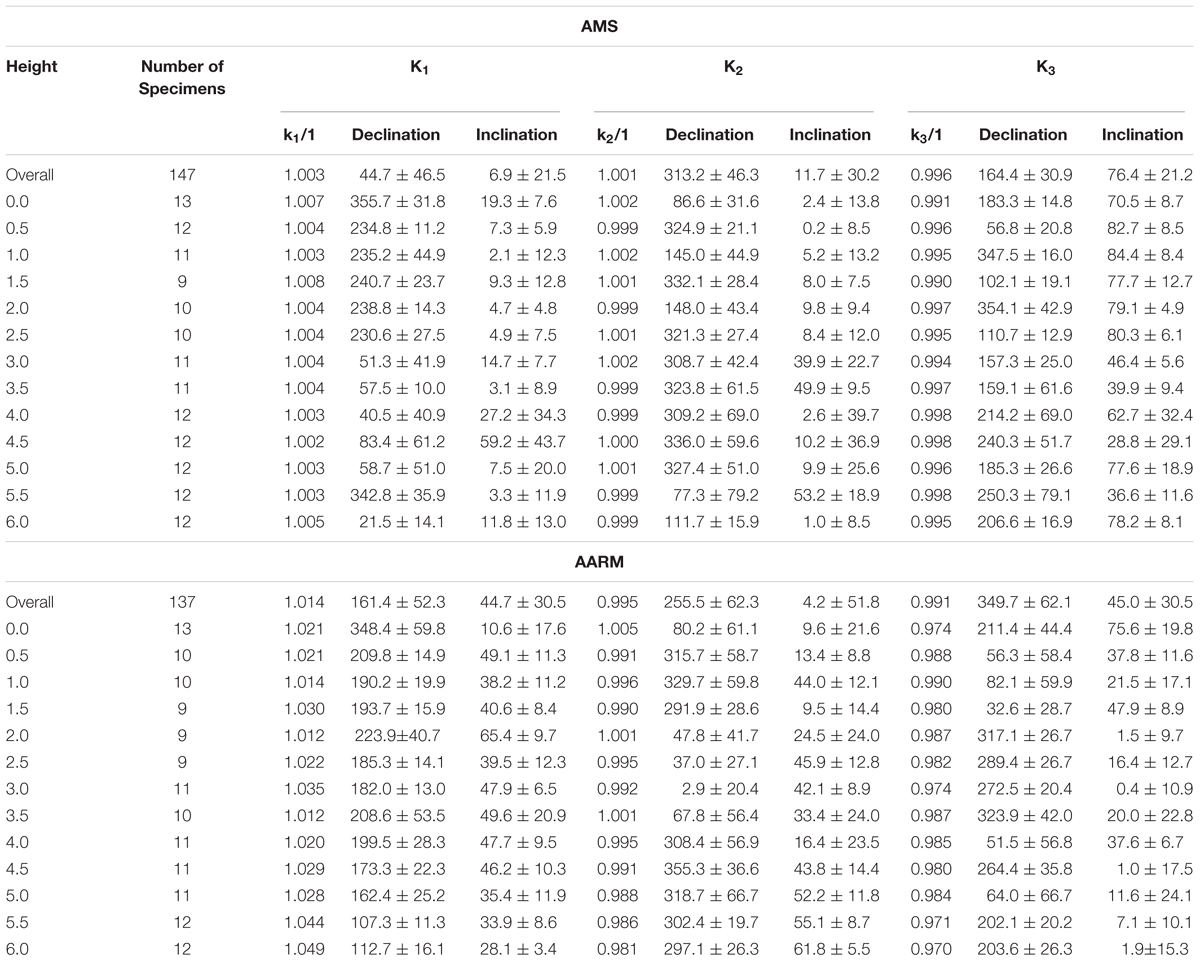
Table 3. Table showing the mean ellipsoid directions with 95% confidence angles for AMS and AARM ellipsoids.
Equal area diagrams displaying the data separated into their respective heights shows distinct variations in AMS fabrics across the crinanite sill thickness (Figure 6A). The mean orientation of the tensors varies with height, with the K1 axis in a broadly N-S orientation at the bottom contact, rotating to a NE-SW orientation between 0.5 and 5.0 m in height, and rotating back to a N-S orientation at 5.5–6.0 m heights (Figure 6A). The mean K3 short axis is close to perpendicular to the sill plane, except between 3.0 and 4.5 m where they are inclined to either the south-east or south-west. At the 4.0–4.5 m heights, there is a large amount of scatter in the data, resulting in ellipsoids with wide ranging 95% confidence angles, e.g., at 4.0 m the K1 axis has a declination of 40.5° ± 40.9° and an inclination of 27.2° ± 34.3° (see Table 3). A small increase in Km from 9.43 × 10⁻³ to 1.5 × 10⁻² is observed from 0 to 1.0 m, after which Km becomes more constant with a peak in mean susceptibility of 1.77 × 10⁻² occurring at 3.5 m height (Figure 7Ai). Both magnetic lineation and magnetic foliation are characterized by mean variations in axis length of <1 and <1.25% respectively (Figures 7Aii,iii). The AMS foliations are consistently near-parallel to the sill plane. However, at the lower margin the AMS foliation dips slightly toward the north (similarly to the K1 axis). We interpret this dip to be the result of an imbrication process that has developed during magma flow. This imbrication toward the south therefore reflect the flow direction being to the south at the time of solidification. Its location at the sill margin suggests this was the initial propagation direction of the growing sill. The other location where the AMS foliations are not aligned with the sill plane are between 3.0 and 4.5 heights, where the ellipsoids have rotated around either the K1 (3–3.5 m) or K2 (4–4.5 m) axes, by approximately 50° and 60° respectively. Low degrees of anisotropy (mean Pj values less than 2%) indicate that the ellipsoid shapes are close to spherical (Figure 7Aiv) suggesting a near uniform orientation of the larger MD magnetic minerals. The shape of the ellipsoid tensors (shown mostly by variations in the mean shape, see Figure 7Av) varies across the sill thickness in an irregular and oscillatory manner.
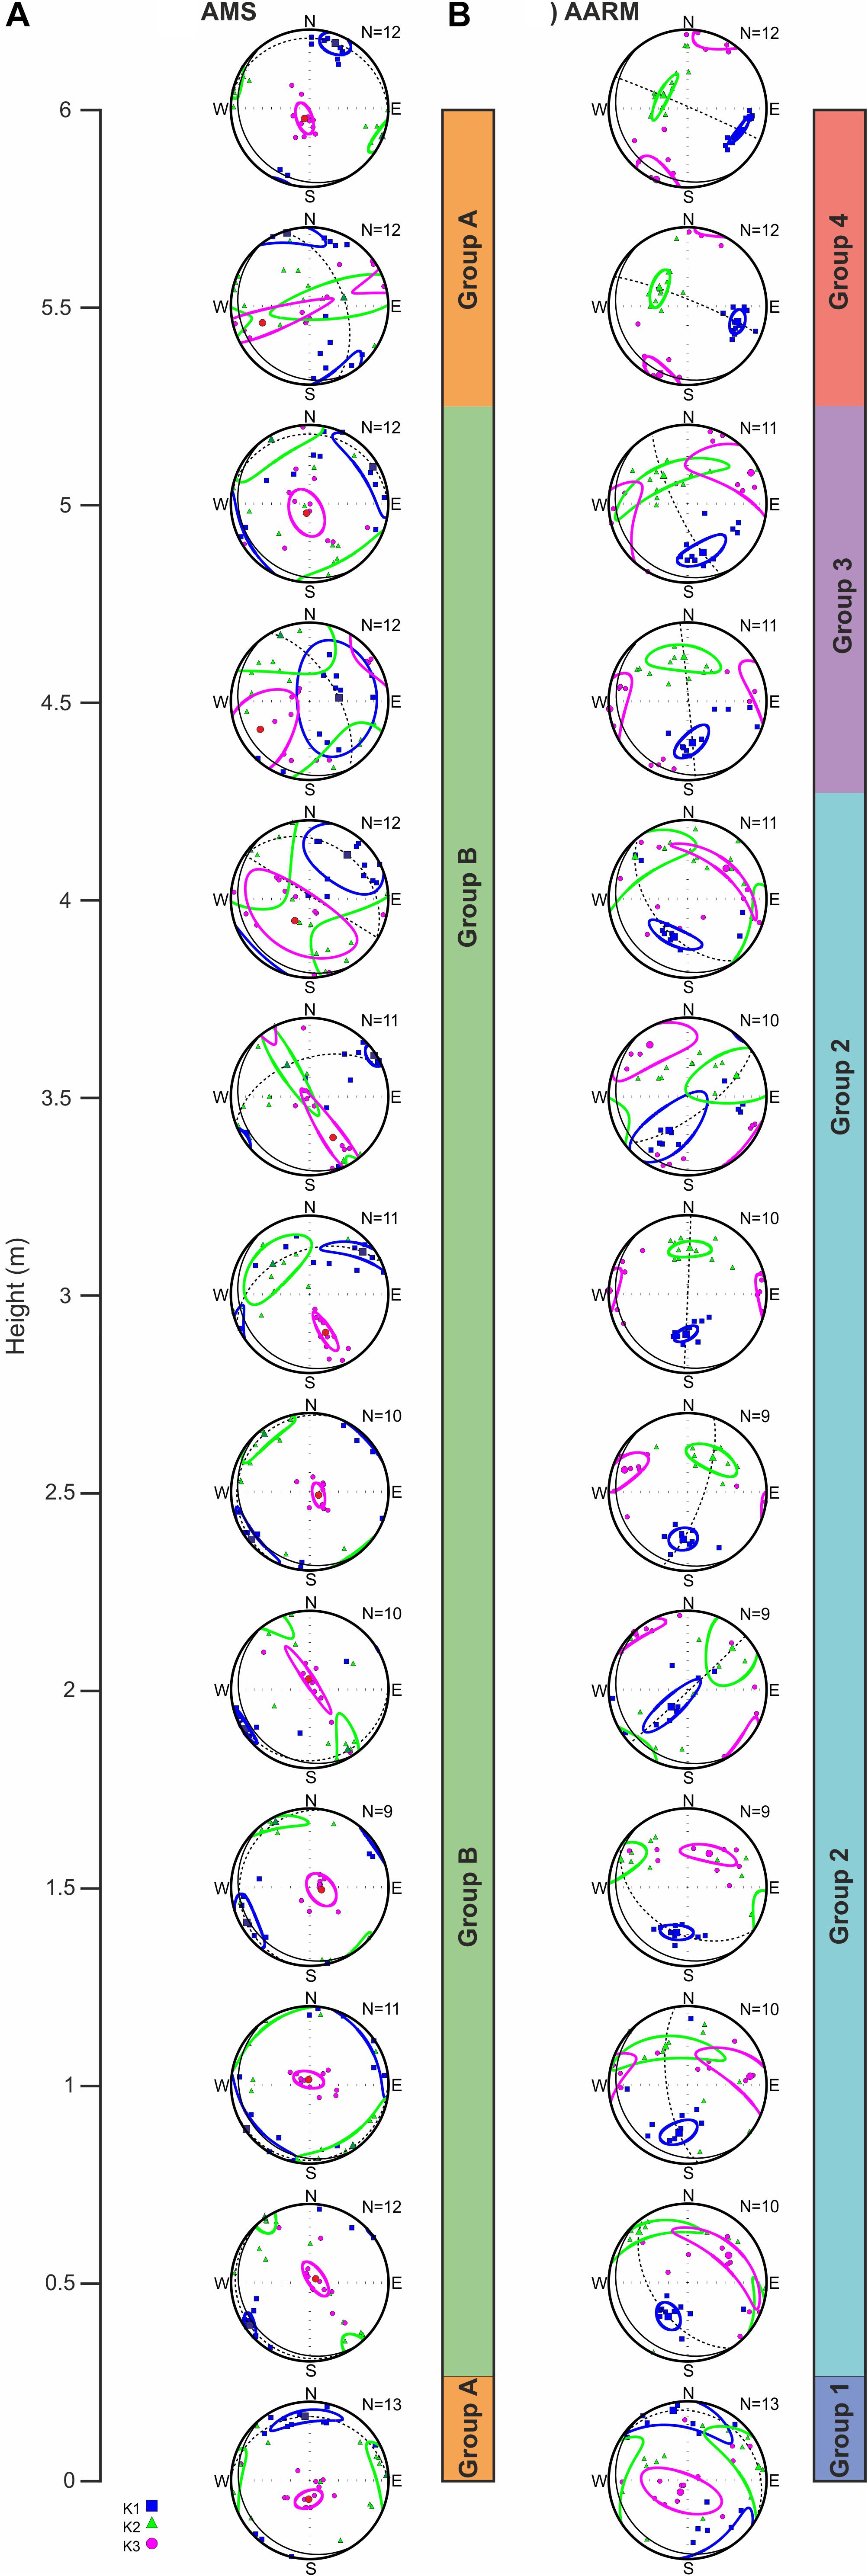
Figure 6. Equal area plots showing (A) AMS measurements and the location of two AMS groups and (B) AARM measurements and the location of four AARM groups at different heights across the crinanite sill thickness. The number of specimens (N) used for each technique at each height is shown in the upper right of each plot. For all plots the K1 axes are blue squares, K2 axes are green triangles and K3 axes are purple circles, and the colored solid lines are their respective 95% confidence ellipses. The solid black line represents the sill plane and the dashed black line represents the magnetic foliation plane.
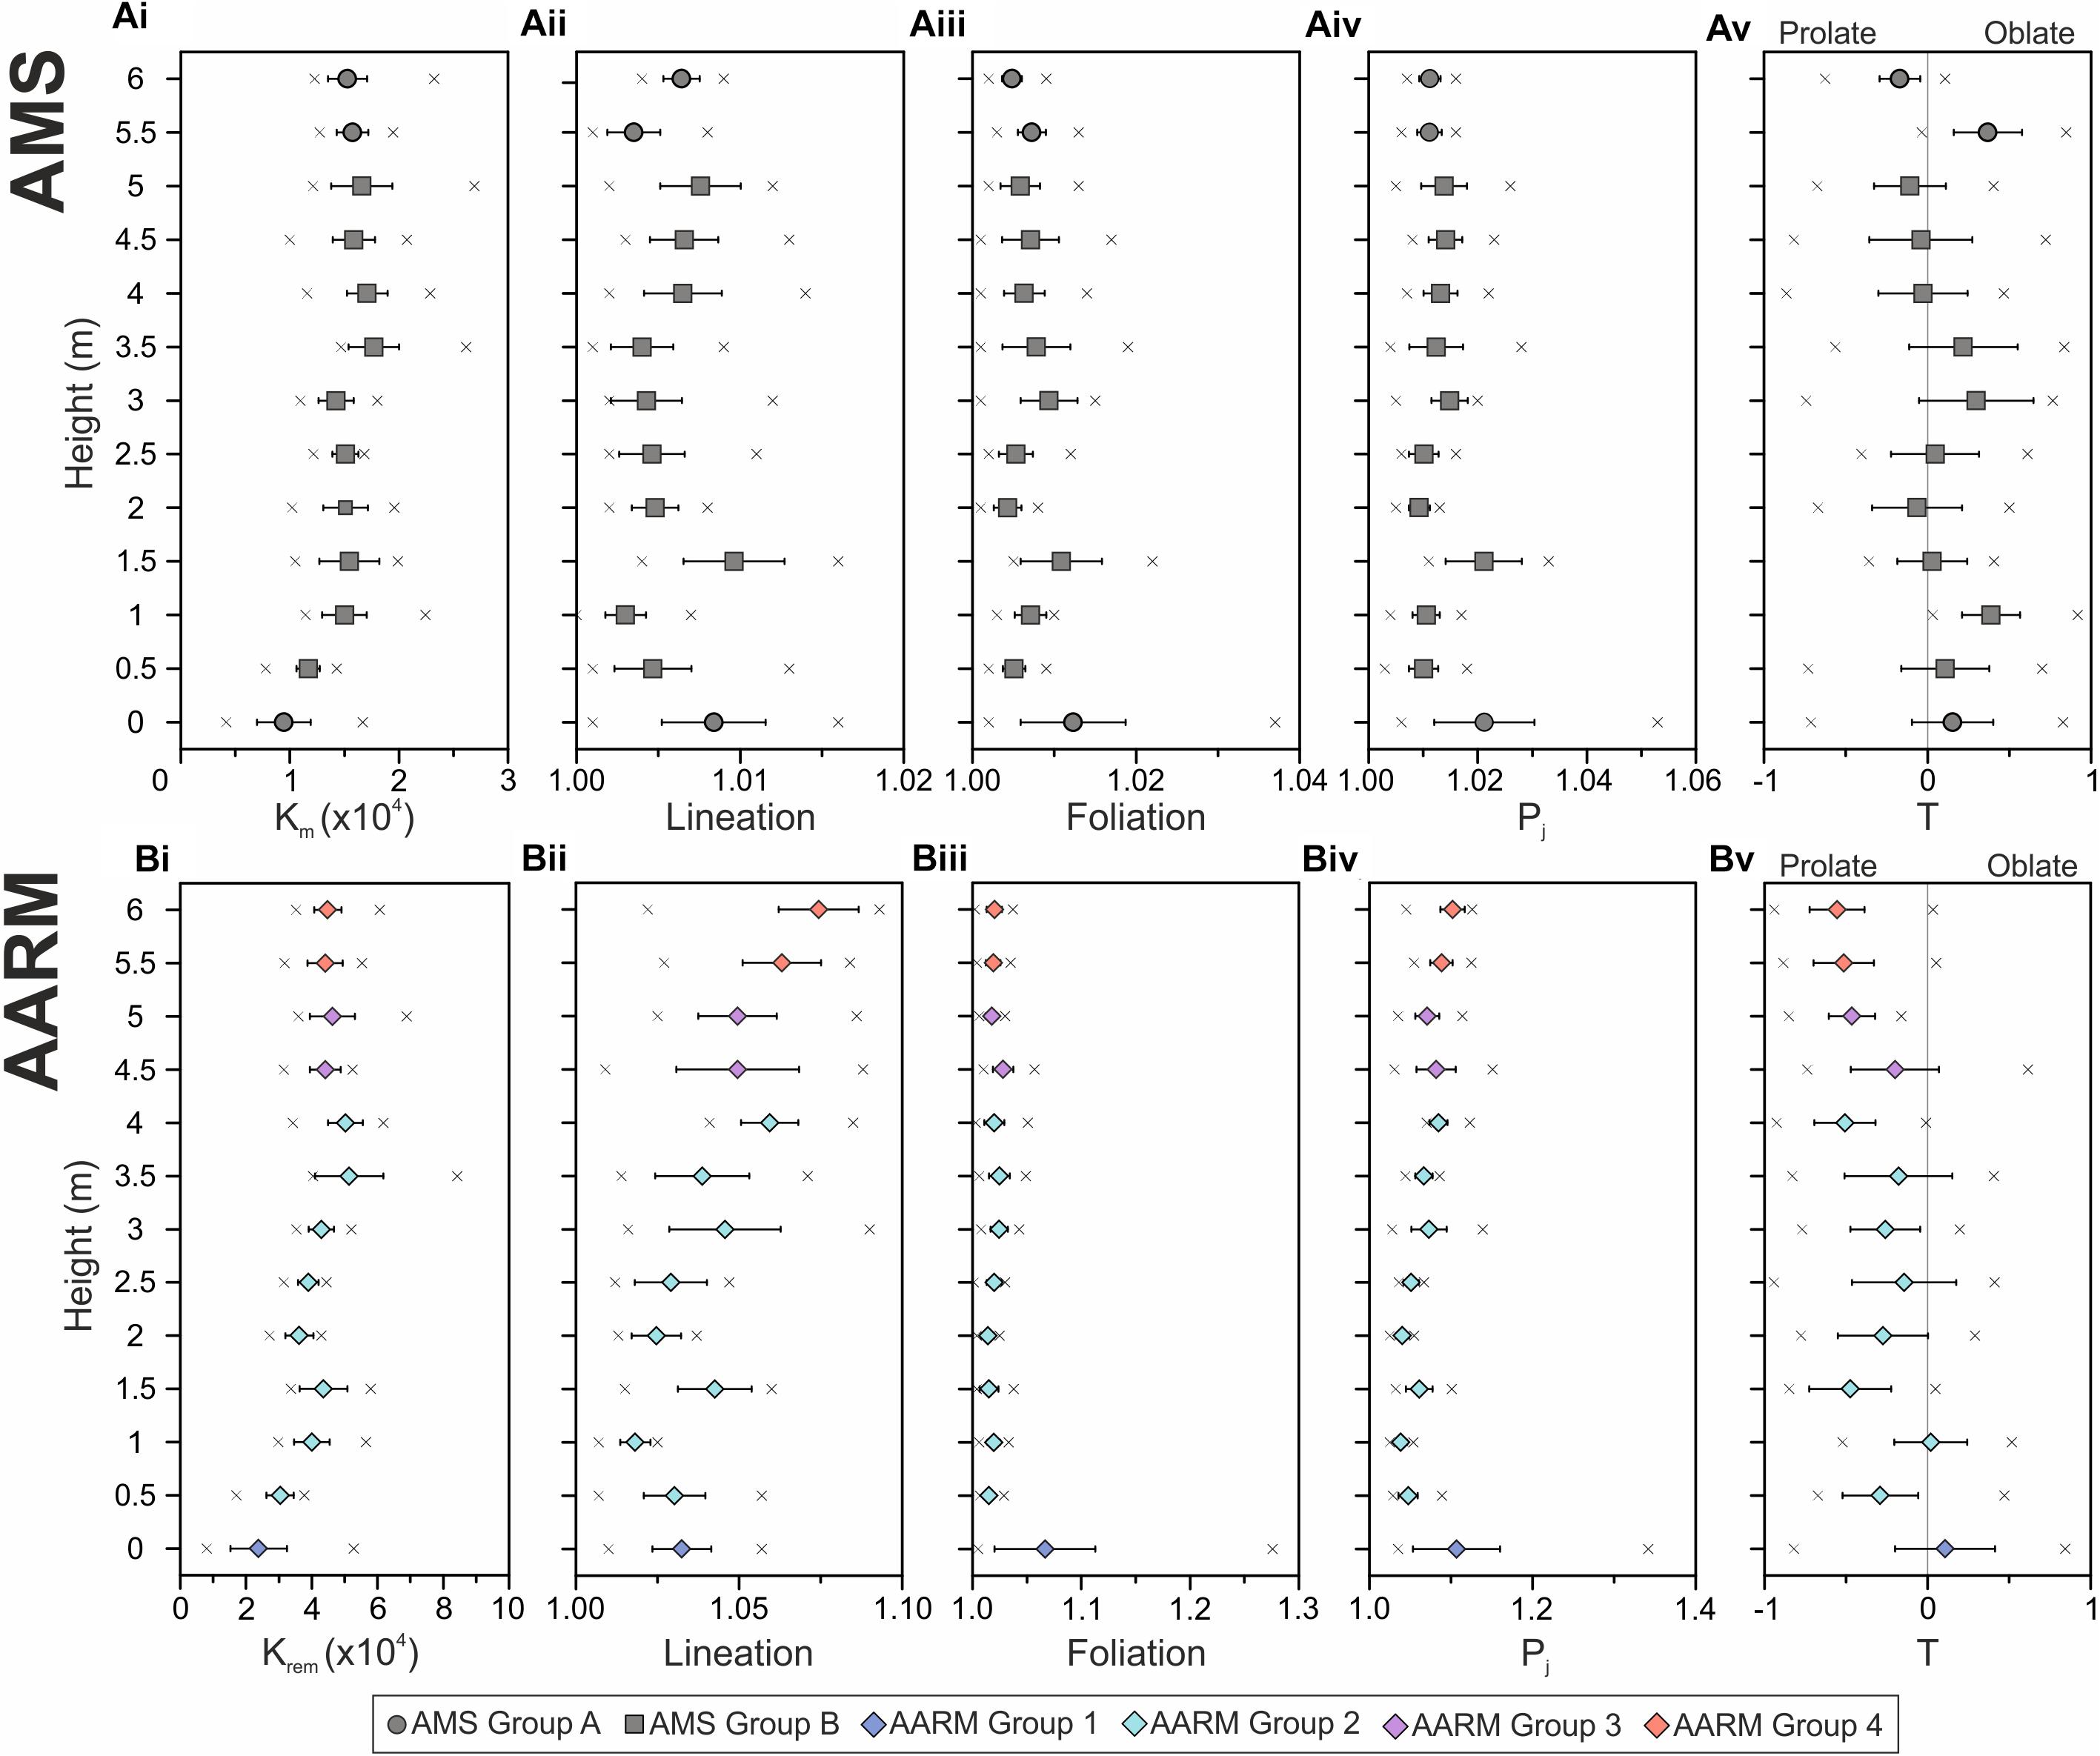
Figure 7. Graphs showing (A) AMS and (B) AARM measurements at specific heights across the crinanite sill thickness: (i) mean susceptibility Km, (ii) lineation, (iii) foliation, (iv) degree of anisotropy Pj, and (v) shape parameter T. In all plots the symbol position (square, circle, or diamond) shows the mean measurement, the horizontal error bars show the 95% confidence intervals, and the crosses show the minimum and maximum values.
Collectively the results suggest the AMS fabrics can be separated into two groups based only on the orientation of the ellipsoids. The other parameters (L, F, Pj, T) show oscillatory trends throughout the sill thickness and as such cross the identified group boundaries. Group A fabrics (orange vertical bars in Figure 6A) are characterized by the mean K1 axes that are trending in a N-S orientation with the mean K3 axes perpendicular to the sill plane. It occurs at the lower sill margin (0 m) where it contacts the underlying picrite sill and the upper sill margin (5.5–6 m) where the sill is in contact with the overlying country rock. The thickness of the Group A fabrics is asymmetric, being <0.5 m thick at the lower contact (only evident in the 0 m height sample) and <1.5 m thick at the upper contact (evident in the 5.5 and 6 m height samples). Group B fabrics (green vertical bar in Figure 6A) are characterized by the mean K1 axis trending in a NE-SW orientation, with the mean K3 axis still vertical but with variations of inclinations toward the SE and SW (e.g., at 3.5 and 4.0 m respectively). It occurs across the whole of the sill interior (0.5 – 5 m).
Anisotropy of Anhysteretic Remanent Magnetization (AARM)
Similarly to the AMS data, to visualize the AARM fabrics across the thickness of the sill we have plotted a series of equal area diagrams, first grouping all the measurements to show overall patterns, and then plotting separate diagrams at individual heights through the sill to compare the AARM magnetic fabrics across the sill thickness. The overall orientation of all the AARM specimens show a mean K1 axis dipping toward the south (blue squares, Figure 5Bi). However, within these data there are two distinct populations of ellipsoid long axes: the first and larger cluster is dipping toward S-SSW, and the second smaller population has a shallower dip toward the ESE (see contour plot of K1 axes, Figure 5Bii). The large amount of scatter associated with the K2 and K3 ellipsoids has given rise to wide ranging 95% confidence angles for which most of the populations for these do not reside, e.g., K2 mean direction of 255.5° ± 62.3° declination and 4.2° ± 51.8° inclination (Table 3).
Similar to the AMS fabric analysis, when the AARM data are separated into their respective heights a wider range of fabric groups and trends are observed. Overall, we have identified four AARM fabric groups. AARM Group 1 is located at the lower margin (0 m), with a mean K1 axis that shallowly dips 10.6° toward the north (Figure 6B and Table 3). The confidence angles are almost horizontal with K1 and K2 overlapping. The mean K3 axis is almost vertical, 75.6° inclination with an overall oblate fabric. Group 2 is the thickest group, occurring between heights of 0.5–4.0 m and is characterized by the mean K1 axes becoming more inclined toward the N-NE (dipping toward the S-SW) and better-constrained confidence angles (see Table 3). In contrast to AARM fabric Group 1, the ellipsoid shapes have become tri-axial to prolate with means of 0.1 to -0.5 (Figure 7Bv). AARM fabric Group 3 is found at the 4.5–5.0 m heights, where the mean ellipsoid long axes begin to rotate around the vertical toward the south-east (Figure 6B). Finally, AARM fabric Group 4 is associated with the upper margin region (5.5–6.0 m), where the mean ellipsoid K1 axes shallowly dips to the ESE (Figure 8B), the mean K3 fabric is horizontal and oriented in a NNE-SSW direction.
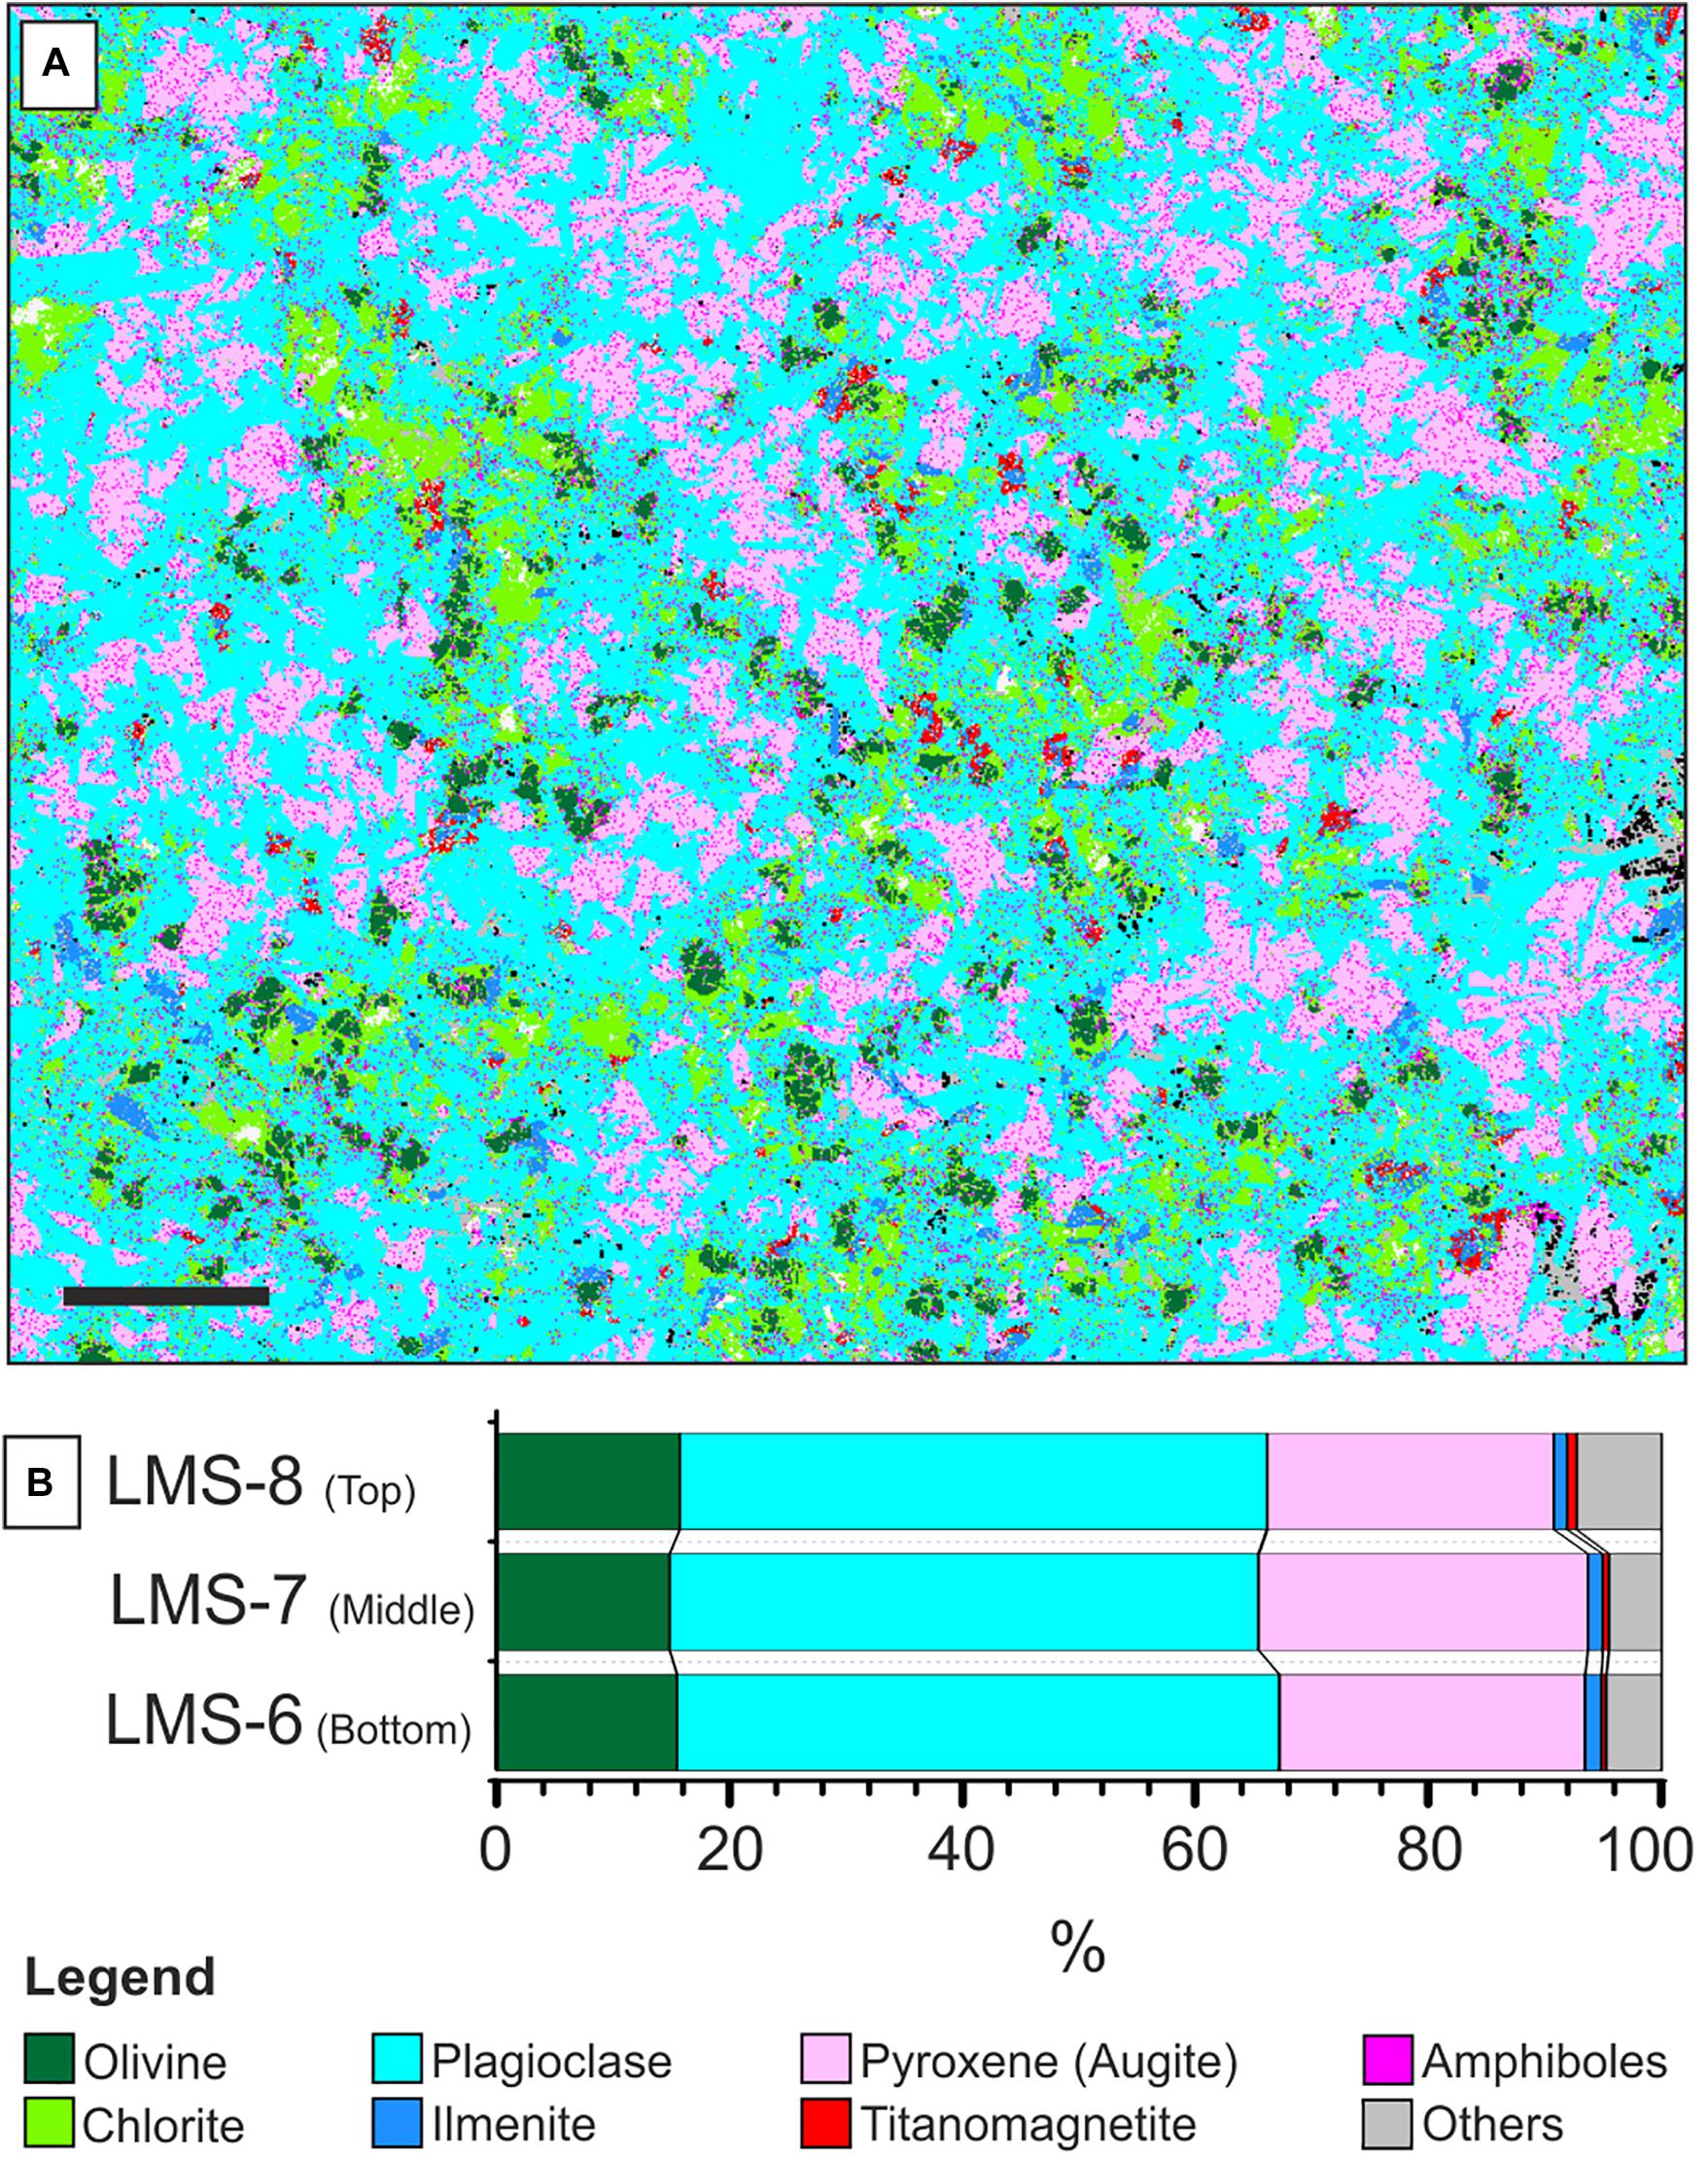
Figure 8. (A) QEMSCAN image of thin section LMS-6 collected from the bottom of the crinanite. Black scale bar in the bottom left corner of is 2 mm in length. (B) The modal abundances of mineral phases in samples collected from close to the Top (LMS-8), Middle (LMS-7), and Bottom (LMS-6) of the sill, estimated by QEMSCAN (see Table 2). Note that in (B) green represents the sum of olivine and chlorite, as chlorite is interpreted to be altered olivine, and pink represents the sum of pyroxene and amphibole, as amphibole is interpreted to be altered pyroxene.
Across the thickness of the sill some gradual changes in the properties of the AARM fabrics were observed. The mean remanence gradually increases from 2.3 × 10⁴ to 5.1 × 10⁴ with increased height from 0 to 3.5 m where it remains constant to the upper margin (Figure 7Bi). The degree of lineation also increases through the sill (Figure 7Bii). The foliation at the lower margin is considerably larger than the rest of the sill, up to 1.28 compared with <1.1 (Figure 7Biii). The orientation of the AARM foliations varies considerably across the breadth of the sill. At the lower margin it dips shallowly toward the north and elsewhere it is more steeply dipping (>40°) and in a range of directions. It should be noted that the AARM fabrics are dominated by prolate ellipsoids (overall mean T of -0.26), which suggest that the magnetic lineation is more important than magnetic foliation. Like the foliation, the degree of anisotropy shows an overall increasing trend with increasing distance from the lower contact. An exception to this occurs at the lower contact where Pj is significantly larger (Figure 7Biv). The ellipsoid shapes (T parameter) also become more prolate with increased height through the sill, with means of -0.51 and -0.56 at 5.5 m and 6 m, respectively (Figure 7Bv) which is similar to lineation (Figure 7Bii).
Composition and Petrographic Fabrics
The overall mineralogy of the crinanite sill consists of plagioclase (50%), olivine (3%), chlorite (12–13%), augite (15–19%), other pyroxenes (∼1%), amphiboles (6–8%) and oxide minerals (∼2%). The variations observed occur at different heights across the sill (Figure 8B). Post-solidification alteration caused chlorite to form from olivine and amphiboles to form from pyroxene. The original mineralogy and their proportions were therefore: olivine (15% bottom, 15% middle and 16% top), pyroxene (26% bottom, 28% middle, and 24% top) plagioclase (50 ± 1%) and oxide minerals (∼2%) (Figure 8B). These proportions of olivine indicate that the sill lithology straddles the boundary between crinanite and picrodolerite compositions based on the classification of Gibb and Henderson (1984). However, in this paper we will refer to it as crinanite for ease of comparison with other studies in the area (e.g., Gibson and Jones, 1991; Nicoli et al., 2018).
Mineral textures across the crinanite sill reveal structures that enable the crystallization sequence to be determined. The plagioclase is euhedral to subhedral and appears as two populations: the first group is present as stellate clusters (individual crystals to up 4 mm, e.g., Figure 9A) and the second group comprises small individual crystals (average 0.5 mm diameter). Olivine also occurs as two populations, both of which have been partially altered to chlorite; the first as rare euhedral phenocrysts (up to 2.5 mm, Figure 9B) and the second as subhedral to anhedral crystals (average of 1 mm diameter). The oxide phases (titanomagnetites and ilmenites) have grown both as isolated microcrystals and 0.1–1.3 mm crystal clusters, with the latter comprising ilmenite cores surrounded by titanomagnetite with exsolution laminae of ilmenite (Figure 9C). Up to 5 mm sized anhedral pyroxene (augite) oikocrysts ophitically enclose all other mineral phases.
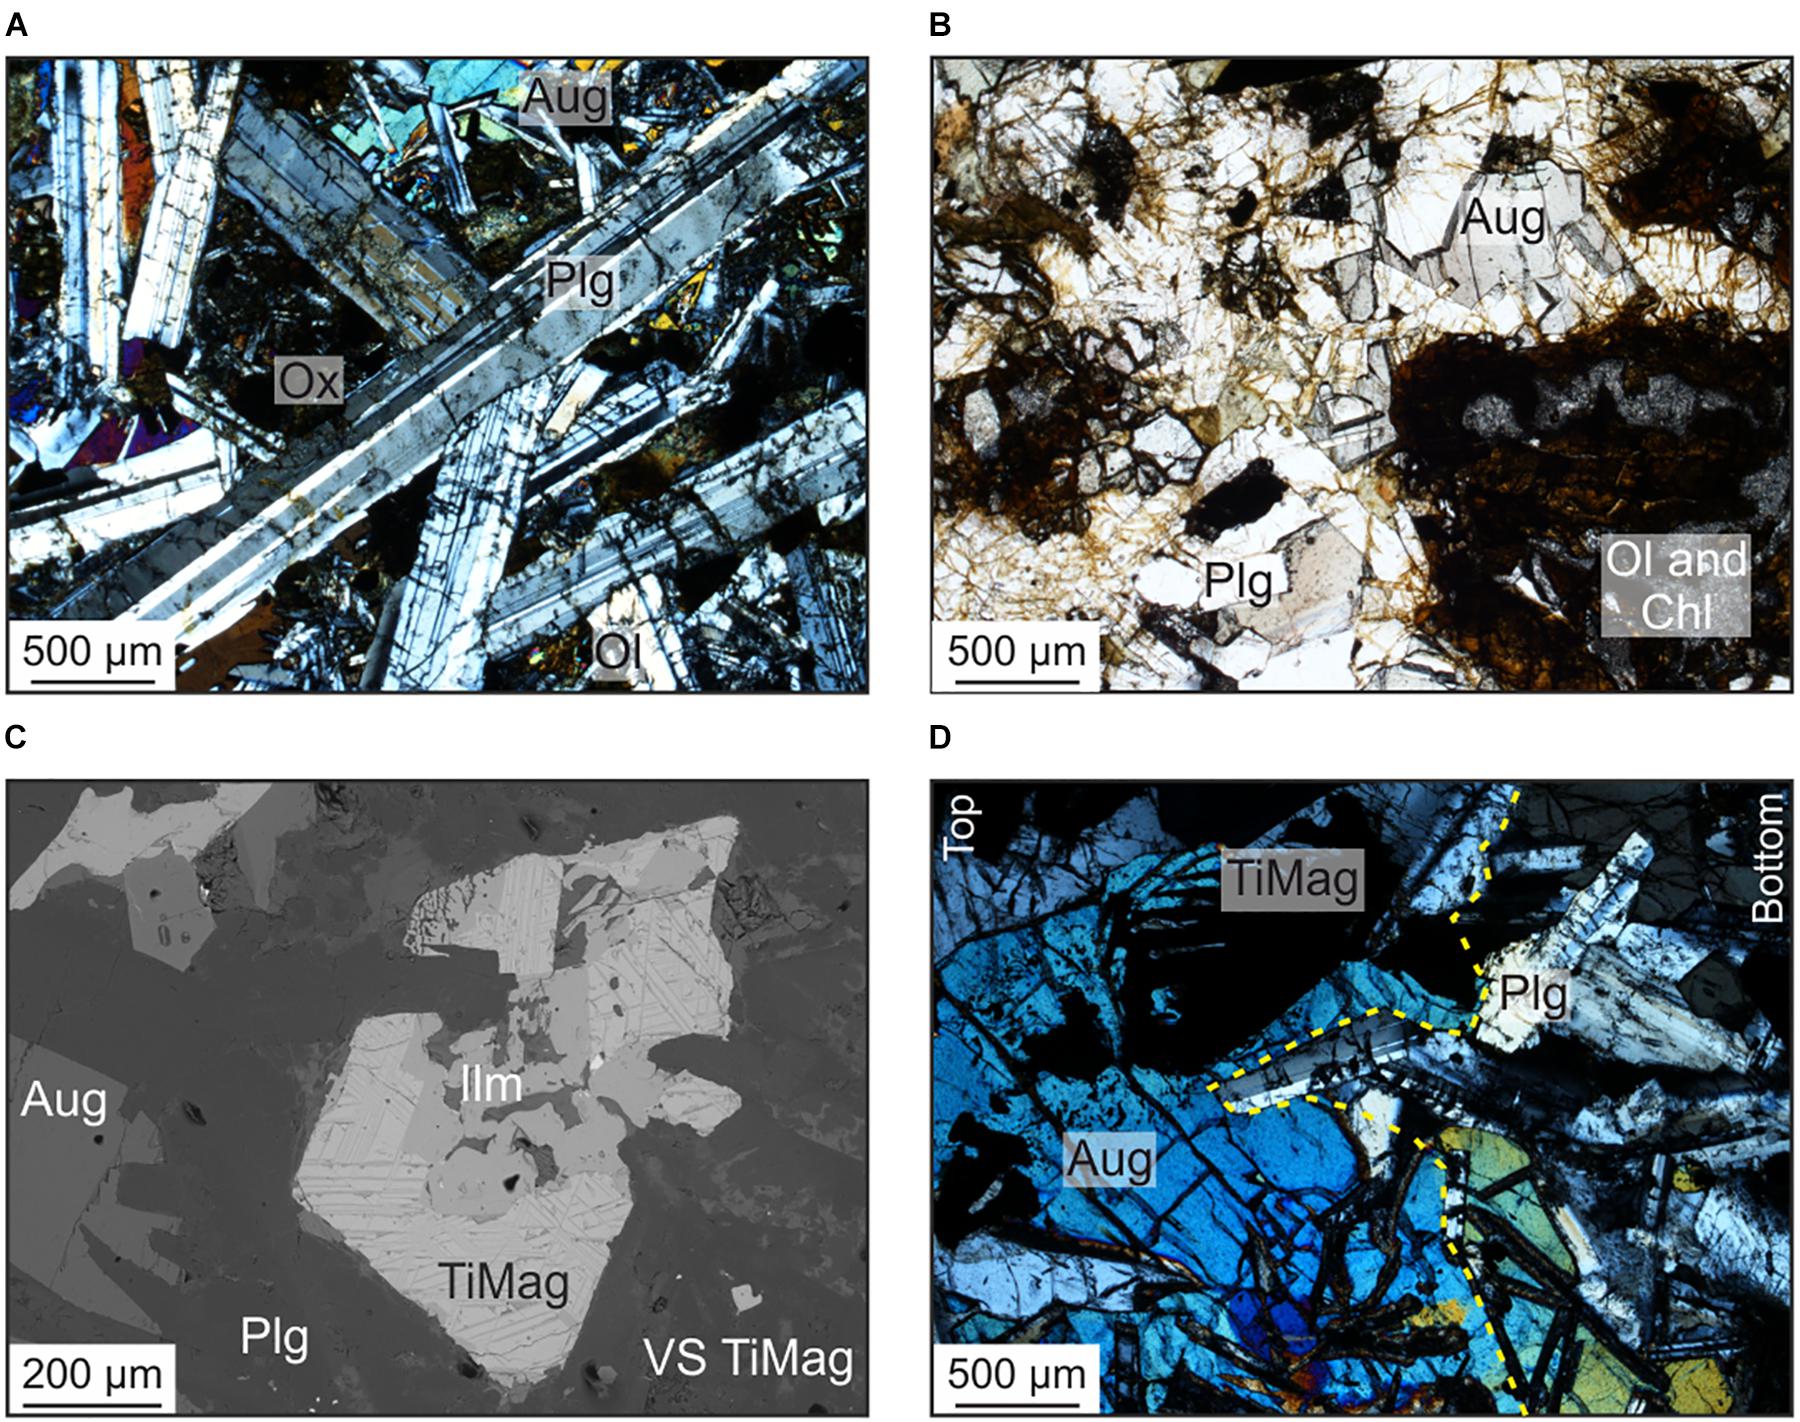
Figure 9. Photomicrographs from optical microscopy viewed with crossed polarized light (A,B,D) and a backscattered electron SEM image (C). (A) A stellate plagioclase (Plg) crystal from near the top of the sill (sample LMS-19-6 m), with ophitic augite (Aug) and unclassified oxides (Ox). (B) An olivine phenocryst (Ol) partly altered to chlorite (Chl) from the lower margin of the sill (sample LMS-6). (C) An ilmenite grain (Ilm) surrounded by titanomagnetite (TiMag) with exsolution lamellae, sampled from near the base of the sill (sample LMS-6). In the lower right corner, a small VS-SD sized crystal of interstitial TiMag can be seen which has crystallized from the interstitial melt. (D) Boundary of the crinanite with a gabbro lens indicated by yellow dashed line, with the left part of the image showing the gabbro lens (top) and the crinanite in the right part of the image (bottom). The sample is located near to the base of the crinanite sill (sample LMS-5b).
The gabbro lenses within the crinanite sill consisted of similar constituents to the surrounding crinanite, except for a distinct lack of olivine, and have an irregular interface with the crinanite. The plagioclases and pyroxenes here were up to 8 mm in size (Figure 9D). Titanomagnetites and ilmenites were also present and were up to 3 mm in size.
Discussion
We now discuss our results to explore the origin and evolution of magnetic fabrics in sills. Bringing together our detailed magnetic analysis, we then use basic petrology and apply thermal modeling and constraints from the literature to synthesize an emplacement and solidification model for the crinanite sill we studied. We propose that this model can be applied to mafic sills more generally.
Unraveling the Magnetic Anisotropy
Previous studies of magma flow in intrusions have found key indicators of recorded flow to manifest as AMS and AARM signals, with small confidence angles, and the alignment of phenocrysts, which can be associated with shear that aligns magnetic minerals and tabular crystals parallel to, or slightly imbricated to, the direction of flow (e.g., Knight and Walker, 1988; Chadima et al., 2009). In the Inver Tote sill, we identified two groups of AMS fabrics and four AARM groups (Figure 10A): AMS Group A at the sill’s upper and lower contacts with the host rock, AMS Group B in the central region of the sill, and AARM Group 1 at the lower margin of the sill to Group 4 at the top margin. From these fabrics we can unravel the history of magma emplacement prior to and during solidification in different regions of the sill.
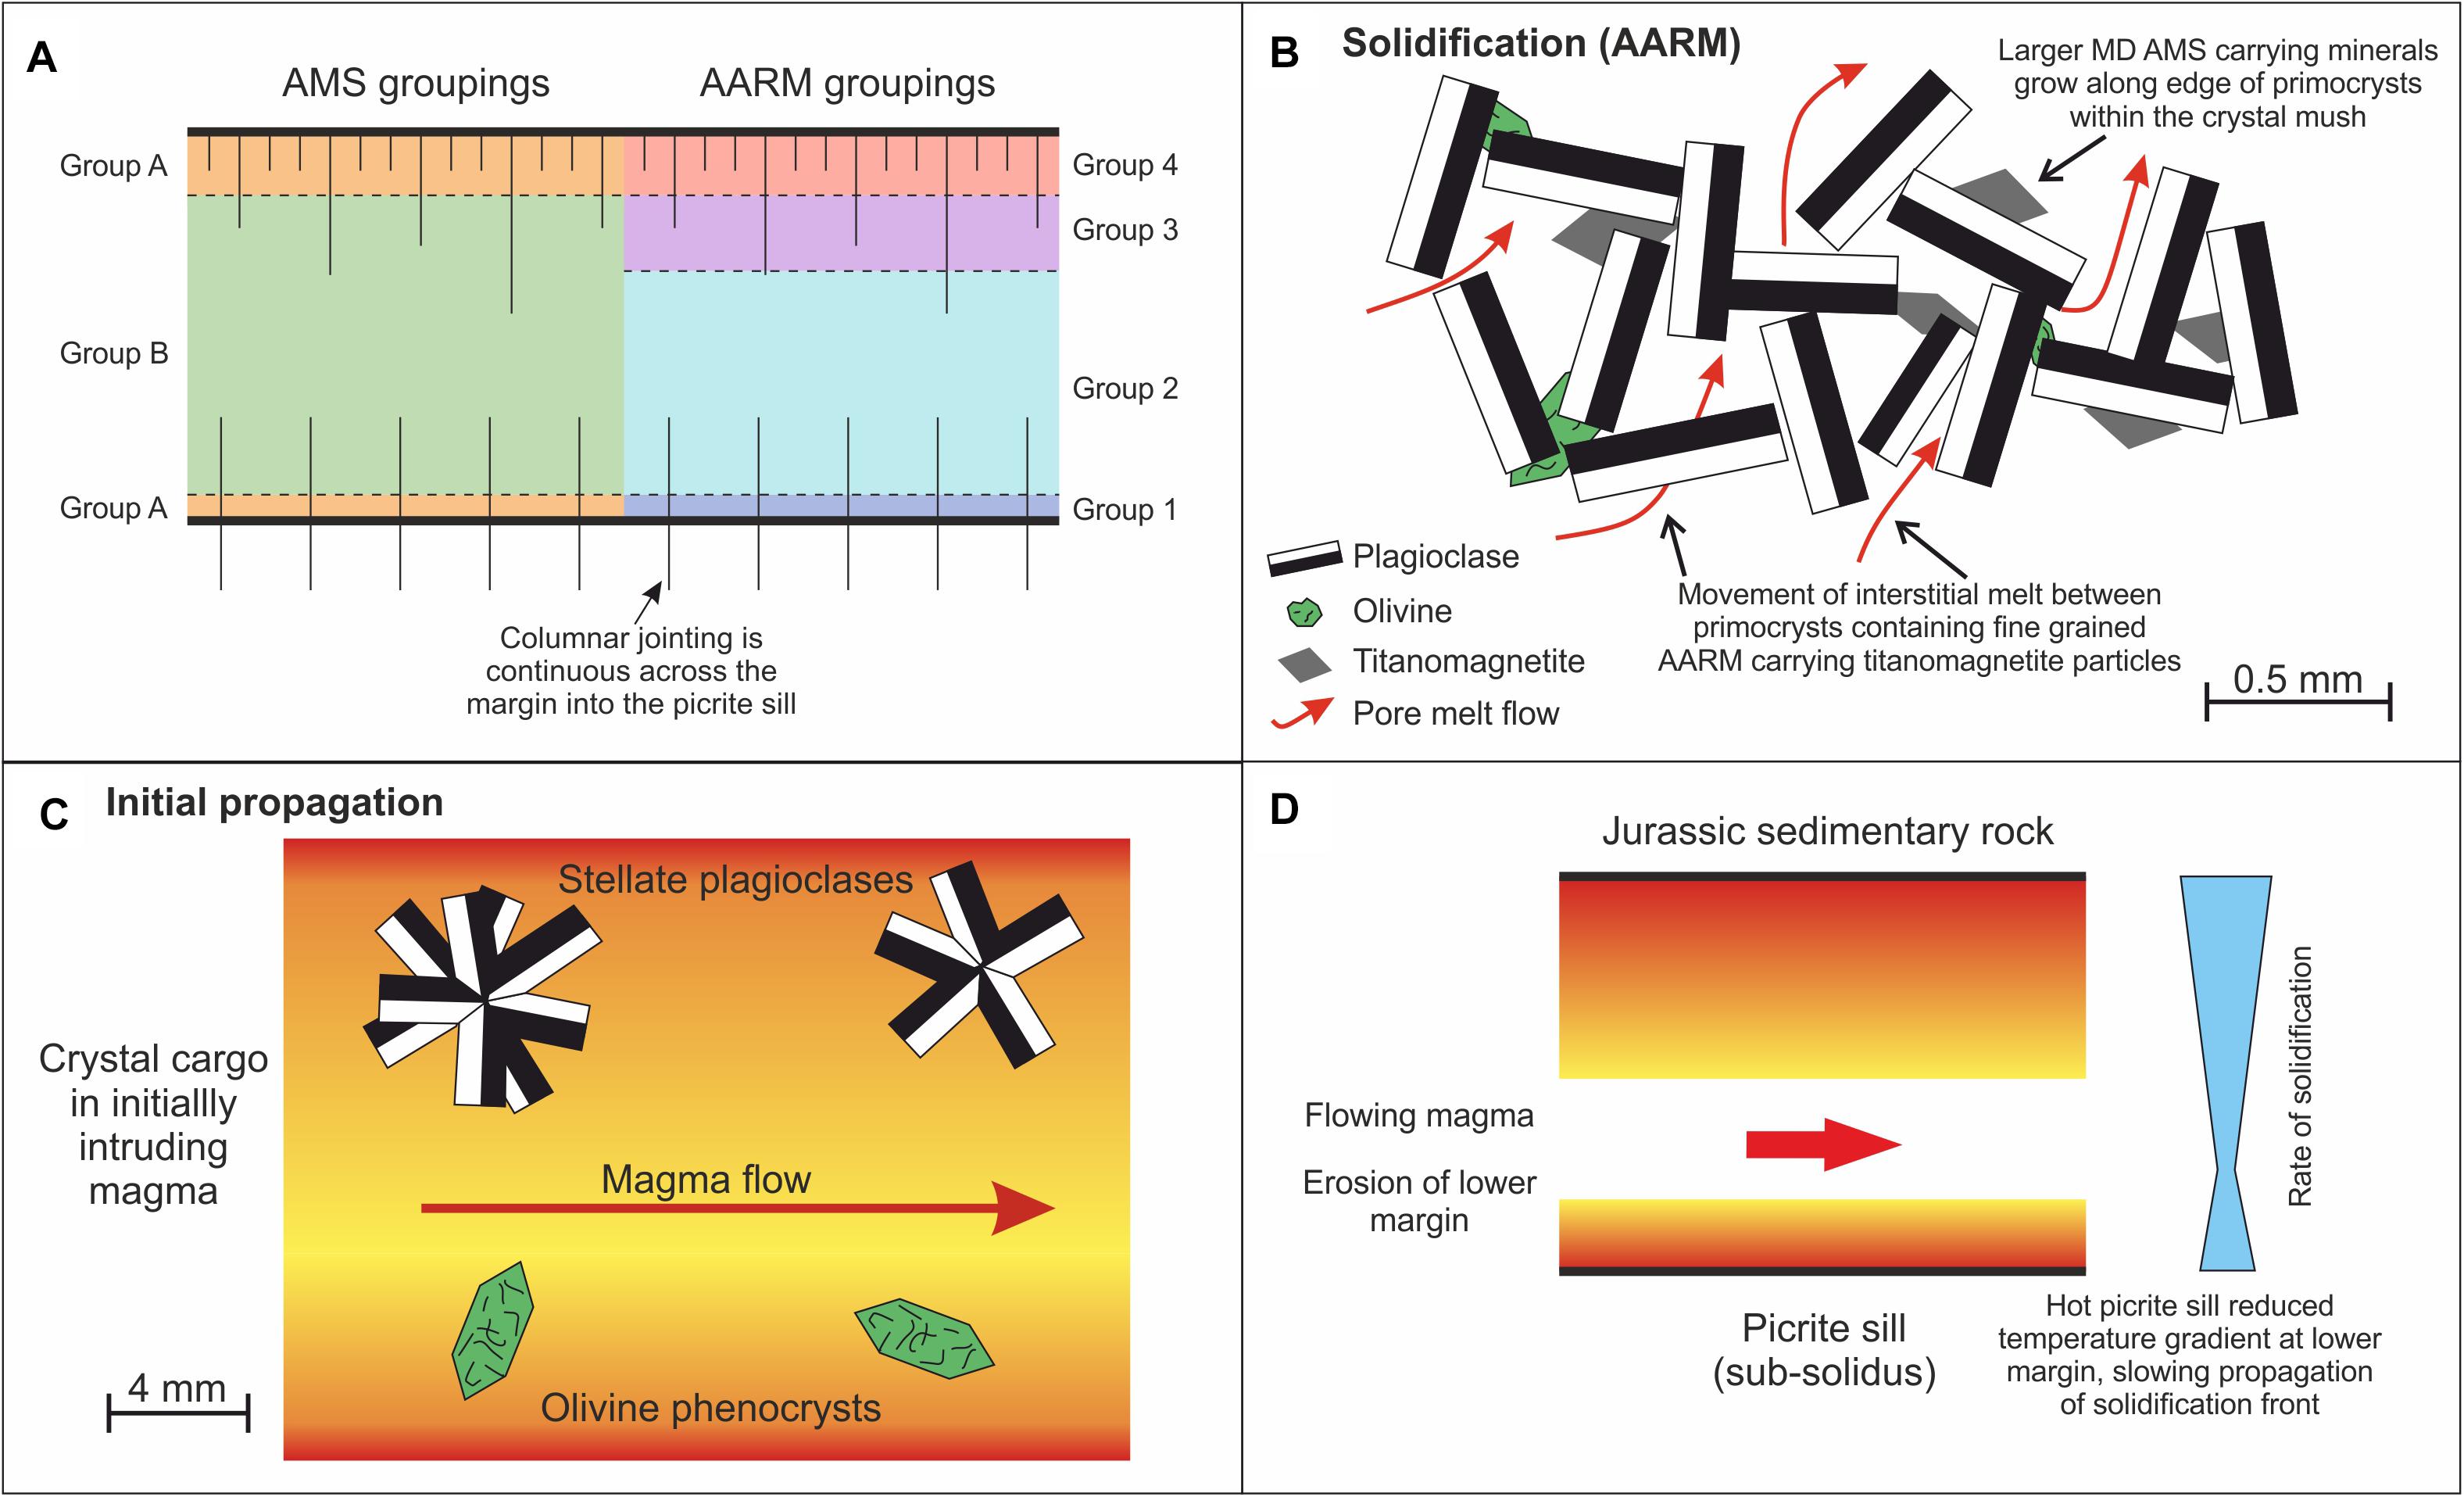
Figure 10. Emplacement model for solidification of the sill inferred from magnetic and petrological fabrics. (A) Solidified crinanite sill showing AMS (Group A and B) and AARM groupings (Group 1 to 4). Dashed lines signify the approximate heights of the groupings. Columnar jointing (vertical solid lines) is continuous across the lower margin into the underlying picrite. (B) Micro-scale diagram showing both the larger MD sized particles growing on the edges of primocrysts that produce the AMS fabrics and pore-melt flow of interstitial fluid around plagioclase and olivine primocrysts to produce AARM fabrics. (C) Stellate plagioclase crystals and euhedral olivine phenocrysts present within the initially intruding magma. (D) Schematic diagram showing magma being emplaced between Jurassic sedimentary country rocks above and picrite sill below. Propagating solidification front from upper and lower margins is asymmetric due to varying host rock temperatures.
The AMS fabrics predominantly originate from larger MD titanomagnetite crystals, with the orientation of these crystals providing the orientation of the magnetic susceptibility ellipsoids. These crystals are inferred to have grown along the edges of pre-existing phases (Figure 10B), some of which may have been oriented by flow of the magma under simple shear conditions (e.g., Correa-Gomes et al., 2001). In the margin regions, the location of AMS Group A fabrics (Figure 6A), the AMS foliations have their K1 axes orientated in a NNW to SSE orientation. We interpret the dip in foliation to be an imbrication which has formed due to magma flow. We therefore infer that the orientation of initial magma flow was to the south (Figure 11A). This is consistent with the orientation of the long axis of finger-like structures described by Schofield (2009). With increased distance from the margin regions, ellipsoid orientations and magnetic foliations rotate around the vertical to a SW-NE orientation, which we infer to indicate reorientation of the magma flow direction during emplacement (Figure 11B), as the solidification fronts restricted the flow. The reason for this change in flow direction is unclear, but it may reflect the orientation of a more regional flow in a SW to NE direction (e.g., Liss et al., 2002). Its occurrence is broadly supported by the direction of stretched vesicles in the sill.
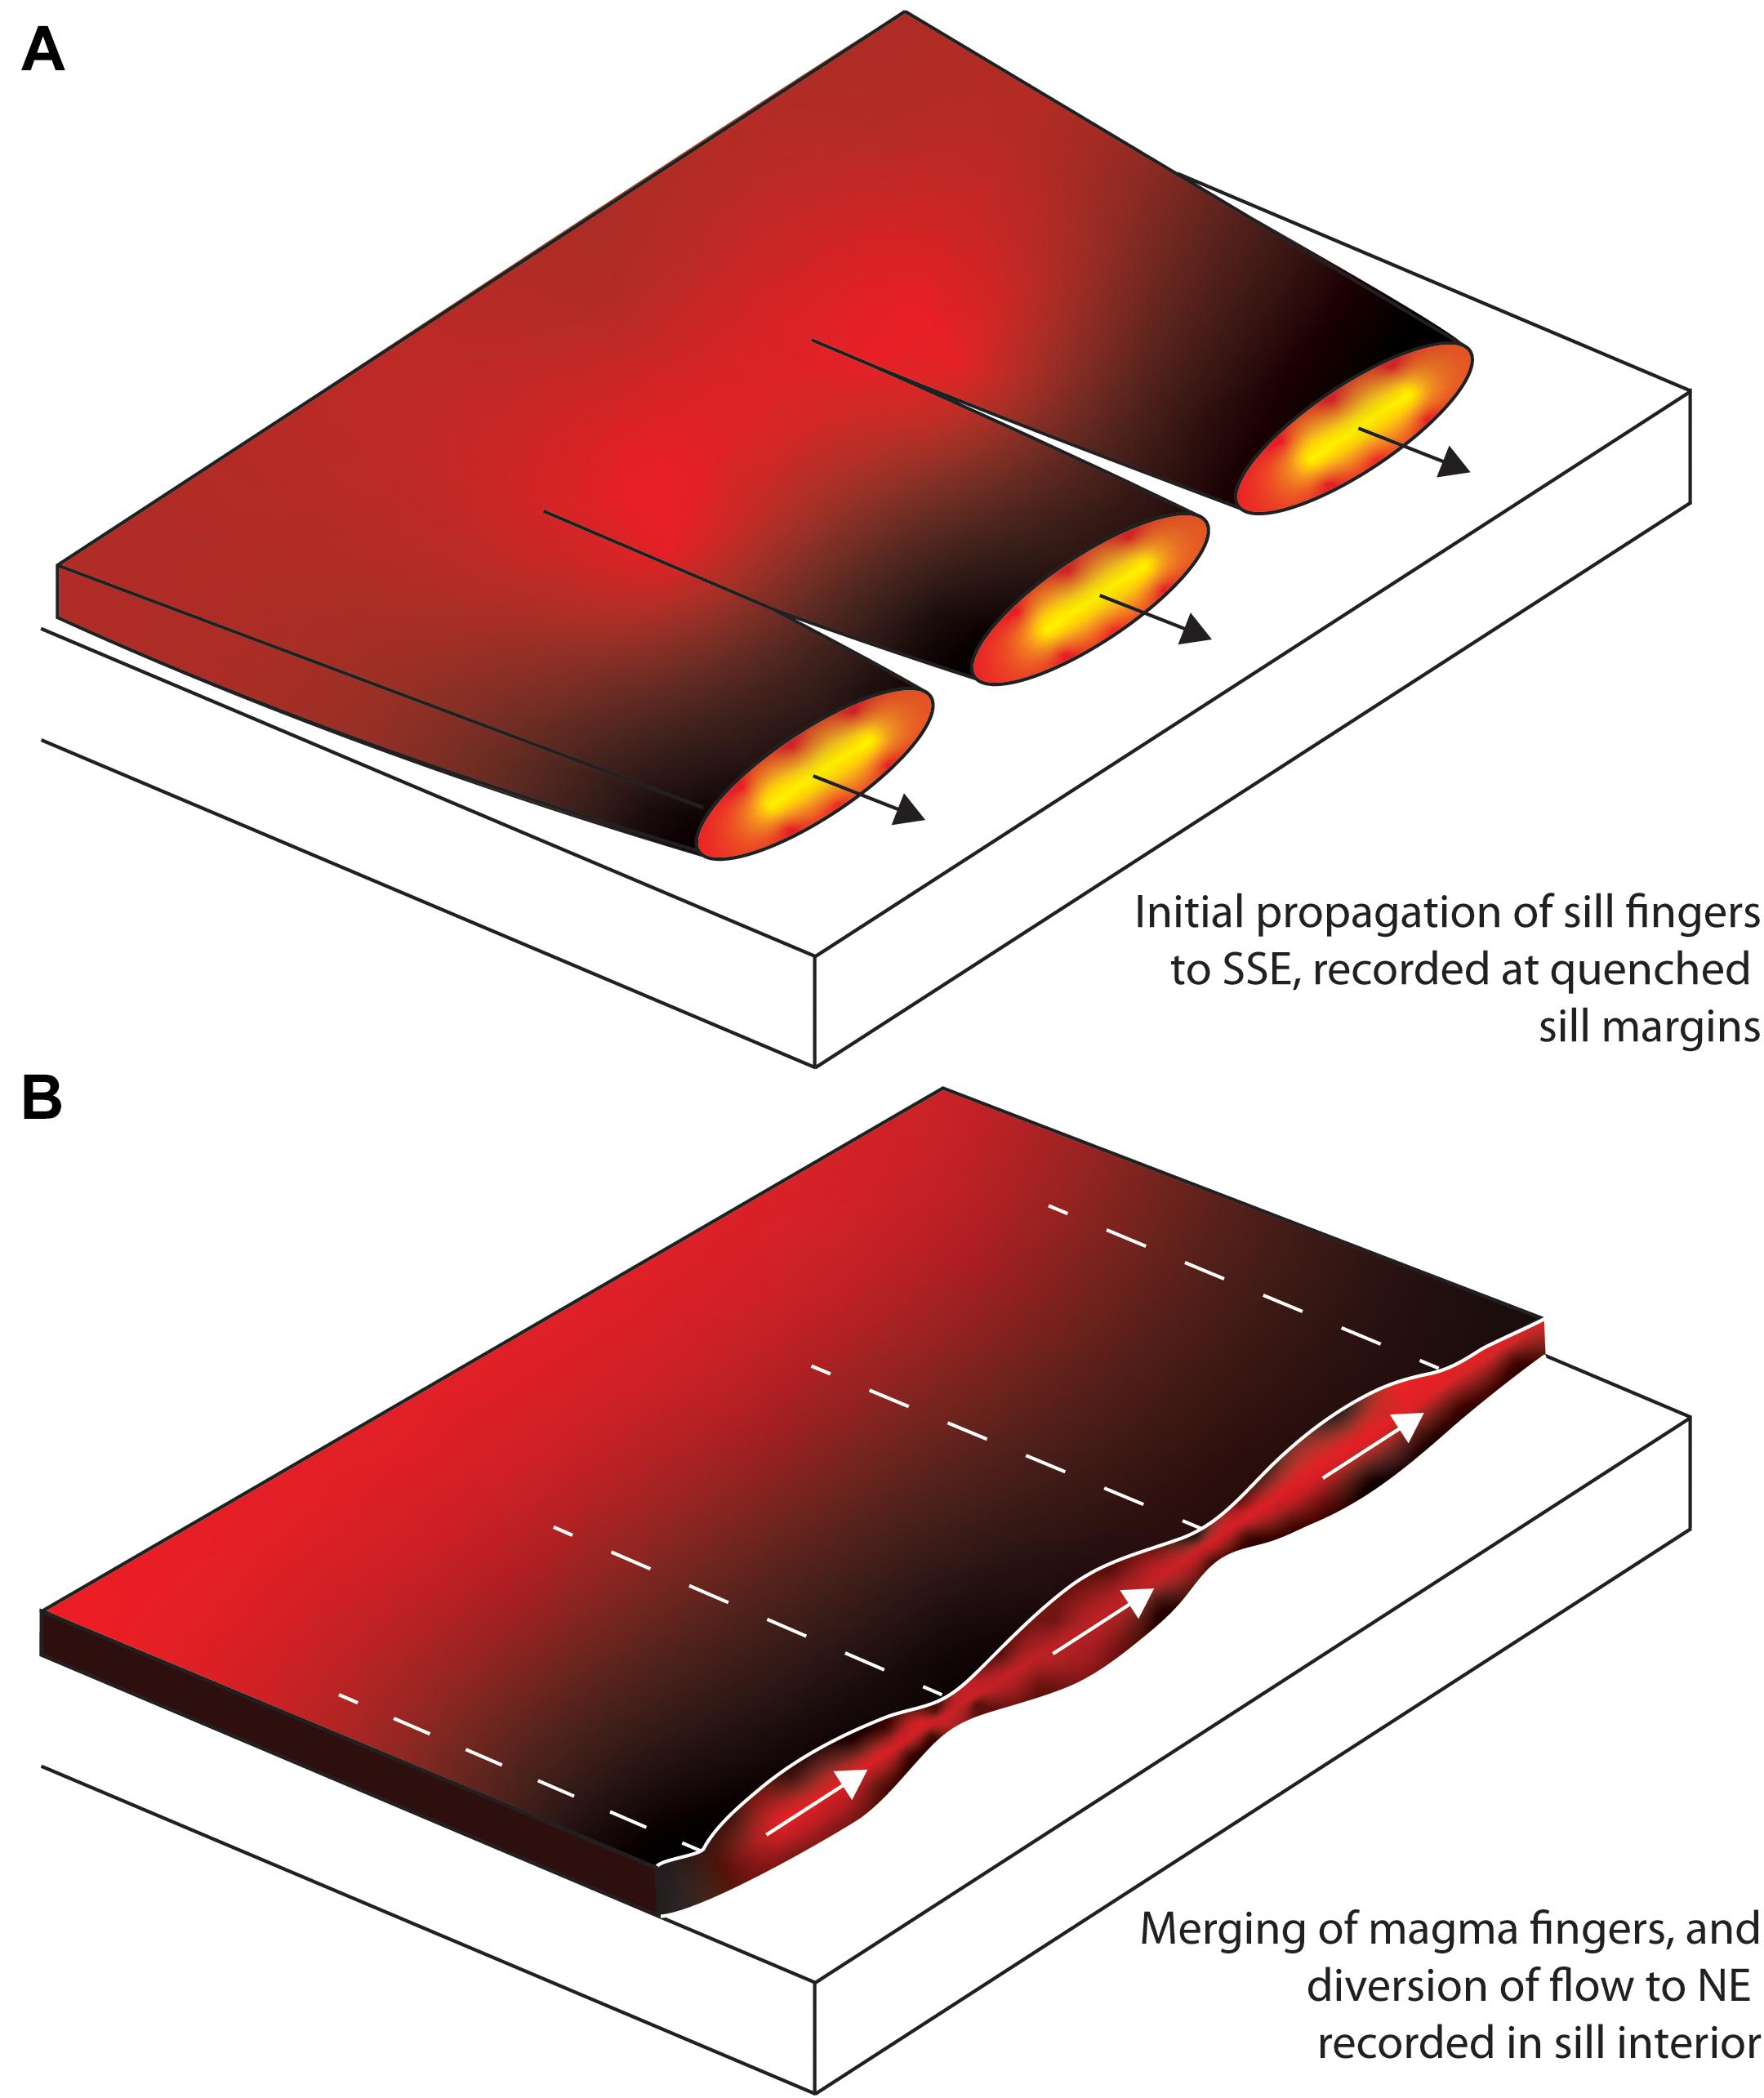
Figure 11. Schematic diagram of initial sill emplacement as magma fingers which propagated to the SSE (A), which subsequently coalesced with diverted flow direction towards the NE (B).
The AARM fabrics we measured originate from the orientation of SD to VS titanomagnetite crystals located along the edges of pre-existing mineral phases and as inclusions within the augite oikocrysts. We suggest the AARM magnetic lineation, created by the prolate nature of the ellipsoids, originates from in situ melt-percolation flow and solidification of the interstitial melt through the interconnected pore spaces of a crystal mush after the sill had stopped growing (Figure 10B). At the lower margin the AARM signals are oriented in a N-S direction, representing AARM Group 1. However, in the upper margin region, the signals are reoriented in an E-W orientation (AARM Group 4) with the AARM fabrics in the interior of the sill separated into two groupings (2 and 3).
The only height where AMS and AARM signals agree is at the lower margin (0 m height) where both fabrics show a NNW to SSE orientation of the mean K1 axes, which dips toward the NNE, a vertical orientation of the mean K3 axes, and an oblate shape (Figure 8). These similarities in orientation of their ellipsoids is characteristic of a normal fabric and occur in the lower Group A and the Group 1 regions. The normal fabric observed supports the suggestion of flow toward the south, and we infer that the AMS and AARM fabrics in this region both originate from simple shear conditions during progressive solidification of a flowing magma causing alignment of the magnetic minerals. Both the AMS and AARM foliation planes and the magnetic lineation directions are imbricated toward the SSE with respect to the sill plane, indicating a sense of flow toward the south.
At the contrasting upper margin, the upper part of AMS group A K1 signals are in a N-S orientation, however, the AARM group 4 K1 signals are oriented in an ESE-WNW direction and this offset is indicative of anomalous fabrics. The AMS signals represent the initial flow direction and orientation of MD crystals toward the south, however, the contrasting AARM signals, where the K1 axes are inclined to the WNW with respect to the sill plane and make up a larger proportion of the magnetic fabric (Figure 3C), suggest reorientation of flow during crystallization of the interstitial melt as it flowed through pores in the crystal network, and so these fabrics likely formed once the sill had ceased propagating. Our interpretation of magma flow from NNW to SSE direction based on magnetic fabrics is supported by field observations by Schofield (2009) of similarly oriented finger-like sill morphologies in the area.
Throughout the interior of the sill (0.5–5.0 m) the magnetic signals varied quite substantially and have been separated into one group for the AMS but two for AARM. The AMS K1 axes are shallowly dipping and orientated in NE-SW direction, however, the AARM K1 axes are inclined toward the N-NE (Group 2) or are rotating toward the east (Group 3). The shape fabrics also vary between the techniques with AMS being more oblate but AARM appearing more tri-axial to prolate. These fabrics are anomalous and can also be interpreted as two different flow regimes associated with (i) initial emplacement of the sill (orientation of the AMS signals) and (ii) later crystallization of the interstitial melt (orientation of the AARM signals), similar to those of inverse fabrics observed in the upper margin region. This indicates that the flow reoriented to a NE-SW direction, with imbrication in the AARM signal compared with the sill margins suggestive of flow of the interstitial melt to the N-NE whilst rising through the crystal mush. Some shear in the magma may still have been prevalent in order to cause the observed imbrication. The scatter associated with the AARM Group 3 signals possibly shows the height at which the flow of the interstitial melt changed direction and rotated around toward the West (4.5–5.0 m).
Our samples were collected from 4 sites across the length of the sill (∼45 m) in a horizontal transect aligned approximately NE-SW and thus approximately parallel to our inferred initial sill propagation direction. This provide us an opportunity to assess continuity in fabrics along the sill length. Our results show good correlation between sites. For example, the magnetic fabrics from samples collected at 5.0 m height (sites 3 and 4, ∼25 m separation) clustered together (Figure 6). In addition, the overall two populations in AARM ellipsoids (Figure 5Bii) contain samples from all sites. Overall this suggests we have not identified variations in flow fabric along the sill propagation direction.
Crystallization History
The petrological results from light microscopy, SEM and QEMSCAN analyses suggest that crystallization initiated with olivine and plagioclase. The presence of stellate plagioclase crystals (Figure 9A) and the larger euhedral olivine phenocrysts (Figure 9B) suggest these had space to grow unhindered, and so were likely surrounded by melt during crystallization (Gibb and Henderson, 1996). The location of these phases in the upper and lower margins suggests that they were present as phenocrysts in the initially intruding magma (Figure 10C). This is similar to the Shiant Isles picrodolerite and crinanite sills (Gibb and Henderson, 1996; Holness et al., 2017) and the Dun Raisburgh crinanite sill of the Isle of Skye (Nicoli et al., 2018).
The mineral textures suggest that small individual plagioclase crystals likely formed later and in situ once the sill propagation had ended (Gibb and Henderson, 1996; Holness, 2014). This large proportion of plagioclase present (50%) would have acted to create a rigid crystal network (Figure 10B) and prevent the flow of magma, as according to the Einstein-Roscoe equation a system becomes locked when up to 40% tabular crystals are present (Lejeune and Richet, 1995). The majority of the olivines then formed in situ from the solidifying interstitial melt. Nucleation of titanomagnetites and ilmenites within interstitial spaces demonstrates these also formed late, using olivine and plagioclase as nucleation sites. The remaining interstitial melt crystallized to form large augite crystals and complete the ophitic texture (Figures 9A,B). The lower proportion of augite observed in the upper margin may be the result of in situ differentiation and pore fluid flow of the crystallizing interstitial melt away from the margin (Gibb and Henderson, 2006). These mineral proportion and relationships suggest an initial emplacement temperature of the intruding crinanite magma of approximately 1180–1200°C (Nicoli et al., 2018).
The textural relationship between the magnetic carriers (titanomagnetites) and the other mineral phases present can help to infer the origin of the magnetic fabric and the time of its development. We suggest that the MD titanomagnetites (up to 1.3 mm), that likely provide the source of the AMS signal, used plagioclase and olivine as nucleation sites and grew from them into space which allowed them to grow larger becoming MD sized crystals (Figures 9C, 10B). In contrast, SD and VS titanomagnetites (<50 μm), that give rise to the AARM fabrics, have a more complex origin. Our observations that they appear within the interstitial spaces between plagioclases and olivines suggest that these smaller titanomagnetites are associated with crystallization of the interstitial melt during melt-percolation flow through the permeable crystal network and were restricted by the available space (Figure 10B) (Oppenheimer et al., 2015). The relative decrease in proportion of the softer 0.02 T strength MD phase compared with the stronger 0.4 T SD/PSD phase is suggestive of a fining of the grain size with increased height through the sill, which in turn suggests faster crystallization closer to the upper margin compared with the lower margin.
Thermal Evolution
The crinanite sill has intruded between an overlying sedimentary rock and an underlying pre-existing picrite sill (Figure 10D). The thermal evolution of the crinanite sill is strongly associated with the temperatures of these contrasting host rock layers when the crinanite sill was initially emplaced and then solidified, and the pattern of columnar jointing can help to constrain the temperature of the country rock during intrusion. We observe that columnar jointing in the crinanite rock is closely spaced near the upper margin and widens toward the base. The columns are also continuous across the lower margin into the picrite below (see Figures 2B, 10A and Gibson and Jones, 1991). Thermo-mechanical jointing experiments, where cylinders of hot rock are cooled from their solidus temperatures to tensile failure, have shown that columnar jointing in mafic magmas forms during cooling through the temperature range of 893–836°C (Lamur et al., 2018). If we apply this to our study, it suggests that the columnar joints we observe to span the crinanite-picrite sill boundary, results in the interpretation that the two sills cooled as a single unit. Furthermore, the temperature of the picrite sill must have been above 836°C. However, as the lower margin of the crinanite was chilled against the picrite this shows that there was still a large enough temperature gradient to quench the intruding magma.
The mechanism of heat loss from the intruding basalt to its surrounding host rocks plays an important role in controlling the preservation of flow fabrics during sill growth and solidification. By assuming that the sill cooled purely by conduction, we calculate that the timescale for solidification would have been 231 ± 40 days, using the equation:
where L is the half-thickness of the sill (3 m) and k is thermal diffusivity (4.5 × 10⁻⁷ m2/s, Hartlieb et al., 2016). Whereas, the 1D thermal model of Holness et al. (2012):
where w is the sill thickness (m) and x is the position within the sill, calculates a solidification time by conduction of 185 ± 32 days. Therefore, both conduction models broadly agree on the timescale of solidification. In both cases the error in solidification time is calculated assuming 0.5 m of variation in the sill thickness, but uncertainty in the thermal diffusivity of basaltic magma could potentially be a larger contributing factor.
To identify the possibility of cooling by convection, a key dimensionless parameter to consider is the Rayleigh number:
where g is acceleration due to gravity (9.81 m/s2), α is coercivity of thermal expansion (°C-1), ΔT is the temperature difference between magma and host-rock (°C), L is the characteristic length (m), μ is magma viscosity (Pa s) and k is thermal diffusivity (m2/s). For the crinanite sill we used; α of 4 × 10⁻⁵ °C-1 (Murase and McBirney, 1973), L of 3 m (half the sill thickness as cooling occurs from both margins), μ of 30 Pa s (Lesher and Spera, 2015) and k of 4.5 × 10⁻⁷ m2s (Hartlieb et al., 2016). For ΔT we use different values for the upper and lower margins: the temperature of the Jurassic sedimentary rock is assumed to have been 25°C (assuming a standard continental geotherm, e.g., Furlong and Chapman, 2013), whereas 890°C was used as the temperature of the underlying picrite sill, based on the upper temperature limit (Lamur et al., 2018). The temperature of the intruding basaltic magma is assumed to have been 1200°C. Therefore, ΔT of the upper and lower contacts was 1175°C and 310°C, respectively. Calculated Rayleigh numbers are therefore Ra = 2.35 × 10⁵ for the lower margin and 9.22 × 10⁵ for the upper margin. This suggests cooling by convection occurred during solidification of the sill, as these values are both larger than the critical value of 2772 (Fowler, 2004). Following this result, the time for the onset of convection is thus approximately 5 days, using the equation:
where l is the thickness of the thermal boundary layer, calculated to be 0.43 m at the upper margin (based on the critical Ra of 2772). This indicates that initially the sill would have cooled by conduction at the margins, but then convection would have had time to develop, and therefore both conduction and convection were key processes occurring during magma solidification.
These thermal models suggest that the margin regions where the magma was quenched against the host rock (i.e., the thermal boundary layer) are the only regions where the sill cooled by conduction, and that the central region of the sill experienced convective flow even after the sill had stopped its lateral growth. The conductively cooled regions are those which then produced the Group A AMS fabrics and the Group 1 and 4 AARM fabrics. At the lower margin, the rate of heat loss from the magma into the underlying picrite would have been lower than the upper margin into the country rock, due to smaller temperature differences with the host rocks. This would therefore produce an asymmetric cooling profile in the solidifying sill (Figure 10D). The warm floor of the sill would have acted to slow the inward propagation of the crystallization front upward from the lower margin of the sill (Figure 10C), with the faster cooling front from the upper margin preserving a thicker region where cooling occurred by conduction (Figures 6, 10D). The presence of gabbro lenses in the lower portion of the sill, along with coarsening in the grain size of the magnetic carriers with increased distance from the upper margin (Figure 4C), supports this interpretation of an asymmetrical cooling history.
Huppert and Sparks (1989) developed three classifications for the types of chilled margins preserved in intrusions and how they form. They define the first type of contact to be dominated by conductive heat flux and the preservation of the chilled margin. The second margin type is defined as one where conductive heat flux is temporarily overtaken by outward heat flux causing melting of the margin region but returning to conductive heat flux before the chilled contact is melted. This can occur as either convection at the upper margin or through flowing magma at the lower margin. The third type of margin is where the initial chilled contact becomes completely melted. Based on these definitions, we classify the upper margin of the crinanite sill to be a type one contact, where no melt back has occurred due to the thick region of the preserved magnetic fabrics. However, the lower contact represents a type two contact where some melting has occurred due to erosion by flowing magma during emplacement, however, not enough to melt the quenched contact region. Quenching of the magma against the host during initial emplacement and cooling by conduction would have allowed the preservation of the direction of flow during initial emplacement. In this sill the initial flow has been inferred to be from NNW to SSE (Figure 11A).
The variations in the temperatures of the host rock have resulted in the calculation of different thicknesses of the thermal boundary layer, with the upper layer being 0.43 m thick compared with the lower layer being thicker at 0.68 m. This has implications for the preservation of the magnetic fabrics and possibly also petrological (i.e., gravity settling) fabrics and suggests that there should be a thicker region of preservation of initial flow at the lower margin, however, this is not the case and as such may be an indicator that erosion of the thermal boundary layer by flowing magma may have occurred during emplacement. Thermal erosion of boundary layers has been observed at other locations in the British and Irish Palaeogene Igneous Province, i.e., in the Loch Scridain sill complex, Isle of Mull (Holness and Humphreys, 2003).
Within the sill interior, away from the margin regions and outside the calculated thermal boundary layers, are the areas of the sill that cooled by convection. The low degrees of anisotropy characterized by the AMS ellipsoids combined with large confidence angles (e.g., at the 4.5 m height, Figure 6 and Table 3) are indicative of magnetic carriers that display a near-uniform orientation. When this is combined with the knowledge that convection occurred, it suggests that the pre-existing phases present prior to crystallization of the magnetic carriers may have been given a uniform orientation by melt flowing around them whilst growing within the magma, and hence the magnetic fabric is reflecting the uniform orientation of these phases and as such, could be used as an indicator of convection in other studies.
Studies on other intrusions (e.g., the Shiant Isles, Holness et al., 2017) have identified the so-called ‘sandwich horizon’ (the final part of the sill to crystallize and the level that the upper and lower boundary solidification fronts meet) to be quite high within the intrusion (c.100–105 m within c.135 m thick sill). In contrast, in the Inver Tote sill, we infer this to be lower down within the intrusion based on the thermal modeling above, suspected asymmetry of the thermal profile (Figure 10D), and potential thermal erosion of the lower margin solidification front.
Implications and Limitations of This Study
Our study is focused on mafic sills, yet the flow and solidification processes we infer are also applicable to other magma types and other intrusion geometries, such as dykes or laccoliths. The intrusive nature of sills means that the physical, chemical and thermal processes occurring within the magma cannot be directly observed during emplacement. However, volcano observatories are reliant on interpreting the geophysical signals during emplacement, e.g., surface deformation and seismicity, that are associated with sill growth to forecast if, where and when an eruption may occur. We show that the rock record of sills contains key insights to help us interpret the nature of magma flow in active systems, and the dynamics of magma flow, from initial propagation to solidification, are important for controlling whether or not magma will erupt. We demonstrate how detailed studies of volcanic plumbing systems need to be an essential part of volcanic studies, and by modeling magma intrusion processes based on field, petrographic and magnetic observations collectively, we can inform the development of new and more robust understanding of magma flow dynamics.
Our study of flow and solidification preserved within the magnetic fabrics of a mafic sill is exceptionally detailed and demonstrates how a high sample density across the thickness of intrusions can provide insight to inform our understanding of magma intrusion. Our combination of petrographic analysis and two types of magnetic fabric analysis is not common; however, we demonstrate how this combined and multidisciplinary approach enables the flow of magma during intrusion and the flow of interstitial melt during post-emplacement solidification can be unraveled. The use of AARM in the interpretation of magma emplacement processes is novel and has the potential to elucidate a different part of the magma intrusion and solidification process compared to other magnetic methods. AARM enables the interpretation of the signals associated with fine scale flow fabrics that may not be observed through other means. The only limitation to implementing AARM more widely to study magma intrusions is that it is a relatively time-consuming technique compared to AMS and requires equipment less commonly available.
Field studies of intrusions are limited due to the exposures being restricted to two-dimensional sections through the igneous body. Our high-resolution sampling strategy was possible due to both upper and lower margins of the sill being exposed in a quarry so that it could be sampled relatively easily. It has allowed us to measure variations in magnetic fabrics and understand the emplacement and solidification of a relatively thin sill. This is a framework upon which to conduct studies on thicker sills and laccoliths, to investigate how magnetic and petrological fabrics vary across the breadth of intrusions which may have undergone a more complex emplacement history and may have been supplied by multiple pulses of magma. Additionally, we sampled along the axis of one suspected sill finger, however, sampling perpendicular to the flow axis could potentially intersect multiple sill fingers. This would require a different field site as such sampling sections are not available at Inver Tote, but would provide the opportunity to potentially capture the sill’s three-dimensional internal structure and further improve our model of sill flow and solidification processes.
Conclusion
Our analysis of how magnetic fabrics vary across the thickness of a sill from the Little Minch Sill Complex, Isle of Skye has given new insight into how magma flow and solidification evolves through time. Our study is one of the first to apply AARM to understand the emplacement of a relatively thin sill where the history of emplacement has the potential to be rather simple, as such emplacement models can be tested by studying small scale variations in the preserved fabrics across the sill thickness. However, the observations of both AMS and AARM signals in this study contrast dramatically and provide a new understanding of how flow through intrusions evolves through time. Variations in AMS and AARM signals across the breadth of the sill are indicative of complex emplacement processes and cooling history; AMS fabrics relate to the initial magma flow, and the AARM fabric relates to pore-melt flow of the interstitial liquid through the crystal mush. The underlying picrite sill may have slowed solidification at the lower margin of the crinanite sill, assisting in the development of asymmetry in the rate of solidification from the margins observed in both the AMS and AARM signals. From this we interpret the initial flow direction in the sill at this location on the Isle of Skye, was from the NNW to SSE as fingers. During emplacement the main flow direction migrated to be from the SW to NE reflecting the regional flow regime. Calculations of thermal boundary layers and Rayleigh numbers suggest that both conduction and convection occurred during solidification. The complexities in magnetic fabrics recorded in this mafic sill demonstrate how magma flow can evolve through time across a thin relatively simple intrusion. Consequently, care needs to be taken when inferring magma flow from AMS as it may not be reliable indicator of complex emplacement histories, as such reassessment of complex fabrics may be necessary to determine more accurate histories of magma flow.
Author Contributions
SM completed the majority of the work, including field and lab data collection, interpretation of the data and preparation of the manuscript. JK assisted with fieldwork, interpretation of the petrological results and manuscript preparation. AB assisted with rock magnetism and magnetic anisotropy studies and interpretation of the magnetic data. JU performed the QEMSCAN analyses.
Funding
The Mineralogical Society of Great Britain and Ireland (Postgraduate Bursary) and University of Liverpool (Ede & Ravenscroft Prize to support postgraduate research) provided SM with support for fieldwork. The Royal Society (Grant No. RG130771) provided SM and JK with support for fieldwork and thin section preparation. NERC (NE/P00170X/1, NE/S008330/1) and The Leverhulme Trust (RL-2016-080) support AB and the running of the geomagnetism lab at the University of Liverpool.
Conflict of Interest Statement
The authors declare that the research was conducted in the absence of any commercial or financial relationships that could be construed as a potential conflict of interest.
Acknowledgments
SM thanks the Mineralogical Society of Great Britain & Ireland for a Postgraduate Bursary and the University of Liverpool for the Ede and Ravenscroft Prize. JK acknowledges a grant from the Royal Society (Grant No. RG130771). Elliot Wood is thanked for field assistance, Martin Chadima is thanked for assistance with rock magnetism. AB acknowledges continued research funding from NERC (NE/P00170X/1, NE/S008330/1) and The Leverhulme Trust (RL-2016-080). Sally Gibson is thanked for helpful discussions during the early stages of this work. We wish to thank FEI Company (Oregon) for the use of Qemscan SEM hardware, and Alan Boyle for microscopy assistance. All rock samples were collected sympathetically out of sight from public footpaths and known geological teaching sites. We would also like to thank CM, GN, and BH for their comments which greatly improved this manuscript. JL is thanked for editorial support.
References
Abdelmalak, M. M., Mourgues, R., Galland, O., and Bureau, D. (2012). Fracture mode analysis and related surface deformation during dyke intrusion: results from 2D experimental modelling. Earth Planet. Sci. Lett. 359–360, 93–105. doi: 10.1016/j.epsl.2012.10.008
Airoldi, G. M., Muirhead, J. D., Long, S. M., Zanella, E., and White, J. D. L. (2016). Flow dynamics in mid-Jurassic dikes and sills of the Ferrar large igneous province and implications for long-distance magma transport. Tectonophysics 683, 182–199. doi: 10.1016/j.tecto.2016.06.029
Annen, C. (2011). Implications of incremental emplacement of magma bodies for magma differentiation, thermal aureole dimensions and plutonism–volcanism relationships. Tectonophysics 500, 3–10. doi: 10.1016/j.tecto.2009.04.010
Annen, C., and Sparks, R. S. J. (2002). Effects of repetitive emplacement of basaltic intrusions on thermal evolution and melt generation in the crust. Earth Planet. Sci. Lett. 203, 937–955. doi: 10.1016/S0012-821X(02)00929-9
Arbaret, L., Launeau, P., Diot, H., and Sizaret, S. (2013). Magnetic and shape fabrics of magnetite in simple shear flows. J. Volcanol. Geotherm. Res. 249, 25–38. doi: 10.1016/j.jvolgeores.2012.09.003
Archanjo, C. J., and Launeau, P. (2004). Magma flow inferred from preferred orientations of plagioclase of the Rio Ceara-Mirim dyke swarm (NE Brazil) and its AMS significance. Geol. Soc. Lond. Spec. Publ. 238, 285–298. doi: 10.1144/GSL.SP.2004.238.01.17
Baer, G. (1991). Mechanisms of dike propagation in layered rocks and in massive, porous sedimentary rocks. J. Geophys. Res. 96:11911–11929. doi: 10.1029/91JB00844
Blundell, D. (1957). A palaeomagnetic investigation of the Lundy dyke swarm. Geol. Mag. 44, 187–193. doi: 10.1017/S0016756800068539
Bons, P. D., Baur, A., Elburg, M. A., Lindhuber, M. J., Marks, M. A. W., Soesoo, A., et al. (2015). Layered intrusions and traffic jams. Geology 43, 71–74. doi: 10.1130/G36276.1
British Geological Survey (2007). Portree, Scotland Sheet 80E, Solid and Drift Geology, 1:50 000 Geology Series. Keyworth: British Geological Survey.
Castro, J. M., Cordonnier, B., Schipper, C. I., Tuffen, H., Baumann, T. S., and Feisel, Y. (2016). Rapid laccolith intrusion driven by explosive volcanic eruption. Nat. Commun. 7:13585. doi: 10.1038/ncomms13585
Chadima, M., Cajz, V., and Týcová, P. (2009). On the interpretation of normal and inverse magnetic fabric in dikes: examples from the Eger Graben, NW Bohemian Massif. Tectonophysics 466, 47–63. doi: 10.1016/j.tecto.2008.09.005
Chadima, M., and Hrouda, F. (2012). Cureval8. Available at: http://www.agico.com/text/software/cureval/cureval.php (accessed August 1, 2016).
Chadima, M., and Jelinek, V. (2009). Anisoft42. Available at: http://www.agico.com/text/software/anisoft/anisoft.php (accessed August 1, 2014).
Chadima, M., Pokorny, J., and Dusek, M. (2018a). Rema6. Available at: http://www.agico.com/text/software/rema6/rema6.php (accessed October 1, 2018).
Chadima, M., Pokorny, J., and Studynka, J. (2018b). Safyr7. Available at: http://www.agico.com/text/software/safyr/safyr.php (accessed October 1, 2018).
Chadwick, W. W., Jónsson, S., Geist, D. J., Poland, M., Johnson, D. J., Batt, S., et al. (2011). The May 2005 eruption of Fernandina volcano, Galápagos: the first circumferential dike intrusion observed by GPS and InSAR. Bull. Volcanol. 73, 679–697. doi: 10.1007/s00445-010-0433-0
Cheadle, M. J., and Gee, J. S. (2017). Quantitative textural insights into the formation of gabbro in mafic Intrusions. Elements 13, 409–414. doi: 10.2138/gselements.13.6.409
Clemente, C. S., Amorós, E. B., and Crespo, M. G. (2007). Dike intrusion under shear stress: effects on magnetic and vesicle fabrics in dikes from rift zones of Tenerife (Canary Islands). J. Struct. Geol. 29, 1931–1942. doi: 10.1016/j.jsg.2007.08.005
Correa-Gomes, L. C., Souza Filho, C. R., Martins, C. J. F. N., and Oliveira, E. P. (2001). Development of symmetrical and asymmetrical fabrics in sheet-like igneous bodies: the role of magma flow and wall-rock displacements in theoretical and natural cases. J. Struct. Geol. 23, 1415–1428. doi: 10.1016/S0191-8141(01)00007-4
Coward, M. P. (1980). The analysis of flow profiles in a basaltic dyke using strained vesicles. J. Geol. Soc. 137, 605–615. doi: 10.1144/gsjgs.137.5.0605
Day, R., Fuller, M., and Schmidt, V. A. (1977). Hysteresis properties of titanomagnetites: grain-size and compositional dependence. Phys. Earth Planet. Inter. 13, 260–267. doi: 10.1016/0031-9201(77)90108-X
Dragoni, M., Lanza, R., and Tallarico, A. (1997). Magnetic anisotropy produced by magma flow: theoretical model and experimental data from Ferrar dolerite sills (Antarctica). Geophys. J. Int. 128, 230–240. doi: 10.1111/j.1365-246X.1997.tb04083.x
EDINA Geology Digimap Service (2008)2 1:250000 British Geology, SHAPE geospatial data, scale 1:250000, Tile ng, BGS. Available at: http://digimap.edina.ac.uk (accessed March 8, 2015).
Emeleus, C. H., and Bell, B. R. (2005). The Palaeogene Volcanic Districts of Scotland, 4th Edn. Nottingham: British Geological Survey.
Féménias, O., Diot, H., Berza, T., Gauffriau, A., and Demaiffe, D. (2004). Asymmetrical to symmetrical magnetic fabric of dikes: paleo-flow orientations and Paleo-stresses recorded on feeder-bodies from the Motru Dike Swarm (Romania). J. Struct. Geol. 26, 1401–1418. doi: 10.1016/j.jsg.2003.12.003
Ferre, E. C. (2002). Theoretical models of intermediate and inverse AMS fabrics. Geophys. Res. Lett. 29, 31–34. doi: 10.1029/2001gl014367
Fowler, C. M. R. (2004). The Solid Earth: An Introduction to Global Geophysics, 2nd Edn. Cambridge: Cambridge University Press. doi: 10.1017/CBO9780511819643
Fujita, E., Ukawa, M., and Yamamoto, E. (2004). Subsurface cyclic magma sill expansions in the 2000 Miyakejima volcano eruption: possibility of two-phase flow oscillation. J. Geophys. Res. Solid Earth 109:B04205. doi: 10.1029/2003JB002556
Furlong, K. P., and Chapman, D. S. (2013). Heat flow, heat generation, and the thermal state of the lithosphere. Annu. Rev. Earth Planet. Sci. 41, 385–410. doi: 10.1146/annurev.earth.031208.100051
Galland, O., Burchardt, S., Hallot, E., Mourgues, R., and Bulois, C. (2014). Dynamics of dikes versus cone sheets in volcanic systems. J. Geophys. Res. Solid Earth 119, 6178–6192. doi: 10.1002/2014JB011059
Geoffroy, L., Callot, J. P., Aubourg, C., and Moreira, M. (2002). Magnetic and plagioclase linear fabric discrepancy in dykes: a new way to define the flow vector using magnetic foliation. Terra Nova 14, 183–190. doi: 10.1046/j.1365-3121.2002.00412.x
Geshi, N., Kusumoto, S., and Gudmundsson, A. (2010). Geometric difference between non-feeder and feeder dikes. Geology 38, 195–198. doi: 10.1130/G30350.1
Geshi, N., Kusumoto, S., and Gudmundsson, A. (2012). Effects of mechanical layering of host rocks on dike growth and arrest. J. Volcanol. Geotherm. Res. 223–224, 74–82. doi: 10.1016/j.jvolgeores.2012.02.004
Gibb, F., and Henderson, C. (1996). The Shiant Isles Main Sill: structure and mineral fractionation trends. Mineral. Mag. 60, 67–97. doi: 10.1180/minmag.1996.060.398.06
Gibb, F. G. F., and Gibson, S. A. (1989). The little Minch sill complex. Scott. J. Geol. 25, 367–370. doi: 10.1144/sjg25030367
Gibb, F. G. F., and Henderson, C. M. B. (1984). The structure of the Shiant Isles sill complex, Outer Hebrides. Scott. J. Geol. 20, 21–29. doi: 10.1144/sjg20010021
Gibb, F. G. F., and Henderson, C. M. B. (2006). Chemistry of the Shiant Isles Main Sill, NW Scotland, and wider implications for the petrogenesis of Mafic Sills. J. Petrol. 47, 191–230. doi: 10.1093/petrology/egi072
Gibson, S. A. (1990). The geochemistry of the Trotternish sills, Isle of Skye - crustal contamination in the British Tertiary Volcanic Province. J. Geol. Soc. 147, 1071–1081. doi: 10.1144/gsjgs.147.6.1071
Gibson, S. A., and Jones, A. (1991). Igneous stratigraphy and internal structure of the Little Minch Sill Complex, Trotternish Peninsula, northern Skye, Scotland. Geol. Mag. 128, 51–66. doi: 10.1017/S0016756800018045
Gudmundsson, A., Lecoeur, N., Mohajeri, N., and Thordarson, T. (2014). Dike emplacement at Bardarbunga, Iceland, induces unusual stress changes, caldera deformation, and earthquakes. Bull. Volcanol. 76:869. doi: 10.1007/s00445-014-0869-8
Hargraves, R. B., Johnson, D., and Chan, C. Y. (1991). Distribution anisotropy: the cause of AMS in igneous rocks? Geophys. Res. Lett. 18, 2193–2196. doi: 10.1029/91GL01777
Harris, J. P., and Hudson, J. D. (1980). Lithostratigraphy of the great estuarine group (Middle Jurassic), Inner Hebrides. Scott. J. Geol. 16, 231–250. doi: 10.1144/sjg16020231
Hartlieb, P., Toifl, M., Kuchar, F., Meisels, R., and Antretter, T. (2016). Thermo-physical properties of selected hard rocks and their relation to microwave-assisted comminution. Miner. Eng. 91, 34–41. doi: 10.1016/j.mineng.2015.11.008
Holness, M. (2014). The effect of crystallization time on plagioclase grain shape. Contrib. Mineral. Petrol. 16:1076. doi: 10.1007/s00410-014-1076-5
Holness, M. B., Farr, R., and Neufeld, J. A. (2017). Crystal settling and convection in the Shiant Isles Main Sill. Contrib. Mineral. Petrol. 172:7. doi: 10.1007/s00410-016-1325-x
Holness, M. B., and Humphreys, M. C. S. (2003). The Traigh Bhan na Sgurra Sill, Isle of Mull: flow localization in a major magma conduit. J. Petrol. 44, 1961–1976. doi: 10.1093/petrology/egg066
Holness, M. B., Richardson, C., and Helz, R. T. (2012). Disequilibrium dihedral angles in dolerite sills: a new proxy for cooling rate. Geology 40, 795–798. doi: 10.1130/G33119.1
Hoyer, L., and Watkeys, M. K. (2017). Using magma flow indicators to infer flow dynamics in sills. J. Struct. Geol. 96, 161–175. doi: 10.1016/j.jsg.2017.02.005
Hrouda, F., Buriánek, D., Krejčí, O., and Chadima, M. (2015). Magnetic fabric and petrology of Miocene sub-volcanic sills and dykes emplaced into the SW Flysch Belt of the West Carpathians (S Moravia, Czech Republic) and their volcanological and tectonic implications. J. Volcanol. Geotherm. Res. 290, 23–38. doi: 10.1016/j.jvolgeores.2014.12.001
Hudson, J. D., and Trewin, N. H. (2002). “Jurassic,” in The Geology of Scotland, 4th Edn, ed. N. H. Trewin (London: The Geological Society), 323–350.
Hughes, H. S. R., Boyce, A. J., McDonald, I., Davidheiser-Kroll, B., Holwell, D. A., McDonald, A., et al. (2015). Contrasting mechanisms for crustal sulphur contamination of mafic magma: evidence from dyke and sill complexes from the British Palaeogene Igneous Province. J. Geol. Soc. 172, 443–458. doi: 10.1144/jgs2014-112
Huppert, H. E., and Sparks, R. S. J. (1989). Chilled margins in igneous rocks. Earth Planet. Sci. Lett. 92, 397–405. doi: 10.1016/0012-821X(89)90063-0
Jackson, M. (1991). Anisotropy of magnetic remanence: a brief review of mineralogical sources, physical origins, and geological applications, and comparison with susceptibility anisotropy. Pure Appl. Geophys. PAGEOPH 136, 1–28. doi: 10.1007/BF00878885
Jelinek, V. (1977). The Statistical Theory of Measuring Anisotropy of Magnetic Susceptibility of Rocks and Its Application. Brno: Geofysika.
Jelinek, V. (1981). Characterization of the magnetic fabric of rocks. Tectonophysics 79, T63–T67. doi: 10.1016/0040-1951(81)90110-4
Kavanagh, J. L., Boutelier, D., and Cruden, A. R. (2015). The mechanics of sill inception, propagation and growth: experimental evidence for rapid reduction in magmatic overpressure. Earth Planet. Sci. Lett. 421, 117–128. doi: 10.1016/j.epsl.2015.03.038
Kavanagh, J. L., Burns, A. J., Hazim, S. H., Wood, E., Martin, S. A., Hignett, S., et al. (2018a). Challenging dyke ascent models using novel laboratory experiments: implications for reinterpreting evidence of magma ascent and volcanism. J. Volcanol. Geotherm. Res. 354, 87–101. doi: 10.1016/J.JVOLGEORES.2018.01.002
Kavanagh, J. L., Engwell, S., and Martin, S. (2018b). A review of laboratory and numerical modelling in volcanology. Solid Earth 9, 531–571. doi: 10.5194/se-9-531-2018
Kavanagh, J. L., Menand, T., and Sparks, R. S. J. (2006). An experimental investigation of sill formation and propagation in layered elastic media. Earth Planet. Sci. Lett. 245, 799–813. doi: 10.1016/j.epsl.2006.03.025
Kavanagh, J. L., and Pavier, M. J. (2014). Rock interface strength influences fluid-filled fracture propagation pathways in the crust. J. Struct. Geol. 63, 68–75. doi: 10.1016/j.jsg.2014.03.001
Kendrick, J. E., Lavallée, Y., Mariani, E., Dingwell, D. B., Wheeler, J., and Varley, N. R. (2017). Crystal plasticity as an indicator of the viscous-brittle transition in magmas. Nat. Commun. 8:1926. doi: 10.1038/s41467-017-01931-4
Khan, A. (1962). The anisotropy of magnetic susceptibility of some igneous and metamorphic rocks. J. Geophys. Res. 67, 2873–2885. doi: 10.1029/JZ067i007p02873
Knight, M., and Walker, G. (1988). Magma flow directions in dikes of the Koolau Complex, Oahu, determined from magnetic fabric studies. J. Geophys. Res. 93, 4301–4319. doi: 10.1029/JB093iB05p04301
Lamur, A., Lavallée, Y., Iddon, F. E., Hornby, A. J., Kendrick, J. E., Von Aulock, F. W., et al. (2018). Disclosing the temperature of columnar jointing in lavas. Nat. Commun. 9:1432. doi: 10.1038/s41467-018-03842-4
Lejeune, A. M., and Richet, P. (1995). Rheology of crystal-bearing silicate melts: an experimental study at high viscosities. J. Geophys. Res. 100, 4215–4229. doi: 10.1029/94JB02985
Leonhardt, R. (2006). Analyzing rock magnetic measurements: the RockMagAnalyzer 1.0 software. Comput. Geosci. 32, 1420–1431. doi: 10.1016/j.cageo.2006.01.006
Lesher, C. E., and Spera, F. J. (2015). Thermodynamic and Transport Properties of Silicate Melts and Magma. The Encyclopedia of Volcanoes, 2nd Edn. Amsterdam: Elsevier Inc. doi: 10.1016/B978-0-12-385938-9.00005-5
Liss, D., Hutton, D. H. W., and Owens, W. H. (2002). Ropy flow structures: a neglected indicator of magma-flow direction in sills and dikes. Geology 30, 715–718. doi: 10.1130/0091-7613(2002)030<0715:RFSANI>2.0.CO;2
Lister, J., and Kerr, R. (1991). Fluid-mechanical models of crack propagation and their application to magma transport in dykes. J. Geophys. Res. Solid 96, 49–77. doi: 10.1029/91JB00600
Lister, J. R. (1991). Steady solutions for feeder dykes in a density-stratified lithosphere. Earth Planet. Sci. Lett. 107, 233–242. doi: 10.1016/0012-821X(91)90073-Q
Lowrie, W. (1990). Identification of Ferromagnetic Minerals in a rock by coercivity and unblocking temperature properties. Geophys. Res. Lett. 17, 159–162. doi: 10.1029/GL017i002p00159
Magee, C., Muirhead, J., Schofield, N., Walker, R. J., Galland, O., Holford, S., et al. (2018a). Structural signatures of igneous sheet intrusion propagation. J. Struct. Geol. (in press). doi: 10.1016/j.jsg.2018.07.010
Magee, C., Stevenson, C. T. E., Ebmeier, S. K., Keir, D., Hammond, J. O. S., Gottsmann, J. H., et al. (2018b). Magma plumbing systems: a geophysical perspective. J. Petrol. 59, 1217–1251. doi: 10.1093/petrology/egy064
Magee, C., Stevenson, C., O’Driscoll, B., Schofield, N., and McDermott, K. (2012). An alternative emplacement model for the classic Ardnamurchan cone sheet swarm, NW Scotland, involving lateral magma supply via regional dykes. J. Struct. Geol. 43, 73–91. doi: 10.1016/j.jsg.2012.08.004
Mathieu, L., van Wyk, de Vries, B., Holohan, E. P., and Troll, V. R. (2008). Dykes, cups, saucers and sills: analogue experiments on magma intrusion into brittle rocks. Earth Planet. Sci. Lett. 271, 1–13. doi: 10.1016/j.epsl.2008.02.020
Mattsson, T., Burchardt, S., Almqvist, B. S. G., and Ronchin, E. (2018). Syn-emplacement fracturing in the Sandfell laccolith, eastern Iceland—implications for rhyolite intrusion growth and volcanic hazards. Front. Earth Sci. 6:5. doi: 10.3389/feart.2018.00005
McCabe, C., Jackson, M., and Ellwood, B. B. (1985). Magnetic anisotropy in the Trenton Limestone: results of a new technique, anisotropy of anhysteretic susceptibility. Geophys. Res. Lett. 12, 333–336. doi: 10.1029/GL012i006p00333
Menand, T. (2011). Physical controls and depth of emplacement of igneous bodies: a review. Tectonophysics 500, 11–19. doi: 10.1016/j.tecto.2009.10.016
Menand, T., Daniels, K. A., and Benghiat, P. (2010). Dyke propagation and sill formation in a compressive tectonic environment. J. Geophys. Res. 115:B08201. doi: 10.1029/2009JB006791
Monreal, F. R., Villar, H. J., Baudino, R., Delpino, D., and Zencich, S. (2009). Modeling an atypical petroleum system: a case study of hydrocarbon generation, migration and accumulation related to igneous intrusions in the Neuquen Basin, Argentina. Mar. Pet. Geol. 26, 590–605. doi: 10.1016/j.marpetgeo.2009.01.005
Murase, T., and McBirney, A. R. (1973). Properties of some common igneous rocks and their melt at high temperatures. Geol. Soc. Am. Bull. 84, 3563–3592. doi: 10.1130/0016-7606(1973)84<3563:POSCIR>2.0.CO;2
Nicoli, G., Holness, M., Neuberg, J., and Farr, R. (2018). Microstructural evidence for crystallization regimes in mafic intrusions: a case study from the Little Minch Sill Complex, Scotland. Contrib. Mineral. Petrol. 173:97. doi: 10.1007/s00410-018-1525-7
O’Driscoll, B., Troll, V. R., Reavy, R. J., and Turner, P. (2006). The Great Eucrite intrusion of Ardnamurchan, Scotland: reevaluating the ring-dike concept. Geology 34, 189–192. doi: 10.1130/G22294.1
Olazabal, A. A., Carracedo, M., and Aranguren, A. (1999). Petrology, magnetic fabric and emplacement in a strike-slip regime of a zoned peraluminous granite: the Campanario-La Haba pluton, Spain. Geol. Soc. Lond. Spec. Publ. 168, 177–190. doi: 10.1144/GSL.SP.1999.168.01.12
Oppenheimer, J., Rust, A. C., Cashman, K. V., and Sandnes, B. (2015). Gas migration regimes and outgassing in particle-rich suspensions. Front. Phys. 3:60. doi: 10.3389/fphy.2015.00060
Paquet, F., Dauteuil, O., Hallot, E., and Moreau, F. (2007). Tectonics and magma dynamics coupling in a dyke swarm of Iceland. J. Struct. Geol. 29, 1477–1493. doi: 10.1016/j.jsg.2007.06.001
Petcovic, H. L., and Dufek, J. D. (2005). Modeling magma flow and cooling in dikes: implications for emplacement of Columbia River flood basalts. J. Geophys. Res. 110:B10201. doi: 10.1029/2004JB003432
Poland, M. P., Fink, J. H., and Tauxe, L. (2004). Patterns of magma flow in segmented silicic dikes at Summer Coon volcano, Colorado: AMS and thin section analysis. Earth Planet. Sci. Lett. 219, 155–169. doi: 10.1016/S0012-821X(03)00706-4
Polteau, S., Ferré, E. C., Planke, S., Neumann, E.-R., and Chevallier, L. (2008). How are saucer-shaped sills emplaced? Constraints from the Golden Valley Sill, South Africa. J. Geophys. Res. 113:B12104. doi: 10.1029/2008JB005620
Potter, D. K., and Stephenson, A. (1988). Single-domain particles in rocks and magnetic fabric analysis. Geophys. Res. Lett. 15, 1097–1100. doi: 10.1029/GL015i010p01097
Putirka, K. D. (2017). Down the crater: where magmas are stored and why they erupt. Elements 13, 11–16. doi: 10.2113/gselements.13.1.11
Raposo, M. I. B., and Ernesto, M. (1995). Anisotropy of magnetic susceptibility in the Ponta Grossa dyke swarm (Brazil) and its relationship with magma flow direction. Phys. Earth Planet. Inter. 87, 183–196. doi: 10.1016/0031-9201(94)02970-M
Rochette, P., Jackson, M., and Aubourg, C. (1992). Rock magnetism and the interpretation of anisotropy of magnetic susceptibility. Rev. Geophys. 30, 209–226. doi: 10.1029/92RG00733
Rochette, P., Jenatton, L., Dupuy, C., Boudier, F., and Reuber, I. (1991). “Diabase dikes emplacement in the Oman Ophiolite: a magnetic fabric study with reference to geochemistry,” in Ophiolite Genesis and Evolution of the Oceanic Lithosphere, eds T. Peters, A. Nicolas, and R. G. Coleman (Dordrecht: Springer), 55–82. doi: 10.1007/978-94-011-3358-6
Roni, E., Westerman, D. S., Dini, A., Stevenson, C., and Rocchi, S. (2014). Feeding and growth of a dyke-laccolith system (Elba Island, Italy) from AMS and mineral fabric data. J. Geol. Soc. 171, 413–424. doi: 10.1144/jgs2013-019
Rubin, A. (1995). Propagation of magma-filled cracks. Annu. Rev. Earth Planet. Sci. 23, 287–336. doi: 10.1146/annurev.ea.23.050195.001443
Schofield, N. (2009). Linking Sill Morphology to Emplacement Mechanisms. Ph.D. thesis, University of Birmingham, Birmingham.
Schofield, N., Jerram, D. A., Holford, S., Archer, S., Mark, N., Hartley, A., et al. (2018). “Sills in sedimentary basins and petroleum systems,” in Physical Geology of Shallow Magmatic Systems: Dykes, Sills and Laccoliths, eds C. Breitkreuz and S. Rocchi (Cham: Springer International Publishing), 273–294. doi: 10.1007/11157_2015_17
Selkin, P. A., Gee, J. S., and Meurer, W. P. (2014). Magnetic anisotropy as a tracer of crystal accumulation and transport, Middle Banded Series, Stillwater Complex, Montana. Tectonophysics 629, 123–137. doi: 10.1016/j.tecto.2014.03.028
Silva, P. F., Marques, F. O., Henry, B., Madureira, P., Hirt, A. M., Font, E., et al. (2010). Thick dyke emplacement and internal flow: a structural and magnetic fabric study of the deep-seated dolerite dyke of Foum Zguid (southern Morocco). J. Geophys. Res. 115:B12108. doi: 10.1029/2010JB007638
Smith, R. P. (1987). “Dyke emplacement at Spanish Peaks, Colorado,” in Mafic Dyke Swarms, Vol. 34, eds H. C. Halls and W. F. Fahrig (St. John’s: Geological Association of Canada), 47–54.
Soriano, C., Beamud, E., Garcés, M., and Ort, M. H. (2016). “Anomalous” magnetic fabrics of dikes in the stable single domain/superparamagnetic threshold. Geophys. J. Int. 204, 1040–1059. doi: 10.1093/gji/ggv495
Sparks, R. S. J. (2013). Kimberlite volcanism. Annu. Rev. Earth Planet. Sci. 41, 497–528. doi: 10.1146/annurev-earth-042711-105252
Sparks, R. S. J., and Cashman, K. V. (2017). Dynamic magma systems: implications for forecasting volcanic activity. Elements 13, 35–40. doi: 10.2113/gselements.13.1.35
Staudigel, H., Gee, J., Tauxe, L., and Varga, R. (1992). Shallow intrusive directions of sheeted dikes in the Troodos ophiolite: anisotropy of magnetic susceptibility and structural data. Geology 20, 841–844. doi: 10.1130/0091-7613(1992)020<0841:SIDOSD>2.3.CO;2
Stephens, T. L., Walker, R. J., Healy, D., Bubeck, A., England, R. W., and McCaffrey, K. J. W. (2017). Igneous sills record far-field and near-field stress interactions during volcano construction: isle of Mull, Scotland. Earth Planet. Sci. Lett. 478, 159–174. doi: 10.1016/j.epsl.2017.09.003
Tauxe, L. (2010). Essentials of Paleomagnetism, 1st Edn. Los Angeles, CA: University of California Press.
Thomson, K. (2007). Determining magma flow in sills, dykes and laccoliths and their implications for sill emplacement mechanisms. Bull. Volcanol. 70, 183–201. doi: 10.1007/s00445-007-0131-8
Thomson, K., and Hutton, D. (2004). Geometry and growth of sill complexes: insights using 3D seismic from the North Rockall Trough. Bull. Volcanol. 66, 364–375. doi: 10.1007/s00445-003-0320-z
Trindade, R. I. F., Bouchez, J. L., Bolle, O., Nédélec, A., Peschler, A., and Poitrasson, F. (2001). Secondary fabrics revealed by remanence anisotropy: methodological study and examples from plutonic rocks. Geophys. J. Int. 147, 310–318. doi: 10.1046/j.0956-540X.2001.01529.x
Varga, R. J., Gee, J. S., Staudigel, H., and Tauxe, L. (1998). Dike surface lineations as magma flow indicators within the sheeted dike complex of the Troodos Ophiolite, Cyprus. J. Geophys. Res. 103, 5241–5256. doi: 10.1029/97JB02717
Wartho, J.-A., Kelley, S., and Blake, S. (2001). Magma flow regimes in sills deduced from Ar isotope systematics of host rocks. J. Geophys. Res. 106, 4017–4035. doi: 10.1029/2000JB900327
Keywords: sill emplacement, AMS, AARM, magma flow, British and Irish Palaeogene Igneous Province
Citation: Martin SA, Kavanagh JL, Biggin AJ and Utley JEP (2019) The Origin and Evolution of Magnetic Fabrics in Mafic Sills. Front. Earth Sci. 7:64. doi: 10.3389/feart.2019.00064
Received: 06 December 2018; Accepted: 14 March 2019;
Published: 18 April 2019.
Edited by:
Julien Leuthold, ETH Zürich, SwitzerlandReviewed by:
Gautier Nicoli, University of Cambridge, United KingdomCraig Magee, University of Leeds, United Kingdom
Ben Hayes, University of the Witwatersrand, South Africa
Copyright © 2019 Martin, Kavanagh, Biggin and Utley. This is an open-access article distributed under the terms of the Creative Commons Attribution License (CC BY). The use, distribution or reproduction in other forums is permitted, provided the original author(s) and the copyright owner(s) are credited and that the original publication in this journal is cited, in accordance with accepted academic practice. No use, distribution or reproduction is permitted which does not comply with these terms.
*Correspondence: Simon A. Martin, c21hcnRpbkBsaXZlcnBvb2wuYWMudWs= Janine L. Kavanagh, amFuaW5lLmthdmFuYWdoQGxpdmVycG9vbC5hYy51aw==