 Edward J. Anthony
 Guillaume Brunier3
- 1UM 34 CEREGE, Aix Marseille University, CNRS, IRD, INRA, Collège de France, Aix-en-Provence, France
- 2USR LEEISA, CNRS, Cayenne, French Guiana
- 3UMR 6539 LEMAR, UBO, CNRS, IRD, Ifremer, Institut Universitaire Européen de la Mer, Plouzané, France
- 4WWF Guianas, Regional Office, Paramaribo, Suriname
The 350-km long coast of Suriname, South America, is part of a unique system in the world characterized by large-scale mud supply from the Amazon and exposed to Atlantic waves. Large banks migrate alongshore from the Amazon to the Orinoco delta, separated by ‘inter-bank’ zones. Banks dissipate waves, partially weld onshore, and are colonized by mangroves, whereas waves in inter-bank areas cause shoreline erosion, mitigated where rare cheniers develop. Cheniers assure coastal protection and recreational and ecosystem services, notably providing nesting sites for marine turtles. Cheniers are also under pressure from sand mining. In order to gain a better understanding of how these cheniers form and evolve, a study was conducted on Braamspunt beach, a major turtle-nesting chenier in Suriname constructed from sand supplied by the Maroni River. Satellite images between 1987 and 2018 show a reduction of the alongshore extent of the chenier, following sand supply cut-off from the Maroni by a mud bank migrating westward towards the mouth of the Suriname River, exacerbated by mud-blanketing of sand. Commercial sand mining has further affected the beach, but mined volumes are not known. Field surveys (high-resolution topography, drone photogrammetry, wave measurements) conducted in February, 2016 highlight two chenier types depending on sand availability, transport and wave reworking: a high-tide reflective/low-tide dissipative and longshore transport-dominated type 1 exhibiting berm scarping, and a low, overwash-dominated type 2. As the mud-bank’s leading edge impinges on the inter-bank trailing edge, sand sequestering by mud and storage in type 2 washovers entail less available sand downdrift. Type 1 lost over 4200 m3 of sand in just 3–4 days. An increasingly deficient budget induces progressive change to type 2, morphodynamically better adapted to diminution of available sand, and epitomizing chenier fragmentation and isolation within the muddy Guianas coastal plain. By affecting the morphology and sand budget of Braamspunt, these changes lower opportunities for turtle-nesting. Further reduction of the length of exposed chenier is apparently halted near the Suriname River mouth where mud is liquefied by the outflowing river and tidal jet, but the continued existence of this preserved beach could be endangered by sand mining.
Introduction
The term “chenier” designates a body of wave-reworked coarse-grained sediment resting stratigraphically on a muddy substrate (Otvos and Price, 1979; Otvos, 2018). Unlike beach ridges (Scheffers et al., 2012; Tamura, 2012), cheniers are not common because their genesis depends on a specific balance between sediment availability and wave action, and, thus, they will only develop where cohesive sediments are available in large volumes with enough sand, shelly deposits, or gravel that can be reworked by waves (Nardin and Fagherazzi, 2018). Cheniers are similar to any other wave-formed beach, except that their dynamics and preservation in coastal plains are conditioned by the supply of bedload-sized sediment in a context of ambient mud abundance, such as in river deltas (e.g., Saito et al., 2000; Hori et al., 2001; van Maren, 2005; McBride et al., 2007), and adjacent to estuaries (e.g., Anthony, 1989; Hein et al., 2016); but they also develop where sand, or gravel and shells, are reworked and segregated from mud (e.g., Woodroffe and Grime, 1999) which also serves as a substrate over which the chenier develops.
Cheniers are subjected to cross-shore wave processes acting over the beach face and eventually over the back-beach area, and to longshore transport. Once formed, cheniers can build up in situ through vertical and seaward growth of the beach face where the appropriate sediment is available. More commonly, limitations in the supply of appropriate sediment result in cheniers generally undergoing more or less active landward migration over their mud substrate. This occurs by overwash as waves top the low-elevation beach and transfer sediment from the active beach face to the back-beach. As waves rich in temporarily suspended sediments overwash the beach, water rapidly infiltrates into the beach, depositing lobes of sand or shells that form washovers. Since such sand remains segregated throughout from the ambient mud (i.e., mud on the foreshore, mud underlying the beach sand, and mud on the backshore in such situations of limited sand supply) as a result of wave action, the landward-migrating chenier tends to maintain its integrity and shape across-shore and alongshore. Cheniers may occur as multiple individual ridges in muddy plains, commonly referred to as chenier plains, and are sometimes organized into bands or bundles (Otvos, 2018). Cheniers can provide various ecosystem services in their ambient mud setting. They dissipate wave energy and, thus, can protect backshore areas. In their muddy settings, cheniers also serve as settlement areas, while abandoned inland cheniers are commonly sites for coast-parallel routes, and provide aggregate for building materials in situations where this is not pernicious to their role in coastal protection.
The coast of Suriname forms the present seaward fringe of the mud-dominated Guianas coastal plain on the Atlantic coast of northern South America between Amapá, in Brazil, and the Paria Peninsula in Venezuela (Figure 1). This also represents the world’s longest muddy shoreline studded with cheniers occurring individually or in bundles between Amapá and the Orinoco River delta (Augustinus, 1978; Augustinus et al., 1989; Daniel, 1989; Prost, 1989; Wong et al., 2009; Anthony et al., 2010, 2011, 2014). This coast is exposed to trade-wind waves throughout the year, and is wave-dominated (Gratiot et al., 2007). It is the terminus of numerous rivers draining the Andes, the Andean foreland, the Llanos, and the Brazil and Guiana Shields (Figure 1). By far the most important of these rivers is the Amazon, which dominates the muddy fine-grained sediment dispersal and geological development of this coast (Anthony et al., 2010, 2014). The mud supplied by the Amazon is organized into a series of banks that migrate along the coast under the influence of waves and currents. The Guianas coastal mud-bank system is unique in the world in terms of the magnitude of alongshore mud migration. The mud is a product of the extremely high and pervasive supply by the Amazon, estimated as ranging from 754 to 1000 million tons a year (Martinez et al., 2009; Wittmann et al., 2011). Each mud bank can be up to 5 m thick, 10 to 60 km long and 20 to 30 km wide, and contain several times the annual mud supply of the Amazon (Anthony et al., 2014). A bank migrating alongshore efficiently dissipates wave energy (Wells and Coleman, 1981; Gratiot et al., 2007; Winterwerp et al., 2007), and is separated from its neighbors along the coast by inter-bank areas where, in the absence of mud-bank-induced dissipation, incident wave energy can be high and coastal erosion prevail. Since the banks migrate alongshore, the shoreline at any point will swing over time between bank (accretion) and inter-bank (erosion) phases. Cheniers develop in inter-bank areas of relatively high wave energy, and can become isolated and preserved inland through partial onshore welding of mud banks and growth of the muddy coastal plain. Each inter-bank phase results in the partial, or rarely, total removal, of the coastal stratigraphic package built during accretionary bank phases (Allison and Lee, 2004). Total removal of the stratigraphic package deposited during a bank phase can occur during a subsequent inter-bank phase characterized by particularly high wave-energy seasons such as during El Niño years (Gratiot et al., 2007). More commonly, removal is partial, signifying that there is a net growth of the coastal plain (Allison and Lee, 2004), potentially leading to chenier isolation with each growth cycle. Cheniers have played an important geological role in the building of the Guianas coastal plain over the last 5–6000 years (Augustinus, 1978; Augustinus et al., 1989).
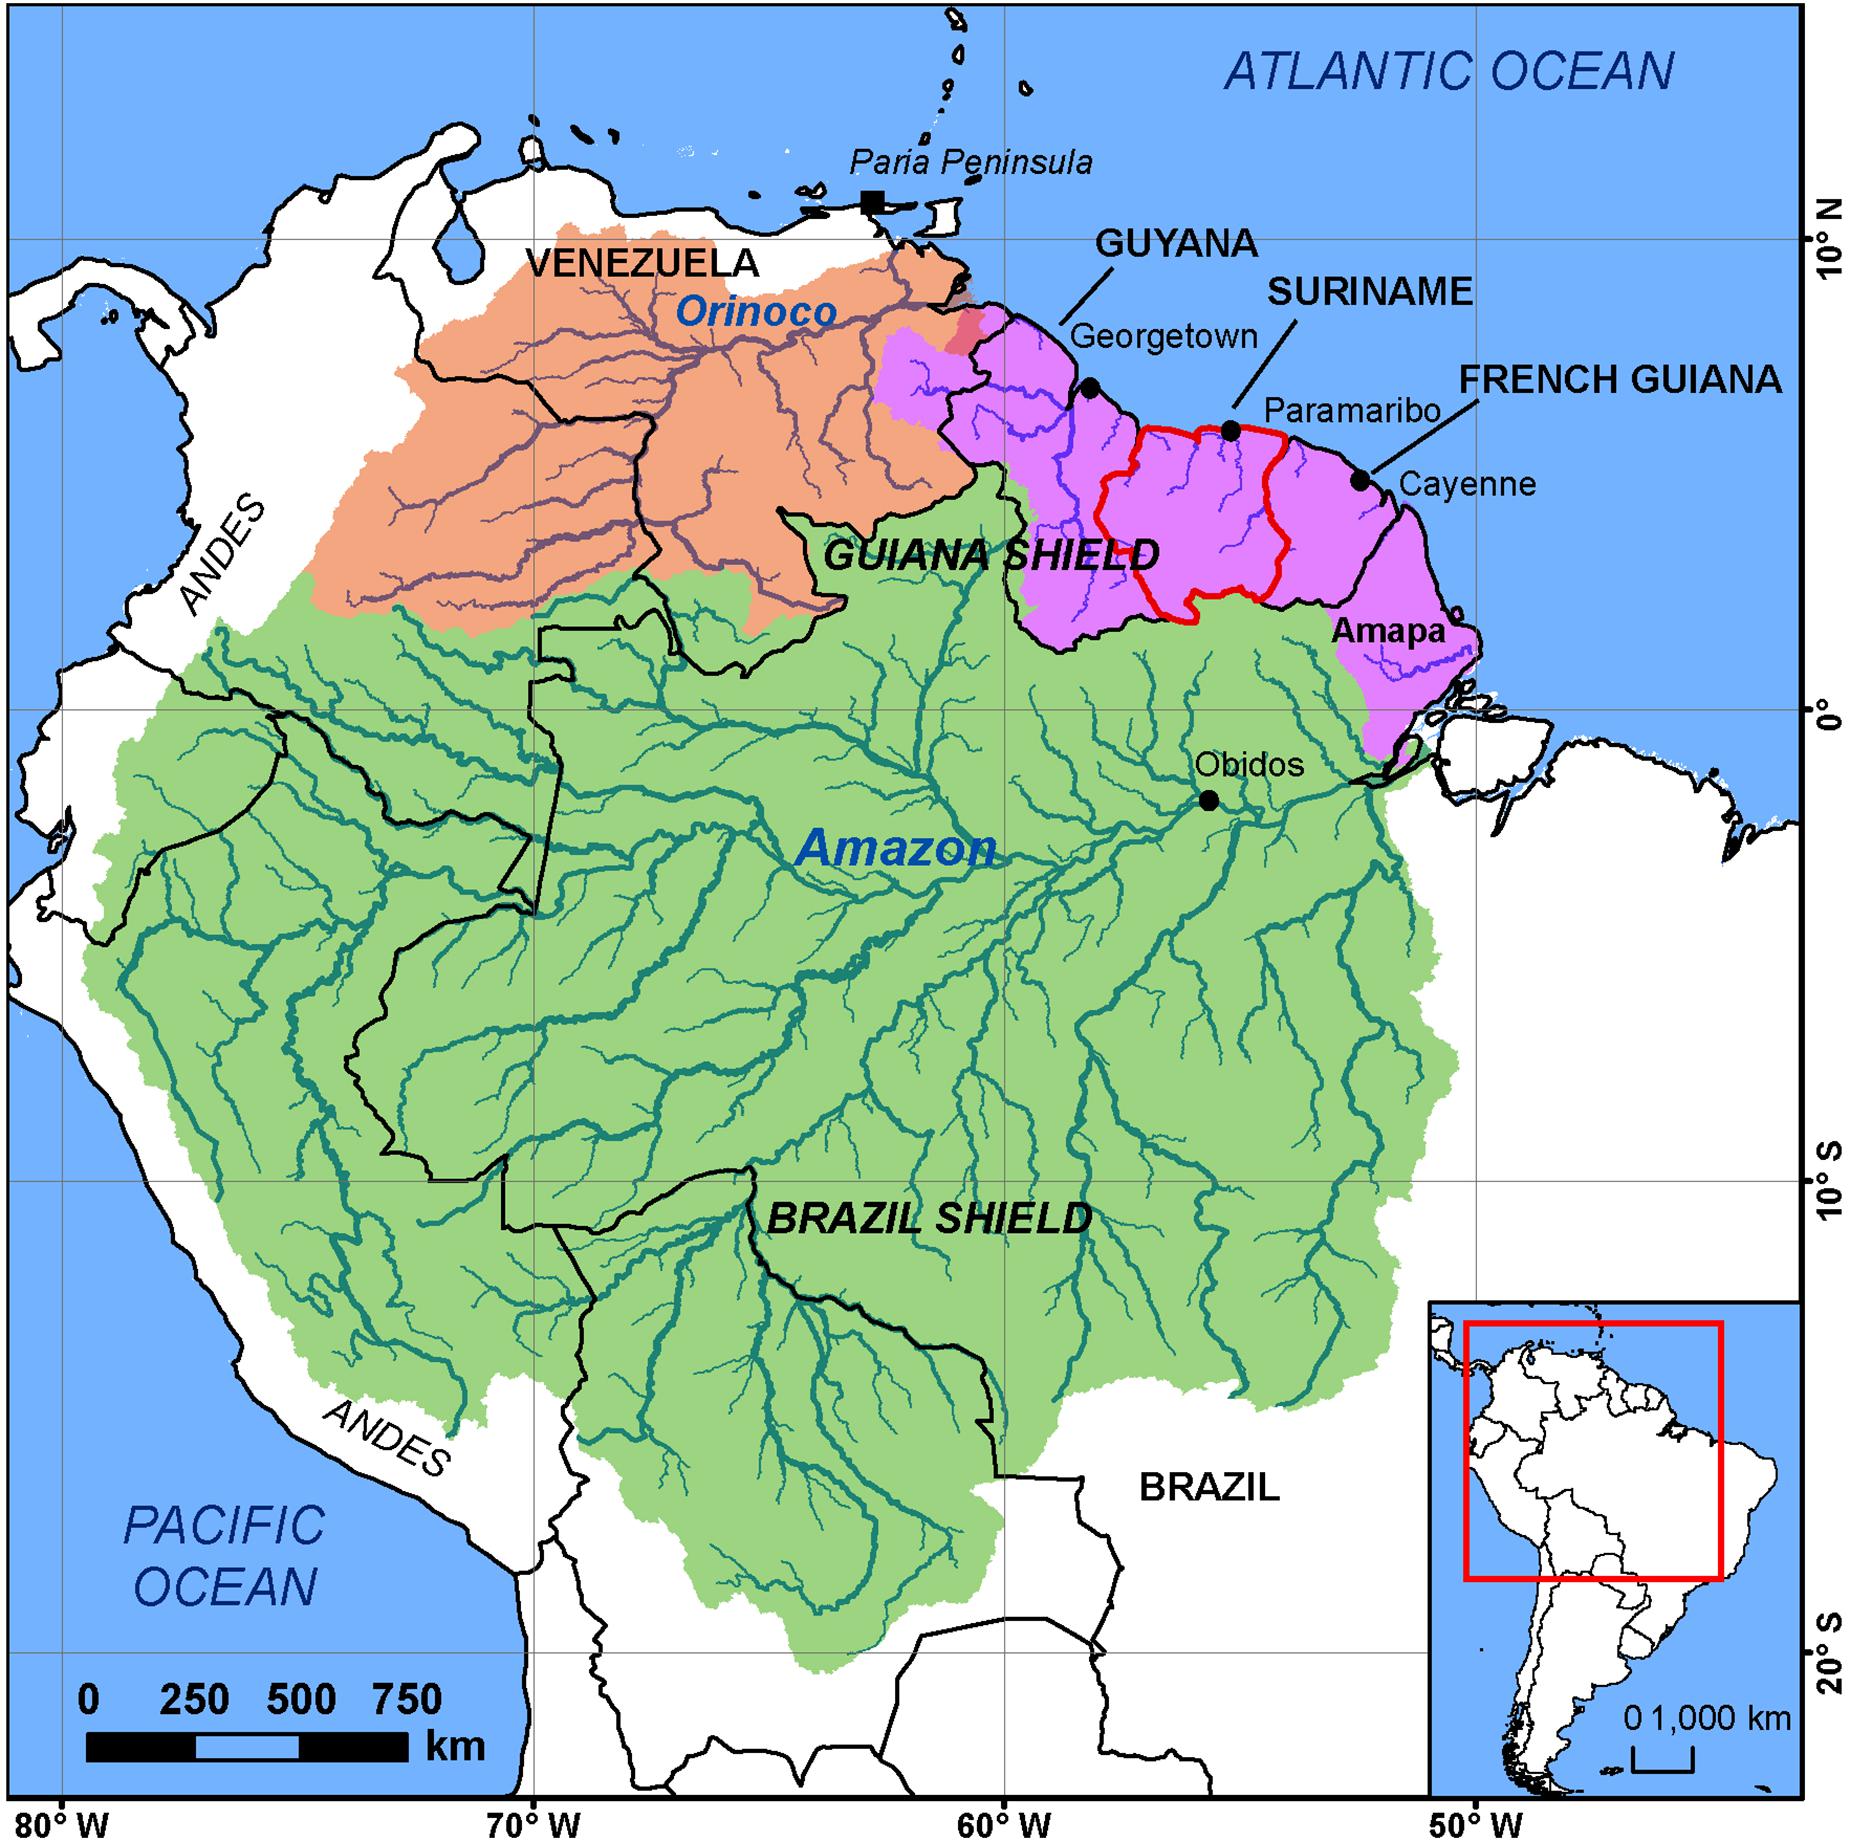
Figure 1. Map of Suriname and the Amazon-Orinoco coast and the drainage basins of the Amazon and Orinoco Rivers and, collectively, the smaller Guiana Shield rivers between Amapá, in Brazil, and Guyana.
The development of cheniers is conditioned by the availability of sufficient sand and shelly sand that are sorted out and concentrated by waves to form coherent sand bodies in this overwhelmingly muddy environment. Pujos et al. (1990, 2000) concluded from heavy-mineral analyses that the quartz-dominated beach sands were derived exclusively from local sources and not winnowed out from the migrating Amazon mud banks. The most important sources of sand are the numerous smaller Guiana Shield rivers between the Amazon and the Orinoco (Figure 1). The hydrology and sediment fluxes of many of these rivers, which drain crystalline rocks, are still largely unknown. Even the catchment size of many of these rivers is not known with certainty. Cheniers are especially common in the vicinity, and downdrift, of the mouths of these rivers, developing in locally sand-rich settings but that are very largely dominated by mud from the distant Amazon. In addition to fluvial sand, marine carbonate debris (whole and comminuted shells), derived from the abundant skeletal remains of organisms that thrive in the rich ecosystems associated with the Amazon-Orinoco mangrove system, is also reworked onshore by waves. Finally, older cheniers inland can also be reworked to form new cheniers where coastal erosion has removed mud deposited during a previous bank phase. Coherent sand bodies can, thus, be formed in spite of the overwhelmingly muddy environment of the Guianas coast, through the local concentration of sand near, and downdrift of, river mouths, and through local efficient segregation of sand and shells from mud. The formation of such coherent sand bodies is also important as it represents an efficient way of further dissipating high incident wave energy during inter-bank phases.
Cheniers are actively exploited in the Guianas for aggregate to cater for the needs of urban and infrastructure development in the face of the rapid demographic growth characterizing this region. When practiced on active open-coast cheniers, this mining activity can have a deleterious effect on these deposits and the ecosystem services they provide. Although many rivers debouch through the Guianas coastal plain, there is a relative paucity of available sand in the coastal zone. Fluvial sand discharged to the coast is commonly buried by the abundant and pervasive Amazon mud, including in deeper inter-bank areas (Anthony et al., 2010), while estuarine sandy bedload is commonly draped with mud (Sottolichio et al., 2018). The rare and currently active cheniers of the Guianas coast also provide beach recreation outlets for the coastal populations, and, as nesting sites, are especially fundamental to the ecology of the protected marine turtles: Lepidochelys olivacea, Chelonia mydas, Eretmochelys imbricata, Dermochelys coriacea (Girondot et al., 2002; Péron et al., 2013).
In order to contribute to a better understanding of how cheniers develop in response to the large-scale regional mud-bank dynamics, a study was conducted on Braamspunt beach (Figure 2A), a remnant of a sandy chenier in Suriname that has been strongly modified by natural mud-bank activity over the last three decades. Braamspunt beach is close to the city of Paramaribo and provides a recreation outlet for the urban population. It is also an important turtle-nesting site on the 350 km-long Suriname shoreline, especially for leatherback turtles (Dermochelys coriacea). Over 80% of the Suriname coast is currently muddy (Gensac, 2012; Anthony, 2016), thus restricting considerably the availability of sandy beaches for turtles. The backshore wetlands behind Braamspunt beach are also an important habitat for shorebirds and other wildlife. The proximity of Braamspunt beach to the growing city of Paramaribo has also exposed the beach over the last two decades to commercial sand mining. Unfortunately, there has been no stock-taking of the volumes of sand extracted from Braamspunt beach over this period. In conjunction with changes induced by mud-bank activity, sand mining leads to a reduction of beach sediment budgets and impacts beach space available for recreation and for turtle-nesting. Here, we analyze the recent multi-decadal evolution of the Braamspunt chenier in response to mud banks and the morphodynamic changes in the remnant beach associated with this evolution. We expose the nefarious effects of sand mining in generating vulnerability of the beach, impairing its role in coastal protection and as a major site for marine turtle-nesting.
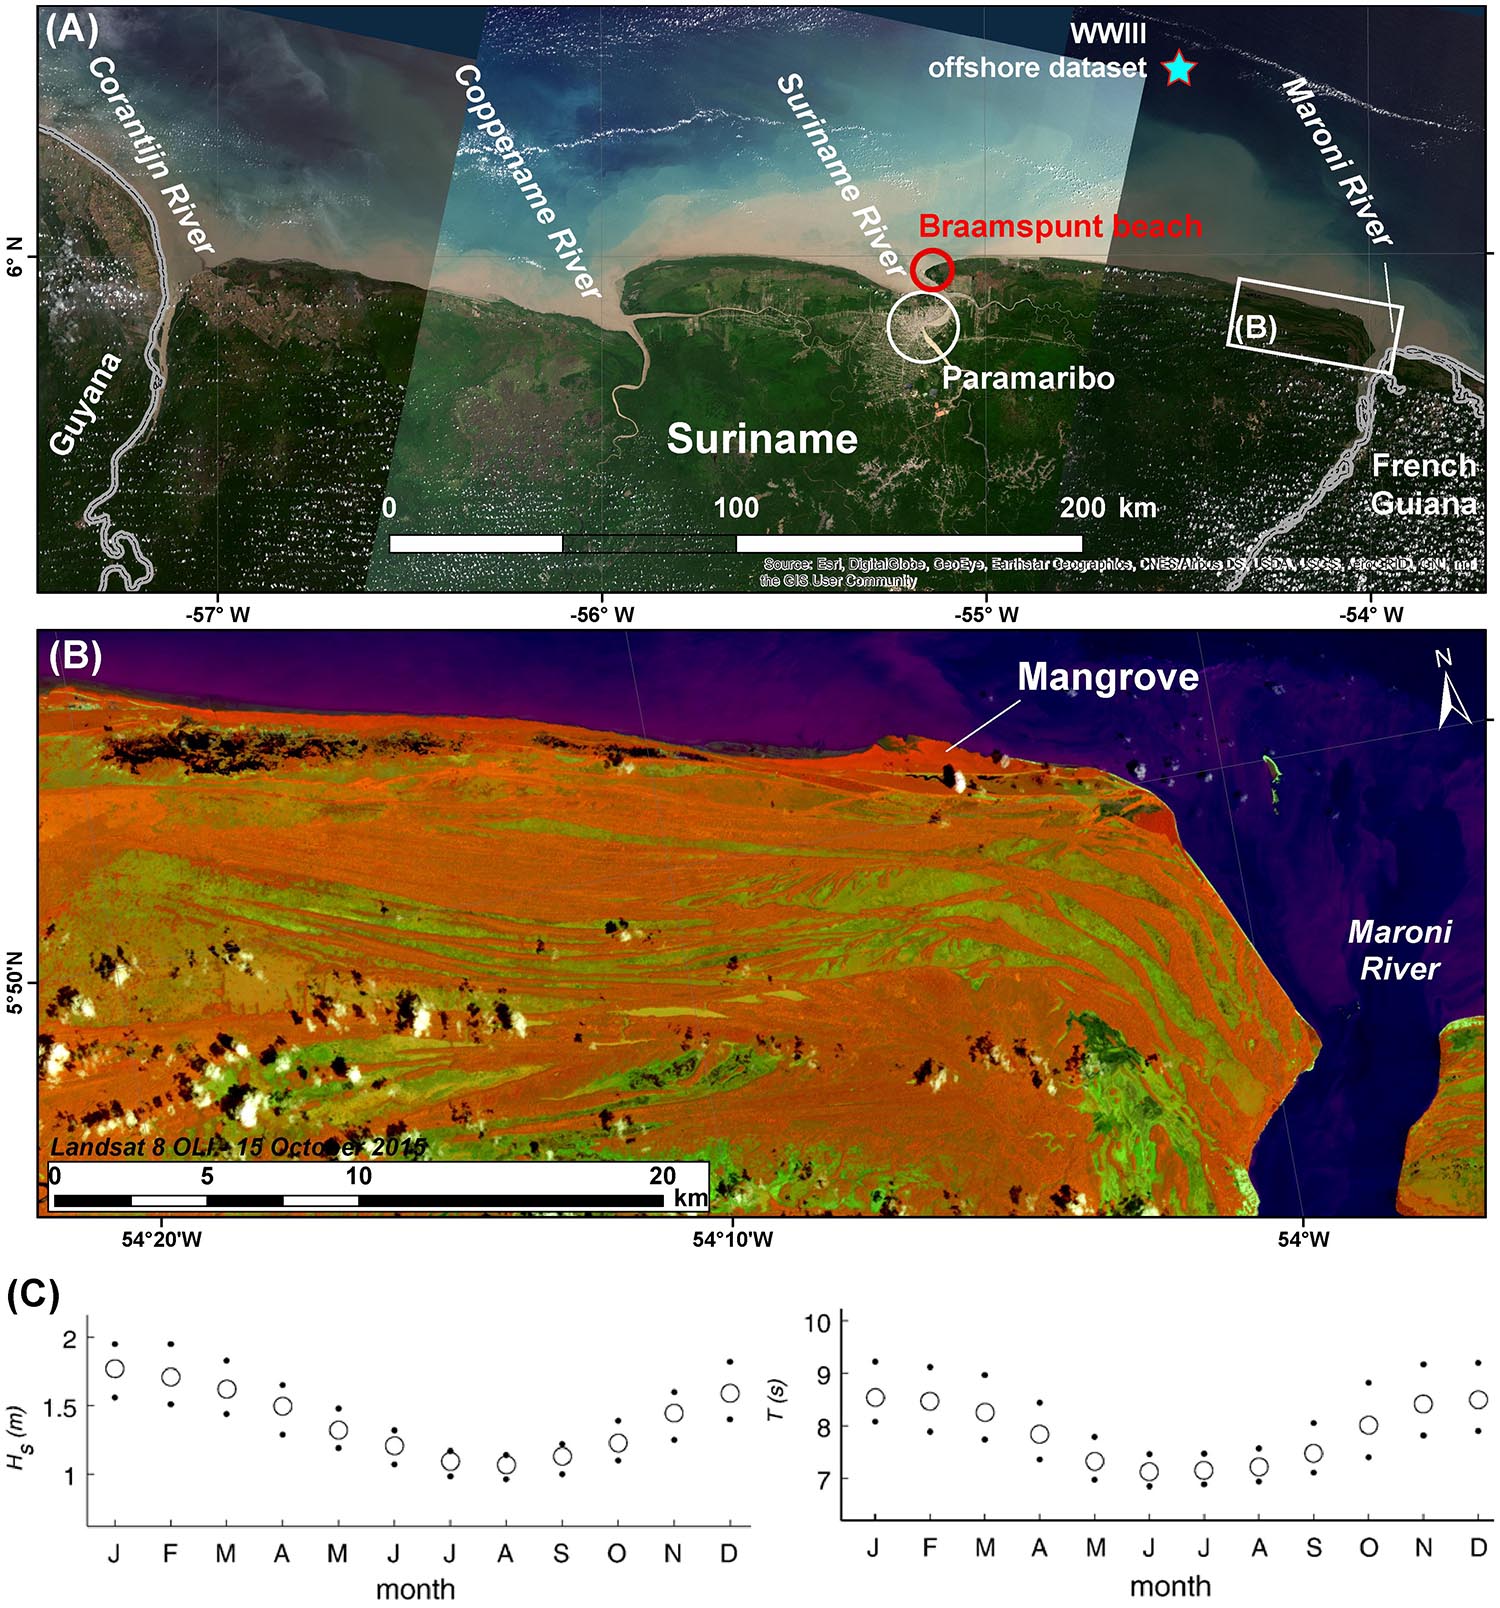
Figure 2. Landsat image (2015) of the Suriname coast, location of Braamspunt chenier near the mouth of the Suriname River, and offshore WWIII data collection point for the field study (A); Landsat image (2015) showing cheniers (vegetation in dark orange) separated by linear swamp depressions (light green) and running west from the mouth of the Maroni River between Suriname and French Guiana (B). The diversity in orientation, length, width, and grouping of these cheniers reflect space- and time-varying bank and inter-bank dynamics. The dark red hue along the coast represents seafront mangrove swamps; (C) daily averages of wave-climate parameters, significant wave height Hs and wave period T, derived from a 44-year record of the ERA-40 (European ReAnalysis) wave dataset generated by the European Centre for Medium-Range Weather Forecasts (ECMWF) for the location 5° N, 52° W (modified after Gratiot et al., 2007). Dots correspond to the first and third inter-quartiles, and circles to the median values.
Setting of Braamspunt Beach
The migrating mud banks in the Guianas tend to cause a westward deflection of the mouths of the small rivers. The deflection commonly results in more or less prominent mud capes colonized by mangroves, reflecting the overarching influence of mud accumulation in transit from the Amazon. Braamspunt beach lines the mud cape between the mouths of the Maroni and the Suriname Rivers (Figure 2A). Mud capes and their associated cheniers generally provide shelter for parts of the coast to the west (downdrift direction on the Guianas coast) from direct attack by ocean waves coming from the northeast (see below). Paramaribo is niched on the west bank of the cape deflecting the mouth of the Suriname River. It is important to note that this deflection is less expressed where large rivers debouch on the coast. Fine examples are provided by the two large rivers at the borders of Suriname, the Maroni and the Corantijn Rivers (Figure 2A). Braamspunt beach, in what may be considered as its ancestral version (i.e., prior to the ongoing changes engendered by a mud bank, and described in this paper), is a fine example of an open-coast chenier in the Guianas. The proximity of large reservoirs of sand in the middle-ground bars at the mouth of the Maroni River suggest that the sand on Braamspunt beach has come from this river, supplemented by a small fraction of shelly debris winnowed out from the nearshore zone. The source function of the Maroni River is clearly expressed by the numerous cheniers that run west from the mouth of this river (Figure 2B). Braamspunt beach ends in spit recurves that reflect wave refraction at the mouth of the Suriname River.
The Suriname coast is affected by trade winds from the northeast that are mainly active from January to May. These winds generate rains on the coast from December to July, with an intervening relatively dry month in March. The annual rainfall in the coastal zone varies from 2 to 3 m. Trade winds are also the main generators of waves from the North and Central Atlantic Ocean (Figure 2C). These waves come from an east to northeast direction (Gratiot et al., 2007). Waves have significant periods (Ts) of 6 to 10 s, and significant offshore heights (Hs) of 1 to 2 m, the longer periods (>8 s) being associated with short spates of large swell waves generated by North Atlantic storms in autumn and winter and by Central Atlantic cyclones in summer and autumn. These longer waves have a directional range from north to north-northwest. The Suriname coast is, thus, essentially a wave-dominated coast, characterized by a clear seasonal regime. The most energetic trade-wind waves occur from December to April whereas swell waves appear to be most frequent in autumn and winter, reinforcing the relatively energetic winter to early spring wave regime induced by the trade winds. The wave climate shows variations in wave height at timescales ranging from multi-annual, hinged on El Nino phases, to multi-decadal, in association with large-scale atmosphere-ocean interactions in the North Atlantic (Walcker et al., 2015). Tides are semi-diurnal and the spring tidal range in Suriname is low-mesotidal, ca. 2 to 3 m.
Materials and Methods
Mesoscale (Multi-Decadal Changes)
In order to track the recent multi-decadal shoreline changes along the coast of Suriname between the mouths of the Maroni and Suriname Rivers, and hence determine the changing status of the ancestral and current forms of Braamspunt beach, 10 Landsat 5 to 8 images covering the interval from July, 1987 to January, 2016, acquired from the United States Geological Survey (USGS), and two Sentinel 2A MSI (October, 2018), acquired from the European Space Agency (ESA), were used. The image resolution is 30 m for the earliest Landsat 5 TM (1987) images and 15 or 30 m for the most recent Landsat 8 OLI-TIRS (2016) images. The selected Sentinel images have a 10 m-resolution in the visible and near-infrared bands. Images corresponding to the dry season were selected in order to avoid as much as possible cloud cover. The coordinate reference used for this study is the Universal Transverse Mercator (UTM) zone 21N, which comprises Suriname, associated with the Global Geodesic system WGS 1984 datum. In addition to the shoreline and its changes, the outlines of mud banks were also identified.
Regarding shoreline discrimination and change, only the 10 Landsat images were used. All the images have good overlap, and default USGS georeferencing. The shoreline was digitized for each image, using, as a reference, the external limit of vegetation. Long experience with the Guianas and other tropical coasts shows that the seaward mangrove fringe constitutes a good shoreline marker except where sandy beach deposits occur, colonized by grass vegetation with a clear seaward limit. Shoreline mobility was statistically analyzed using the ArcMap extension module Digital Shoreline Analysis System (DSAS), version 4.3, coupled with ArcGIS® v10.2.2 (Thieler et al., 2009). The shore-normal distance of the vegetation line relative to a base line for each two sets of dates was calculated every 250 m alongshore. This distance was then divided by the time in years between two dates to generate a shoreline change rate, the End Point Rate (EPR) in DSAS 4.3, expressed in m a year.
The total annual error (E) of shoreline change rate was then defined from the following equation (Hapke et al., 2006):
where d1 and d2 are the uncertainty estimates of shoreline position for the successive sets of images and T is the time in years between image sets. The uncertainty of the shoreline position is defined by twice the pixel resolution. The obtained error E ranged from 3.4 to 8.5 m a year between 1987 and 2015.
Field Surveys of the Morphology and Dynamics of Braamspunt Beach
Two ground surveys were conducted on Braamspunt beach on February 9–10 and February 13–14, 2016, in order to map the morphology and grain-size properties of the beach, and characterize the wave conditions (Figure 3A). The experiments were aimed specifically at highlighting the morphodynamics and sand transport patterns that drive change on Braamspunt beach, and the beach sediment budget. They covered a spring-to-neap tidal cycle. Fortuitously, the experiments also coincided with marked variation in wave conditions between the two surveys. High-resolution topographic surveys were conducted in the course of the two field experiments using a Trimble R8 differential global positioning system (DGPS) in Real-Time Kinetics (RTK) mode. The system consists of a fixed station and a mobile station used to record the geographical coordinates and elevations of ground points. The two stations were linked by radio, which introduced a constraint since the radio signal could be lost over a distance of a couple of kilometers. The mobile unit comprised a GPS antenna and a computer that enabled acquisition and storage of data collected at 1 s-intervals over the beach. The mobile station was transported in a backpack most of the time by an operator carrying out the survey, but constraints imposed by time and tide also led us to use an all-terrain vehicle (Figure 3B). A total of 56,900 points were surveyed (23,050 on February 10 and 33,850 on February 13–14), giving an overall density of 1 point for every 50 cm of beach. The base station deduced corrections that were relayed to the mobile antenna which then applied these corrections and computed x, y, z coordinates. In the absence of a topographic reference system and benchmarks at Braamspunt beach, we resorted to the Universal Transverse Mercator (UTM) zone 21N, which comprises Suriname, associated with the Global Geodesic system WGS 1984 datum. Elevation data were referenced to the world geoid EGM96 (Earth Gravitational Model) representing mean sea level. The constructor’s (Trimble, Ltd.) error margin is ±1 to 2 cm for the x and y coordinates and ±2 to 3 cm for the z coordinate. 2.5-m cell digital elevation models (DEMs) of the gridded images were computed from the data using the Delaunay triangulation method. The comparison of the DEMs of the two surveys, named Differences of DEMs (DoDs), highlighted short-term variations in the subaerial beach volume that coincided with the shift from spring to neap tides and a significant drop in incident wave energy observed over the week of the surveys.
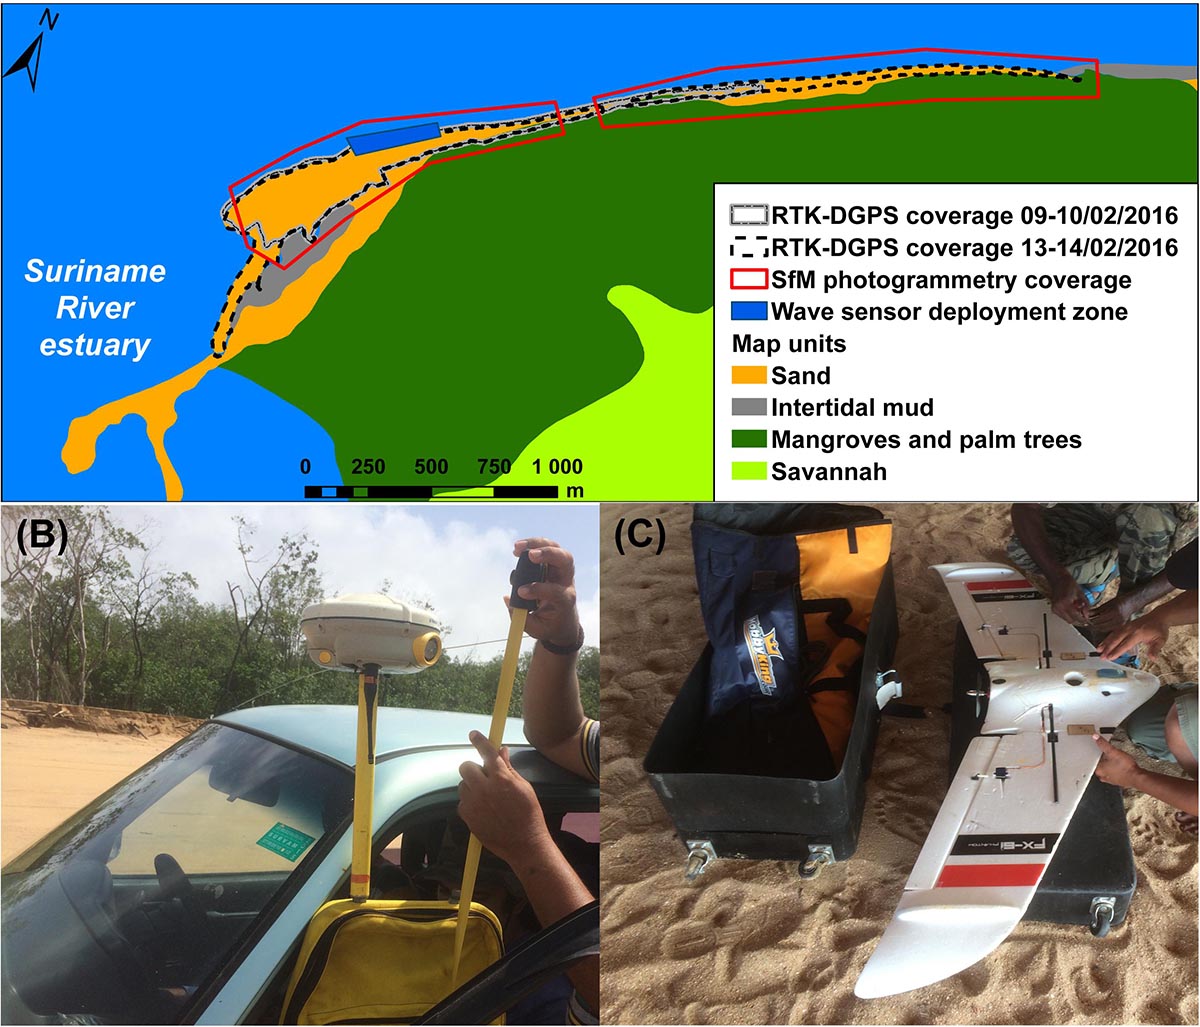
Figure 3. (A) Experiments conducted on Braamspunt beach in February, 2016 and their ground coverage; (B) mobile GPS station on an all-terrain vehicle; (C) drone with custom-built wings used for photogrammetric survey.
In addition to high-resolution ground surveying, topographic details of the beach were also obtained from aerial photogrammetry using a drone with custom-built wings (Figure 3C) and a camera provided and operated by the Nature Conservation Division of Suriname. Photogrammetry has, over the last decade, undergone significant new developments related notably to the workflow technique called Surface-from-Motion (SfM) (Westoby et al., 2012). SfM photogrammetry enables the production of high-resolution morphometric models and derived products such as digital surface models (DSMs) and orthophotographs. The technique has been applied in the mapping of a beach under the influence of mud banks drifting alongshore from the mouth of the Amazon near Cayenne, in neighboring French Guiana (Brunier et al., 2016). Several flights were operated over two sectors (west and east) of Braamspunt beach separated by the launching area near our field base (Figure 3C). A pocket-sized CANON Powershot S100 camera with a 12.1 MP ‘high sensitivity’ CMOS sensor was used to obtain photographs. The drone flew close to the ground (<100 m) in order to obtain a picture resolution less than or equal to 3.5 cm ground size pixel (GSD), and a scene size corresponding to a 120 m × 80 m picture footprint. We calibrated the parallax parameters using an overlap between pictures of about 85% end-lap in the lengthwise flight direction and about 50% side-lap between paths. Considering the scene size and the parallax parameters, the drone was flown at a speed of 70 km/h in order to keep an end-lap ratio with a shooting range of one picture per second. Moreover, we defined numerous parallel flight axes spaced 10s of meters. The stereopair alignment using SfM-photogrammetry was based on targets (Ground Control Points or GCPs) of 40 cm × 40 cm deployed on the beach and accurately georeferenced in RTK-DGPS. Furthermore, we sampled, randomly over much of the beach, and more selectively where features of interest occurred, numerous points named Ground Truth Points (GTPs), in order to assess the quality of our DSM. GTPs consisted of identified landmarks and deployed 05 m × 0.5 m plywood boards with an easily discernible black-and-white checker-board pattern. The SfM-photogrammetry workflow was operated using Agisoft Photoscan Professional software1. Successive DSMs can be used to establish temporal changes in beach sediment budget in the same way as DEMs can be used for this from high-resolution ground topographic survey data. In the case of Braamspunt beach, a photogrammetry-based succession of changing beach budgets was not carried out because only one DSM of the beach was obtained in the course of the experiment.
Tidal curves of the semi-fortnightly variation in water level in the course of the survey were constructed from theoretical tidal data provided by the French Service Hydrographique et Océanographique de la Marine (SHOM). The water levels do not, therefore, include oceanographic forcing effects such as ocean level setup by air pressure changes, and wind and wave forcing. In the course of both experiments, up to three NKE®-SP2T pressure sensors, equipped with turbidity sensors, were deployed on the beach in its distal part near the tip of Braamspunt (Figure 3A), and sampled continuously at 2 Hz. Sensor accuracy is 0.02 m. Wave heights and water levels under these values were neglected. Wave spectra were calculated over bursts of 20 min using fast Fourier transforms with a Hanning window of 600 s and 75% overlap (Sénéchal et al., 2001). A correction factor with a cutoff at 0.5 Hz was applied to account for the non-hydrostatic pressure field, as proposed by Horikawa (1988). For each burst, significant wave height (Hs) and peak period (Tp) were calculated in the spectral window [0.11; 0.5] Hz. Unfortunately, only one turbidity record could be exploited. We set a limit of 0.05 Hz between the gravity and infra-gravity wave domains. Offshore wave data (see Figure 2A) during the study period were derived from the third-generation Wave Watch III (WWIII) database of the National Oceanic and Atmospheric Administration (NOAA) of the United States2. WWIII is a spectral wave model that describes complex sea surface states based on wind data. WWIII calculates sea surface states every hour for regular spatial grids of half a degree of longitude and latitude. The model produces wave heights in meters (m), periods in seconds (s) and directions in degrees (°) for each grid cell.
Finally, 20 sediment samples were collected from the beach (Figure 3A) in order to determine grain-size characteristics and the carbonate (shell) content of the beach sand relative to the dominant quartz fraction. The samples were analyzed using a Beckman Coulter laser grain-size type LS 13 320. Samples were analyzed in the aqueous phase and particles ranging in size from 40 to 2000 μm were determined. A single grain-size curve was used to describe the entire spectrum of each sample. The percentage of carbonates in each sand sample was determined after passing it through hydrochloric acid to eliminate the organic fraction, leaving the residue of minerogenic sand.
Results
Mud Banks and Braamspunt Beach (1987–2016)
We identified at least two mud banks over the 29-year period of analysis (1987–2016) from the Landsat images. The alongshore continuity of the Braamspunt chenier, the beach sediment transport cell between the mouths of the Maroni and the Suriname Rivers, and the shoreline morphodynamics, have been controlled by bank attachment episodes between July, 1987 and October, 2015 (Figure 4). In 1987, this alongshore continuity of the beach from the Maroni River source to the Suriname River sink was masked by the attachment of mud bank 1 along much of the coast between the two river mouths (Figure 4A). This limited the functional Braamspunt chenier to a stretch of about 50 km east of the mouth of the Suriname River, the rest of the updrift chenier isolated by the mud bank, the inner, shore-welded, part of which was mangrove-colonized. East of the trailing edge of the mud bank, sandy beaches in the Maroni source area can be identified (Figure 4A). The 1999 image shows a chenier system fragmented by shore-attached mud (Figure 4B). In 2009, the active Braamspunt beach had been reduced in length to about 25 km, as a result of the persistence of mud-bank activity between the two river mouths, marked by the presence of a smaller bank (mud bank 2) near the mouth of the Maroni (Figure 4C). A further reduction of the length of the beach down to 8 km is observed in the 2015 image (Figure 4D). A date-to-date comparison of the satellite images shows successions of shoreline advance (mud bank) and retreat (inter-bank) at inordinately large rates exceeding 120 m a year in places (Figures 5A–C).
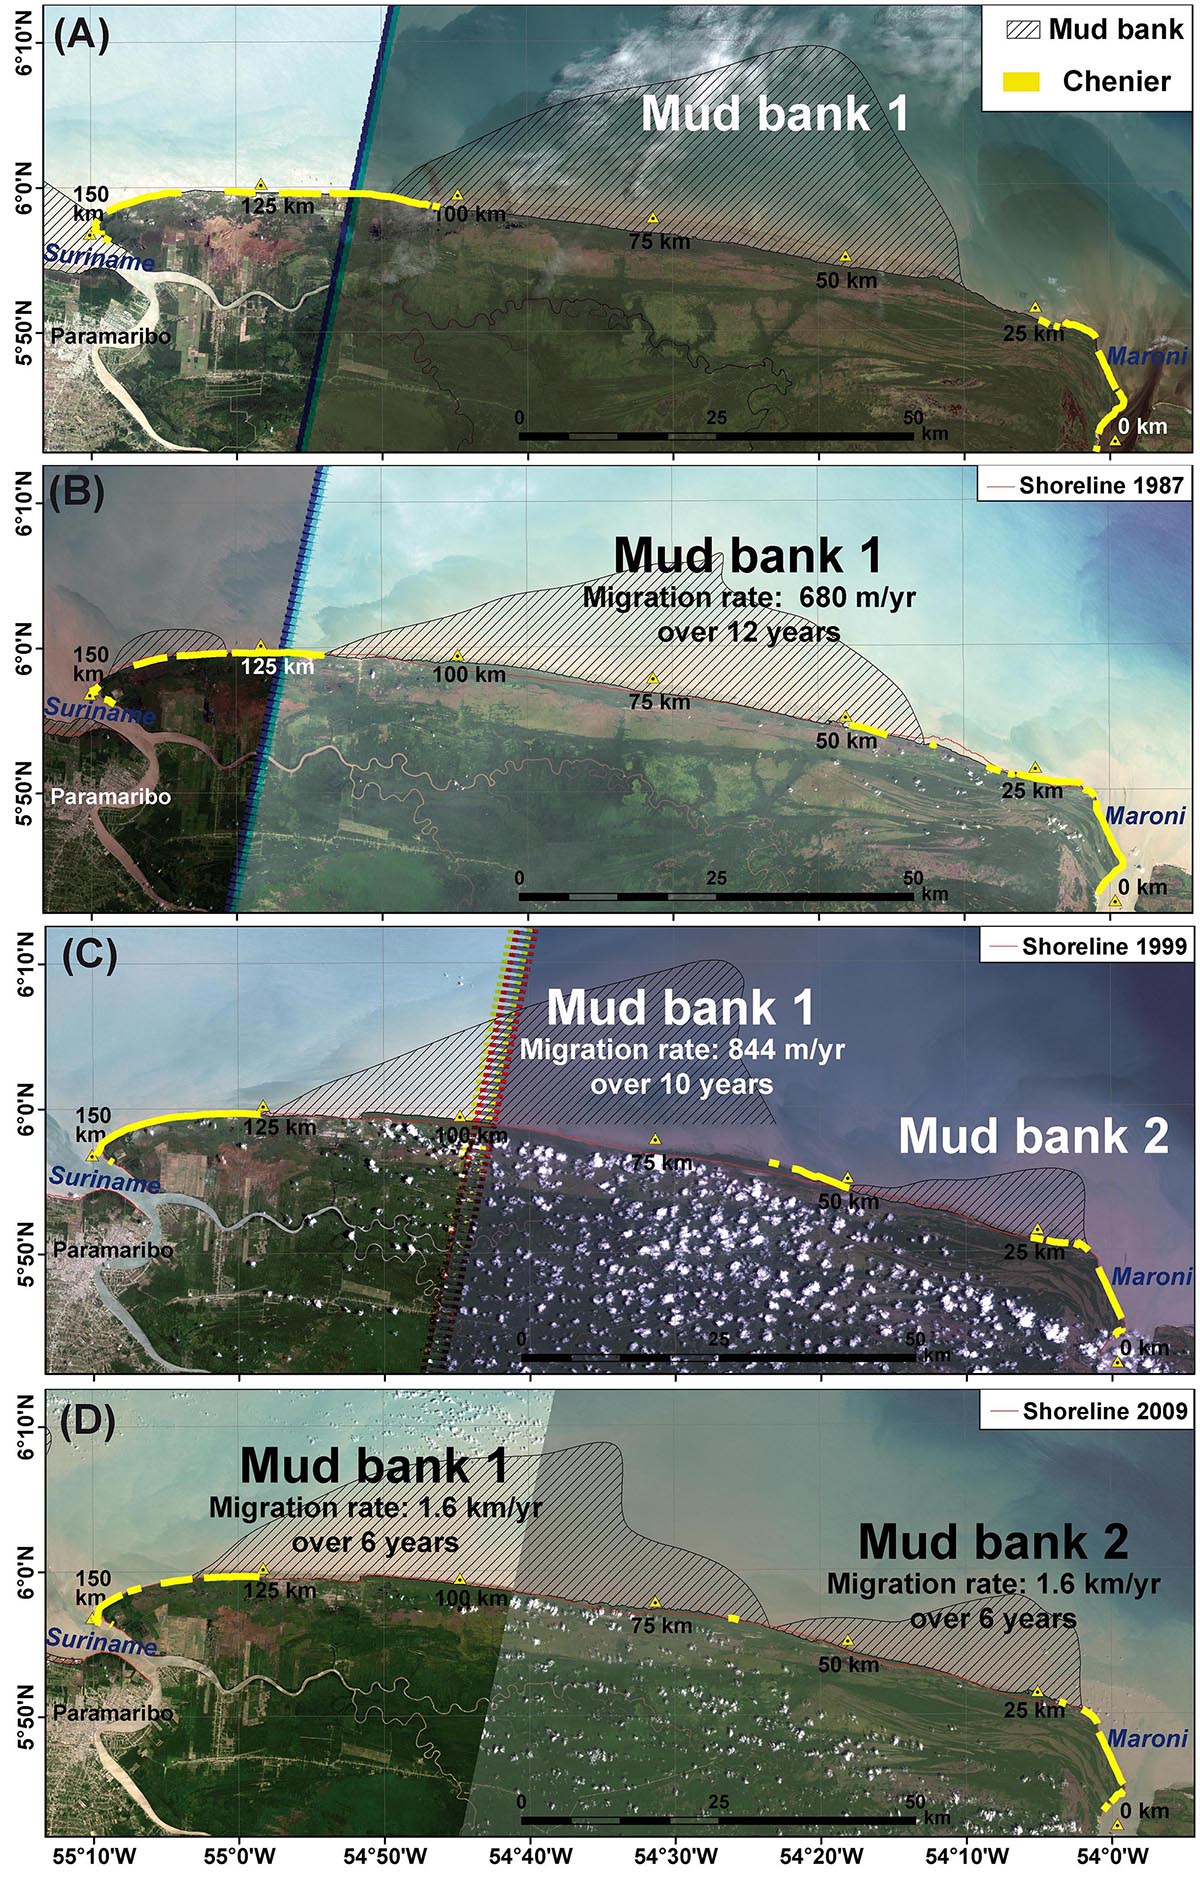
Figure 4. Landsat images of analyzed shoreline changes between the Maroni and the Suriname Rivers (October 1987 to October 2015) showing the impact alongshore of migrating mud banks (muddy shoreline accretion) and inter-bank areas (shoreline erosion characterized by the landward-migrating Braamspunt chenier): (A) situation in 1987; (B) situation in 1999 with the 1987 shoreline; (C) situation in 2009 with the 1999 shoreline; (D) situation in 2015 with the 2009 shoreline.
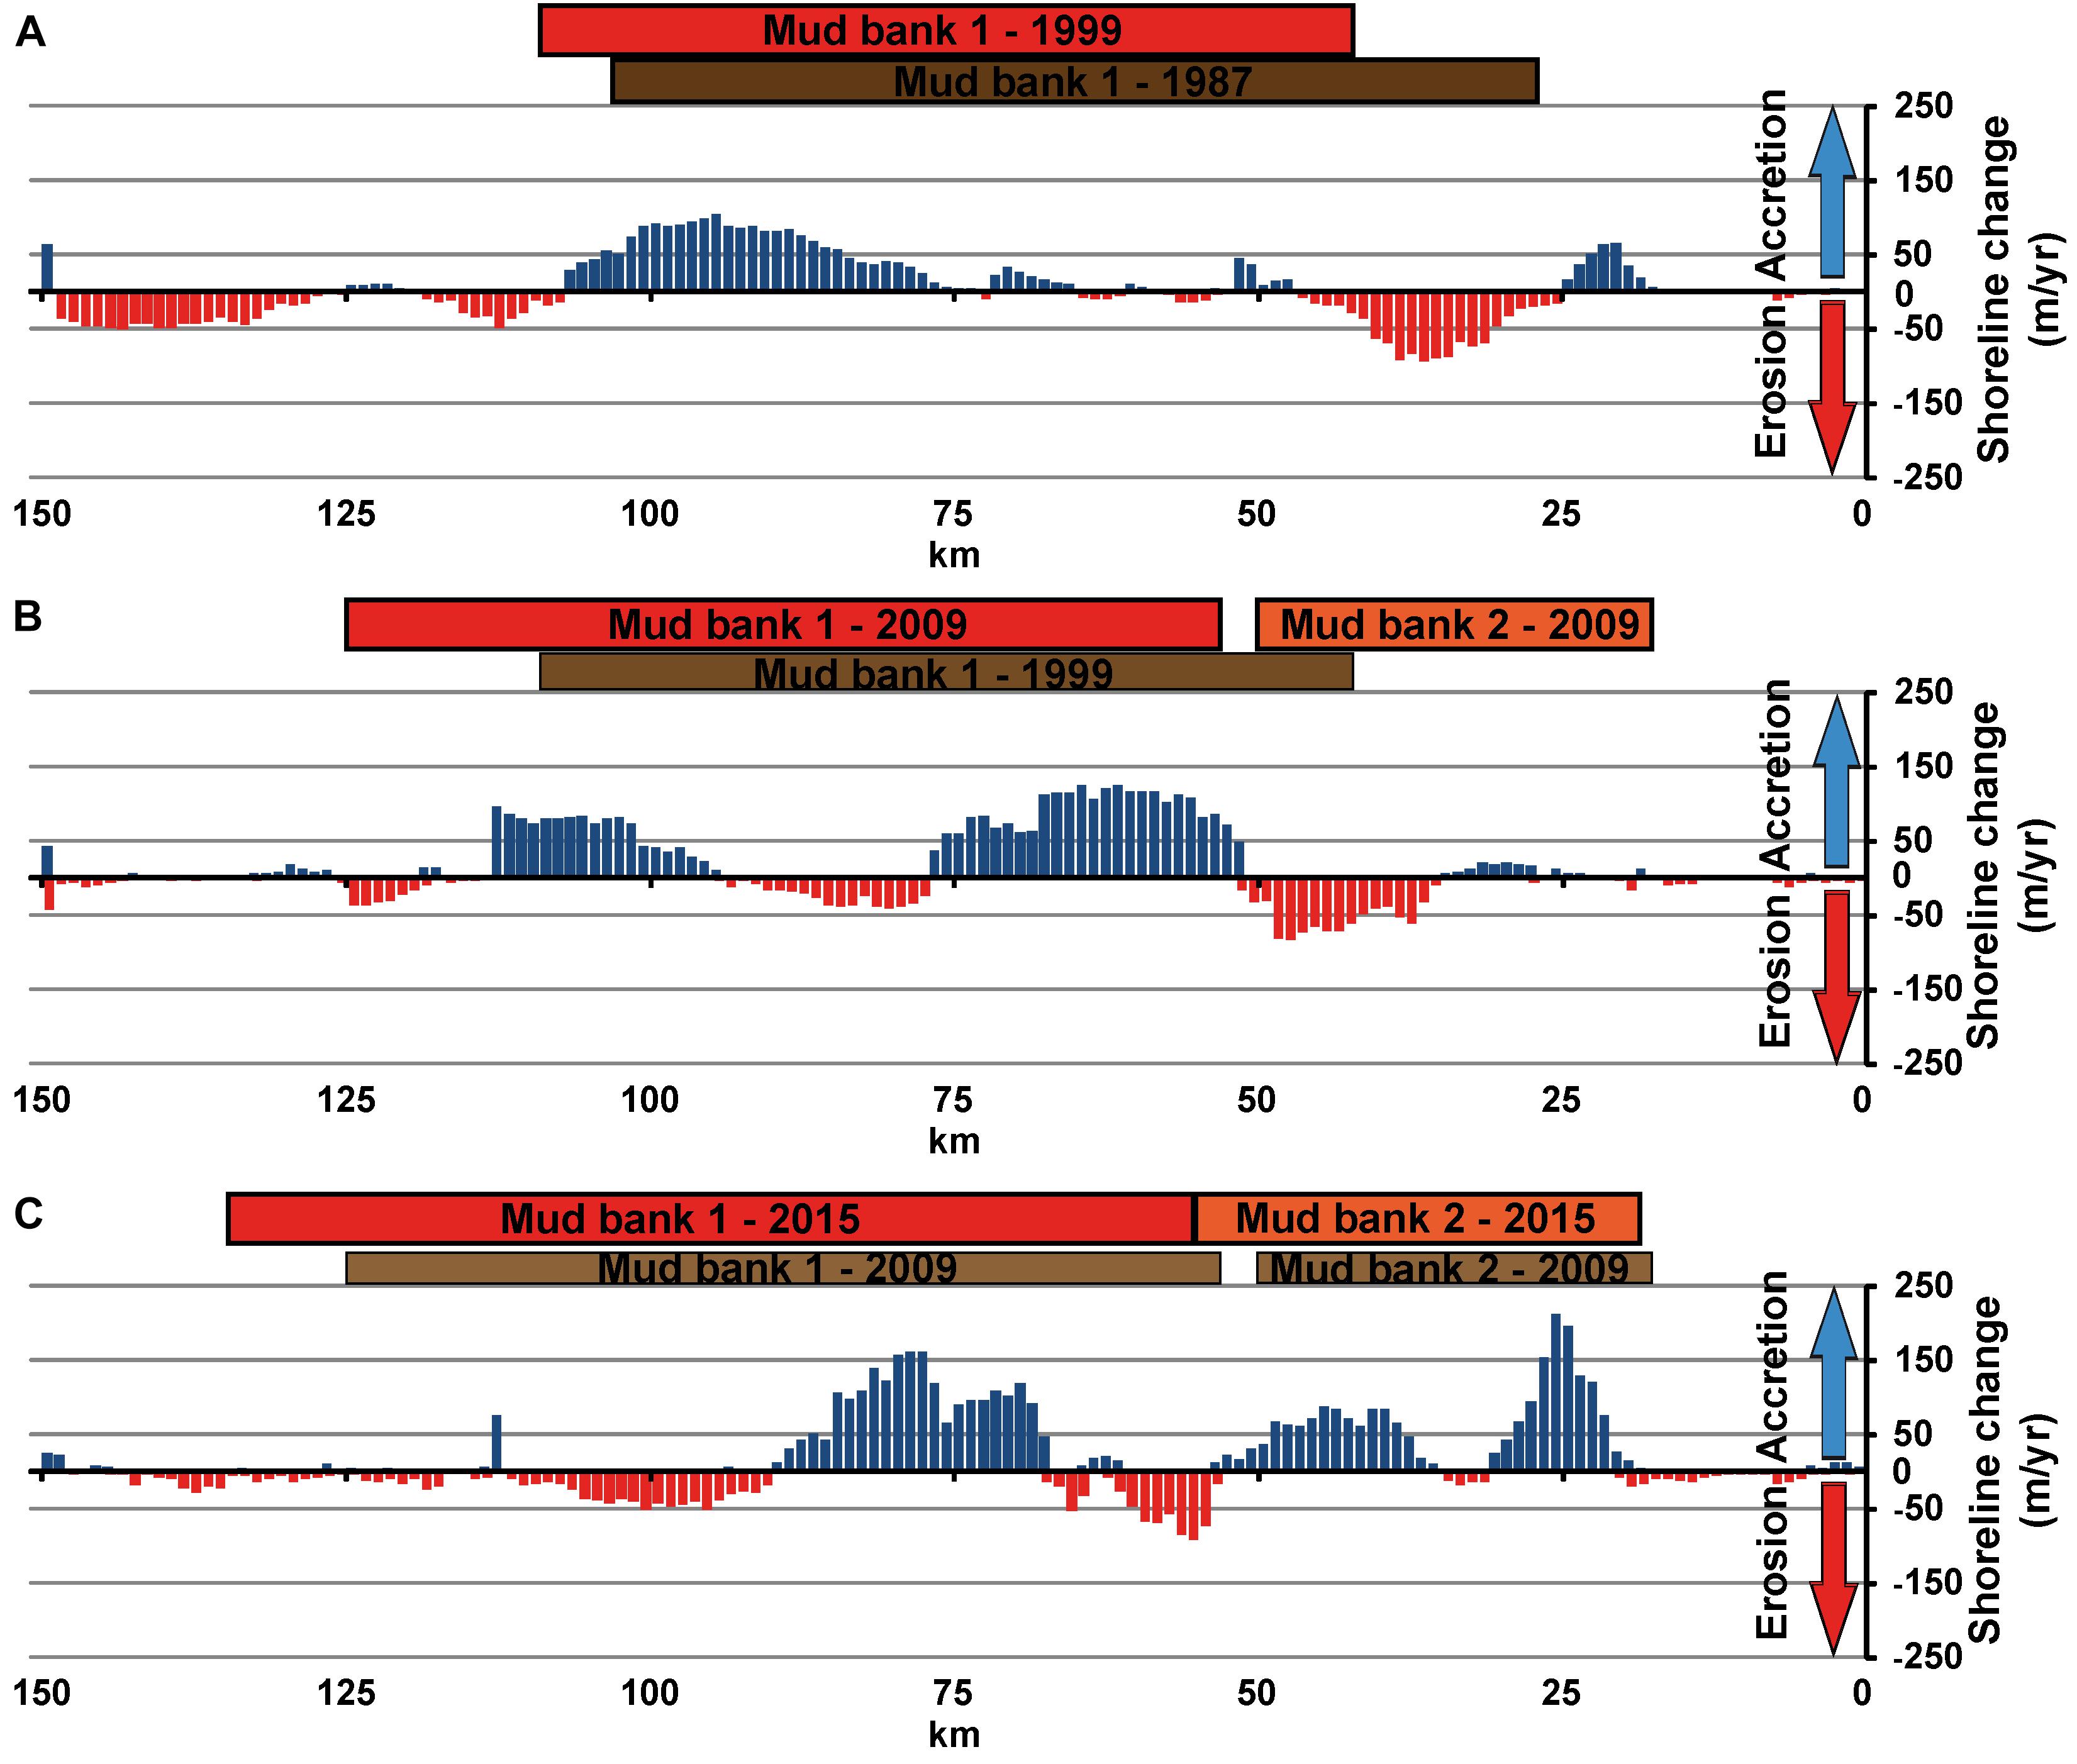
Figure 5. Graphs of analyzed shoreline changes between the Maroni and the Suriname Rivers (October 1987 to October 2015) depicting the inordinately large erosion and accretion rates affecting the Guianas coast: (A) between 1987 and 1999; (B) between 1999 and 2009; (C) between 2009 and 2015.
The satellite images between October, 1987 and January, 2016 (Landsat) and an additional image (Sentinel 2AMSI) in October, 2018 show the progressive reduction in the length of the active (functional) chenier and its fragmentation by mangrove-colonized sectors of shoreline (Figure 6). Local reworking and concentration of sand resulted in a coherent but narrow chenier in places separated by mangrove-colonized mud (Figure 7). By 12 January, 2016, the beach length had been reduced to 4 km as a result of the westward advance of the leading edge of mud bank 1. The October, 2018 image shows a fragmented chenier ending in a 1.6 km-long spit with recurves at the downdrift terminus formed by the estuary (Figure 6). The length of beach obtained from in situ field measurements was 7 km in January, 2015 and 5.6 km in August, 2015. By the end of January, 2016, just prior to this study, the measured beach length had been reduced to 2.6 km.
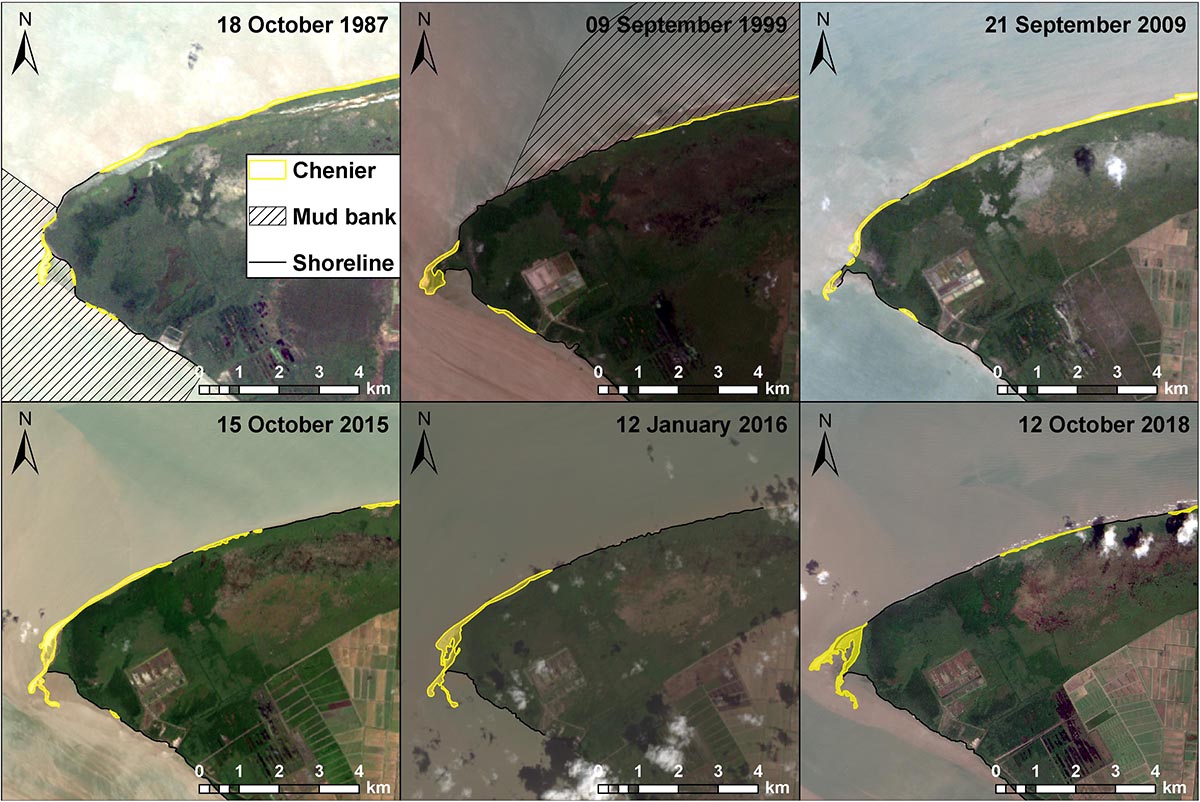
Figure 6. Synthesis of analyzed changes in the Braamspunt chenier between October, 1987 and October, 2018. The latest development phase (October, 2018) of the chenier monitored in 2016, in the course of this study, has been marked by fragmentation and shortening of its downdrift sector near the distal tip of the mud cape impinging on the Suriname estuary.
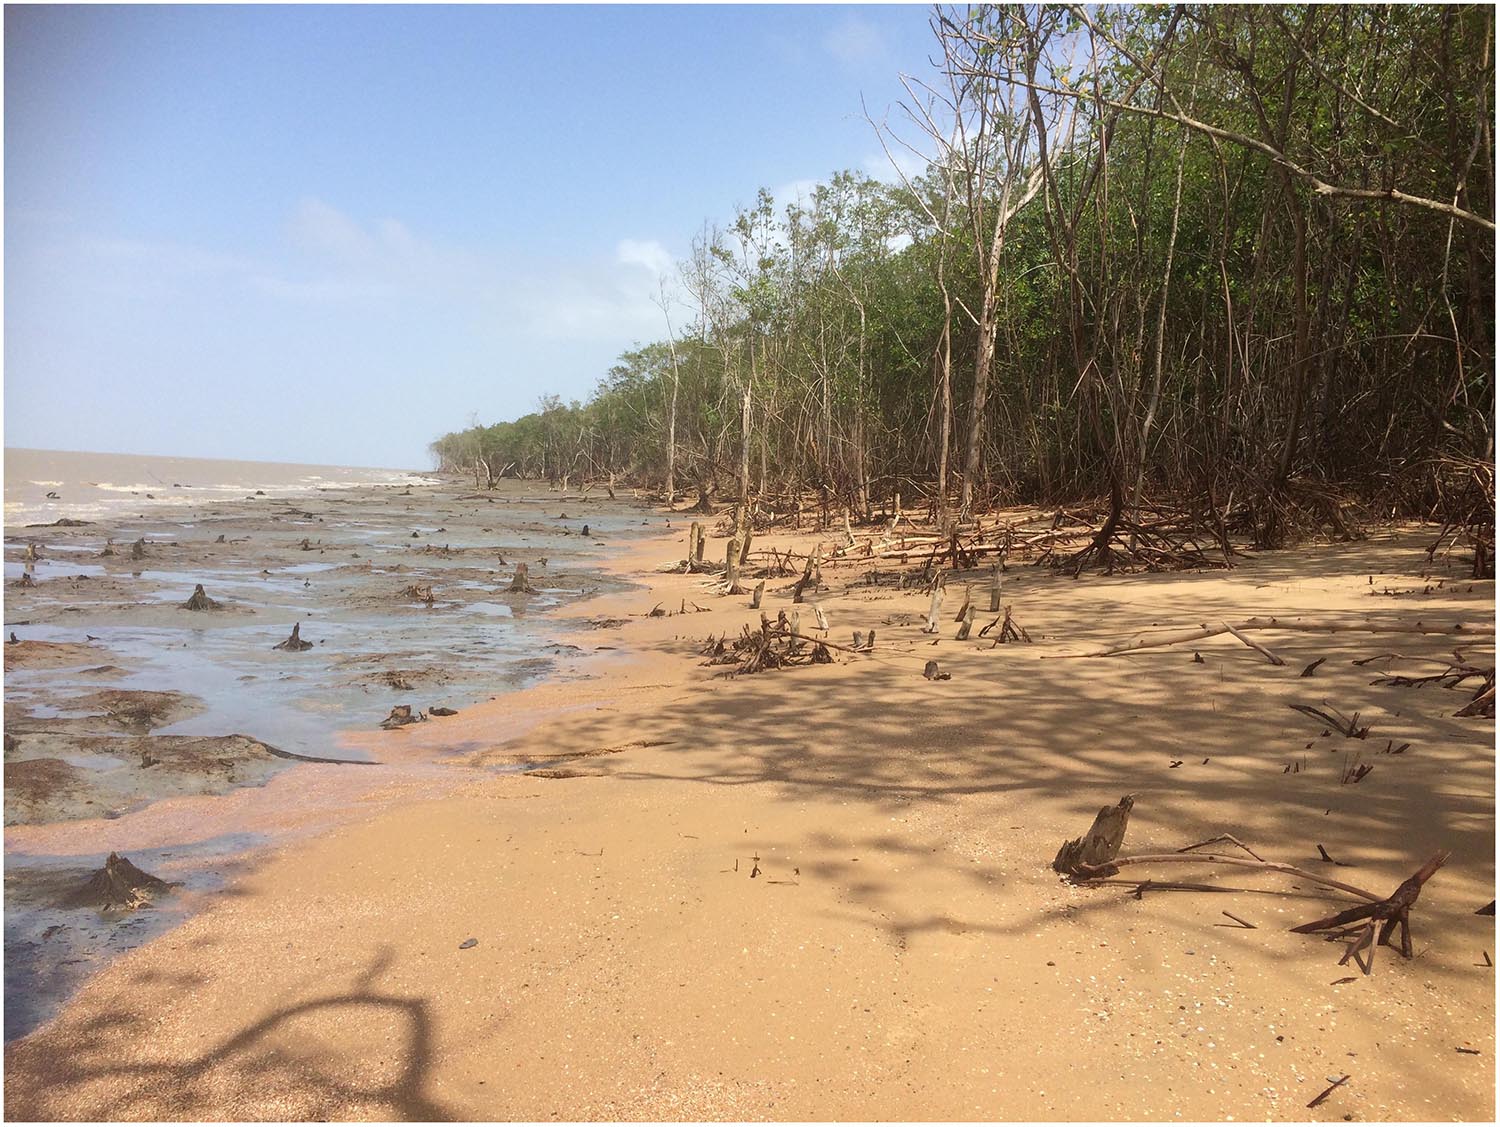
Figure 7. Narrow and fragmented chenier fronting retreating mangrove-colonized mud (February, 2016) in the trailing edge of the inter-bank area. Local reworking and concentration of the sand can lead to the appearance of a coherent chenier visible on satellite images. These narrow fragmented cheniers can migrate landward as coherent sand bodies, asphyxiating seafront mangroves.
Morphodynamics of Braamspunt Beach
Offshore and Nearshore Hydrodynamic Conditions
The tidal and wave conditions that prevailed during the February, 2016 survey are depicted in Figure 8. The semi-diurnal tide had a mesotidal range of about 2.2 to 3 m, and the tidal cycle showed a spring-neap variation between 09/02/16 and 16/02/16. WWIII deep-water significant heights ranged from about 2.2 m at the start of the experiment (09/02) to about 2 m at the end of the field experiment (14/02), with a maximum of 2.9 m on 10/02. These are relatively energetic wave conditions, reflecting a typical El Nino year of rougher waves than usual. The wave heights measured by the pressure sensors on the beach (Figure 8) were, however, much lower, and ranged from 0.5 to 0.8 m, thus reflecting a significant amount of dissipation by mud over the shoreface, as has been documented by Gratiot et al. (2007) and Winterwerp et al. (2007), and dispersal of wave energy by refraction. About 60–80% of the deep-water energy was lost by the time the waves broke on the beach. This left a still non-negligible amount of energy that led to important beach morphological changes, as shown below. WWIII wave periods were relatively uniform at about 9–10 s, reflecting the trade-wind regime. Beach measurements showed a wider spread of periods ranging from about 5 to 20 s, a clear mix of both trade-wind waves (5–10 s) and longer swell waves from the Central Atlantic (12–16 s), and also possible infragravity waves (18–22 s) resulting from in situ wave breaking conditions in the surf zone and beach. Deep-water WWIII wave directions were from the northeast window, typical of the Guianas coast, and ranged from N 47 to 58°, indicating relatively high angles of 32–43° relative to the beach. Beach observations showed much lower, but still relatively high, angles of about 15–25°, following nearshore refraction. The turbidity values (NTU) and significant wave heights (Hs) showed, in the case of sensor Cpt 4 PT, the only sensor that recorded turbidity data, a clear relationship depicting temporary suspension of sand in the course of wave breaking.
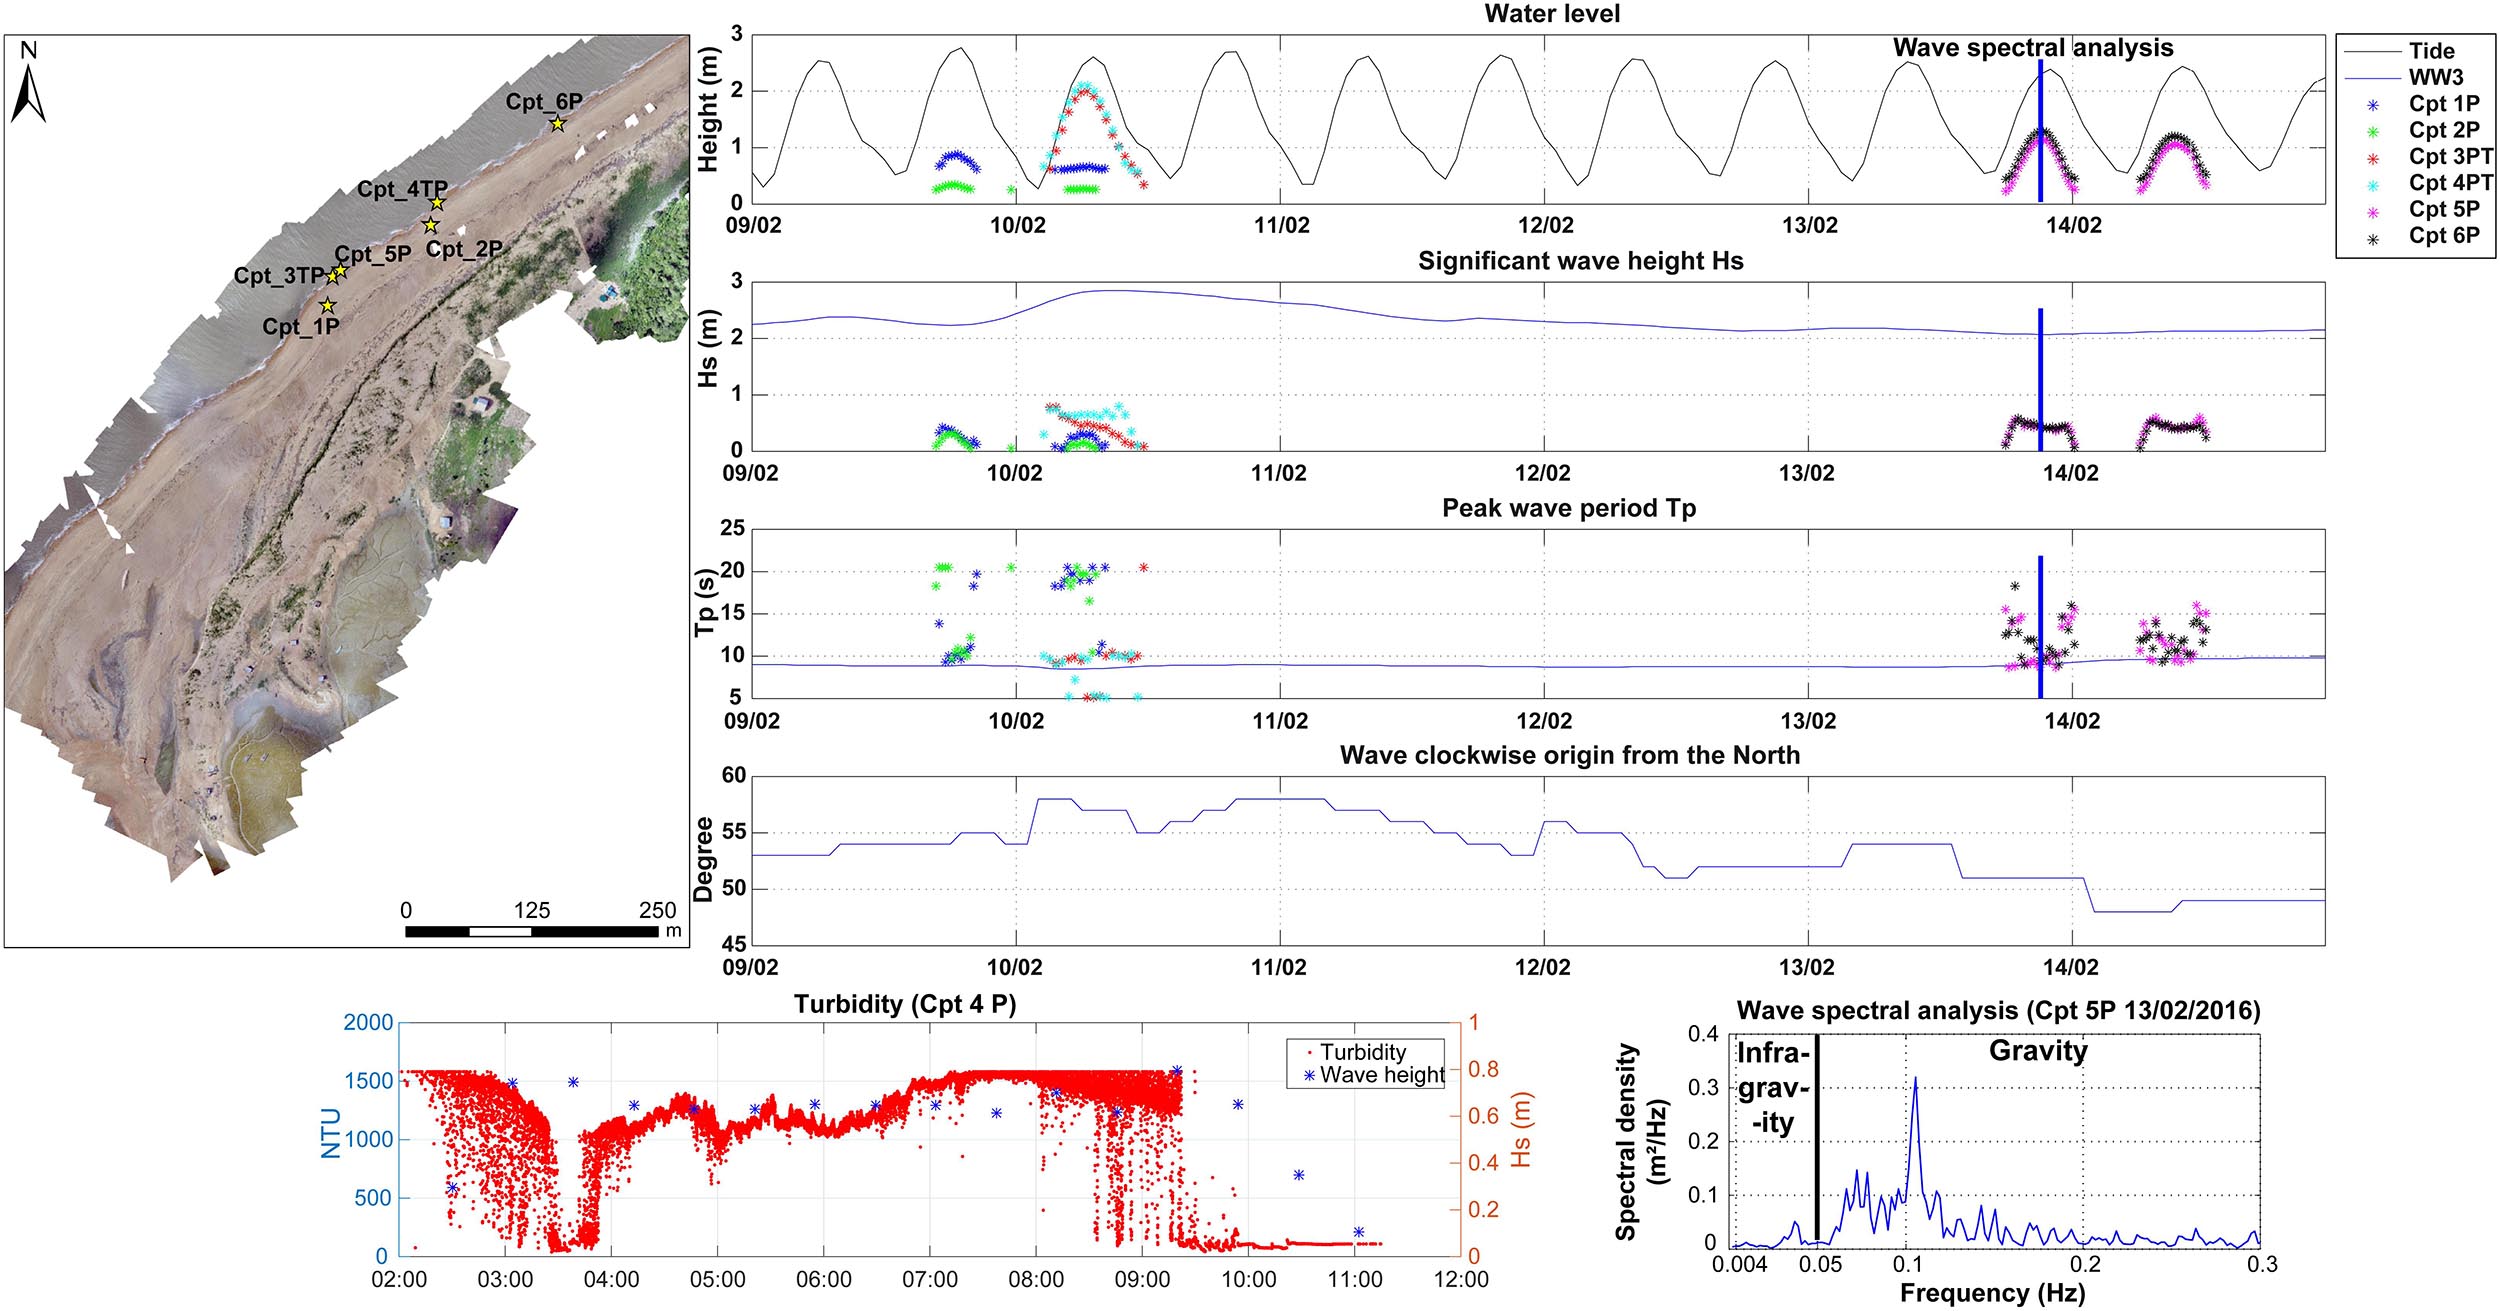
Figure 8. Hydrodynamic conditions affecting Braamspunt beach from 9 to 14 February, 2016. From top to bottom: tidal variations depicted as water level, significant wave height (Hs), peak wave period (T), deep-water wave directions derived from the WAVEWATCH III model; (Hs) and turbidity values (NTU), showing, in the case of sensor Cpt 4 PT, a clear relationship between wave height and sediment put into suspension in the course of wave breaking. Drone-derived orthophotograph on the left shows the locations of the wave and turbidity sensors deployed in the course of the two surveys.
Beach Grain-Size, and Morphology From Field Topographic Surveying
Braamspunt beach is characterized by well-sorted medium sand with median grain-size values of 300 to 600 μm, except in one washover sample with much coarser sand (Figure 9). The percentage of carbonates is highly variable, but locally significant, ranging from 4 to over 40%, reflecting preferential density sorting and concentration within the dominant quartz sand matrix. The high-resolution topography of the beach is depicted in three segments from north to the south (Figures 10A–C). Each segment comprises two DEMs (left: 10 February, Center: 14 February) and a DoD (right) that shows the differential between DEMs. The survey was incomplete for the northern part of the beach (Figure 10A) due to poor radio signal transmission on 10 February between the fixed and mobile GPS stations. The northern sector shows a narrow beach subject to erosion involving nearly 5 m of retreat of a steep reflective beach face characterized by a well-developed berm. The central sector (Figure 10B) exhibited a less steep profile and a beach that rapidly became wider from profile 2 southward. The beach topography also showed better contrast with this widening. Erosion was dominant on the beach face, but the berm and back-beach showed little change where the beach widened. The wide southern sector (Figure 10C) corresponds to the most recent spit recurve toward the Suriname River estuary. The back-beach topography in this sector showed significant variations caused by: (1) overwash processes, (2) overall beach surface lowering, and (3) inherited sand mining pits dug just prior to a State moratorium on beach sand mining in December, 2015. Much of the topographic change derived from the DoDs concerned the active beach face. Change was much less intense over the top and back of the beach. The spit sector showed alongshore alternations of beach face erosion and accretion that represent mobilized sand ‘waves’ migrating under the strong longshore drift that prevailed on this beach in the course of the surveys.
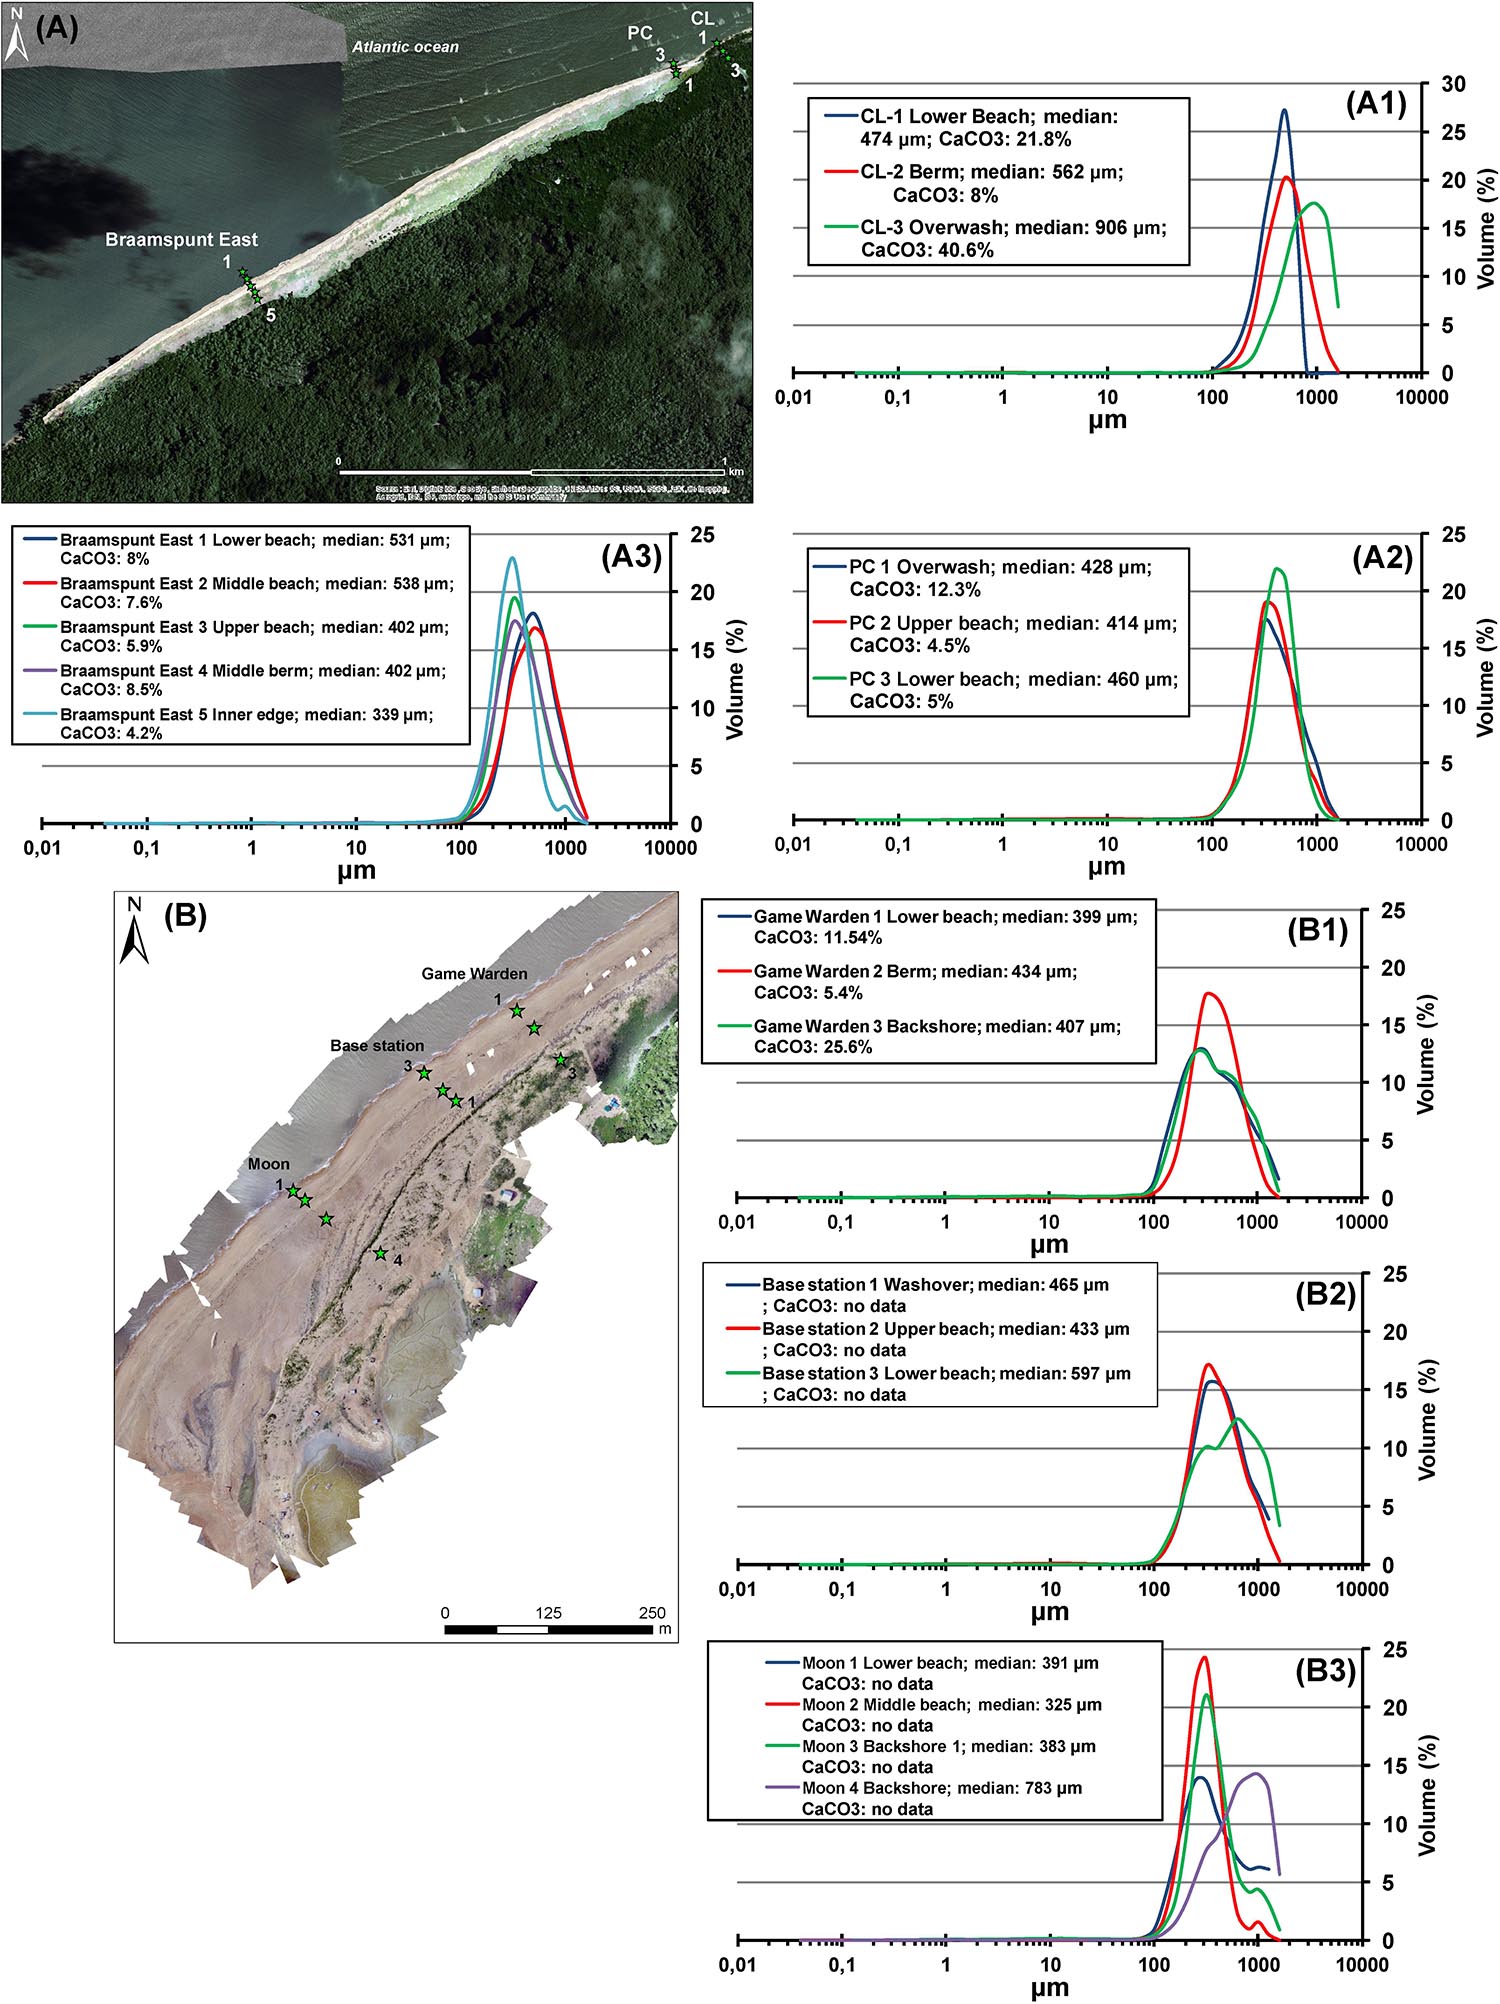
Figure 9. Grain-size characteristics of Braamspunt beach determined by laser analysis, and percentage of carbonates. Satellite image (A) and drone-derived orthophoto (B) show sample locations. The grain-size curves (A1–A3,B1–B3) show a clear concentration around median values of 400 to 560 μm, indicating well-sorted medium sand dominated by quartz.
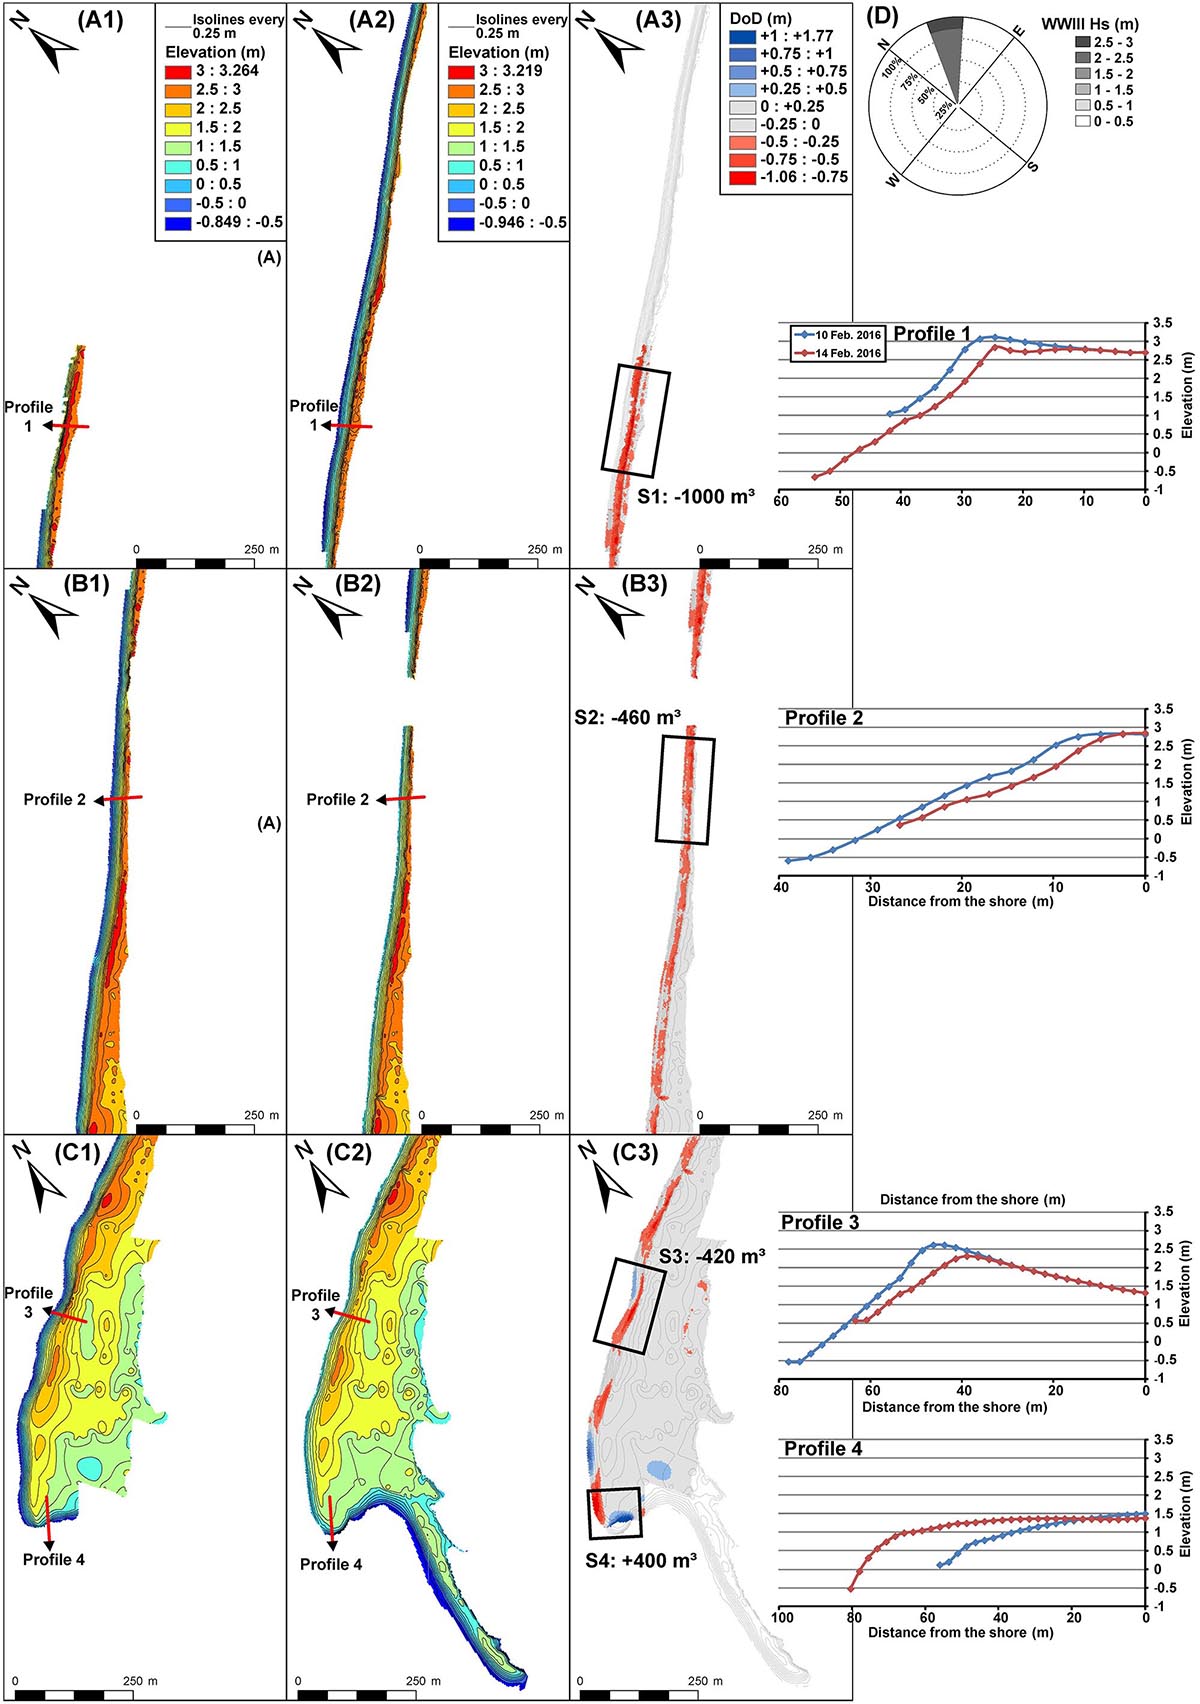
Figure 10. High-resolution GPS-derived topography of Braamspunt beach depicted in three segments from the north to the south of the beach (A–C), and beach sediment budget based on a beach base of –0.5 m relative to absolute datum. In the absence of local topographic benchmarks, elevation data were referenced to the world geoid EGM96 (Earth Gravitational Model) representing mean sea level. Each segment of beach comprised two digital elevation models (DEMs) (left: 10 February, center: 14 February), a DoD (right) that shows the differential between DEMs, and representative profiles. The DEMs, DoDs and profiles show a steep, narrow and eroding reflective beach in the north with a well-defined berm (profile 1), a wider but eroding and less steep beach (profile 2), a lower, retreating berm (profile 3), and a much lower (profile 4) ending steeply in the latest of the spit recurves of Braamspunt beach. The partial budgets highlight the contrast between a dominantly eroding beach along much of its length and a short spit recurve that serves as a sink for some of the sand eroded further updrift and transported by longshore currents.
Beach Morphology From Photogrammetric Surveying
The orthophotographs and DSMs yielded by the photogrammetric survey, and obtained using the analytical procedure based on the SfM protocol, are shown in Figure 11. Both the orthophotographs and the DSMs are used to infer long- and cross-shore sediment transfer mechanisms and the resulting morphodynamics of the beach (discussed below). Various large-scale morphological features such as the spit recurves at the approaches to the Suriname River mouth, but also smaller-scale features such as beach scarps, log jams, and overwash fans, are clearly identified. It is interesting to note the strong similarity of the products of SfM photograph and the lower-resolution topographic data generated by the GPS surveys. Unfortunately, no DoDs were drawn up because only one photogrammetric survey was possible in the course of the week of the field surveys.
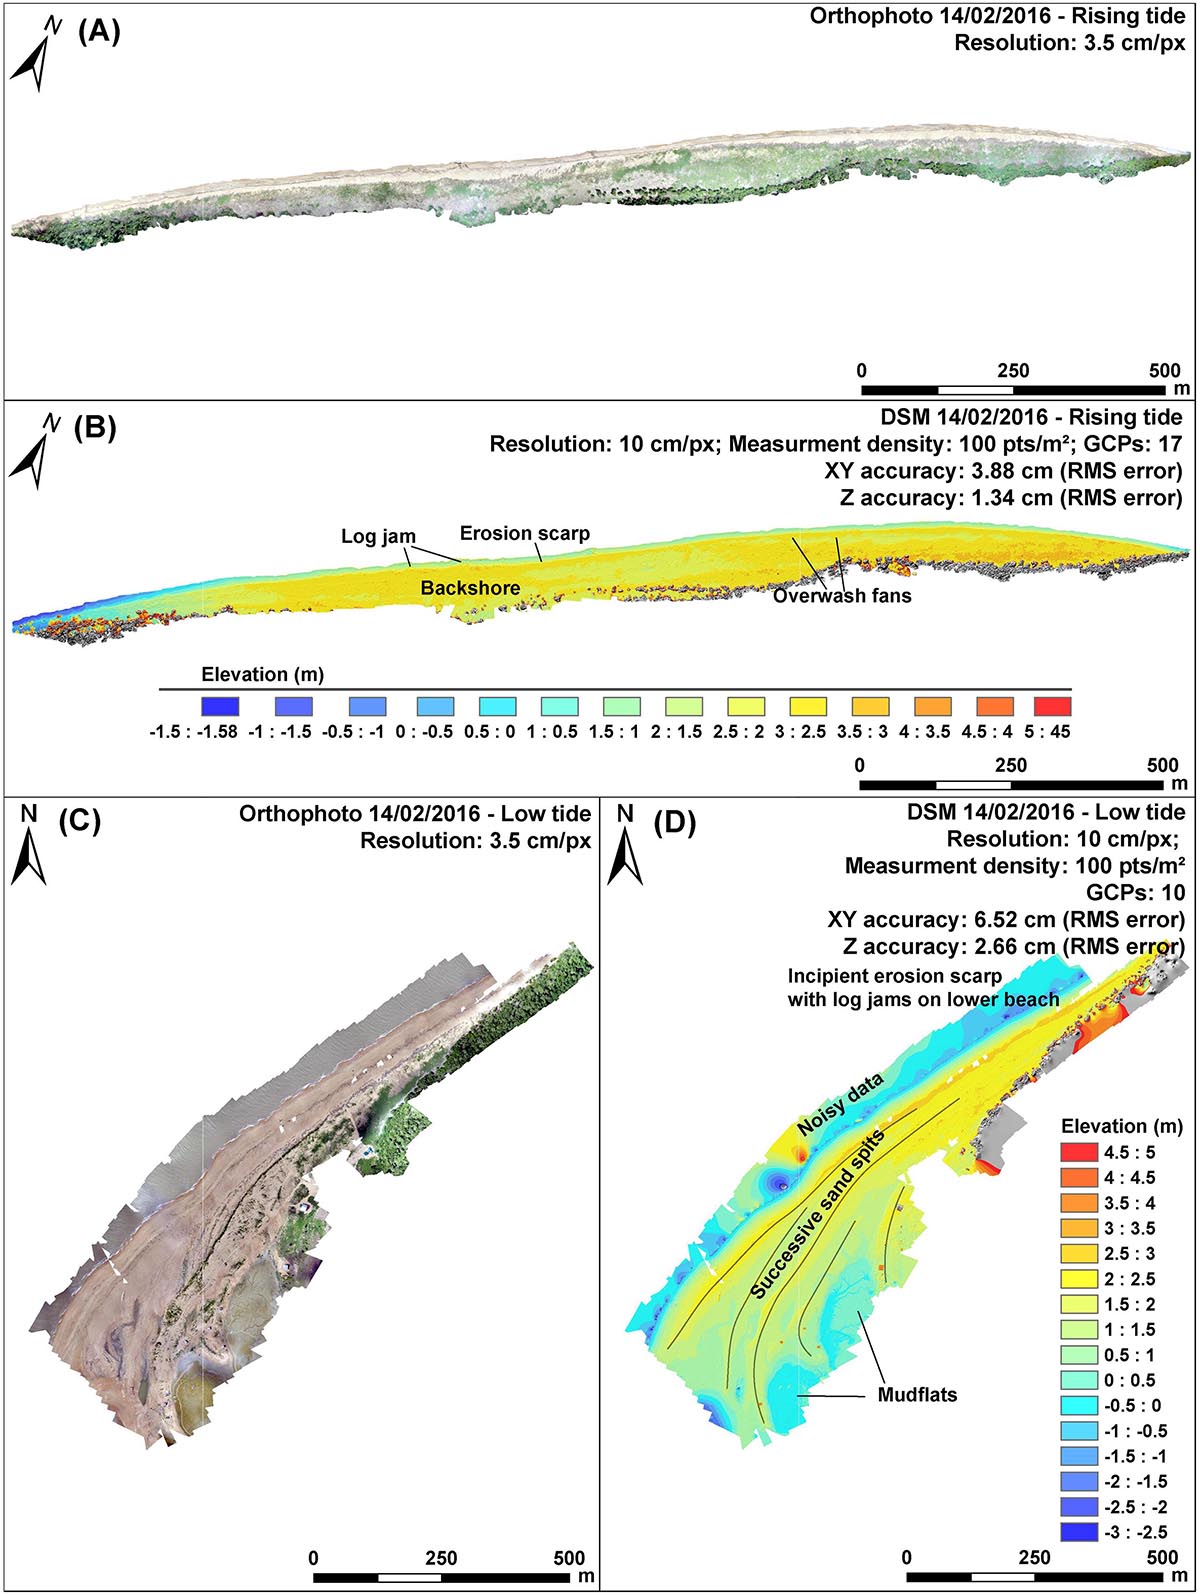
Figure 11. Two high-resolution and high-density orthophotograph assemblages (A,C) and digital surface models (DSMs) (B,D) of Braamspunt beach obtained from SfM photogrammetry in February, 2016. Both the orthophotos and the DSMs depict variations in beach topography, and especially various large-scale morphological features such as spit recurves at the approaches to the Suriname River mouth, and smaller-scale features such as beach scarps and high-tide truncation of lower spit recurves, washovers, and log jams.
Sediment Budget of Braamspunt Beach and Budget Change Over the Survey Period
Braamspunt beach experienced net erosion between the two surveys, as shown by the RTK DGPS-generated DEMs and cross-shore profiles. The overall estimated sand volume of the surveyed beach, using an absolute beach base at -0.5 m, is about 570,000 m3 of sand. This is a conservative estimate since the true absolute sandy base of the beach above ambient mud is probably lower than this value as a result of consolidation and lowering of the mud substrate and, especially, as the spit impinges on deep waters at the approach to the Suriname estuary. The net budget differentials bring out an overall loss of 4200 m3 of sand for what corresponds to a very short (3–4 days) period of time (Figure 10), and a short stretch of beach (2.5 km). This highlights the fragile sediment budget of this beach. The important loss of sand could reflect updrift sequestering under mud, but, more likely, infill of holes dug out in the subtidal beach in the course of sand mining operations from boats moored near the beach, this subtidal zone not having been covered by the surveys. The differentials also show the clear propensity for downdrift transport of sand, dominantly as propagating sand waves, as we saw earlier (Figure 10C), and its final deposition in the large spit sector which forms an accreting sink from which sand is probably progressively transferred toward the estuarine depths. However, it was also clear in the course of the week that the spate of erosion observed and measured between the two GPS surveys was essentially driven by large waves that coincided with spring tides. These are the conditions most favorable to beach scarping, overwashing by waves, strong longshore transport, and, overall, rapid erosion of the beach.
Discussion
Morphodynamics and Recent Evolution of Braamspunt Chenier
Bank phases lead to covering, by the large amount of ambient mud, and thus, sequestering, of sand bodies present on the shore. This can result in: (1) inland isolation, within the prograded part of the muddy plain, of once active cheniers, well-identified on aerial photographs and satellite images as linear strings of sand separated by marshes (Figure 2B), and, (2) the cutting off of any actively functional cheniers from potential supply of sand from updrift (commonly a river source, a reworked chenier or reworked nearshore deposits). These conditions are well-illustrated by the recent evolution and current morphodynamics of Braamspunt.
Two types of cheniers were identified on the Guianas coast (Anthony et al., 2014), but their morphodynamics have never been documented before. Depending on the size and width of the sand body, and on the proximity of an approaching mud bank, cheniers can range alongshore from sectors exhibiting large beach faces and well-developed berms to sectors with low, narrow beaches dominated by frequent overwash. The former (called type 1 cheniers here) develop where sand and shells available in sufficient quantities lead to a significant gain in chenier volume, resulting in a ‘normal’ (or nearly so) ocean beach morphodynamic regime with a well-developed surf zone (albeit with permanent inner shoreface mud in the Guianas). These cheniers are characterized by ‘typical’ beach foreshore behavior dominated by swash processes and berm scarping, often with little or no overwash. These processes are best expressed at high tide when waves are higher and break further up the beach, undergoing less dissipation over the muddy shoreface (Anthony et al., 2010). Such large sandy beaches preferentially occur well-downdrift of an approaching mud bank in an inter-bank zone and where sand supply is adequate. These beaches are most typical of the vicinity of river mouths (active source zones), or, in the case of Braamspunt beach, of the sector corresponding to Profile 1 (Figure 10). Under a prolonged inter-bank phase, and providing there is a sufficient or continuous supply of sand, a type 1 chenier can develop alongshore for several 10s of kilometers. This is achieved through: (a) thorough winnowing of fluvial sand supplied by a river updrift (and sometimes shells from the nearshore zone) that may have been temporarily fossilized or cut off from the chenier downdrift by a bank phase, (b) but more commonly by continuous downdrift supply of sediment from an updrift river mouth acting as a significant sand source. A second type of chenier (called type 2 here) is subject to more or less active landward migration through overwash by waves at high tide. An approaching mud bank generally leads to enhancement of this chenier overwash regime by curtailing the through-drift of sand from source zones, leading to chenier fragmentation. Overwash commonly leads to sand migrating over mangroves (Figure 7) the seaward stands of which are progressively first asphyxiated, and then sometimes uprooted, leading to the accumulation of more or less significant amounts of drift wood (log jams). These accumulate notably on the upper beach. As the coarser beach sediment migrates over the generally poorly consolidated organic-rich muddy substrate, the increasing weight of the chenier body leads to muddy substrate consolidation and lowering in elevation of the chenier, thereby enhancing overwash processes in a feedback loop (e.g., Rosati et al., 2010). On the lower beach and in some back-beach areas, this process is clearly manifested by the appearance of sandy beach deformation structures generated by dewatering and progressive consolidation of the mud substrate underlying the cheniers (Anthony and Dolique, 2006). This process generates accommodation space into which the overlying sand above the water-exfiltration zone responds by forming subsiding packages of non-saturated sand delimited by cracks alongshore (Anthony and Dolique, 2006). These collapse features are generally ephemeral, as the sand on the lower beach is transported along the beach by longshore currents, and onshore through overwashing. As the chenier migrates inland, the subsisting consolidated muddy foreshore is exposed, commonly with remnant dead and dying mangroves undergoing uprooting by waves.
The two types of chenier development and corresponding beach morphodynamics described above have been characteristic of the recent (multi-decadal) history of Braamspunt beach. Braamspunt persisted notably as a type 1 chenier west of the leading edge of mud bank 1 near the mouth of the Suriname River, where the river’s fluvial jet has resulted in mud liquefaction favorable to a clearly expressed beach with spit recurves (Figure 6). As mud bank 1 migrated westward, much of Braamspunt chenier underwent fragmentation and shortening, and evolved from an open type 1 chenier toward a more classical landward-migrating type 2 chenier.
The beach ‘shortening’ obtained from field measurements suggests that the high mud-bank migration rate of 1.6 km a year deduced from the 2009 to 2015 satellite images (Figure 4D) is significantly outstripped by the real ‘ground’ migration rate at the very leading edge of the bank. Here the mud bank is also smaller, and subject to refracted, but still energetic incident waves, leading to a form of bank stretching and elongation typical of the Suriname coast that has been attributed by Augustinus (2004) to the west–east shoreline orientation relative to the trade-wind waves.
During the field survey in February, 2016, Braamspunt beach showed a clear updrift–downdrift differentiation in morphology, dynamics, and sediment budgets (Figures 10, 11) that reflected the aforementioned alongshore wave-energy and longshore drift variations. Once the Maroni primary source was cut off by bank welding (Figures 4–6), the northeastern part of the beach became the source zone for the beach downdrift, with a ‘sink’ zone in its southwestern extremity of spit recurves. This gradient is related to downdrift wave modification at the approaches to the Suriname estuary. These differences are depicted in the 12 January, 2016 Landsat 8 image (Figure 12A) and in a conceptual model of the two chenier types (Figure 12B). For simplicity, three sectors are distinguished in Figure 12A:
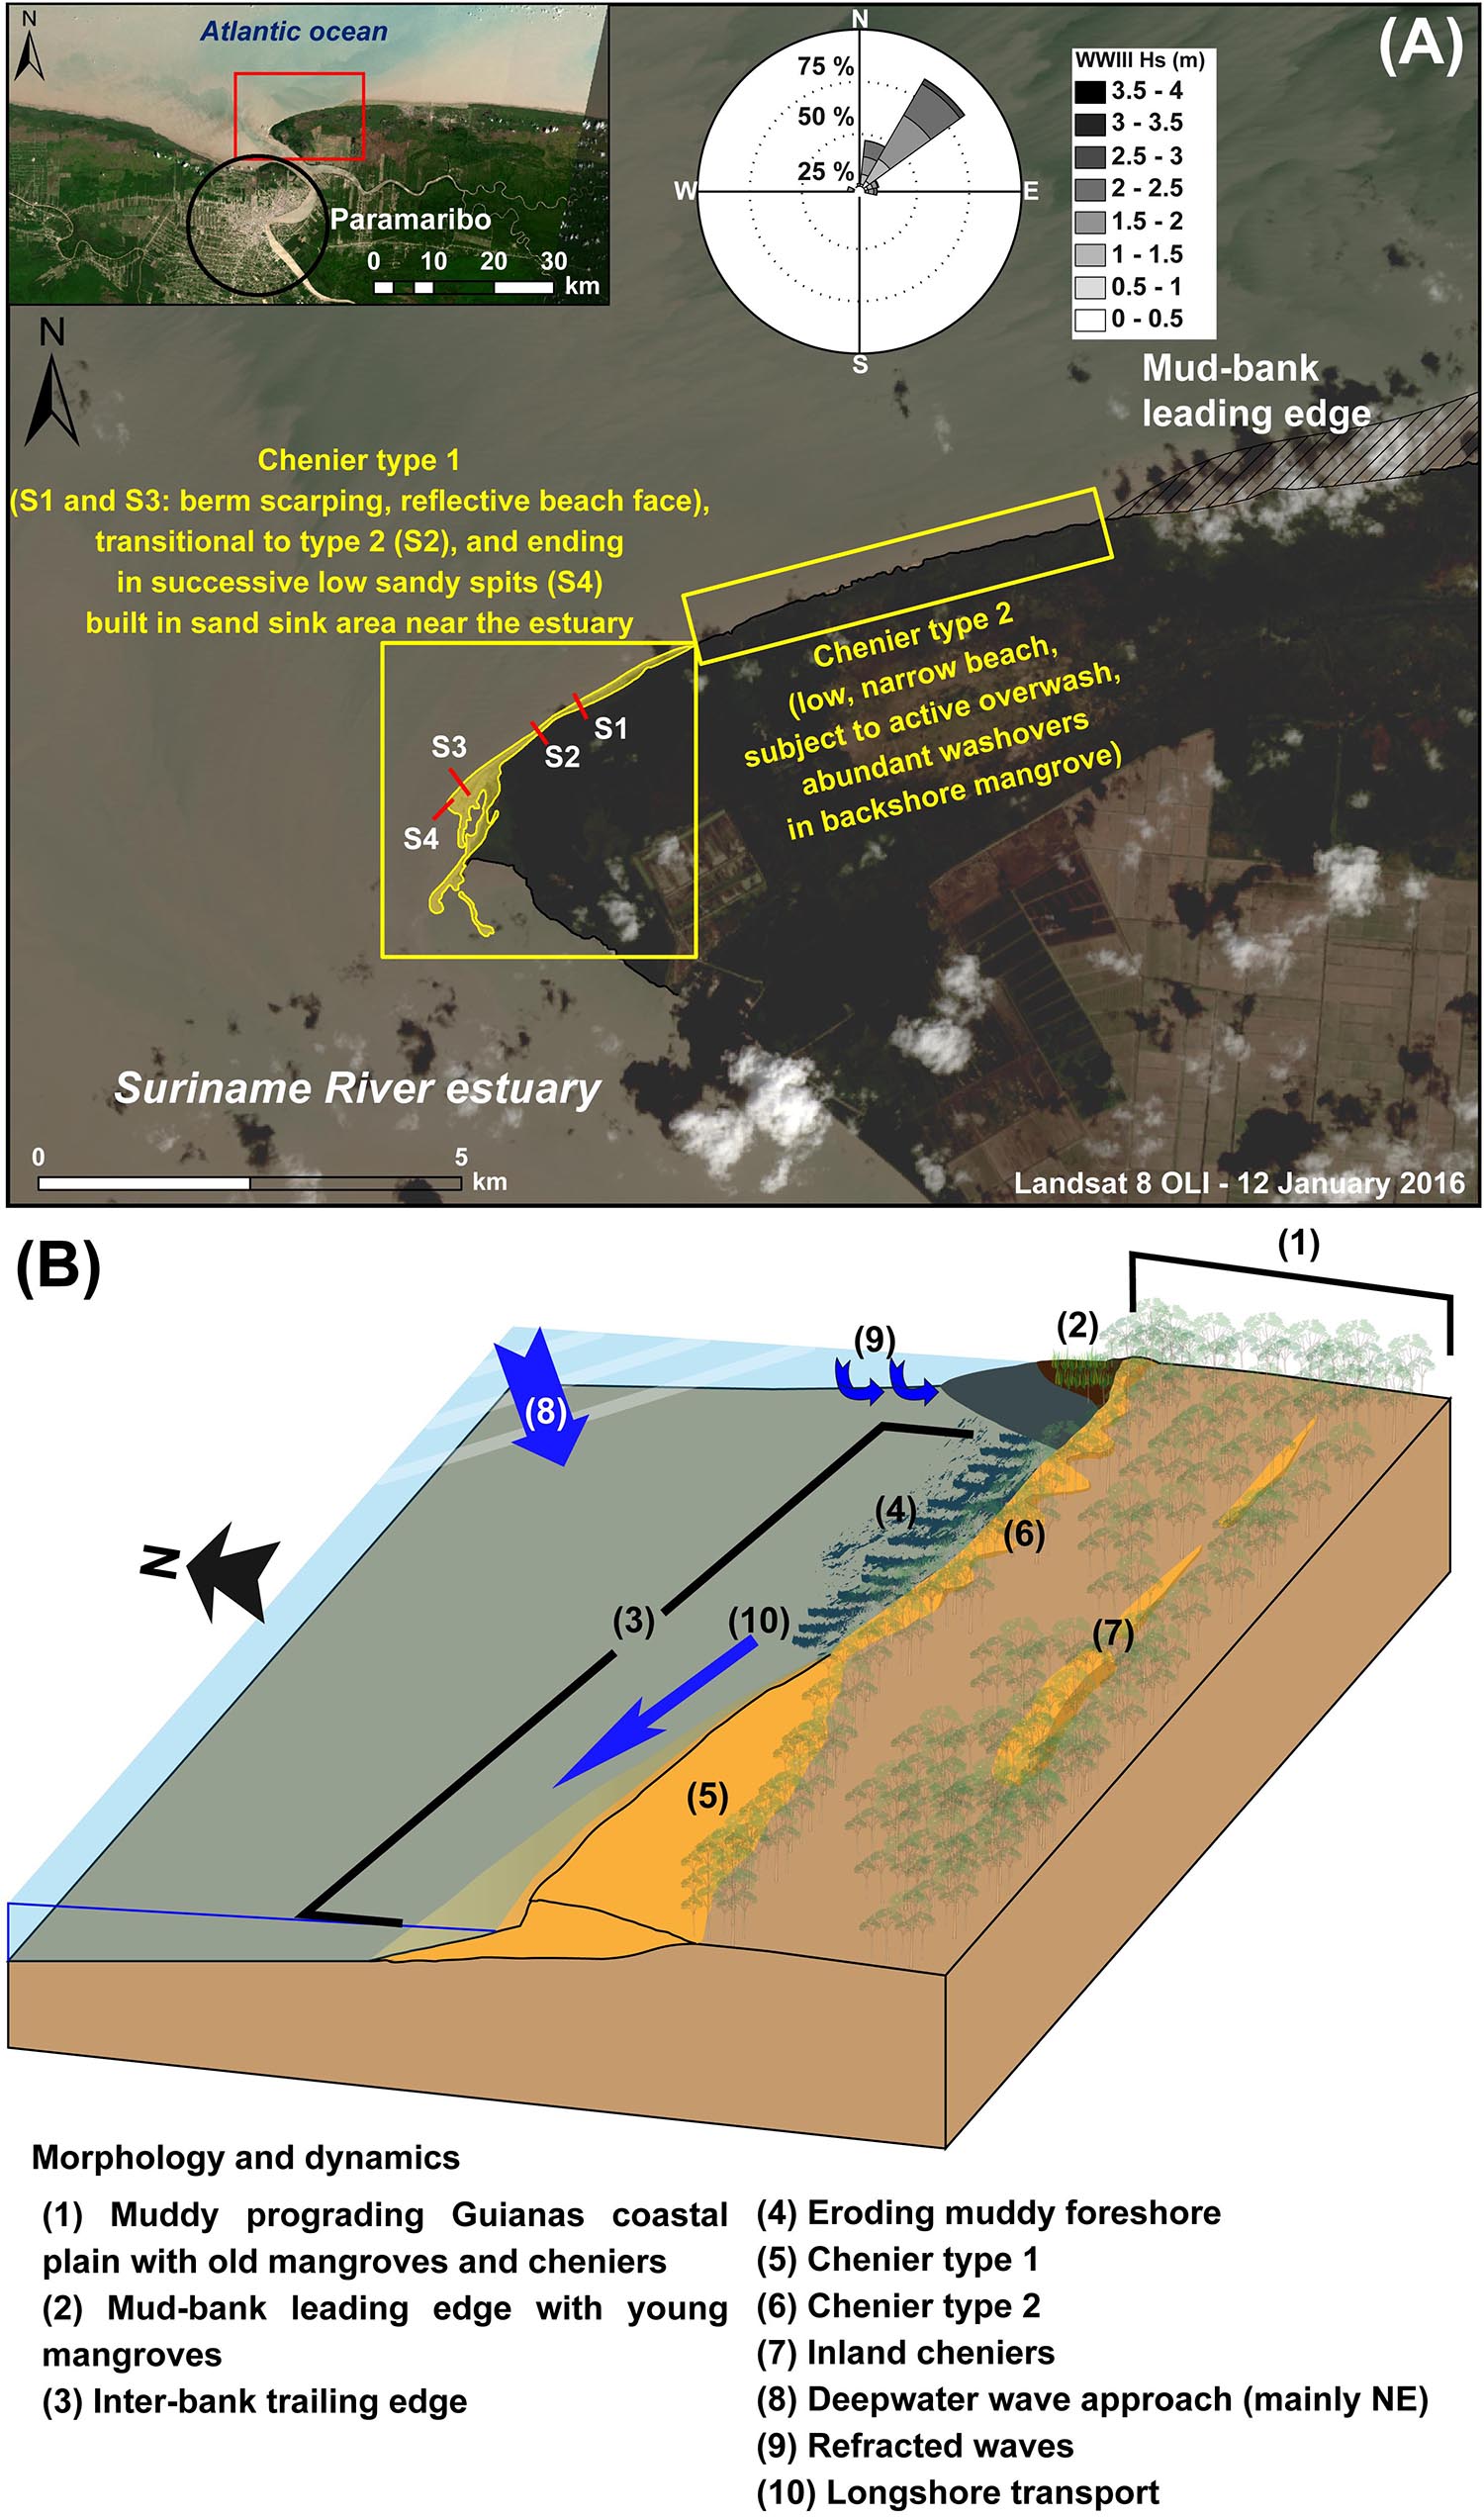
Figure 12. A synthesis superimposed on a 2016 Landsat image (A), and a conceptual model (B) of the morphodynamics and sediment transfer conditions at Braamspunt beach. S1 to S4 are representative of profiles 1 to 4 (Figure 10). The type 1 chenier regime is characterized by a well-developed, albeit eroding berm with overwash processes less well-expressed, and conforms to a beach dominated by dissipative-to-reflective processes. The type 2 chenier regime is dominated by overwash processes and eventual partial break up where local variations in incident wave energy occur. Mangrove colonization accompanying bank phases commonly mask cheniers, a preliminary phase to their isolation inland (B).
(1) The northern sector, which comprises two segments: the leading edge of the mud bank where the existing chenier (former type 1 open-beach chenier) has been isolated from the sea by mud and fossilized inland, and the ‘terrestrial’ shoreline junction with the leading edge of the mud bank. The former has been rapidly migrating westward, resulting in the shortening of the beach, which is now a narrow 150 m-long sandy type 2 chenier migrating landward (Figure 12). As the chenier migrates inland over back-beach stands of Avicennia germinans mangroves, it leaves in its wake a muddy foreshore with subsisting mangroves that were part of the muddy mangrove-colonized shoreline (Figure 13A).
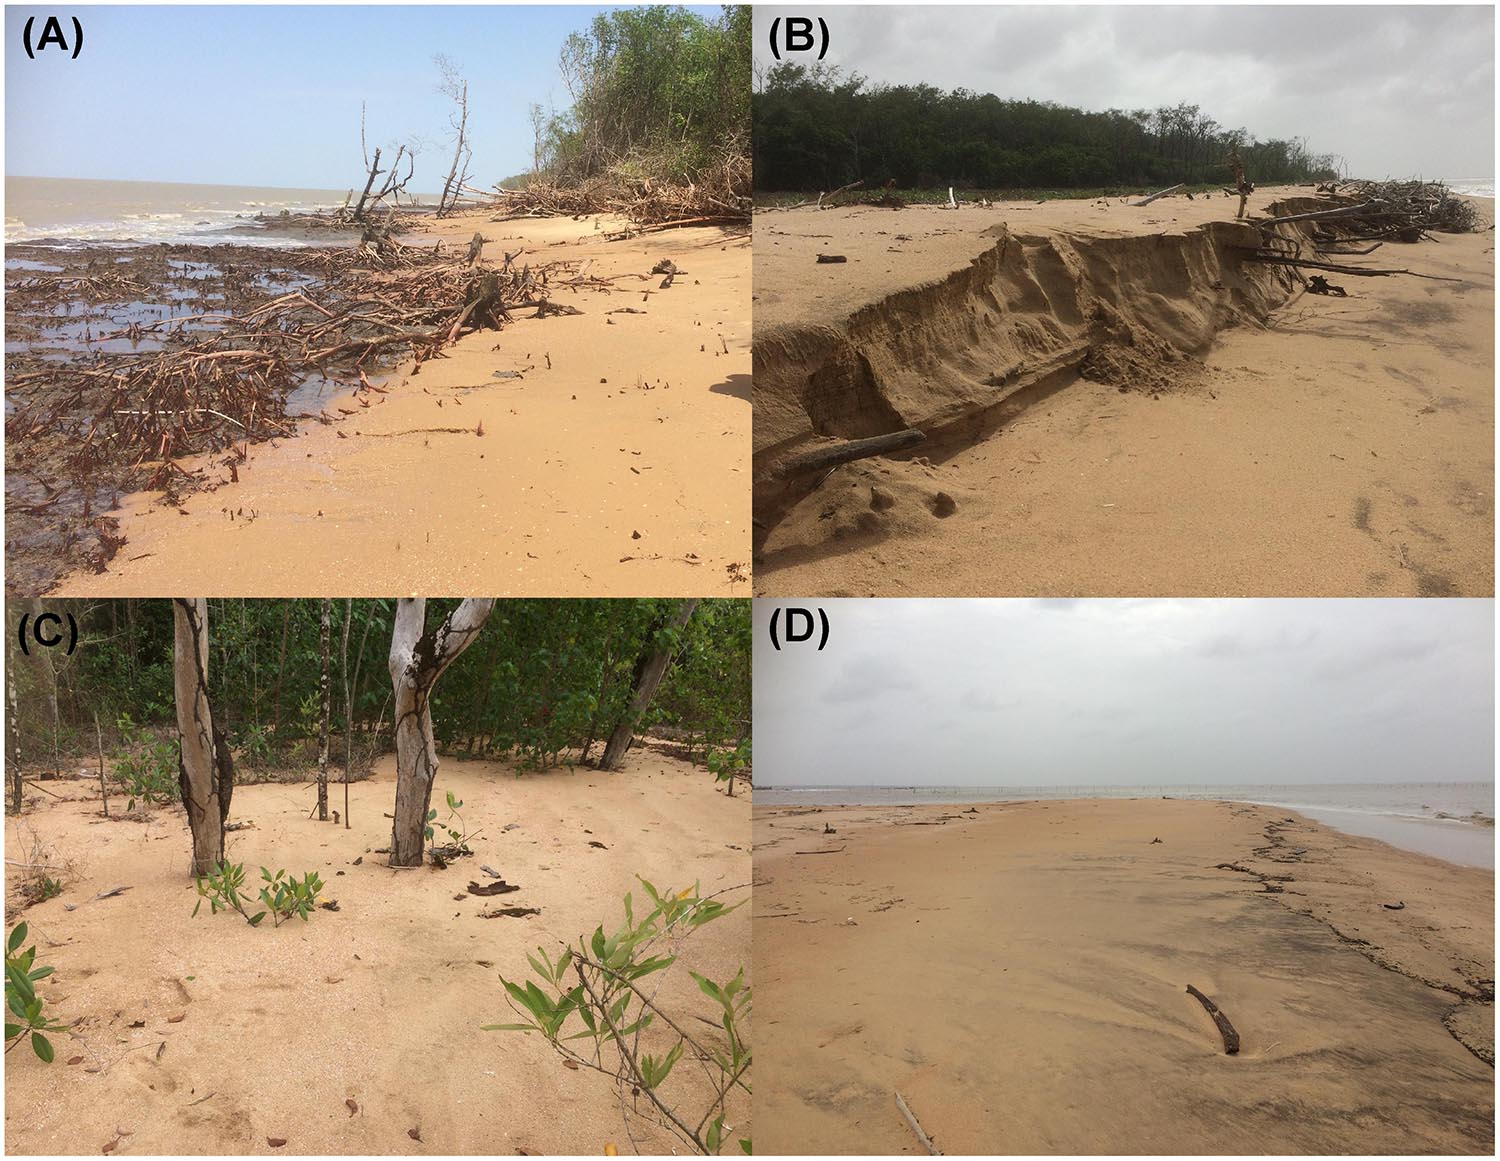
Figure 13. Ground photographs showing: (A) landward-migrating (type 2) chenier forming the present updrift sector of Braamspunt beach. Westward migration of the eroding trailing edge of the inter-bank zone (uprooted mangroves) in response to impingement of the leading edge of the incoming mud bank (not visible here) is leading to shortening of the exposed length of beach. Landward chenier migration leads to the exposure, on the beach foreshore, of more or less consolidated former back-beach mud rich in mangrove remains; (B) pronounced beach scarp resulting from erosion of a steep, reflective type 1 chenier beach face (S1 and S3 in Figure 12A) with accumulation of mangrove debris (logjams) in the background); (C) view toward the back-beach (S2 in Figure 12A) showing washovers encroaching on Avicennia g. mangroves and burying their pneumatophores (breathing root network), leading to asphyxia and death of the plants; (D) downdrift sand transport terminus and partial sink where Braamspunt beach forms a spit in response to wave refraction caused by the Suriname River mouth re-entrant. The refracting wave front is visible in the right background. Darker shades of sand on the beach correspond to heavy minerals (black sands) deposited in this area of relatively lower wave energy as a result of refraction, and further concentrated by mild wind sorting of the beach sand. Washover lobes inherited from the higher spring tides at the start of the survey are present in the left background.
(2) The southern sector, also with two segments (Figure 12A): a narrow 1.7 km-long reflective beach in February, 2016, and a relatively large 0.6 km-long downdrift beach segment. The former segment is a strongly eroding one, the process being materialized by beach scarping and the constitution of log jams on the beach from uprooted mangroves (Figure 13B). Scarping by waves occurs at high tide, and is particularly favored by spring tides which occurred at the start of the 2016 field study. Such scarping led to the truncation of older spit recurves on the lower beach (Figures 11C,D). Large washover lobes of sand were also being transferred toward the back-beach, the typical signature of (type 2) chenier migration (Figure 13C). Some of the sand removed by scarping was transported downdrift by the strong longshore drift, thus accounting for the considerable narrowing of the beach and the net budget deficit over the survey period (Figure 10). In addition to the role of these processes, beach narrowing and the budget deficit may also result from partial fossilization of sand under the stretched and advancing leading edge of the mud bank. The large waves and strong longshore drift cannot be balanced (dissipated) by the sand volume of the beach to maintain stability. The narrow reflective portion of Braamspunt beach also shows small-scale alongshore morphological variability related to numerous zones of driftwood debris. The second segment forms the transition zone toward the present Braamspunt beach recurve zone into the Suriname River estuary (Figure 12). This sector also shows some scarping and rarer washover lobes (Figure 13D) associated with the alongshore alternations of depositional sand waves migrating downdrift and erosional zones between these sand waves. Overall, this sector [type 1 chenier but breaking down into a type 2 washover chenier under the high-energy conditions of the experiment (Figure 12)] constitutes a transit zone for sand transported to the downdrift sink near the Suriname estuary, hence the net positive sediment budget here (Figure 10).
(3) The estuarine sector with older truncated spit recurves, where waves are nearly completely refracted.
Linking Chenier Vulnerability With Beach Morphodynamics: Impacts on Ecosystem Services
The multi-decadal to recent evolution of Braamspunt is that of a classical chenier that depends essentially on sand supply from updrift. This is a first factor of beach fragility. This sand comes from the Maroni, but transport is not direct and continuous as one would expect on a classical open-ocean beach because the sand from the Maroni source transported alongshore by wave-induced drift is partially sequestered over more or less long periods of time (up to multi-decadal) by mud banks migrating westward toward Guyana, and partially recycled onshore into landward-migrating type 2 cheniers. Sand availability is, thus, neither constant nor perennial on Braamspunt. In other words, Braamspunt does not function as a classical through-put source-to-sink (Maroni-Suriname) sediment cell, but as a potentially fragmented temporally and alongshore-variable cell.
As a result of Braamspunt’s fragmented sediment cell strucure, the morphology of its dominantly reflective beach hinges on sand reworked alongshore, and only during inter-bank phases. Such reworking is common in beach systems where sand-supply stress conditions prevail. It also enables the concentration of shelly material from offshore that supplements the beach sand budget. In the case of Braamspunt, this reworking is generated by updrift sand sequestering in the advancing leading edge of mud banks during bank phases, a process that, in turn, generates a chain reaction involving a switch in beach behavior in the immediate vicinity of the bank’s leading edge to an increasingly more landward-migrating type 2 chenier mode associated with beach overwash that further deprives the downdrift beach of sand (Figure 12). As this occurs, beach scarping and lowering occur further downdrift to balance an under-saturated wave and longshore transport system, engendering a downdrift migrating wave of erosion as the system translates downdrift. The subsisting beach (type 1 chenier) is presently preserved in its most downdrift sector (a few 100 m at most) at the mouth of the Suriname where mud is liquefied by the river’s outflow jet. This preservation outcome may be considered as a form of coastal self-organization involving a morphodynamic negative feedback adjustment effect between beach and river mouth, and without which Braamspunt beach would cease to exist. The jet-flow effect of the Suriname River assures the permanence of the beach in this sector. Here, preservation of the beach is essential in turn in dissipating waves impinging on the east bank of the river mouth, thus protecting the back-beach mangrove wetlands and maintaining the mild cape morphology on this bank.
These effects have, thus, a bearing on the role of Braamspunt beach in coastal protection. They also affect the availability of the beach, or sectors thereof, for recreation, and as pristine grounds for sustained turtle nesting. The large type 1 chenier beaches are the most suitable ecotope on the Guianas coast for nesting marine turtles, and are most typical of the vicinity of river mouths (active source zones), but this ecotope has become progressively shorter with beach shortening, fragmentation, and conversion of much of Braamspunt into a type 2 chenier (Figure 12). This condition is not ideal for successful nesting by marine turtles, which require stable sandy beaches, beaches not subject to overwash and strong infiltration, and beaches free of mud and organic matter (Kelle et al., 2007; Caut et al., 2010). Overwash processes are hazardous to turtle nests as they involve water infiltration and sand loading on the upper beach (Caut et al., 2010; Péron et al., 2013). Scarping and beach narrowing lower the available space for turtle nesting while generating a vertical beach face that may hinder turtle access to the beach. The important driftwood accumulation associated with the chain of processes and the beach morphodynamic effects described above also generates obstacles to turtle landing, while decomposing organic material from abundant driftwood can be nefarious to turtle eggs by altering temperatures (Girondot et al., 2002).
Sand mining is harmful to turtles due to the destruction of available beach nesting space, and, by decreasing the beach’s sediment budget, it lowers the wave-buffering capacity. Even allowing for a comfortable error margin of +20–30%, the overall estimated volume of the surveyed beach (ca. 570,000 m3) represents a moderate amount that can be depleted in the next few years, if sand mining were to continue unabated. Braamspunt beach and its ancestral forms between the Maroni and the Suriname have always played an important role in protecting the coastal plain of Suriname from exacerbated retreat during inter-bank phases by dissipating wave energy. Together with mangroves, they play this role in inter-bank areas, but although mangroves are important energy-buffering agents on the Guianas coast, they are less efficient than sandy beaches in accomplishing this role. Beaches also evince ‘threshold functioning.’ This implies that large-scale sand removal by mining can lead to a threshold point wherein an already strongly depleted beach can, in the face of repeated spates of high wave episodes (such as would be expected in El Nino years), completely collapse through massive washover and wave recycling of sand into the Suriname River estuarine sink. The total collapse of Braamspunt beach could have very damaging feedback effects (irreversible change, with no possibility for resilience), wherein the east bank cape at the mouth of the Suriname River can be severely eroded several kilometers back during inter-bank phases, thus exposing the estuary and the water-front of Paramaribo to incident Atlantic waves. Between 1955 and 2017, large-scale erosion, involving a total of nearly 42 km2 of coast, resulted in the demise of the 2–3 km-wide muddy cape of Pointe Isère which hitherto diverted the mouth of the Mana River in western French Guiana (Jolivet et al., unpublished), and the catchment of which lies next to that of the Maroni River. The causes of this persistent multi-decadal erosion are still not clear.
General Implications for the Understanding of Chenier Morphodynamics in the Guianas
The range of morphodynamic conditions and processes exhibited by Braamspunt chenier have varied both alongshore and in time, depending on the influence of bank and inter-bank migration in isolating beach sediment sources and in generating alongshore-changing wave-energy dissipation and refraction. These variations can also be related to changes in local bathymetry, such as at the entrance to the Suriname River estuary, and elsewhere, as in Guyana, to coastal defense structures such as sluice gates and groynes. Part of the beach evinces the type 1 chenier regime characterized by the presence of a well-developed, albeit eroding berm where overwash processes are less well-expressed. This type conforms to that of beaches dominated by dissipative-to-reflective processes acting in the surf and swash zones and over the well-developed beach face. These processes are also modulated by tide, being best expressed at high tide when waves are higher and break further up the beach, undergoing less dissipation over the muddy shoreface. In contrast, the type 2 chenier morphodynamic regime is dominated by overwash processes. Differences alongshore in overwash can lead to spatial disorganization of the chenier and its eventual partial break up where local variations in incident wave energy occur. Mangrove trees and trunks in overwashed areas of beach also further dissipate wave energy, potentially diminishing the longshore component of such energy. In essence, therefore, sand sequestering through the overwash regime typical of active cheniers such as sector 1 in Braamspunt can deprive the beach longshore transport system of sand, thus further strengthening the downdrift propagation of the overwash type 2 chenier regime associated with increasingly more limited sand supply. This morphodynamic feedback effect signifies, in fact, that the overwash chenier regime is important in locally dissipating incident wave energy because it leads to local beach sand-trapping through the formation of more or less coalescing lobes of washovers, the regime propagating downdrift. While this sand-trapping mechanism locally enhances the coastal-protection role played by chenier development, it deprives downdrift sectors of sand, rendering the beach downdrift more vulnerable.
Two final points concern: (1) aeolian dune development, insignificant on the Guianas cheniers and beaches as a result of this common overwash regime and the mild wind speeds, and, (2) the large variability in chenier plan shapes and orientations. Cheniers appear in all sizes on the Guianas coastal plain, are commonly discontinuous alongshore, and can be variably wide (see Figure 2B, for instance). Their orientations also vary. Type 1 cheniers formed in the vicinity of river mouths can, for instance, vary in orientation, from orthogonal relative to the regional shoreline where they line river banks, as on the west bank of the Maroni (Figure 2B), to the more normal alongshore orientation as in the case of Braamspunt chenier. In addition to the specific morphodynamic process variability imposed by the bank-inter-bank context, this diversity reflects various other factors, such as the availability of sand in inter-bank areas, the impact of previous bank phases in muting down sand-winnowing processes, local to regional sand availability, and winnowing from the nearshore zone, but also the potential reworking of older inland cheniers by mobile river channels and their creek networks that recycle this sand into channel-bed deposits. Such sand may eventually be re-injected on the shore where such creeks debouch. Over the decadal to multi-decadal timescales involved in bank-inter-bank cycles, changes in channel-mouth location can also occur as the mud capes diverting the smaller river mouths during bank phases are eroded. This leads to changes, in injection points on the coast, of sand brought down by rivers, or reworked from older sand bodies inland.
Conclusion
The formation of cheniers on the Guianas coast is not primarily related to simple temporal alternations between low wave energy conditions (muddy sedimentation) and high wave energy conditions (sand/shell/gravel winnowing) observed in many of the world’s chenier coasts. Rather, it is dependent on the unique situation of the Guianas coast, at the world-scale, wherein alongshore alternations of banks and inter-bank zones occur, engendering marked spatial and temporal variations in wave energy and sand/shell supplies. Further variability is induced by the proximity of river mouths that provide much of the sand for chenier formation. The beaches of Suriname essentially function as cheniers supplied with sediment by local rivers and with shells reworked by waves in the nearshore zone. These cheniers have not only played an important geological role in the building of the Guianas coastal plain, but are also the most important natural source of coastal protection. This protection role needs to be understood and highlighted as an important part of any future coastal zone management initiative in Suriname and the other Guianas countries. The work conducted on Braamspunt beach shows the drastic changes that have accompanied significant shortening of the beach over the last few years, in response to migration of a mud bank between the Maroni and Suriname Rivers. Sand mining has essentially affected the downdrift (west) end of the wider beach (type 1 chenier) which comprises successive spit recurves ending at the mouth of the Suriname River. These conditions, and the rarity of currently active cheniers, signify a relatively fragile beach system that has been strongly impacted by sand mining. This activity impairs the coastal protective role played by the rare subsisting beaches in Suriname, while also contributing to depriving Suriname of its already relatively rare, and therefore valuable, beach-nesting sites for marine turtles.
Data Availability
All datasets generated for this study are included in the manuscript and/or the supplementary files.
Author Contributions
EA and MH designed the project. GB, EA, MH, and AG conducted the field work and the analyses.
Funding
We acknowledge WWF-Guianas, the CNRS Pépinière Interdisciplinaire de Guyane project GUIACHENIER, and the European Research and Development Fund project OYAMAR for funding.
Conflict of Interest Statement
The authors declare that the research was conducted in the absence of any commercial or financial relationships that could be construed as a potential conflict of interest.
Acknowledgments
This work benefited from the help and support of many people. We would especially like to thank Karin Bilo (formerly of WWF-Guianas) for logistical help in the field. The game wardens of the Nature Conservation Division of Suriname, Roy Ho Tsoi, Romeo Ramjiawan (drone operator), and Rudi Wongsoikromo (drone operator), and Support IT specialist Quinten Notopawiro provided and operated the drone and camera used to obtain the photogrammetric data. Our sincere thanks to them, as well as to August Randwijk of the Geological Mining Service of Suriname. The discussions with Roy Ho Tsoi, who provided us with field measurements of beach shortening in 2015 and 2016, were particularly instructive. Our thanks also to the students of the Anton de Kom University for their help during the field surveys.
Footnotes
References
Allison, M. A., and Lee, M. T. (2004). Sediment exchange between amazon mudbanks and fringing mangroves in French Guiana. Mar. Geol. 208, 169–190. doi: 10.1016/j.margeo.2004.04.026
Anthony, E. J. (1989). Chenier plain development in northern Sierra Leone, West Africa. Mar. Geol. 90, 297–309. doi: 10.1016/0025-3227(89)90132-1
Anthony, E. J., and Dolique, F. (2006). Intertidal subsidence and collapse features on wave-exposed, drift-aligned sandy beaches subject to Amazon mud: Cayenne, French Guiana. Earth Surf. Process. Landf. 31, 1051–1057. doi: 10.1002/esp.1361
Anthony, E. J., Gardel, A., Dolique, F., and Marin, D. (2011). The Amazon-influenced mud-bank coast of South America: an overview of short- to long-term morphodynamics of ‘inter-bank’ areas and chenier development. J. Coast. Res. 64, 25–29.
Anthony, E. J., Gardel, A., and Gratiot, N. (2014). Fluvial sediment supply, mud banks, cheniers and the morphodynamics of the coast of South America between the Amazon and Orinoco river mouths. Geol. Soc. Spec. Publ. 388, 533–560. doi: 10.1144/SP388.8
Anthony, E. J., Gardel, A., Gratiot, N., Proisy, C., Allison, M. A., Dolique, F., et al. (2010). The Amazon-influenced muddy coast of South America: a review of mud bank-shoreline interactions. Earth Sci. Rev. 103, 99–121. doi: 10.1016/j.earscirev.2010.09.008
Augustinus, P. G. (1978). The Changing Shoreline of Surinam (South America). Doctoral dissertation, University of Utrecht, Utrecht.
Augustinus, P. G. (2004). The influence of the trade winds on the coastal development of the Guianas at various scale levels: a synthesis. Mar. Geol. 208, 141–151. doi: 10.1016/j.margeo.2004.04.007
Augustinus, P. G., Hazelhoff, L., and Kroon, A. (1989). The chenier coast of Suriname: modern and geological development. Mar. Geol. 90, 269–281. doi: 10.1016/0025-3227(89)90129-1
Brunier, G., Fleury, J., Anthony, E. J., Gardel, A., and Dussouillez, P. (2016). Close-range airborne structure-from-motion photogrammetry for high-resolution beach morphometric surveys: examples from an embayed rotating beach. Geomorphology 261, 76–88. doi: 10.1016/j.geomorph.2016.02.025
Caut, S., Guirlet, E., and Girondot, M. (2010). Effect of tidal overwash on the embryonic development of leatherback turtles in French Guiana. Mar. Environ. Res. 69, 254–261. doi: 10.1016/j.marenvres.2009.11.004
Daniel, J. R. K. (1989). The chenier plain coastal system of Guyana. Mar. Geol. 90, 283–287. doi: 10.1016/0025-3227(89)90130-8
Gensac, E. (2012). Dynamique Morpho-Sédimentaire du Littoral Sous Influence Amazonienne - Influence des Forçages Hydrométéorologiques sur la Migration des Bancs de Vase et la Mangrove Côtière. Ph. D thesis. Dunkerque: Université du Littoral Côte d’Opale.
Girondot, M., Tucker, A. D., Rivalan, P., Godfrey, M. H., and Chevalier, J. (2002). Density-dependent nest destruction and population fluctuation of Guianan leatherback turtles. Anim. Conserv. 5, 75–84.
Gratiot, N., Gardel, A., and Anthony, E. J. (2007). Trade-wind waves and mud dynamics on the French Guiana coast, South America: input from ERA-40 wave data and field investigations. Mar. Geol. 236, 15–26. doi: 10.1016/j.margeo.2006.09.013
Hapke, C. J., Reid, D., Richmond, B. M., Ruggiero, P., and List, J. (2006). National Assessment of Shoreline Change, Part 3: Historical Shoreline Change and Associated Coastal Land Loss Along Sandy Shorelines of the California Coast. Reston, VA: USGS, 13–14. doi: 10.3133/ofr20061219
Hein, C. J., Fitzgerald, D. M., de Souza, L. H. P., Georgious, J. Y., Buynevich, I. V., Klein, A. D. F., et al. (2016). Complex coastal change in response to autogenic basin infilling: an example from a sub-tropical Holocene strandplain. Sedimentology 63, 1362–1395. doi: 10.1111/sed.12265
Hori, K., Saito, Y., Zhao, Q., Cheng, X., Wang, P., Sato, Y., et al. (2001). Sedimentary facies and Holocene progradation rates of the Changjiang (Yangtze) delta, China. Geomorphology 41, 233–248. doi: 10.1016/S0169-555X(01)00119-2
Horikawa, K. (1988). Nearshore Dynamics and Coastal Processes: Theory, Measurement and Predictive Models. Tokyo: University of Tokyo Press.
Kelle, L., Gratiot, N., Nobilos, I., Thérèse, J., Wongsopawiro, R., and De Thoisy, B. (2007). Monitoring of the nesting leatherback turtle (Dermochelys coriacea): contribution of remote-sensing for real-time assessment of beach coverage in French Guiana. Chelonian Conserv. Biol. 6, 142–147. doi: 10.2744/1071-8443(2007)6[142:MONLTD]2.0.CO;2
Martinez, J. M., Guyot, J. L., Filizola, N., and Sondag, F. (2009). Increase in sediment discharge of the Amazon River assessed by monitoring network and satellite data. Catena 79, 257–264. doi: 10.1016/j.catena.2009.05.011
McBride, R. A., Taylor, M. J., and Byrnes, M. R. (2007). Coastal morphodynamics and chenier-plain evolution in southwestern Louisiana, USA: a geomorphic model. Geomorphology 88, 367–442. doi: 10.1016/j.geomorph.2006.11.013
Nardin, W., and Fagherazzi, S. (2018). The role of waves, shelf slope, and sediment characteristics on the development of erosional chenier plains. Geophys. Res. Lett. 45, 8435–8444. doi: 10.1029/2018GL078694
Otvos, E. G. (2018). “Cheniers,” in Encyclopaedia of Coastal Science, eds C. Finkl and C. Makowski (Berlin: Springer), doi: 10.1007/978-3-319-48657-4_67-5
Otvos, E. G., and Price, W. A. (1979). Problems of Chenier genesis and terminology: an overview. Mar. Geol. 31, 251–263. doi: 10.1016/0025-3227(79)90036-7
Péron, C., Chevallier, D., Galpin, M., Chatelet, A., Anthony, E. J., and Gardel, A. (2013). Beach morphological changes in response to marine turtles nesting: a preliminary study of Awala-Yalimapo beach, French Guiana (South America). J. Coastal Res. Spec. Issue 65, 99–104. doi: 10.2112/SI65-018.1
Prost, M. T. (1989). Coastal dynamics and chenier sands in French Guiana. Mar. Geol. 90, 259–267. doi: 10.1016/0025-3227(89)90128-X
Pujos, M., Bouysse, P., and Pons, J. C. (1990). Sources and distribution of heavy minerals in Late Quaternary sediments of the French Guiana continental shelf. Cont. Shelf Res. 10, 59–79. doi: 10.1016/0278-4343(90)90035-K
Pujos, M., Pons, J. C., and Parra, M. (2000). Les minéraux lourds des sables du littoral de la Guyane française : bilan sur l’origine des dépôts de la plate-forme des Guyanes. Oceanol. Acta 24(Suppl.), S27–S35. doi: 10.1016/S0399-1784(01)00093-7
Rosati, J. D., Dean, R. G., and Stone, G. W. (2010). A cross-shore model of barrier island migration over a compressible substrate. Mar. Geol. 271, 1–16. doi: 10.1016/j.margeo.2010.01.005
Saito, Y., Wei, H., Zhou, Y., Nishimura, A., Sato, Y., and Yokota, S. (2000). Delta progradation and chenier formation in the Huanghe (Yellow River) delta, China. J. Asian Earth Sci. 18, 489–497. doi: 10.1016/S1367-9120(99)00080-2
Scheffers, A., Engel, M., Scheffers, S., Squire, P., and Kelletat, D. (2012). Beach ridge systems - archives for Holocene coastal events? Prog. Phys. Geogr. 36, 5–37. doi: 10.1177/0309133311419549
Sénéchal, N., Dupuis, H., Bonneton, P., Howa, H., and Pedreros, R. (2001). Observation of irregular wave transformation in the surf zone over a gently sloping sandy beach on the French Atlantic coastline. Oceanolog. Acta 24, 545–556. doi: 10.1016/S0399-1784(01)01171-9
Sottolichio, A., Gardel, A., Huybrechts, N., Maury, T., Morvan, S., and Lesourd, S. (2018). Premières Observations de la Dynamique Hydro-Sédimentaire de L’estuaire du Maroni (Guyane française). Available at: http://www.paralia.fr/jngcgc/15_33_sottolichio.pdf
Tamura, T. (2012). Beach ridges and prograded beach deposits as palaeoenvironment records. Earth Sci. Rev. 114, 279–297. doi: 10.1016/j.earscirev.2012.06.004
Thieler, E. R., Himmelstoss, E. A., Zichichi, J. L., and Ergul, A. (2009). Digital Shoreline Analysis System (DSAS) Version 4.0 - An ArcGIS Extension for Calculating Shoreline Change. Reston, VA: U.S. Geological Survey.
van Maren, D. S. (2005). Barrier formation on an actively prograding delta system: the red river delta. Vietnam. Mar. Geol. 224, 123–143. doi: 10.1016/j.margeo.2005.07.008
Walcker, R., Anthony, E. J., Cassou, C., Aller, R. C., Gardel, A., Proisy, C., et al. (2015). Fluctuations in the extent of mangroves driven by multi-decadal changes in north atlantic waves. J. Biogeogr. 42, 2209–2219. doi: 10.1111/jbi.12580
Wells, J. T., and Coleman, J. M. (1981). Physical processes and fine-grained sediment dynamics, coast of Surinam, South America. J. Sed. Petrol. 51, 1053–1068.
Westoby, M. J., Brasington, J., Glasser, N. F., Hambrey, M. J., and Reynolds, J. M. (2012). ‘Structure-from-Motion’ photogrammetry: a low-cost, effective tool for geoscience applications. Geomorphology 179, 300–314. doi: 10.1016/j.geomorph.2012.08.021
Winterwerp, J. C., de Graaff, R. F., Groeneweg, J., and Luijendijk, A. P. (2007). Modelling of wave damping at Guyana mud coast. Coast. Eng. 54, 249–261. doi: 10.1016/j.coastaleng.2006.08.012
Wittmann, H., von Blackenberg, F., Maurice, L., Guyot, J. L., Filizola, N., and Kubik, P. W. (2011). Sediment production and delivery in the Amazon River basin quantified by in-situ-produced cosmogenic nuclides and recent river loads. Geol. Soc. Am. Bull. 123, 934–950. doi: 10.1130/B30317.1
Wong, Th. E, De Kramer, R., De Boer, P. L., Langereis, C., and Sew-A-Tion, J. (2009). The influence of sea level changes on tropical coastal wetlands: the pleistocene coropina formation, Suriname. Sediment. Geol. 216, 127–137. doi: 10.1016/j.sedgeo.2009.02.003
Keywords: chenier, Amazon-Orinoco coast, mud bank, muddy Guianas coast, beach morphodynamics
Citation: Anthony EJ, Brunier G, Gardel A and Hiwat M (2019) Chenier Morphodynamics on the Amazon-Influenced Coast of Suriname, South America: Implications for Beach Ecosystem Services. Front. Earth Sci. 7:35. doi: 10.3389/feart.2019.00035
Received: 28 November 2018; Accepted: 14 February 2019;
Published: 07 March 2019.
Edited by:
Derek W. T. Jackson, Ulster University, United KingdomReviewed by:
Andrew Cooper, Ulster University, United KingdomDuncan FitzGerald, Boston University, United States
Copyright © 2019 Anthony, Brunier, Gardel and Hiwat. This is an open-access article distributed under the terms of the Creative Commons Attribution License (CC BY). The use, distribution or reproduction in other forums is permitted, provided the original author(s) and the copyright owner(s) are credited and that the original publication in this journal is cited, in accordance with accepted academic practice. No use, distribution or reproduction is permitted which does not comply with these terms.
*Correspondence: Edward J. Anthony, YW50aG9ueUBjZXJlZ2UuZnI=