The Need for a High-Accuracy, Open-Access Global DEM
 Hessel C. Winsemius1,2*
 Philip J. Ward3Ivan Gayton4
 Marie-Claire ten Veldhuis1
 Didrik H. Meijer1,2
 Mark Iliffe5
- 1Department of Water Management, Faculty of Civil Engineering and Geosciences, Delft University of Technology, Delft, Netherlands
- 2Deltares, Delft, Netherlands
- 3Institute for Environmental Studies, Vrije Universiteit Amsterdam, Amsterdam, Netherlands
- 4Humanitarian OpenStreetMap Team, Washington, DC, United States
- 5United Nations Statistics Division, Department of Economic and Social Affairs, United Nations, New York, NY, United States
A Commentary on
The Need for a High-Accuracy, Open-Access Global DEM
by Schumann, G. J.-P., and Bates, P. D. (2018). Front. Earth Sci. 6:225. doi: 10.3389/feart.2018.00225
Schumann and Bates (2018), hereafter referred to as SB, argue that there is a need for a global scale, high-accuracy, open-access Digital Elevation Model (DEM). They find current global DEM data unacceptable in accuracy and resolution. They position their argument mainly around hydraulic applications, by referring to required accuracies to estimate hydraulic energy slopes, and the need for highly detailed topography in urban zones, where most flood impacts are felt. A vertical accuracy of 0.5 meter is suggested to be adequate for local scale applications. This DEM, according to SB, can be established through a collaborative effort of industry, governments and humanitarian agencies by merging and quality assuring DEMs from different existing sources such as Light-Detection and Ranging missions, photogrammetry or satellite stereo. They close their plea by stating that the anticipated DEM will “help communities build resilience to anticipated climate impacts.”
We support the statement that a DEM with the envisioned accuracy is useful. In fact, it is a general prerequisite to simulating flood behavior at large scales, as indicated by SB. In addition, terrain and elevation data at this level of detail may find its application in other fields such as morphology (e.g., Tarolli and Sofia, 2016), cadastral digitization (e.g., Dorninger and Pfeifer, 2008) and landslide predictions (e.g., Ciampalini et al., 2016). However, at the level of detail suggested (urban zones), an accurate DEM alone is not enough if the objective of flood modeling goes beyond awareness raising or flood zoning. In this commentary, we argue that: (a) the “consortium effort” proposed by SB should focus on regions that will profit most: developing countries; (b) technically, at the local scale where the suggested accuracy (0.5 m) with the suggested spatial resolution (~5 m) becomes useful, other properties of the environment besides terrain become dominant in flood behavior and, consequently, in flood risk. These include the water infrastructure (bridges, channels, culverts, etc.) and its maintenance state. Such infrastructure information is key in establishing what makes a street, neighborhood or city more flood resilient, hence supporting communities in their decision-making for a sustainable future; and (c) that a bottom-up data collection approach for infrastructure and maintenance states will lead to less inequality in global data coverage and a reduction in dependency on outside capacities. This then leads to sustainable data collection and ownership in the regions where flood risk information is most needed. We elaborate on these three points below.
First and foremost, the efforts should concentrate on the regions that may profit most (in socio-economic terms) from an open-access DEM, provided it is kept up to date, as SB suggest. These are rapidly urbanizing cities in developing countries, where no local resources are at hand to regularly establish a detailed DEM. Globally, urban population already accounts for over 50% of total population. In developing countries this number is still below 50% but the expectation is that it will rapidly catch up with an expected 90% growth in urban population happening in Africa and Asia until 2050 (United Nations, 2018). Furthermore, in these areas, poor people may be affected to a degree that it traps them into poverty (Winsemius et al., 2018) and therefore there is a strong rationale to link climate and poverty policies (Hallegatte et al., 2016) in order to achieve global sustainability targets.
Within these urban areas in developing countries, flood protection is very limited (Scussolini et al., 2016). Hence pluvial floods can cause frequent small-scale impacts, and river floods will already occur with flow in excess of natural bank-full capacity. According to extreme value theorem, this occurs at the very least once every 1.5–2 years (i.e., the most occurring annual flood, see e.g., Dunne and Leopold, 1978; Savenije, 2003). It is likely, that due to rapid urbanization, overbank flow will occur even more frequently than once every 1.5–2 years, due to decreased soil water holding capacity, rapid erosion and impediments in drainage due to sediment and solid waste deposition around and in front of infrastructure. It is these moderate floods that cause the largest contribution to a community's accumulated risk, because they simply occur most frequently (Veldhuis et al., 2011). In urban environments, these moderate events are much more dictated by details, i.e., local infrastructural impediments (e.g., lack of drainage connectivity, open and closed tertiary drainage, culverts) and their maintenance state (drainage impediments by sedimentation, solid waste accumulation) than solely the surrounding topography (e.g., Veldhuis, 2011; Rodriguez et al., 2013). We see all such issues occurring in our experience in working in for instance Dar es Salaam, Accra, Jakarta and Nairobi. Besides quality of flood simulations, the ability to assess the drainage system and effectiveness of interventions in urban systems is essential. For this, the status-quo, i.e., the present-day drainage infrastructure and its maintenance state are essential to understand, and we even argue that this requires attention first and foremost.
Finally, we strongly advocate that the rather top-down approach to data collection, suggested by SB, is complemented by bottom-up approaches, supported by local initiatives and incentives. The top-down approach can offer a first important short-term alleviation of data poverty. However, it is difficult to sustain this, especially if international commercial considerations are at stake. Why would a company such as Google, map a poor vulnerable neighborhood, including its water infrastructure when there is little commercial gain to be expected? Furthermore, top-down implies that capital is brought in from outside rather than building capacity to generate capital on the inside. Human capital, expressed in raising of knowledge and education levels, is the main corner stone of prosperity and economic growth in the long-term (Solow, 1956; Piketty, 2014) and therefore, a locally sustainable approach to data collection should be sought to accompany global data collection efforts. For instance, data collection through community mapping is now moving from efforts deployed ex-post, i.e., responding to a crisis (Hagen, 2010; Soden and Palen, 2014) to ex-ante, exemplified by the largest community mapping project in the world “Ramani Huria” (Swahili for “Open Map”), taking place in Dar es Salaam—Tanzania. This project aims to build preparedness and resilience by letting citizens map their own environment (Iliffe et al., 2017). These methods are still in their infancy, and sustainable incentivization is a large challenge. But first results show that if communities are organized, detailed and accurate information on infrastructure, such as roads, bridges, channels, culverts, man-holes along with their dimensions and maintenance states can be collected in a very short time and with very few resources1,2 Ramani Huria demonstrates that this can work by empowering academics through curriculum development, gradually leading to expertise within authorities as well. Figure 1 illustrates how this can result in a plethora of data that is valuable from a sustainability and humanitarian point of view, even if it has relatively little direct commercial interest. The left-hand side shows the status of Google Maps (on 4 January 2019) vs. the right-hand showing OpenStreetMap at the same date. Recent floods led to water authorities now accepting the use of these data, even though they were not collected by their own staff. Ramani Huria can serve as an example for water authorities elsewhere, demonstrating that bottom-up data collection processes lead to good and even more complete data than what can be achieved by authority data collection efforts. The scientific community can facilitate bottom-up data collection approaches such as community mapping through two research directions: first, to find social structures to promote and create incentives to data collection (Buytaert et al., 2014; Paul et al., 2018); and second through new innovative, affordable and sustainable instrumentation (van de Giesen et al., 2014; Tauro et al., 2018), and local quality assurance methods.
FIGURE 1
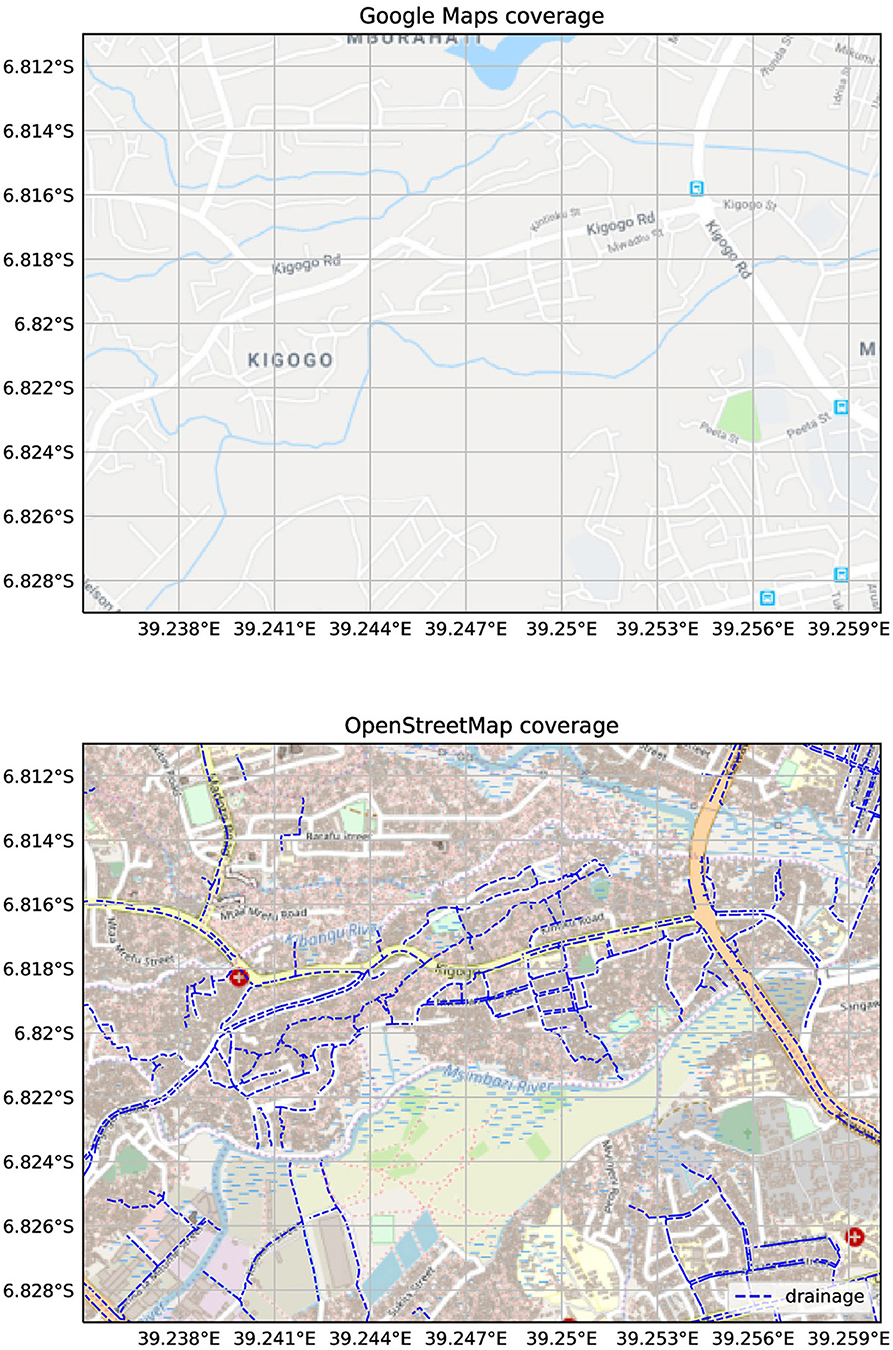
Figure 1. Comparison between Google Maps and OpenStreetMap (4 January 2019) over central Dar es Salaam. Drainage data (dated 3 January 2019) is not yet contributed to OpenStreetMap and therefore plotted separately. Top: Map data © 2019 Google; Bottom: Map data © OpenStreetMap contributors, CC BY-SA.
Concluding, a global scale higher accuracy DEM with the envisioned accuracy will be very useful both to science and practitioners. But to truly assist the most critically targeted environments in their road to a sustainable future, elevation data have to be accompanied by information on infrastructure, including its dimensions and state of maintenance. We fully agree with SB that targeted regions should be urban areas, as these accommodate most of the global population and economy, and we advocate that focus should lie on developing countries, where the urbanization rates are the highest and data poverty is most extreme. To truly increase resilience here, the top-down data collection process should be considered an important short-term data poverty alleviation step, which needs to be accompanied by a more sustainable, bottom-up procedure to establish the continued gathering of critical information for flood resilience.
Author Contributions
All authors listed have made a substantial, direct and intellectual contribution to the work, and approved it for publication.
Funding
PW is supported by a VIDI grant (016.161.324) from the Netherlands Organisation for Scientific Research (NWO).
Conflict of Interest Statement
The authors declare that the research was conducted in the absence of any commercial or financial relationships that could be construed as a potential conflict of interest.
Acknowledgments
We thank the World Bank for the continuing support in community mapping efforts in Dar es Salaam, on which parts of this article have been based. The opinions reflected in this article do not represent the opinion of any government or other entity.
Footnotes
1. ^http://ramanihuria.org/drain-mapping-flood-modelling/
2. ^https://medium.com/@h.c.winsemius/community-mapping-for-flood-modelling-2-0-a3b794e02d16
References
Buytaert, W., Zulkafli, Z., Grainger, S., Acosta, L., Alemie, T. C., Bastiaensen, J., et al. (2014). Citizen science in hydrology and water resources: opportunities for knowledge generation, ecosystem service management, and sustainable development. Front. Earth Sci. 2:26. doi: 10.3389/feart.2014.00026
Ciampalini, A., Raspini, F., Frodella, W., Bardi, F., Bianchini, S., and Moretti, S. (2016). The effectiveness of high-resolution LiDAR data combined with PSInSAR data in landslide study. Landslides 13, 399–410. doi: 10.1007/s10346-015-0663-5
Dorninger, P., and Pfeifer, N. (2008). A comprehensive automated 3D approach for building extraction, reconstruction, and regularization from airborne laser scanning point clouds. Sensors 8, 7323–7343. doi: 10.3390/s8117323
Dunne, T., and Leopold, L. B. (eds.). (1978). Water in Environmental Planning. San Francisco, CA: Freeman and Company.
Hagen, E. (2010). Putting Nairobi's Slums on the Map. Dev. Outreach 12, 41–43. doi: 10.1596/1020-797X_12_1_41
Hallegatte, S., Bangalore, M., Bonzanigo, L., Fay, M., Kane, T., Narloch, U., et al. (2016). Shock Waves: Managing the Impacts of Climate Change on Poverty. Washington D.C.: World Bank Publications Available online at: https://openknowledge.worldbank.org/handle/10986/22787 (Accessed April 6, 2016).
Iliffe, M., Goulding, J., and Winsemius, H. C. (2017). “Towards a conceptual framework for participatory mapping in developing countries,” in GISRUK 2017 (Manchester).
Paul, J. D., Buytaert, W., Allen, S., Ballesteros-Cánovas, J. A., Bhusal, J., Cieslik, K., et al. (2018). Citizen science for hydrological risk reduction and resilience building. Wiley Interdiscip. Rev. Water 5:e1262. doi: 10.1002/wat2.1262
Rodriguez, F., Bocher, E., and Chancibault, K. (2013). Terrain representation impact on periurban catchment morphological properties. J. Hydrol. 485, 54–67. doi: 10.1016/j.jhydrol.2012.11.023
Savenije, H. H. G. (2003). The width of a bankfull channel; Lacey's formula explained. J. Hydrol. 276, 176–183. doi: 10.1016/S0022-1694(03)00069-6
Schumann, G. J.-P., and Bates, P. D. (2018). The need for a high-accuracy, open-access global DEM. Front. Earth Sci. 6:225. doi: 10.3389/feart.2018.00225
Scussolini, P., Aerts, J. C. J. H., Jongman, B., Bouwer, L. M., Winsemius, H. C., de Moel, H., et al. (2016). FLOPROS: an evolving global database of flood protection standards. Nat. Hazards Earth Syst. Sci. 16, 1049–1061. doi: 10.5194/nhess-16-1049-2016
Soden, R., and Palen, L. (2014). “From crowdsourced mapping to community mapping: the post-earthquake work of OpenStreetMap Haiti,” in COOP 2014 - Proceedings of the 11th International Conference on the Design of Cooperative Systems, 27-30 May 2014, Nice (France) (Cham: Springer International Publishing), 311–326.
Solow, R. M. (1956). A Contribution to the Theory of Economic Growth. Q. J. Econ. 70, 65–94. doi: 10.2307/1884513
Tarolli, P., and Sofia, G. (2016). Human topographic signatures and derived geomorphic processes across landscapes. Geomorphology 255, 140–161. doi: 10.1016/j.geomorph.2015.12.007
Tauro, F., Selker, J., van de Giesen, N., Abrate, T., Uijlenhoet, R., Porfiri, M., et al. (2018). Measurements and Observations in the XXI century (MOXXI): innovation and multi-disciplinarity to sense the hydrological cycle. Hydrol. Sci. J. 63, 169–196. doi: 10.1080/02626667.2017.1420191
United Nations (2018). World Urbanization Prospect: The 2018 Revision - Key Facts. New York, NY: United Nations, Dept. of International Economic and Social Affairs.
van de Giesen, N., Hut, R., and Selker, J. (2014). The trans-african hydro-meteorological observatory (TAHMO). Wiley Interdiscip. Rev. Water 1, 341–348. doi: 10.1002/wat2.1034
Veldhuis, J. A. E. (2011). How the choice of flood damage metrics influences urban flood risk assessment. J. Flood Risk Manag. 4, 281–287. doi: 10.1111/j.1753-318X.2011.01112.x
Veldhuis, J. A. E., ten, Clemens, F. H. L. R., and Gelder, P. H. A. J. M., and van (2011). Quantitative fault tree analysis for urban water infrastructure flooding. Struct. Infrastruct. Eng. 7, 809–821. doi: 10.1080/15732470902985876
Keywords: DEM (digital elevation model), open-access, community mapping, urban, flood risk
Citation: Winsemius HC, Ward PJ, Gayton I, ten Veldhuis M-C, Meijer DH and Iliffe M (2019) Commentary: The Need for a High-Accuracy, Open-Access Global DEM. Front. Earth Sci. 7:33. doi: 10.3389/feart.2019.00033
Received: 16 January 2019; Accepted: 13 February 2019;
Published: 06 March 2019.
Edited by:
Ke Zhang, Hohai University, ChinaReviewed by:
Simone Tarquini, National Institute of Geophysics and Volcanology (INGV), ItalyCopyright © 2019 Winsemius, Ward, Gayton, ten Veldhuis, Meijer and Iliffe. This is an open-access article distributed under the terms of the Creative Commons Attribution License (CC BY). The use, distribution or reproduction in other forums is permitted, provided the original author(s) and the copyright owner(s) are credited and that the original publication in this journal is cited, in accordance with accepted academic practice. No use, distribution or reproduction is permitted which does not comply with these terms.
*Correspondence: Hessel C. Winsemius, aC5jLndpbnNlbWl1c0B0dWRlbGZ0Lm5s