- 1Graduate School of Science, Hokkaido University, Sapporo, Japan
- 2Graduate School of Science, Osaka City University, Osaka, Japan
- 3Graduate School of Science and Engineering, Tokyo Institute of Technology, Tokyo, Japan
The Izu-Oshima volcano is one of the most active volcanoes in Japan, and has generated relatively large-scale eruptions every 30–40 years for the past 200 years. As more than 30 years have passed since the last eruptions in 1986–87, volcanic activity is expected to resume in the near future. To help elucidate the current and future state of the volcano’s magma system, the temporal evolution of the recent magma plumbing system was investigated through a petrological and geochemical analysis of its basaltic lavas and pyroclastics (<∼53 wt.% of SiO2) that were erupted during the last ∼1.5 kyr. The basaltic products have variable phenocryst contents, ranging from ∼0 to ∼20 vol.%, and phenocryst-bearing samples commonly contain plagioclase, orthopyroxene, and clinopyroxene phenocrysts. The whole-rock compositions are significantly scattered in the Harker variation diagrams, suggesting that the compositional diversity was established by at least two independent magmatic processes. The application of principal component analysis on the whole-rock major element data suggests that one magmatic process was crystal fractionation of crystal-poor magmas, and the other process was either plagioclase accumulation or mixing of plagioclase-rich magmas. Based on this observation, and combined with the petrological analysis and previous geophysical studies, we propose that aphyric magmas, stored in an 8–10 km-deep magma chamber, progressively differentiated over time from the 7th to 20th century. Furthermore, the compositional variations in basalts resulted from the mixing of the differentiating aphyric magmas with variable proportions of porphyritic magmas derived from a 13–18 km-deep magma chamber. Because recent eruptions have been triggered by the ascent of porphyritic magma from the 13–18 km-deep magma chamber, and its injection into the 8–10 km-deep magma chamber, it is important to monitor the deeper magma chamber to predict future volcanic activity.
Introduction
The Izu-Oshima volcano, located on the volcanic front of the Izu arc (Figure 1), is one of the most active volcanoes in Japan, and younger volcanism (<∼1.5 ka) has produced mainly basaltic magmas with minor basaltic andesitic magmas. Relatively large-scale eruptions, in the order of 105–106 m3 of eruption volume, have occurred every 30–40 years for the past 200 years (1876–77, 1912–14, 1950–51, and 1986–87), and eruptions are expected to occur in the near future; therefore, many petrological and geochemical studies have been conducted to understand the magma plumbing system beneath the volcano (e.g., Fujii et al., 1988; Kawanabe, 1991; Nakano and Yamamoto, 1991; Hamada et al., 2011, 2014; Ishizuka et al., 2015). Our knowledge of magmatic processes has greatly advanced as a result of these studies, and there is now a consensus that basaltic magmas and basaltic andesitic magmas are stored in a main magma chamber located at 8–10 km depth and small magma bodies located at 4–5 km depth, respectively, and new magmas have been intermittently supplied to the main 8–10 km-deep magma chamber from a deeper magma chamber (Meteorological Agency, 2008; Hamada, 2016). However, fundamental questions still remain unsolved about the main basaltic magma system: Where is the deeper magma chamber located? What types of magmas (i.e., composition and phenocryst content) have been stored in the main magma chamber and the deeper magma chamber? What processes have been responsible for forming the basaltic products with variable compositions and phenocryst contents? How has the magma plumbing system evolved, in particular, in recent volcanic history? These issues are especially important for determining the current state of the magma system and for predicting future volcanic activity, in order to better manage the potential risks associated with a future eruption.
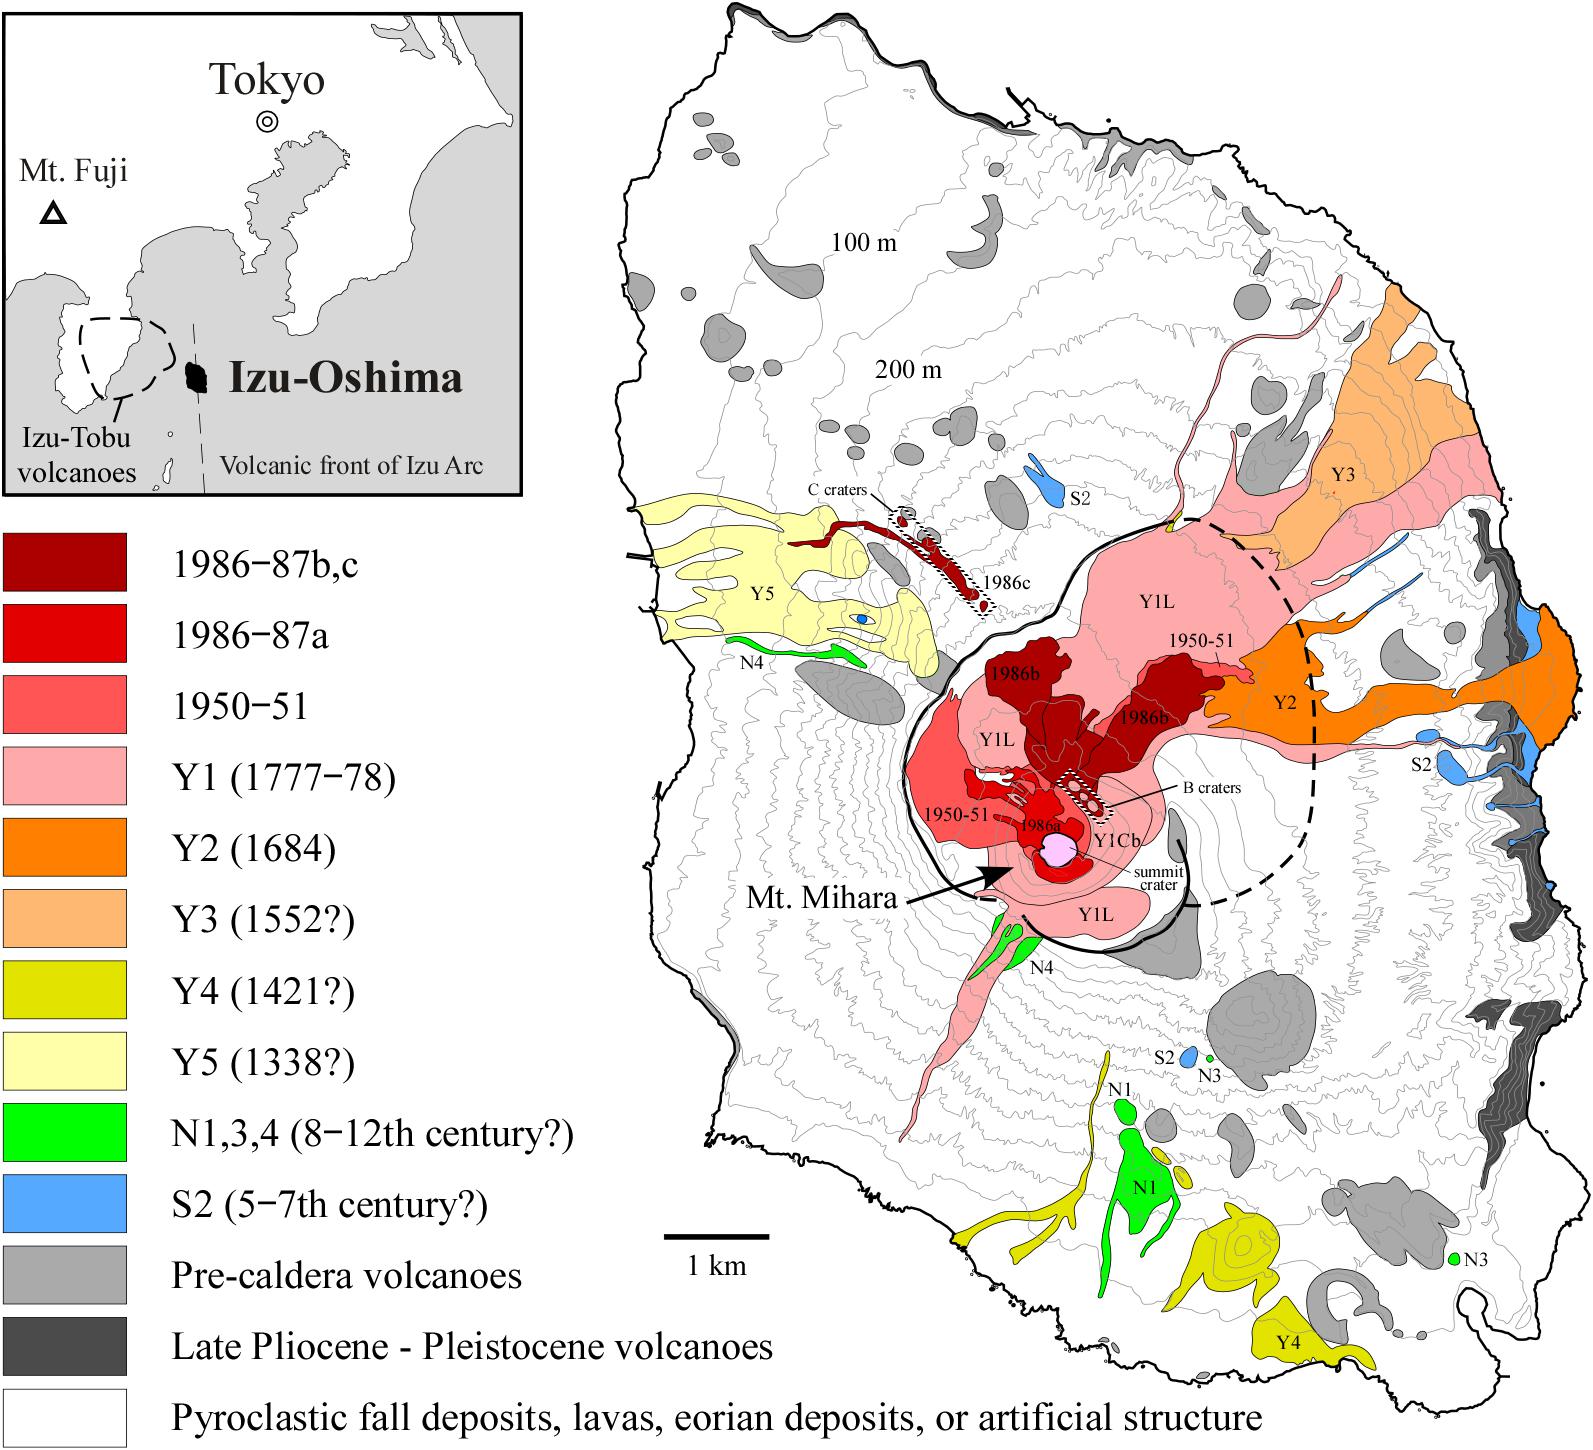
FIGURE 1. An index map showing the location of the Izu-Oshima volcano, and a geological map of the volcano (after Kawanabe, 1998). The location of the Izu-Tobu volcanoes is from Ishizuka et al. (2015). The distributions of the products of the S1, N2, Y6, Y1Ca, 1876–1877, and 1912–1914 eruptions are not shown because those of S1, N2, and Y6 mainly occur as scoria fall deposits, those of Y1Ca are entirely covered by those of Y1Cb, and those of the 1876–1877 and 1912–1914 eruptions were mainly ejected inside the summit crater of Mt. Mihara.
In this context, we collected about 160 samples from the volcano and carried out a petrological and geochemical study on these samples to understand the basaltic magma plumbing system in more detail. Principal component analysis was also conducted to help understand the cause of the geochemical variability of the basalts. We show that compositional variations in the basalts resulted from mixing of differentiating aphyric magmas in a shallower magma chamber with variable proportions of porphyritic magmas derived from a deeper magma chamber, and propose a new scenario for the recent magma plumbing system at Izu-Oshima.
Geological Settings
Izu-Oshima is a volcanic island located on the volcanic front of the Izu arc (Figure 1). Volcanic activity began about 30–40 ka, and the volcanic edifice has been built on Late Pliocene–Pleistocene basaltic volcanoes (Kawanabe, 1998). The activity is largely divided into pre-caldera (>∼1.5 ka) and syn- and post-caldera (<∼1.5 ka) volcanic periods (Nakamura, 1964; Isshiki, 1984; Kawanabe, 1998). Products of the younger syn- and post-caldera volcanism (Younger Oshima Group; YOG) consist of the Sashikiji Formation (S1 and S2), Nomashi Formation (N1–N4), and Yuba Formation (Y1–Y6) (Figure 1). The eruption of Y1 was the largest in the YOG, which began with scoria fall from the summit crater in 1777, forming Mt. Mihara (scoria cone). The scoria fall deposits can be divided into the lower “A spatter layer” and upper “B spatter layer,” with distinct whole-rock compositions (Misonou et al., 2005), which are referred to as “Y1Ca” and “Y1Cb,” respectively, in this study. These scoria-fall eruptions were followed by an effusion of lava flows from craters on the caldera floor (Y1L in Figure 1). After the Y1 eruption, relatively large-scale eruptions (in the order of 105–106 m3 of eruption volume) occurred in 1876–77, 1912–14, 1950–51, and 1986–87. The 1876–77 and 1912–14 eruptions occurred on the bottom of the summit crater of Mt. Mihara, and their products were ejected mainly inside the crater. The most recent 1986–87 eruption began at the summit crater (A crater) with fire fountaining, followed by an effusion of lava flow from the crater (1986–87a). Then, a fissure eruption started on the caldera floor and flank of the volcano (B and C craters, respectively, in Figure 1), resulting in the effusion of lava flows (1986–87b and c). Based on an analysis of seismic waveforms, Mikada et al. (1997) suggested that a main magma chamber, located at 8–10 km depth, and small magma chambers, located at 4–5 km depth, were involved in the 1986–87 eruption.
Previous Study
Petrological and geochemical studies have been conducted, in particular, on the products of the 1986–87 eruption. Fujii et al. (1988) showed that basaltic andesitic magmas erupted from the B and C craters (1986–87b and c) and the basaltic A-crater magmas (1986–87a) were not on a single liquid line of descent, suggesting that these two types of magmas originated in different magma chambers before the eruptions. By integrating the results of the preceding petrological and geophysical studies, Meteorological Agency (2008) proposed that the recent magma plumbing system at the Izu-Oshima volcano comprises a main magma chamber located at 8–10 km depth and small magma chambers at 4–5 km depth, and new magmas have been supplied to the main magma chamber from a deeper magma chamber. The basaltic 1986–87a magmas and basaltic andesitic 1986–87b and c magmas are considered to be derived from the main magma chamber at 8–10 km depth and one of the small magma chambers at 4–5 km depth, respectively. Hamada et al. (2011) estimated the water content of melt from the 1986–87a magma to be ∼5 wt.% at an 8–10 km depth using OH concentrations in the plagioclase phenocrysts. They also showed that the plagioclase phenocrysts equilibrated with melt at different depths: at the near surface level, at ∼4 km depth, and at 8–10 km depth.
Nakano and Yamamoto (1991) suggested that the plagioclase-phyric high-Al2O3 magmas erupted in the past 200 years, including those from the A crater in the 1986–87 eruption, were produced by the accumulation of plagioclase in a magma chamber. Fujii et al. (1988) showed that the Mg/Fe ratios of the eruptive products of YOG generally tend to decrease over time, and suggested that primary magma has not been supplied from the source mantle to the crustal magmatic system since the caldera formation. Hamada et al. (2014) examined the compositional variations of melt for all volcanic activity at Izu-Oshima, and found that the melt compositions fall within the area comprised between higher- and lower-Al/Si trends in compositional variation diagrams. Hamada (2016) attributed the higher- and lower-Al/Si trends to crystallization differentiation of magmas at the 8–10 km depth and ∼4 km depth magma chambers, respectively, which was controlled by the stability of plagioclase relative to mafic minerals. Recently, Ishizuka et al. (2015) reported geochemical data for the Izu-Oshima volcano and the adjacent Izu-Tobu volcanoes located at the rear-arc side of Izu-Oshima (Figure 1). Their results showed that the Izu-Tobu magmas were involved in the magma plumbing system at the Izu-Oshima volcano, in particular, before ∼5 ka.
Analytical Methods
In this study, about 160 samples were collected from the YOG of the volcano (S2, N4, N3, N1, Y5, Y4, Y3, Y2, Y1Ca, Y1Cb, Y1L, 1950–51, 1986–87a, and 1986–87b) according to the geological map (Figure 1). For a better understanding of the recent basaltic magma plumbing system, we collected plenty of samples for products of the recent eruptions (Y1Ca, Y1Cb, Y1L, 1950–51, and 1986–87a) to determine the compositional variability of each eruption stage. Whole-rock analysis, using X-ray fluorescence (XRF) spectrometry, was performed on all the samples. Trace element concentrations and Sr and Nd isotopic ratios were determined for about 30 representative samples. For whole-rock analysis, rock specimens were crushed to coarse chips 3–5 mm in diameter. The chips were rinsed with deionized water in an ultrasonic bath for >5 h and then dried at 110°C for >12 h. The washed chips were ground using an alumina mill. Concentrations of whole-rock major elements and some trace elements (Sc, V, Cr, Co, Ni, Rb, Sr, Y, Zr, and Ba) were obtained by XRF spectrometry using a Rigaku RIX 2100 at the Graduate School of Science, Osaka City University (Suda et al., 2010, 2011), and a Spectoris MagiX PRO at the Graduate School of Science, Hokkaido University. The powdered samples were ignited at 900°C for >12 h in a muffle furnace, and the loss on ignition (LOI) was determined gravimetrically. Glass beads were prepared by fusion with an alkali flux (2:1 sample dilution) consisting of a 4:1 mixture of lithium tetraborate and lithium metaborate. The composition of the Geological Survey of Japan reference material JB-3 was measured during the course of this study; the measured and reference values (Imai et al., 1995) and the analytical errors are listed in Table 1 of Kuritani et al. (2013) for the data obtained at Osaka City University and Supplementary Table S1 for the data obtained at Hokkaido University.
Additional trace elements were analyzed by inductively coupled plasma mass spectrometry (ICP-MS), using a Thermo Fisher Scientific X-series II at the Graduate School of Science and Technology, Tokyo Institute of Technology, and a Thermo Fisher Scientific X-series instrument at the Graduate School of Science, Hokkaido University, using the methods described in Yokoyama et al. (2016) and Lu et al. (2007). The trace element concentrations for JB-3 measured during this study and its reference values are listed in Supplementary Table S1. The analytical procedures for chemical separation followed the methods of Pin et al. (1994) and Noguchi et al. (2011) for Sr and Pin et al. (1994) and Pin and Zalduegui (1997) for Nd. Isotopic ratios were determined using a multiple collector (MC)–ICP–MS (Neptune plus, Thermo Fisher Scientific) at the Graduate School of Science, Hokkaido University. Mass fractionation factors for Sr and Nd were internally corrected using 86Sr/88Sr = 0.1194 and 146Nd/144Nd = 0.7219, respectively. Additional corrections were performed by applying a standard bracketing method using NIST987 and JNdi-1 for Sr and Nd isotopic analyses, respectively, and normalizing to 87Sr/86Sr = 0.710214 for NIST 987 and 143Nd/144Nd = 0.512117 for JNdi-1. The isotopic ratios of JB-3 measured during this study, reference values (Miyazaki and Shuto, 1998), and standard deviation for replicate analyses are provided in Supplementary Table S1.
Mineral compositions were determined using a JEOL JXA-8800 electron microprobe, located at the Graduate School of Science, Hokkaido University. For mafic minerals, an accelerating voltage of 15 kV, a beam current of 20 nA, and peak and background counting times of 20 and 10 s, respectively, were adopted. The operating conditions for plagioclase were an accelerating voltage of 15 kV, a beam current of 10 nA, peak and background counting times of 10 and 5 s, respectively, and a beam diameter of 10 μm. Both oxide and natural mineral standards (quartz, rutile, corundum, hematite, manganosite, periclase, wollastonite, jadeite, K-feldspar, and eskolaite) were used, and data were obtained using the ZAF correction method.
Petrography and Geochemistry
Petrography and Mineral Chemistry
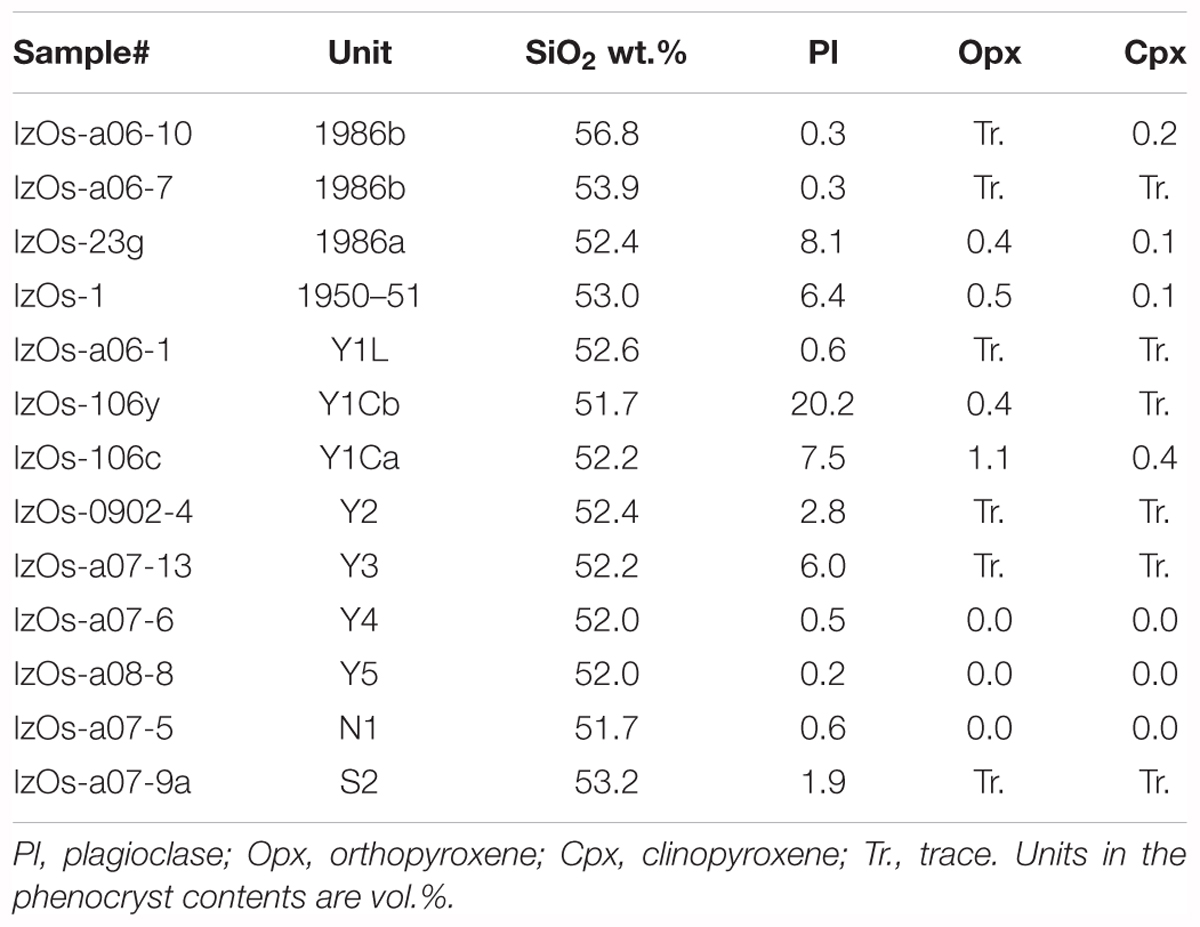
The contents of phenocryst (defined as >0.3 mm in length) in the representative YOG samples are listed in Table 1. The phenocryst assemblages of the products are primarily plagioclase, orthopyroxene, and clinopyroxene (Figure 2). Some unit samples are aphyric, with less than 1 vol.% phenocryst. During the Y1 eruption, the phenocryst contents changed from ∼10 vol.% (Y1Ca) through ∼20 vol.% (Y1Cb) to <3 vol.% (Y1L), and are essentially homogeneous in each unit. Similarly, in the 1986–87 eruption, the ejecta from the A crater are moderately plagioclase-phyric, whereas those from the B and C craters are aphyric.
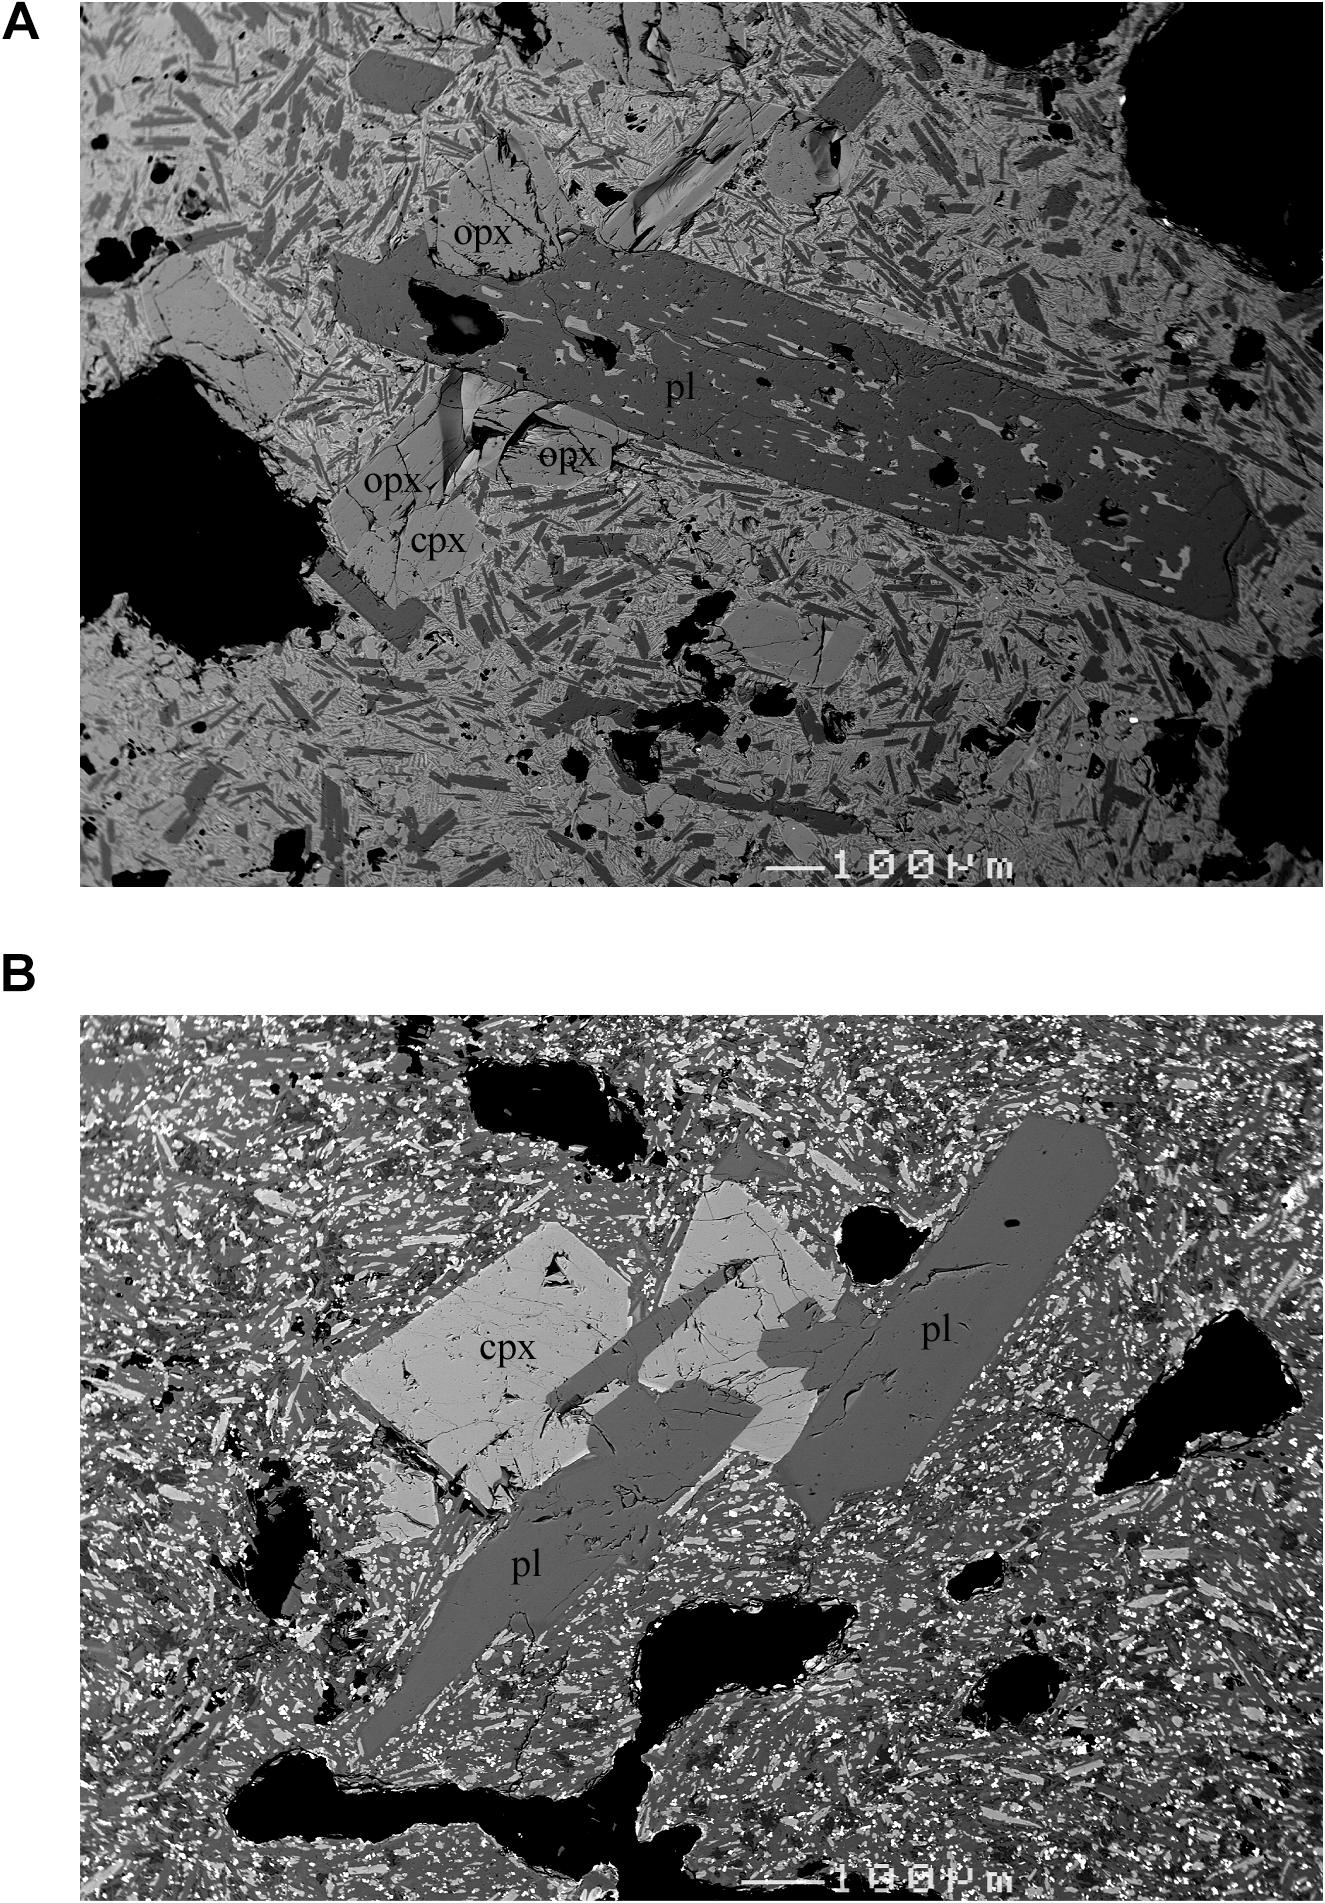
FIGURE 2. Back-scattered electron images (BEI) of crystal aggregates consisting of plagioclase and pyroxene phenocrysts in (A) 1950–51 and (B) 1986–87a products. “pl,” “opx,” and “cpx” indicate plagioclase, orthopyroxene, and clinopyroxene, respectively.
Plagioclase phenocrysts, up to 3 mm in length, are commonly euhedral. Those in the aphyric samples, such as those of the Y1L and 1986–87b, are usually smaller than 0.5 mm in length. The chemical compositions of representative plagioclase phenocrysts are listed in Supplementary Table S2. The plagioclase phenocrysts are generally homogeneous with respect to An content [100 × Ca/(Ca + Na)] except for the rims, although those with reverse zoning are rarely present. The An contents of the cores commonly range from 80 to 93 (Figure 3), and those of the rims are 65–75. Orthopyroxene and clinopyroxene phenocrysts, which are up to 1 mm in length, are commonly euhedral. The compositions of representative pyroxene phenocrysts are listed in Supplementary Table S3. Some phenocrysts are homogeneous or normally zoned in terms of Mg# [100 × Mg/(Mg + Fe)], while others rarely show reverse zoning. The Mg# contents of the phenocryst cores commonly range from 65 to 75, and those of the rims are as low as ∼60. Figure 4 shows the relationship between the Mg# of clinopyroxene phenocrysts and An content of the coexisting plagioclase phenocrysts (i.e., the clinopyroxene and the plagioclase showing evidence of contemporaneous growth) in products from recent eruptions (1950–51 and 1986–87) (Figure 2). In the 1986–87b samples, the An content of plagioclase phenocrysts is positively correlated with the Mg# of clinopyroxene phenocrysts, with few outlying data. Notably, the data for the 1950–51 and 1986–87a products do not lie on the trend formed by the data of the 1986–87b products.
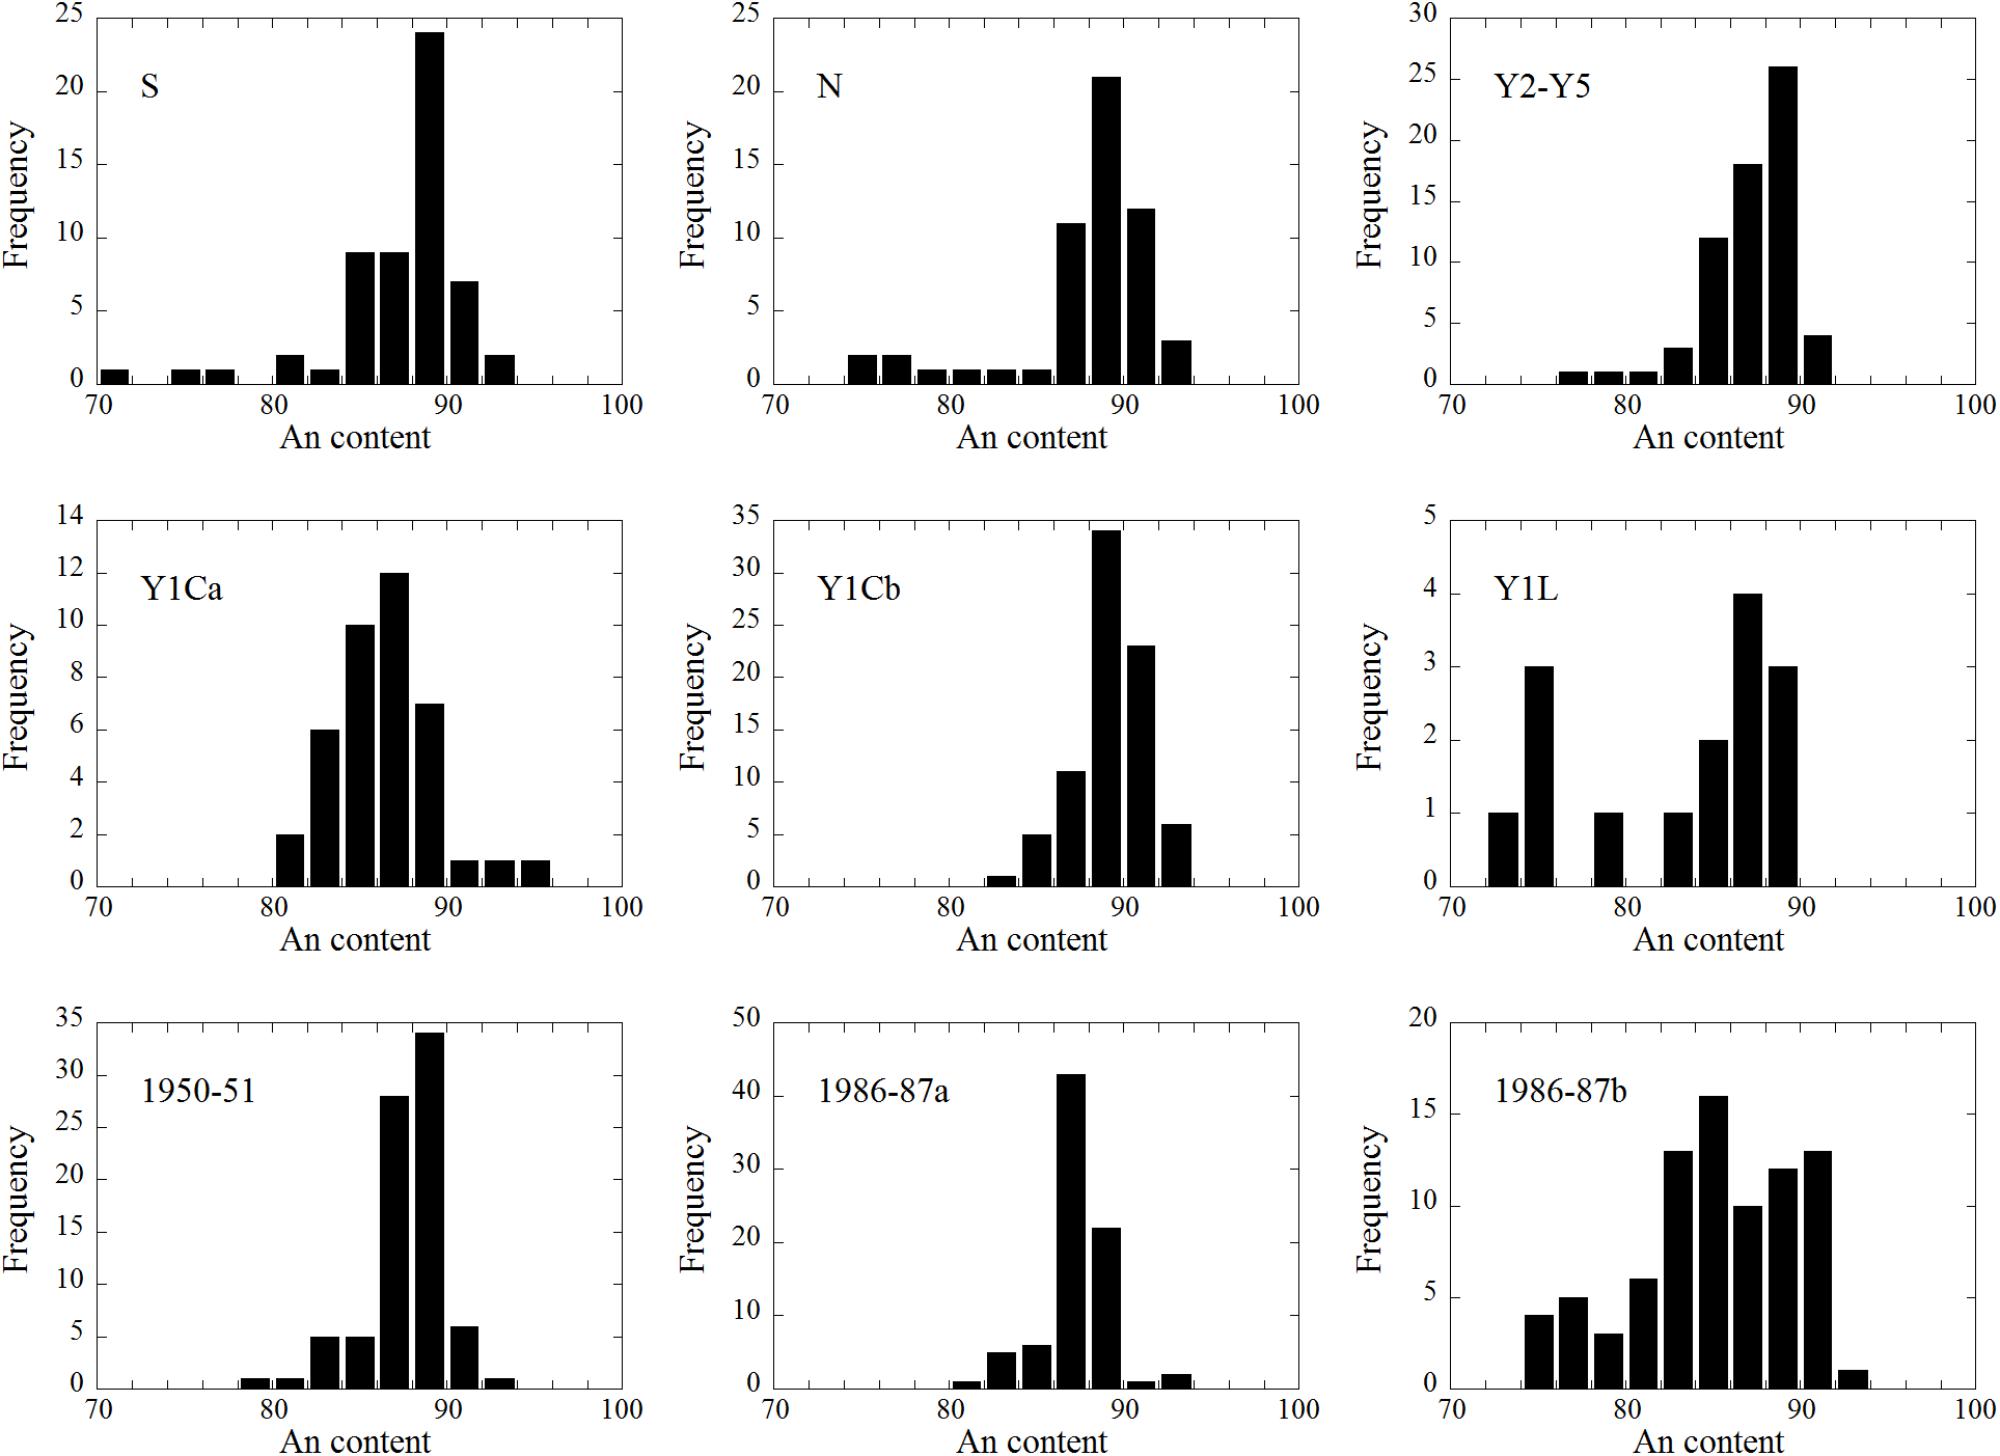
FIGURE 3. Histograms of An contents measured in plagioclase phenocryst cores for individual representative eruption stages.
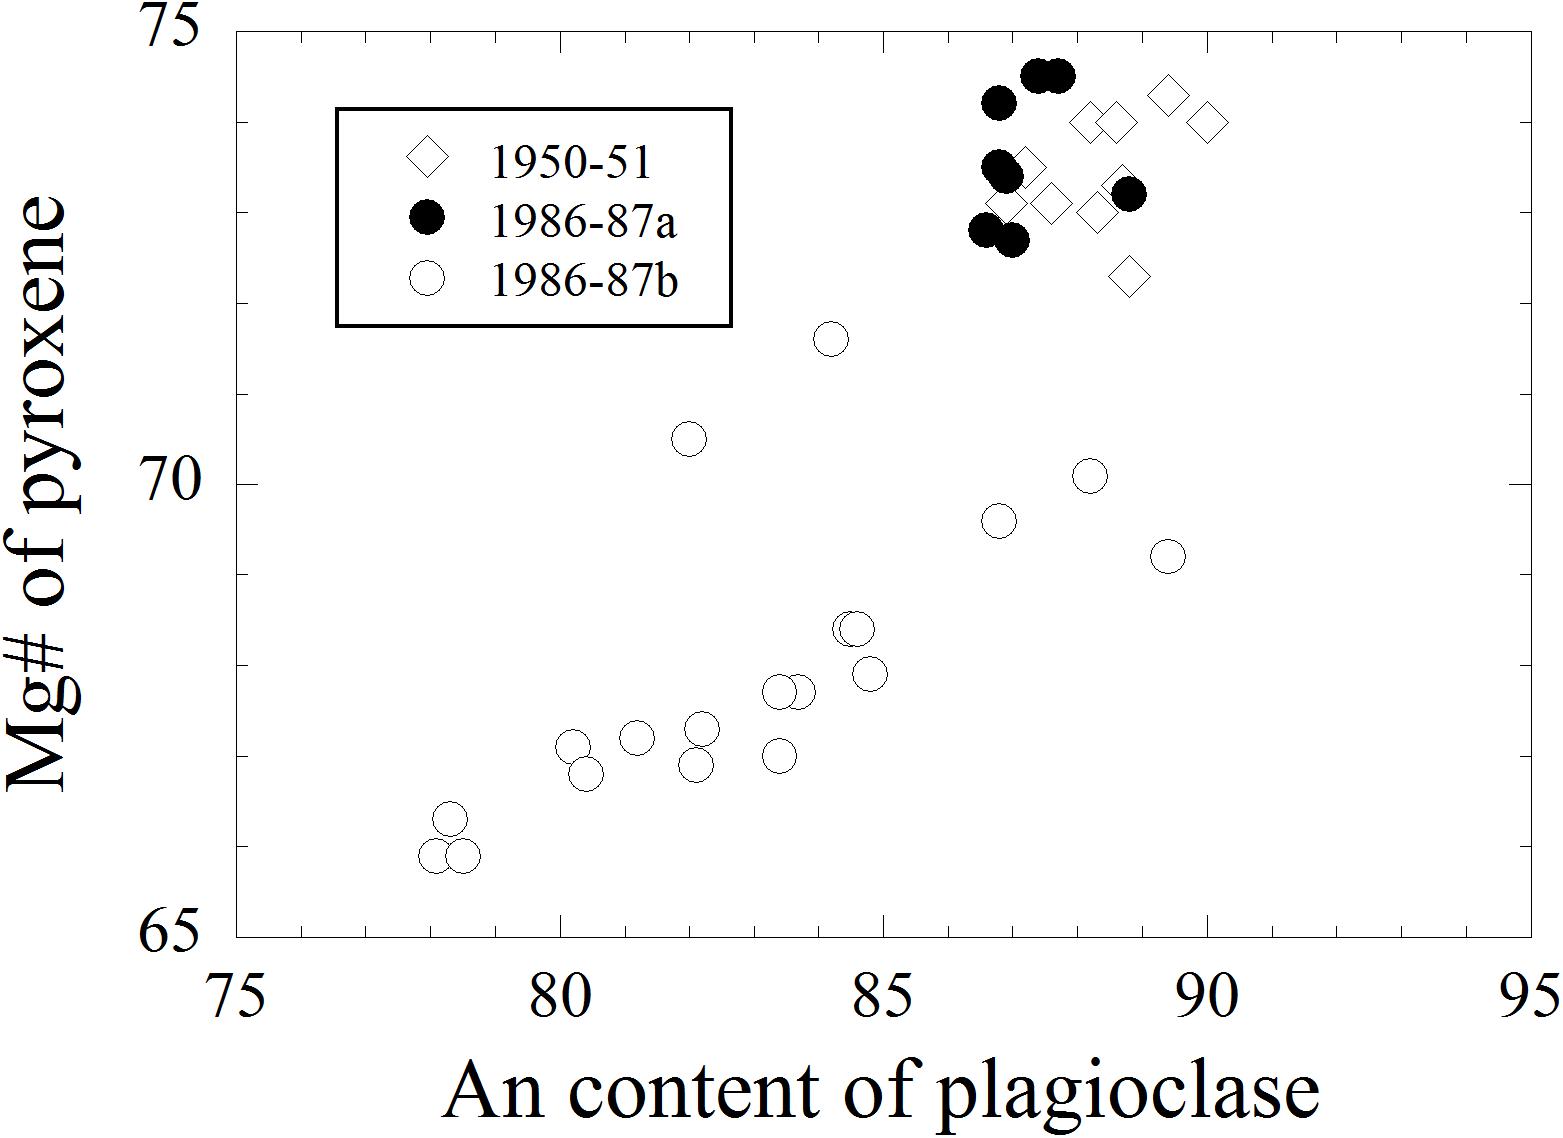
FIGURE 4. Relationship between the Mg# of clinopyroxene phenocrysts and An content of coexisting plagioclase phenocrysts in 1950–51, 1986–87a, and 1986–87b products.
Whole-Rock Composition
The whole-rock major and trace elements and Sr and Nd isotopic ratios of the YOG samples (S2, N4, N3, N1, Y5, Y4, Y3, Y2, Y1Ca, Y1Cb, Y1L, 1950–51, 1986–87a, and 1986–87b) are listed in Supplementary Table S1. Figure 5 shows Harker variation diagrams for some major oxides (TiO2, Al2O3, Fe2O3∗, MgO, CaO, and K2O) plotted against the SiO2 content. In the figures, the data including those of S1, N2, and Y6 provided by Fujii et al. (1988), Kawanabe (1991, 1998), and Ishizuka et al. (2015) are also shown (plots in gray). The data can be largely divided into those with basaltic compositions (<∼53 wt.%) and those with basaltic andesitic compositions (>∼53 wt.%). As reported in previous studies, the basaltic samples generally show negative correlation in the Al2O3–SiO2 diagram, whereas the Al2O3 contents of the basaltic andesitic samples are mostly homogeneous. The basaltic andesite samples consist mainly of the 1986–1987 products ejected from the B and C craters (1986–87b and c). Some products from N3, S2, and Y5 also have basaltic andesitic compositions. The three types of 1777–78 products, i.e., Y1Ca, Y1Cb, and Y1L, have distinct whole-rock compositions, and
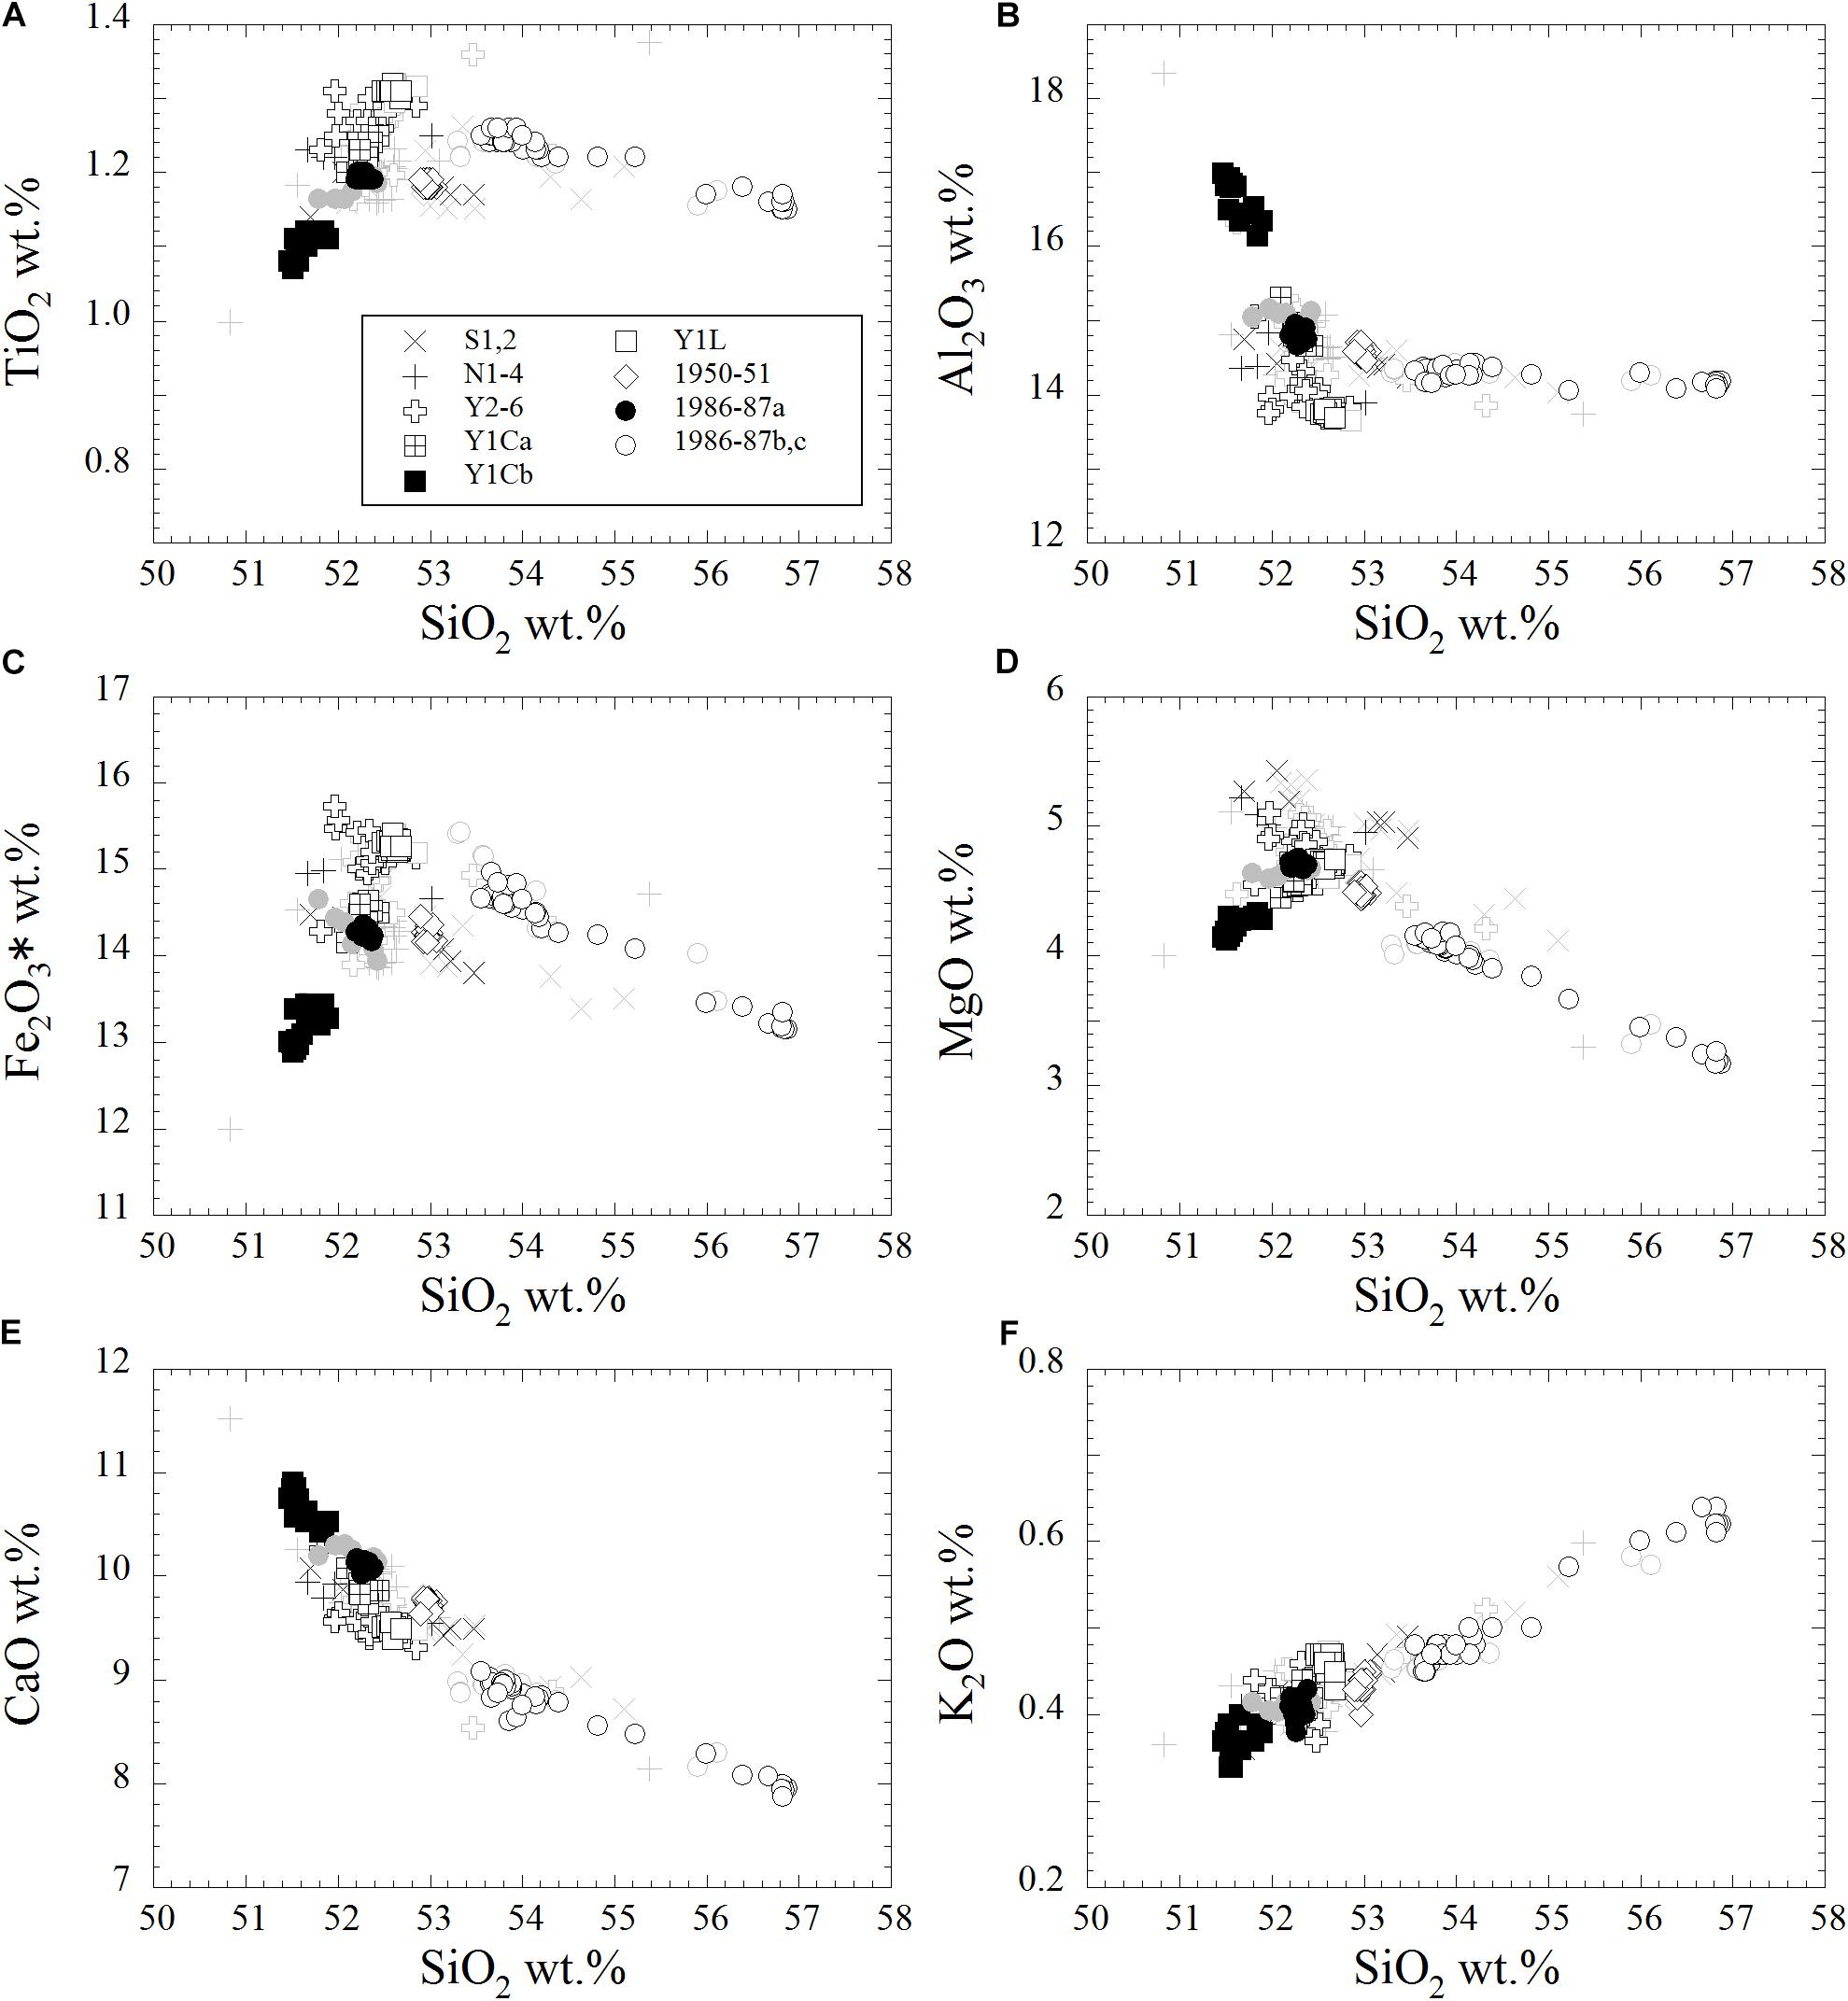
FIGURE 5. SiO2 variation diagrams for (A) TiO2, (B) Al2O3, (C) Fe2O3∗, (D) MgO, (E) CaO, and (F) K2O measured in samples from the Younger Oshima Group. Data other than those obtained in this study are taken from Fujii et al. (1988), Kawanabe (1991, 1998), and Ishizuka et al. (2015), and they are shown in gray.
those with higher abundance of plagioclase phenocrysts (Table 1) have higher Al2O3 contents.
Figures 6A–D show the variation diagrams for Ni, Sr, Zr, and Ba plotted against SiO2 content. The products of Y1Cb, characterized by higher Al2O3 contents (Figure 5B), also have high Sr content. The Zr and Ba concentrations of products from the YOG tend to increase with SiO2 content, similar to the K2O contents. A primitive mantle (PM)-normalized rare earth element (REE) concentration diagram for representative products is shown in Figure 7. The pattern is characterized by the light REEs being more depleted than the heavy REEs. A negative Eu anomaly is observed in all samples. In the 1986–87b products, the higher SiO2 sample has higher REE concentrations. Variations in 87Sr/86Sr and 143Nd/144Nd ratios with SiO2 content are shown in Figures 6E,F. The 87Sr/86Sr and 143Nd/144Nd ratios of the samples of the YOG are essentially homogeneous, irrespective of SiO2 contents.
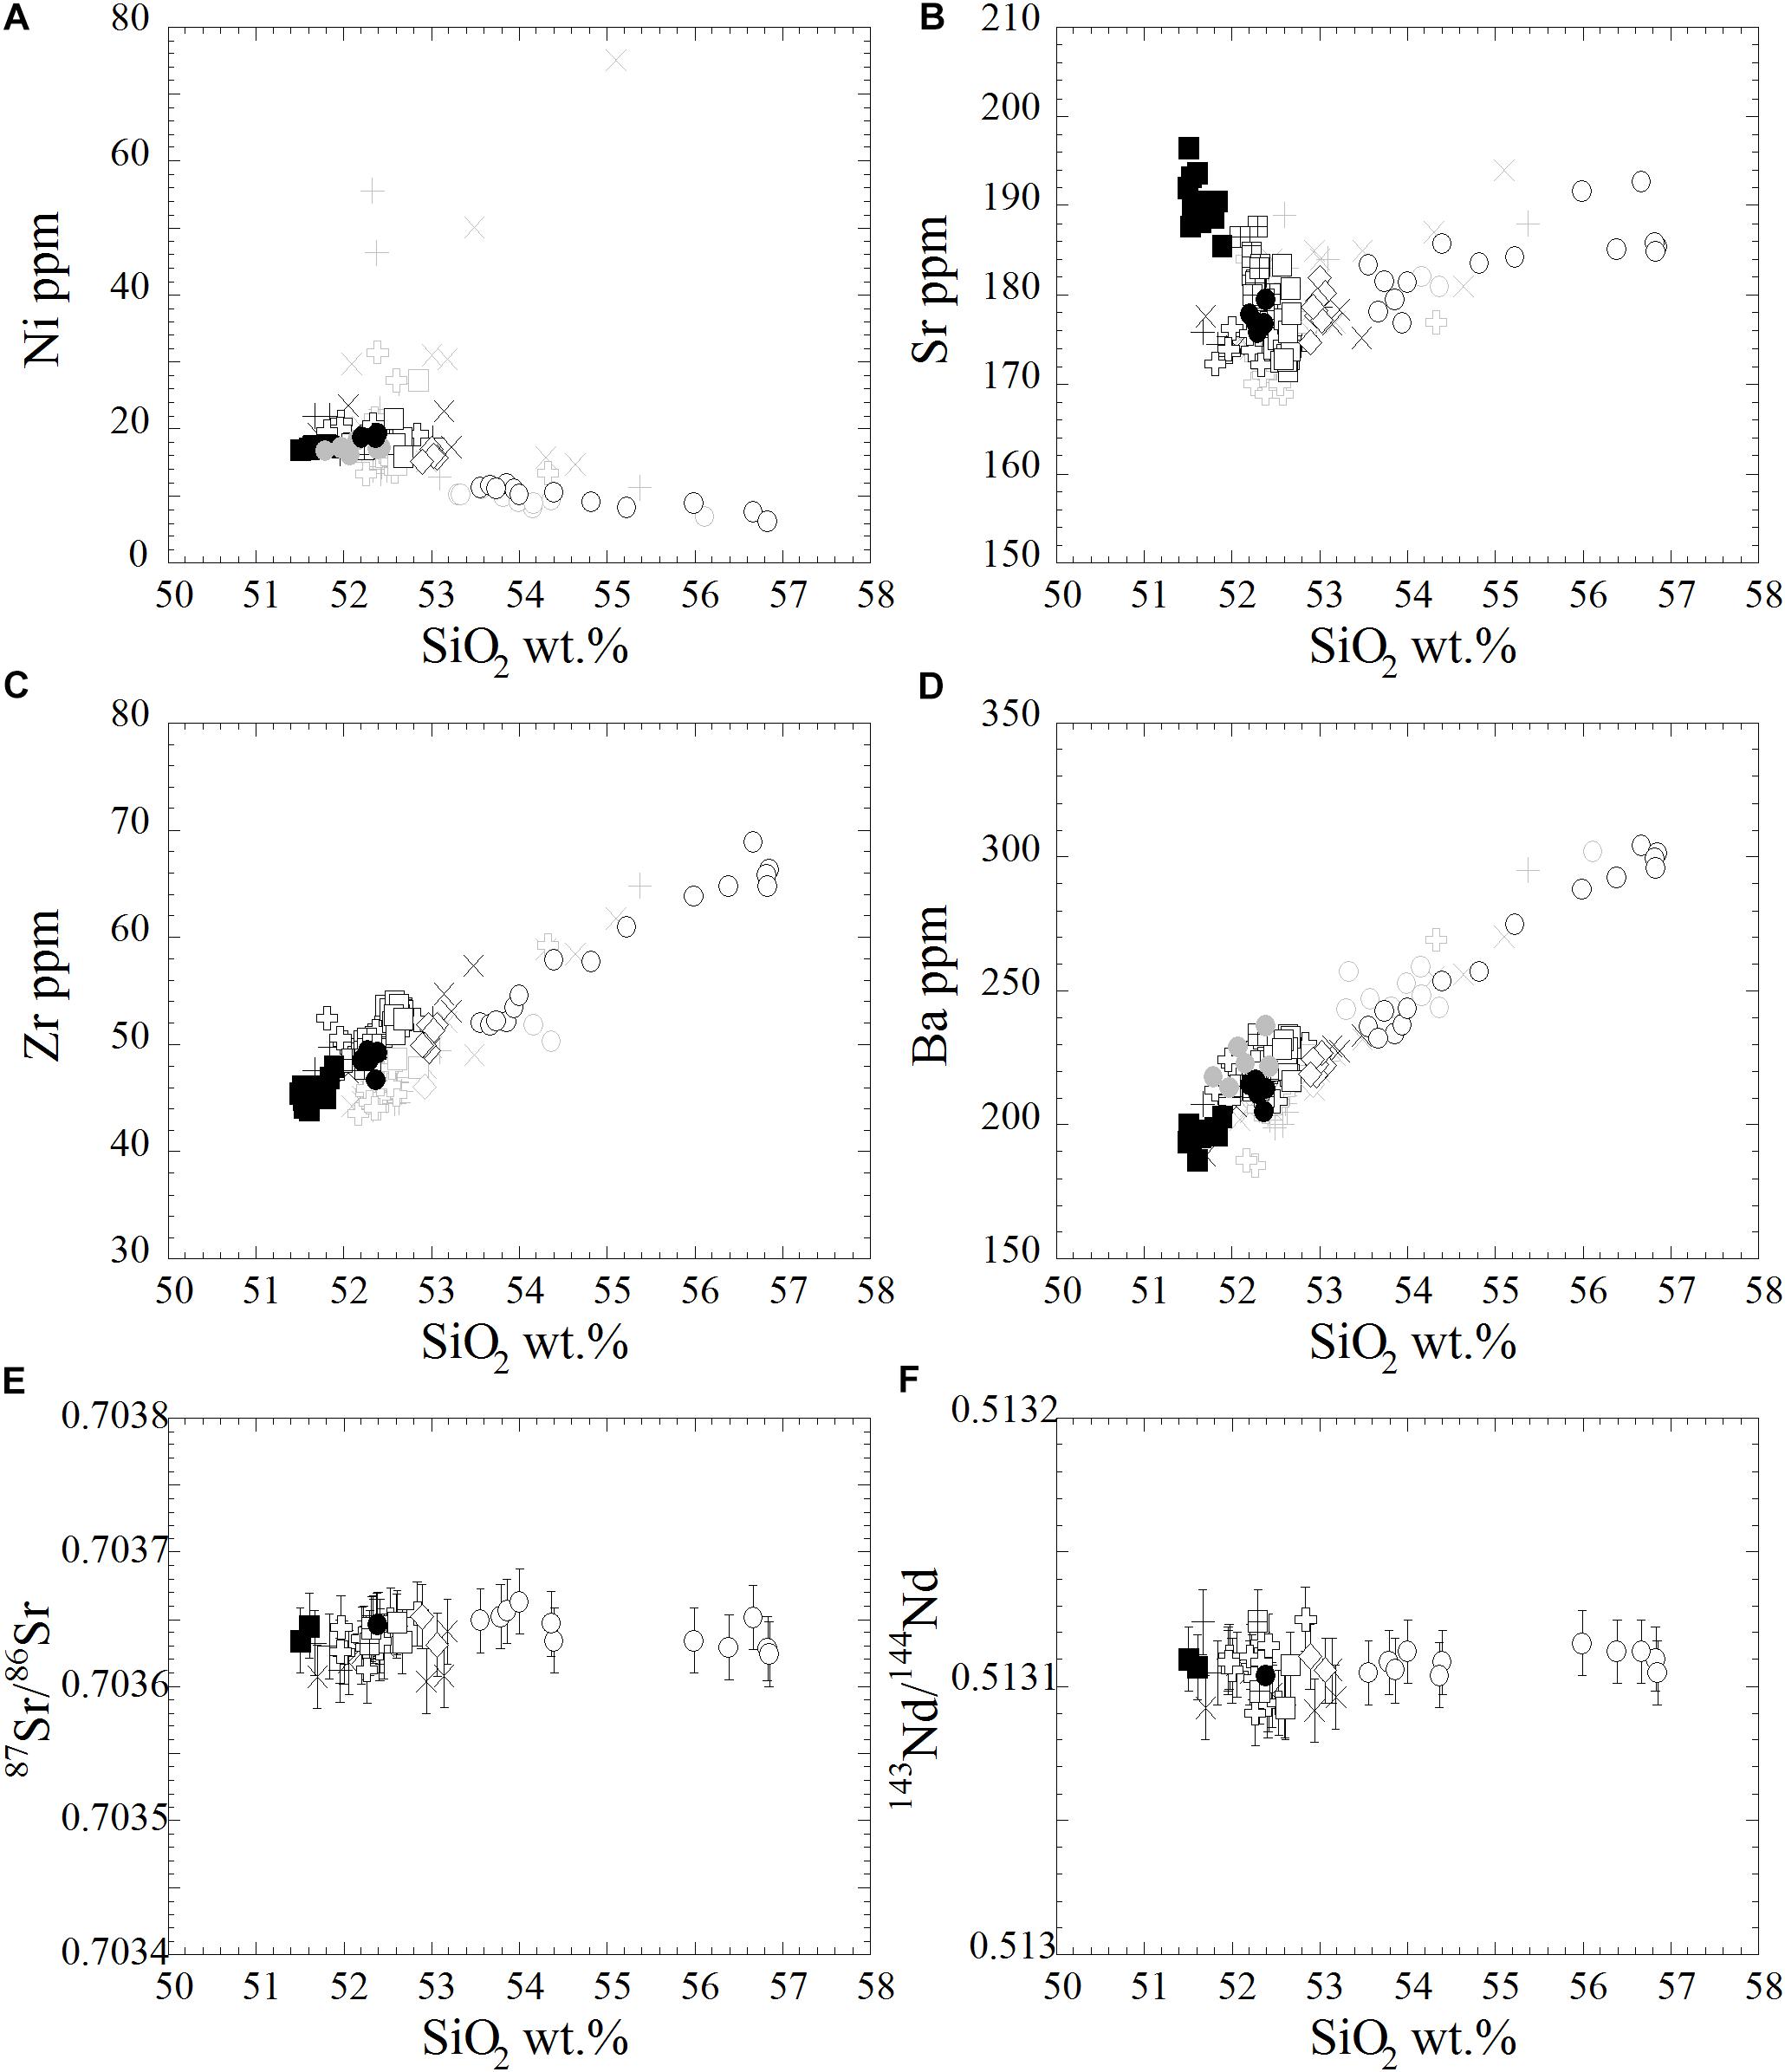
FIGURE 6. SiO2 variation diagrams for (A) Ni, (B) Sr, (C) Zr, (D) Ba, (E) 87Sr/86Sr, and (F) 143Nd/144Nd measured in samples from the Younger Oshima Group. Data other than those obtained in this study are taken from Ishizuka et al. (2015). The sample symbols are identical to those used in Figure 5.
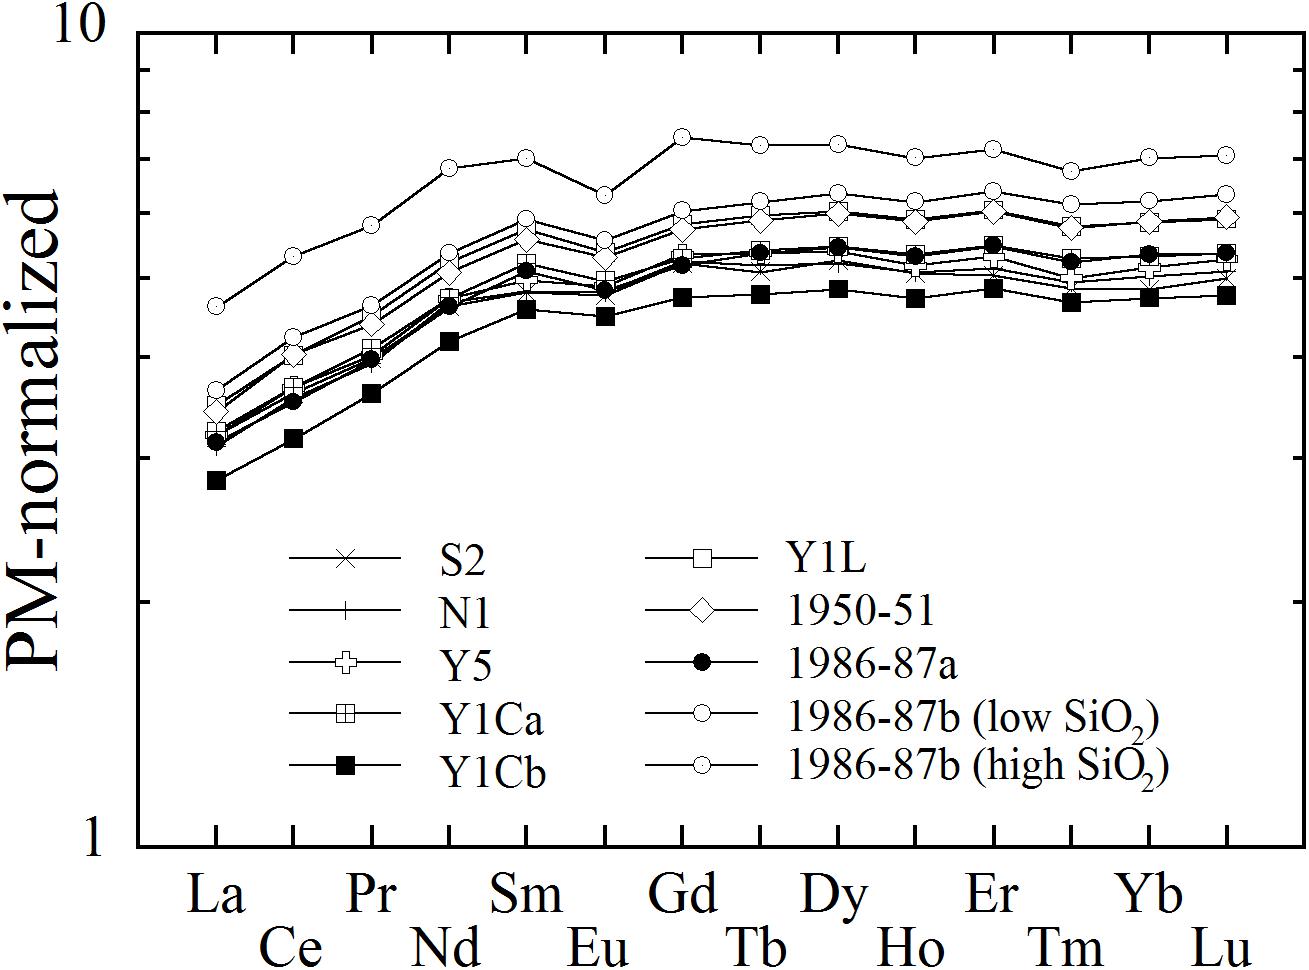
FIGURE 7. Primitive mantle-normalized REE concentration diagram for representative products of the Younger Oshima Group. The trace element concentrations of primitive mantle are from Sun and McDonough (1989).
Discussion
Magma System for Basaltic Andesitic Products
Fujii et al. (1988) suggested that primary magma has not been supplied from the source mantle to the crustal levels since the caldera formation at 1.3–1.5 ka, on the basis of the observation that the YOG products tend to evolve progressively over time. Ishizuka et al. (2015) also showed that the magmas of the Izu-Tobu volcanoes, located at the rear-arc side of the Izu-Oshima volcano (Figure 1), have not affected the magmatic system for the YOG, while they significantly interacted with the magma plumbing system before ∼5 ka. Therefore, it can be considered that the YOG magmas with variable ages and compositions were derived from a single primary magma. This is consistent with the essentially homogeneous 87Sr/86Sr and 143Nd/144Nd ratios of the YOG samples, including those of the basalts and basaltic andesites (Figures 6E,F).
The basaltic andesitic products, as represented by the B- and C-crater lavas and pyroclastics of the 1986–87 eruptions, show large variations in the SiO2 contents (Figure 5), although they are volumetrically minor in the YOG. Previous studies have suggested that the basaltic andesitic magma was derived from a small magma chamber located at 4–5 km depth, which was usually isolated from the main basaltic magma system (Fujii et al., 1988; Meteorological Agency, 2008). This hypothesis is consistent with our new petrological observations. As shown in Figure 4, the relationship between the Mg# of clinopyroxene phenocrysts and the An content of coexisting plagioclase phenocrysts in basaltic samples (1950–51 and 1986–87a; Figure 2) is significantly different from that for basaltic andesitic samples (1986–87b). If plagioclase and pyroxene phenocrysts crystallized from magma on a single liquid line of descent, it is expected that the An content of plagioclase and the Mg# of pyroxene phenocrysts would show a positive trend in the diagram. Therefore, the significantly higher Mg# of pyroxenes in the 1950–51 and 1986–87a products than those in the 1986–87b products at a given An content (Figure 4) suggests that the basaltic and basaltic andesitic magmas were derived from different magmatic systems beneath the volcano. Hereafter, we will focus on the basaltic products of the YOG to understand the main magma plumbing system of the volcano.
Principal Component Analysis on Basaltic Products
The whole-rock compositions of the basaltic samples are scattered at a given SiO2 content in the Harker variation diagrams (Figures 5, 6), which should reflect complex magmatic processes and their temporal evolution beneath the volcano. As discussed above, the YOG basalts were derived from a single parental magma, and the essentially homogeneous 87Sr/86Sr and 143Nd/144Nd ratios of the basalts suggests that crustal assimilation did not significantly occur. Therefore, the compositional diversity of the basalts was established primarily by crystal fractionation and/or magma mixing. To help elucidate the cause of the compositional diversity, principal component analysis (PCA) was applied to the whole-rock compositional data of the basaltic samples. PCA is a procedure that reduces the dimensionality of multivariate data while retaining the maximal amount of variance, and is a mechanism for defining a new coordinate system consisting of principal components, represented as PC1, PC2, PC3,…, in which PC1 explains the maximum variability, PC2 is the next major axis, and so on. Because PCA allows us to examine the factors contributing to the variance in the multidimensional data, an increasing number of studies have applied it to high-dimensional geochemical data of volcanic rocks, and successfully resolved the causes of geochemical variations resulting from the heterogeneity of primary magmas and/or magmatic differentiation (e.g., Bosch et al., 2008; Kuritani et al., 2016; Ueki and Iwamori, 2017).
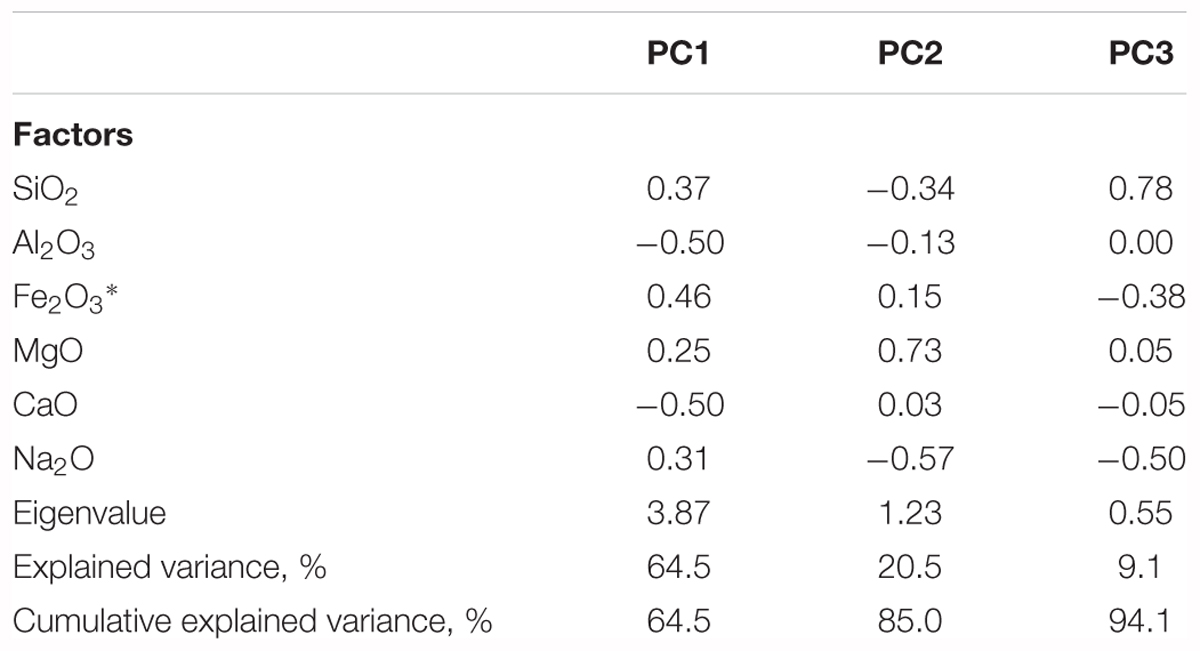
In this study, PCA was applied to 177 whole-rock data (this study; Fujii et al., 1988; Kawanabe, 1991, 1998; Ishizuka et al., 2015) of the major oxides (SiO2, Al2O3, Fe2O3∗, MgO, CaO, and Na2O; i.e., six dimensions) that are sensitive to crystal differentiation. We did not use the data of all the major elements because the sum of the major element compositions is almost fixed to 100 wt.%, which would result in the covariance matrix for the elements to be singular. The analysis results, including the factors for each element, eigenvalues, explained variances, and the cumulative explained variances for PC1, PC2, and PC3, are listed in Table 2. The eigenvalues of PC1 and PC2 exceed 1; therefore, only these two components are significant.
The data plotted on a PC1–PC2 diagram are shown in Figure 8C. Because PC1 and PC2 represent 65 and 20% of the variance, respectively (Table 2), Figure 8C represents 85% of the observed variability in the data. The data can be divided into two groups: Group A with lower PC1 and PC2, consisting mainly of Y1Cb; and Group B with higher PC1 and PC2. Group B may be further subdivided into Group B1, consisting mainly of Y1Ca, 1950–51, and 1986–87a, and Group B2, consisting mainly of S, N, Y2–6, and Y1L (Figure 8C). The products of Groups A and B1 were ejected from the summit crater, whereas those of Group B2 were derived from other craters. Group A samples are porphyritic (>∼15 vol.% phenocrysts), Group B1 samples are moderately phyric (5–10 vol.% phenocrysts), and Group B2 samples are aphyric (<5 vol.% phenocrysts) (Table 1). Notably, the phenocryst contents are less than 3% in the Group B2 samples with higher PC1 and PC2 (Figure 8D). The compositions of these aphyric samples change systematically from low-PC1 and high-PC2 compositions to high-PC1 and low-PC2 compositions as the eruption ages progress from the S and N stages through the Y2–6 stages to the Y1 stage (Figure 8C). The whole-rock compositions of the individual groups of YOG products are shown in Figures 8A,B in different colors. The Group A samples have high Al2O3 contents (Figure 8A). The Group B1 samples have relatively higher Al2O3 contents compared with the Group B2 samples (Figure 8A).
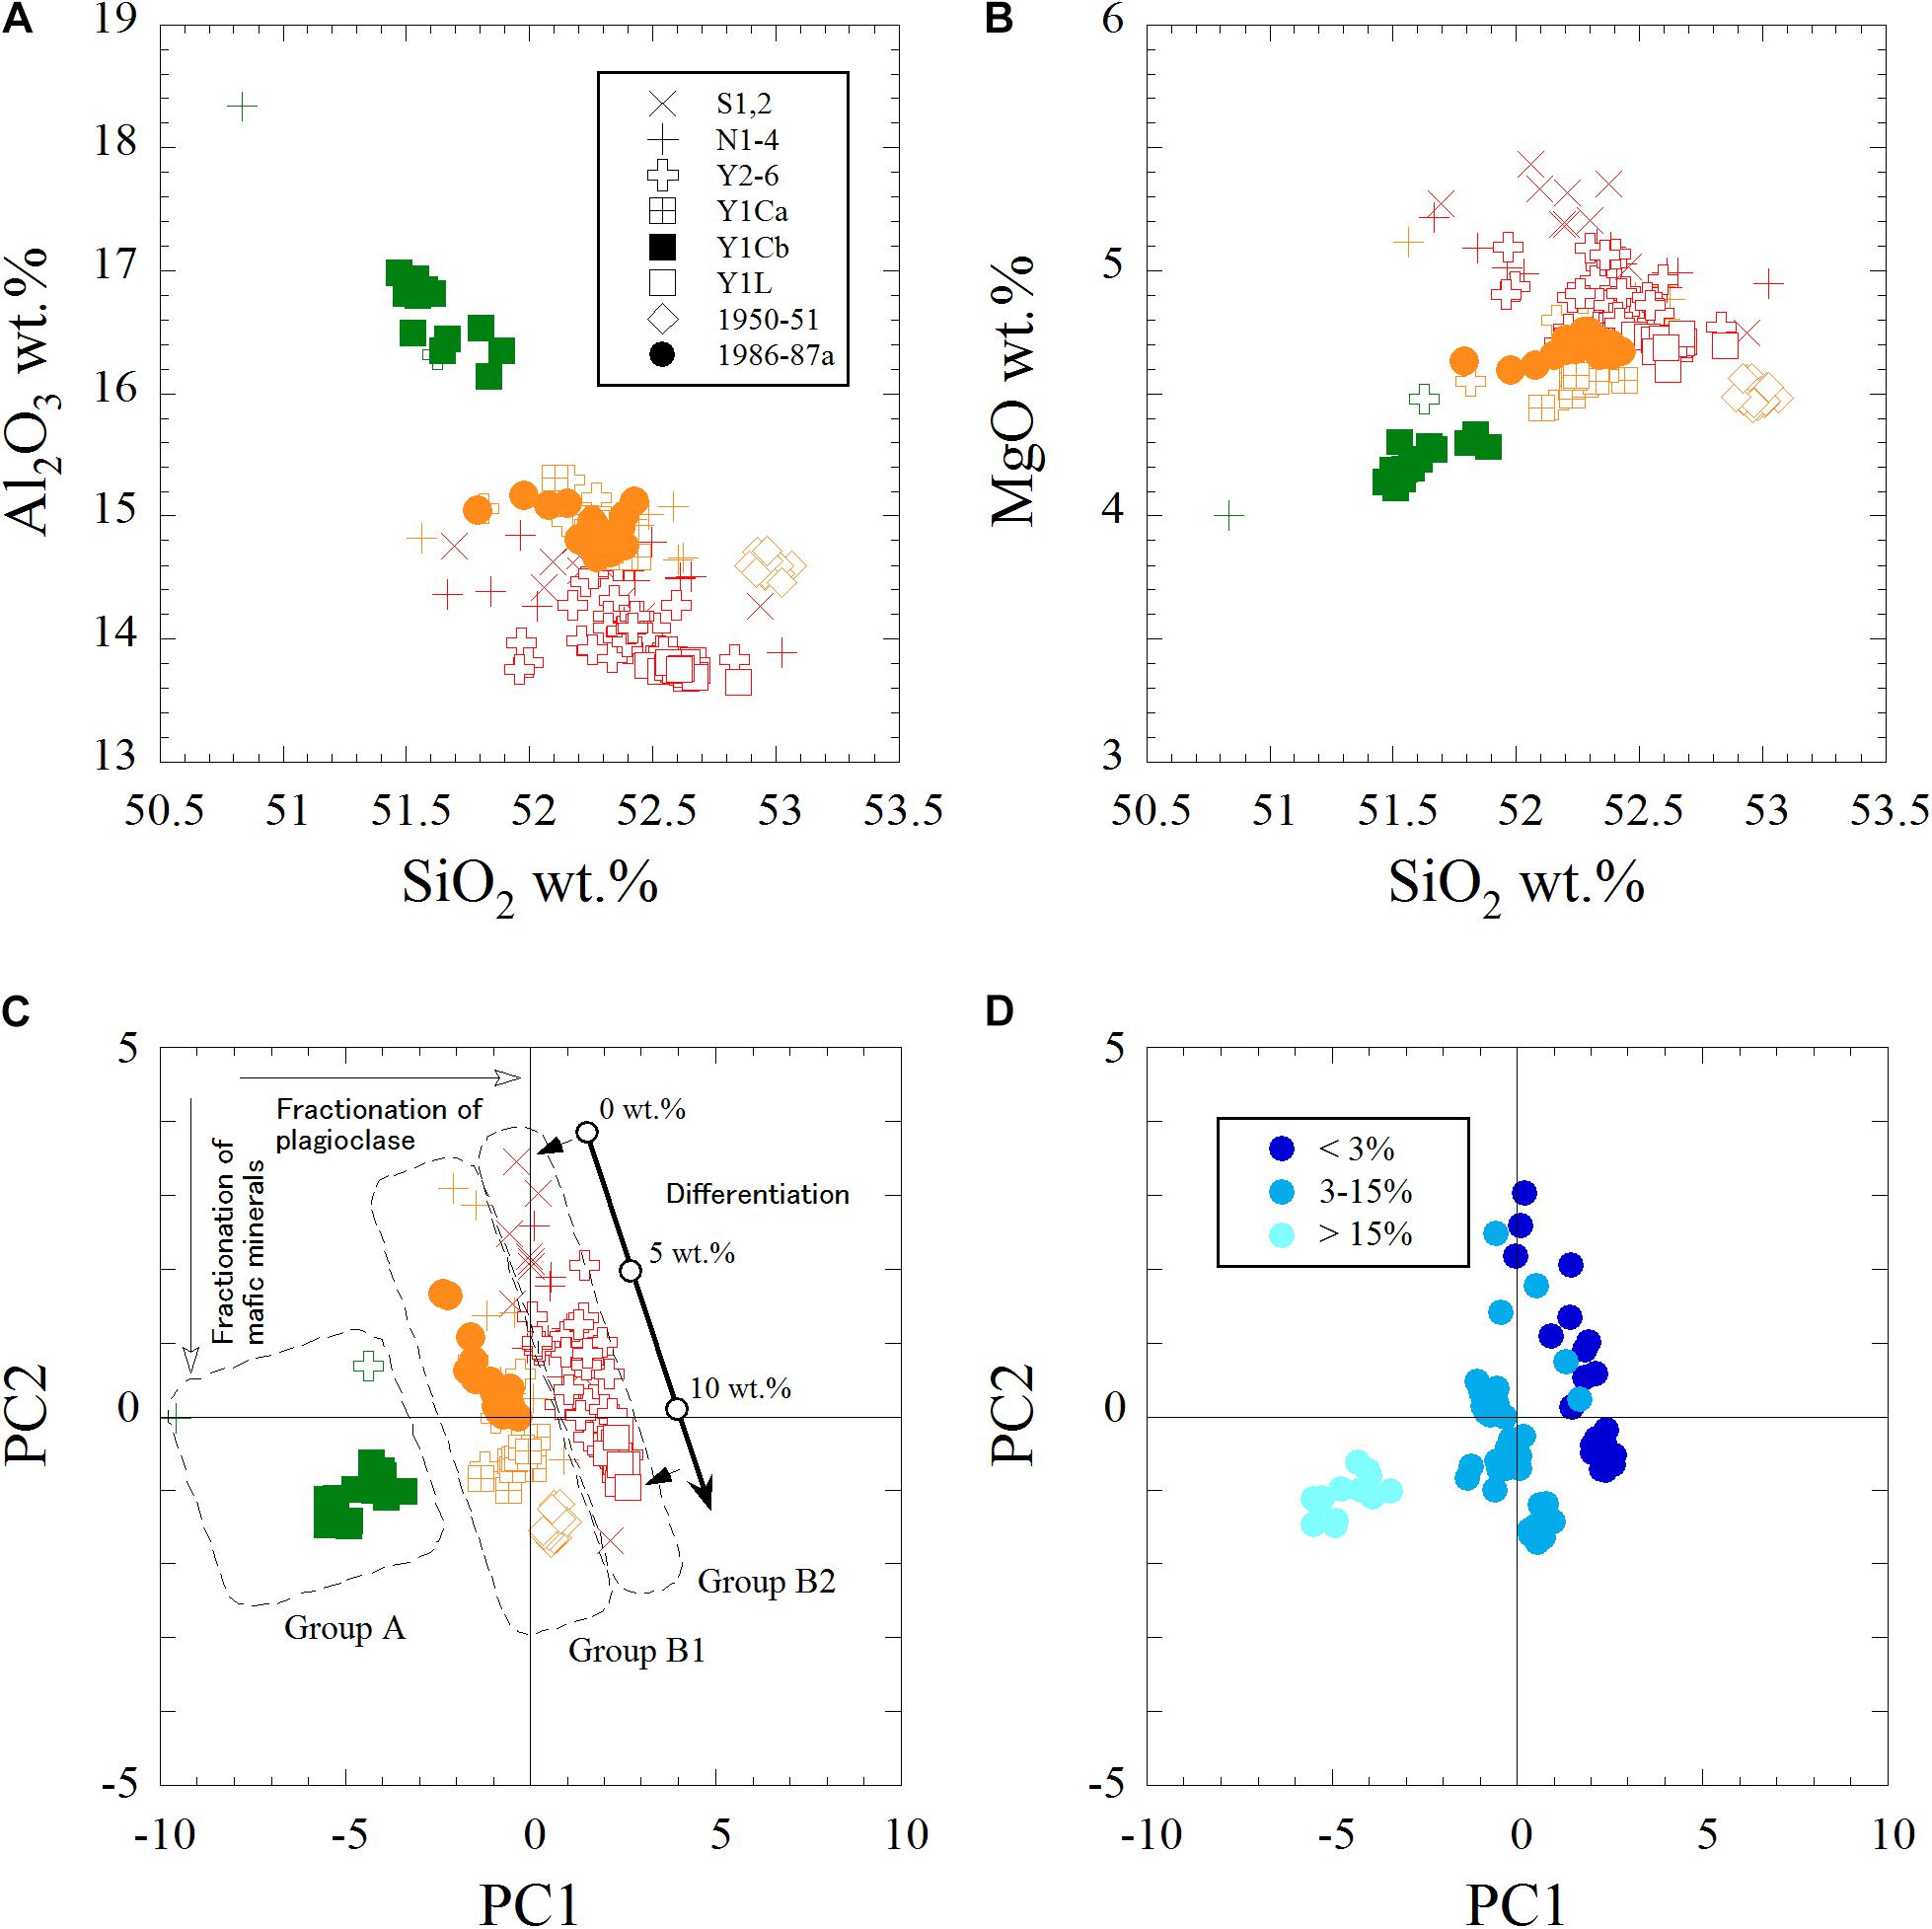
FIGURE 8. Compositional data of the basaltic samples in (A) Al2O3–SiO2, (B) MgO–SiO2, and (C,D) PC2–PC1 diagrams. The plots in green, orange, and red in (A–C) indicate those belonging to Groups A, B1, and B2, respectively. In panel (C), the result of the crystal fractional modeling for the Group-B2 aphyric samples is shown. In panel (D), the phenocryst contents of the samples investigated in this study are shown in different colors.
Al2O3 and CaO are significant contributors to PC1, as suggested by the high absolute values (∼0.5) of these element factors (Table 2). Considering that these elements are the main components in plagioclase, PC1 is considered to reflect fractionation of plagioclase phenocrysts (Figure 8C). The high absolute value for Fe2O3∗ (but opposite sign to those for Al2O3 and CaO) is considered to reflect that Fe is a rejected element during plagioclase crystallization from melt. With regards to PC2, MgO makes a remarkably high contribution (0.73). Therefore, it is plausible that PC2 reflects fractionation of mafic minerals (Figure 8C). The high absolute value for Na2O (but opposite sign to those for MgO and Fe2O3∗) can also be explained by the fact that Na is an incompatible element during the crystallization of mafic minerals. The scattered data in the PC1–PC2 diagram suggests that the compositional diversity was produced by at least two independent processes that were not coupled to each other. Considering that the data of the Group-B2 aphyric samples form a linear trend from low-PC1 and high-PC2 compositions to high-PC1 and low-PC2 compositions, one magmatic process is considered to be crystal differentiation (i.e., fractionation of plagioclase and mafic minerals) of crystal-poor magmas (Figure 8C). Because the data are distributed to the lower-PC1 side of the linear trend formed by the Group-B2 samples, the other process would be either plagioclase accumulation or mixing of plagioclase-rich magmas.
The differentiation for the crystal-poor magmas was modeled using the major elements by the method of Bryan et al. (1969). Parent and daughter magmas were represented by the highest and lowest PC2 samples in the phenocryst-poor group (indicated with small arrows in Figure 8C). It was assumed that the fractionation phases were plagioclase with An88, orthopyroxene with Mg#74, and clinopyroxene with Mg#74 (Supplementary Table S4). The result of the least-squares optimization shows that the most differentiated aphyric magma can be derived from the least differentiated aphyric magma by fractionation of ∼13 wt.% crystals (6.9 wt.% plagioclase, 3.4 wt.% orthopyroxene, and 2.4 wt.% clinopyroxene), and therefore, the linear trend of the Group B2 aphyric samples in the PC1–PC2 diagram represents the fractionation of plagioclase and mafic minerals in a weight ratio of 7:6. Boundary layer fractionation could be a likely mechanism for the differentiation of the crystal-poor magmas (Langmuir, 1989; Nielsen and Delong, 1992). In this process, magmas in the main part of a magma chamber evolve through mixing of the fractionated interstitial melt extracted from the mush zones along the walls of the magma chamber. The main magmas can remain crystal-poor during the differentiation because compositional evolution proceeds through mixing of the melt. In addition, the mixing of the fractionated interstitial melt from the mush zone suppresses the crystallization of the main magma, due to the effect of the liquidus depression (Kuritani, 2009).
Magma Plumbing System for Basaltic Products
To understand the basaltic magma plumbing system in more detail, we focus on the products of recent eruptions, 1777–78 (Y1Ca, Y1Cb, and Y1L), 1950–51, and 1986–87a. Y1Cb belongs to Group A; Y1Ca, 1950–51, and 1986–87a belong to Group B1; and Y1L belongs to Group B2. The Y1L products are essentially phenocryst-free. The others contain plagioclase and pyroxene phenocrysts, which sometimes show evidence of simultaneous growth (Figure 2), and the compositions of the phenocrysts in these products are similar (e.g., Figure 3). The crystallization pressures and temperatures of the pyroxene phenocrysts were estimated by applying the two-pyroxene geothermobarometer of Putirka (2008) to clinopyroxene (cpx)–orthopyroxene (opx) pairs in Y1Ca, Y1Cb, 1950–51, and 1986–87a. The cpx–opx pairs in Y1Ca, 1950–51, and 1986–87a show evidence of contemporaneous growth (Figure 2A), but crystal aggregates consisting of opx and cpx were not found in the Y1Cb samples. Therefore, the pressure and temperature conditions for Y1Cb were estimated using the core compositions of euhedral cpx and opx phenocrysts in the same thin sections. The Fe-Mg exchange coefficients KD(Fe-Mg)cpx-opx are all within the range of 1.09 ± 0.14, which ensures that these pyroxene pairs were in equilibrium (Putirka, 2008). The result shows that the pressure and temperature conditions range from 4.4 to 6.1 kbar and from 1050 to 1100°C, respectively (Figure 9). The typical uncertainties for the temperature and pressure estimates using this method are 38°C and 3.7 kbar, respectively (Putirka, 2008). Considering that no systematic differences in the P–T conditions are observed between the products of different eruption stages (Figure 9), and that some opx and cpx phenocrysts form crystal aggregates with plagioclase phenocrysts with >An80 (Figure 2), the pyroxene and plagioclase phenocrysts in Y1Ca, Y1Cb, 1950–51, and 1986–87a primarily crystallized in the same magma chamber located at, most plausibly, 4.4–6.1 kbar.
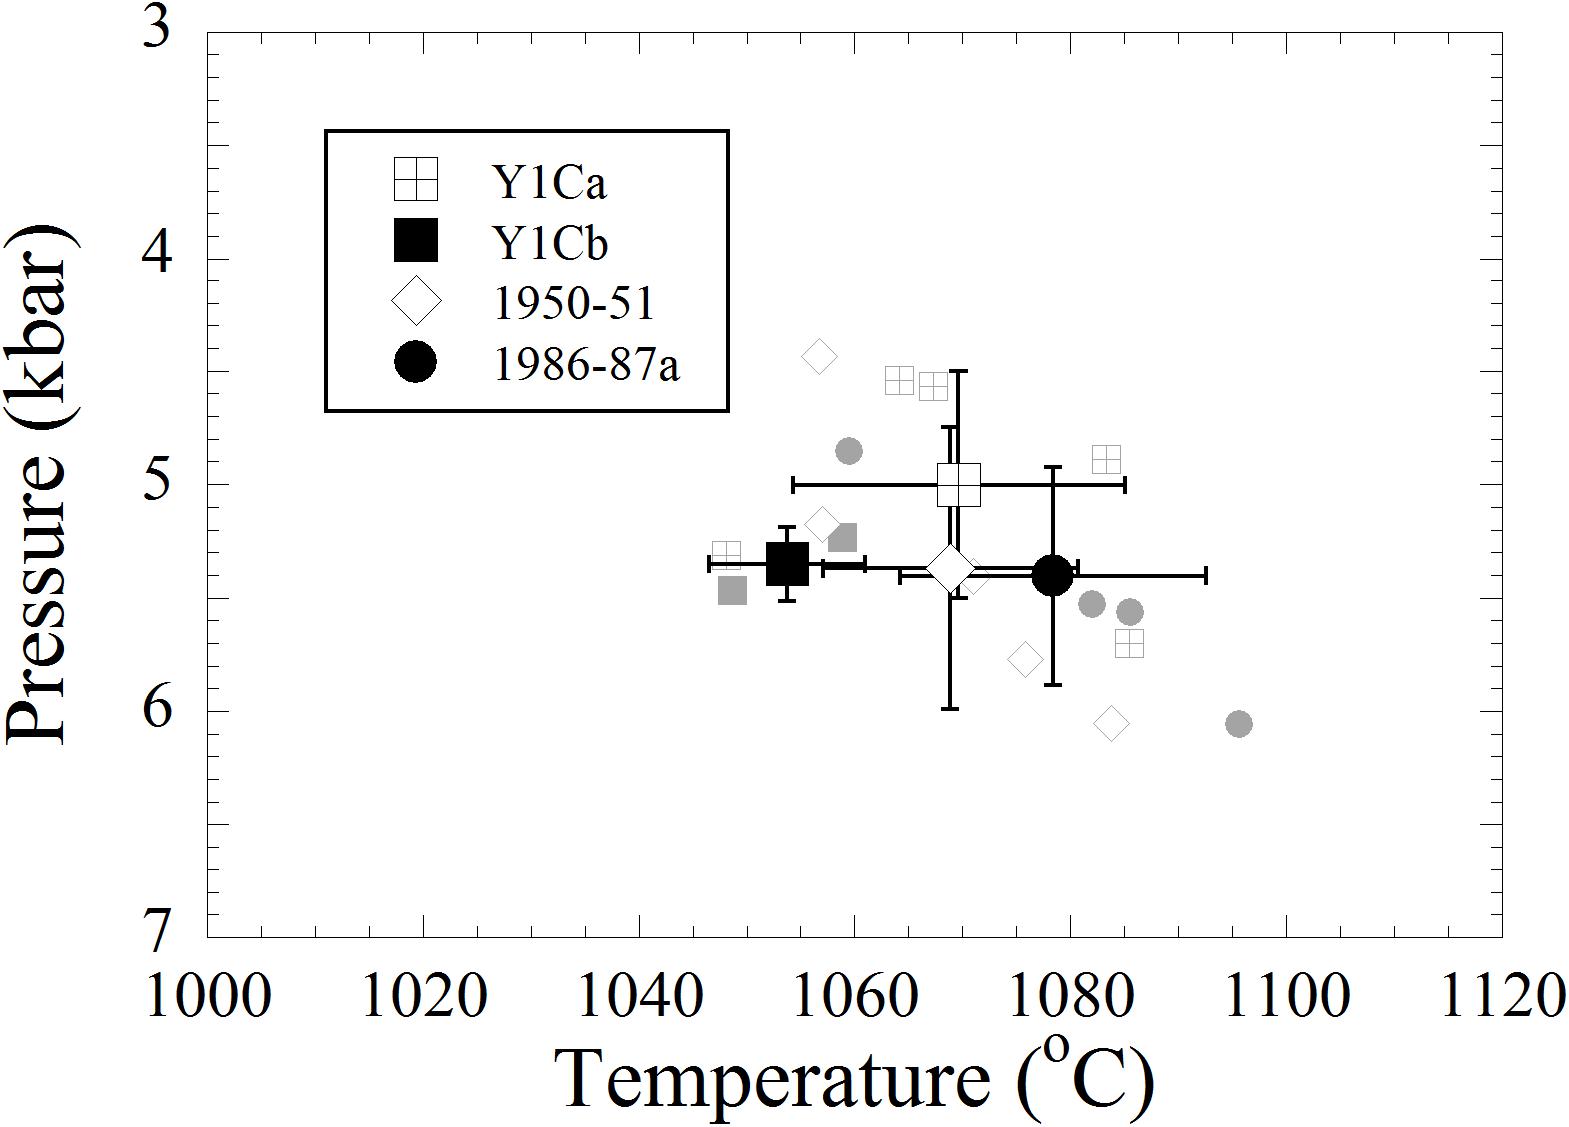
FIGURE 9. The estimated crystallization pressures and temperatures for pyroxene phenocrysts in products from recent eruptions. The estimates of the individual opx–cpx pairs are represented by the gray plots and the averages with 1σ bars of each stage are represented by the black plots.
As discussed above, the compositional diversity in the PC1–PC2 diagram (Figure 8C) can be explained by two independent magmatic processes; one process is the crystal fractionation of crystal-poor magmas and the other process is either plagioclase accumulation or mixing of plagioclase-rich magmas. The scattered compositional diversity would have been established by polybaric fractional crystallization with variable melt water contents (e.g., Almeev et al., 2013). However, this scenario is inconsistent with the observation that the crystallization conditions of the phenocrysts are essentially similar (Figure 9). Nakano and Yamamoto (1991) suggested that the negative trend formed by the basaltic products in the Al2O3–SiO2 diagram (Figure 8A) was controlled by plagioclase accumulation in a magma chamber. If this was the case, it is expected that plagioclase-rich magma would show a positive Eu anomaly. However, the plagioclase-rich Y1Cb sample has a significantly negative Eu anomaly (Figure 7). In addition, if plagioclase separation and accumulation was the cause of the compositional diversity, the plagioclase phenocrysts would have coexisted with the phenocryst-free Group B2 magmas (as represented by the Y1L samples) before separation and accumulation. To verify that the plagioclase phenocrysts could have coexisted with the Y1L melt, the equilibrium relationship between the plagioclase phenocrysts (An80-93) and Y1L melt was examined using plagioclase-melt thermometry. The melt composition was assumed to be the whole-rock composition of IzOs-3 (Supplementary Table S1). The plagioclase-melt thermometer of Waters and Lange (2015) with a melt water content of 5 wt.% (Hamada et al., 2011) yields the crystallization temperature of the plagioclase phenocrysts of 890–910°C at 4.4–6.1 kbar, which is much lower than the estimates of 1050–1100°C (Figure 9). This observation suggests that the plagioclase phenocrysts were not in equilibrium with the phenocryst-free Group B2 magmas.
With these considerations, we concluded that the compositional diversity of the basalts was produced by the mixing of porphyritic magmas with compositionally variable aphyric magmas (Figure 10). The Group B2 samples are considered to represent aphyric end-member magmas with compositional diversity produced by fractional crystallization, and the Group A samples would have been magmas with a relatively high proportion of the porphyritic end-member magmas. Unfortunately, it is difficult to determine the compositions and phenocryst contents of the porphyritic end-member magmas. The phenocryst contents of the end-member magmas are higher than ∼20 vol.%, on the basis of the observation that those of the Group A samples are ∼20 vol.% (Table 1). On the other hand, most of the plagioclase phenocrysts in the Groups A and B1 samples occur as isolated euhedral grains, suggesting that the magma might not have been so mushy. Therefore, the phenocrysts contents of the porphyritic end-member magmas may not significantly exceed ∼25 vol.% (e.g., Marsh, 1996).
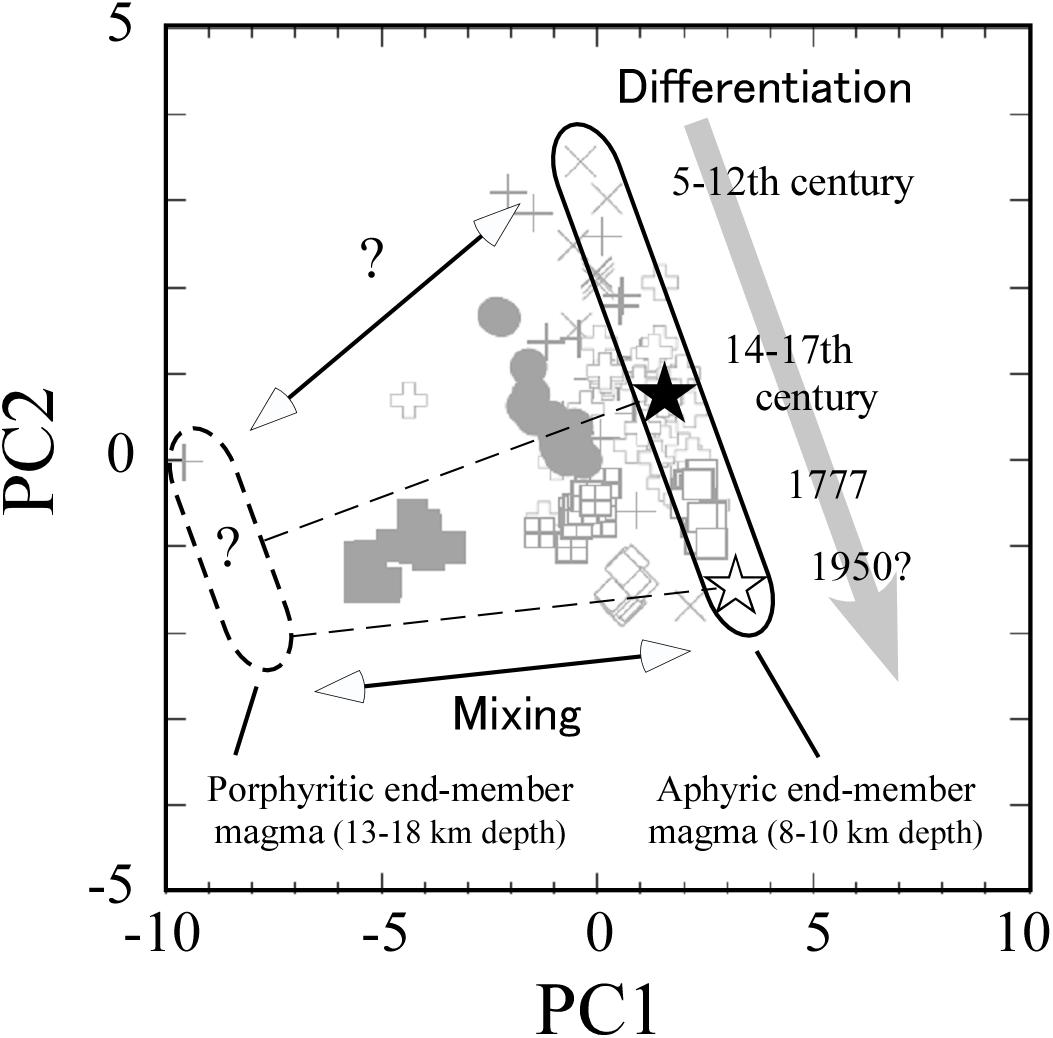
FIGURE 10. Compositional data of the basaltic samples in a PC2–PC1 diagram, showing the inferred magmatic processes: mixing of phenocryst-rich magmas derived from the 13–18 km-deep magma chamber and phenocryst-free magmas stored in the 8–10 km-deep magma chamber.
It has been suggested that the recent magma plumbing system for the main basaltic magmas consists of a magma chamber located at 8–10 km depth (estimated by an analysis of seismic waveforms by Mikada et al., 1997) and a deeper magma chamber (Meteorological Agency, 2008). Therefore, the “deeper magma chamber” may correspond to the magma chamber located at 4.4–6.1 ± 3.7 kbar for the porphyritic end-member magmas and the 8–10 km depth magma chamber may have been occupied by the aphyric end-member magmas. Because of the relatively large uncertainty of 3.7 kbar for the pressure estimate, the magma chamber for the porphyritic end-member magma (located at 4.4–6.1 ± 3.7 kbar) could be shallower than 8–10 km (∼3 kbar). However, such a shallow magma chamber has not been observed by a geophysical study except for the small magma bodies located at 4–5 km depth for the andesitic magmas (Mikada et al., 1997). Based on these considerations, we propose that the main magma plumbing system for the YOG, excluding the basaltic andesitic products, consists of a magma chamber for porphyritic magmas located at, most plausibly, 13–18 km depth and a magma chamber for aphyric magmas located at 8–10 km depth. The magma plumbing system, consisting of shallower and deeper magma chambers, is similar to that of the Miyake-jima volcano located near the Izu-Oshima volcano in the Izu arc (Amma-Miyasaka and Nakagawa, 2003; Kuritani et al., 2003).
Temporal Evolution of the Magma Plumbing System
The compositions of the aphyric magmas (<3 vol.% phenocrysts), stored in the 8–10 km-deep magma chamber, show a tight negative trend in the PC1–PC2 diagram (Figure 8D), which can be explained by the fractionation of plagioclase and mafic minerals, as discussed previously. The compositions of the phenocryst-poor samples changed systematically from lower-PC1 and higher-PC2 compositions to higher-PC1 and lower-PC2 compositions with eruption ages from the S and N stages through the Y2–Y6 stages to the Y1 stage (Figure 10). Although the aphyric end-member magmas for the 1950–51 eruptions did not erupt, the possible compositions of the end-member magmas (open star in Figure 10) are more differentiated compared with those of Y1L. Therefore, the aphyric end-member magmas evolved progressively over time, at least, from the 7th to 20th century. Fujii et al. (1988) found that the Mg/Fe ratios of the YOG products generally tend to decrease over time. We suggest that this observation is attributed to the progressive evolution of the aphyric magmas in the 8–10 km-deep magma chamber after caldera formation (Figure 10).
It is expected that aphyric magmas with similar compositions to (or slightly more differentiated compositions from) those of the end-member magmas for the 1950–51 eruptions were present in 1986 in the 8–10 km depth magma chamber. However, the composition of the possible aphyric end-member magma for 1986–87a (filled star in Figure 10) was less differentiated than those of Y1L. This observation may be explained by a new influx of crystal-free primitive magma into the 8–10 km-deep magma chamber. In this case, the injection of relatively large amounts of primitive magma would have been required to change the compositions of the aphyric end-member magmas (i.e., from the filled star to the open star in Figure 10) during the interval between 1951 and 1986. It is expected that the injection would have triggered an eruption of aphyric magmas from the 8–10 km-deep magma chamber. However, no significant eruption occurred between 1951 and 1986. It is also unlikely that the injection of the crystal-free primitive magma into the aphyric magma chamber triggered the eruption of the A-crater magma in 1986, because the 1986a products are moderately phyric. Based on these considerations, we suggest that the aphyric magma chamber was zoned in composition at the time of the 1986 eruption, and the more-differentiated magma (open star in Figure 10) was underlain by the less-differentiated magma (filled star in Figure 10) in the magma chamber.
The temporal evolution of the magma plumbing system for the YOG is summarized in Figure 11. The products of the S, N, and Y2–Y6 stages are mainly classified as Group B2 (Figure 8C), suggesting that the magma chamber at 8–10 km depth had a primary role in their genesis (Figures 11A,B). However, the products commonly contain phenocrysts up to ∼5 vol.%; therefore, porphyritic magmas discharged from the deeper magma chamber might have been intermittently injected into the 8–10 km-deep magma chamber during the evolution of the S, N, and Y2–Y6 stages. At the Y1 and later eruption stages, porphyritic magmas stored in the deeper magma chamber played more important roles. The phenocryst-rich Y1Ca, Y1Cb, 1950–51, and 1986–87a magmas, produced by mixing of the porphyritic and aphyric magmas, erupted from the summit crater of the volcano (Figures 11C,D). The preferential eruptions of the phenocryst-rich magmas from the summit crater may have been caused by the inertia associated with the injection of the porphyritic end-member magmas into the 8–10 km-deep magma chamber. More than 30 years have passed since the last eruptions in 1986–1987, and the crystal-poor magmas in the 8–10 km-deep magma chamber are expected to have evolved since the last eruption. Therefore, the magmas to erupt in the next volcanic activity may be produced by mixing of the porphyritic end-member magma and aphyric magma, with a more differentiated composition than that of the filled star shown in Figure 10.
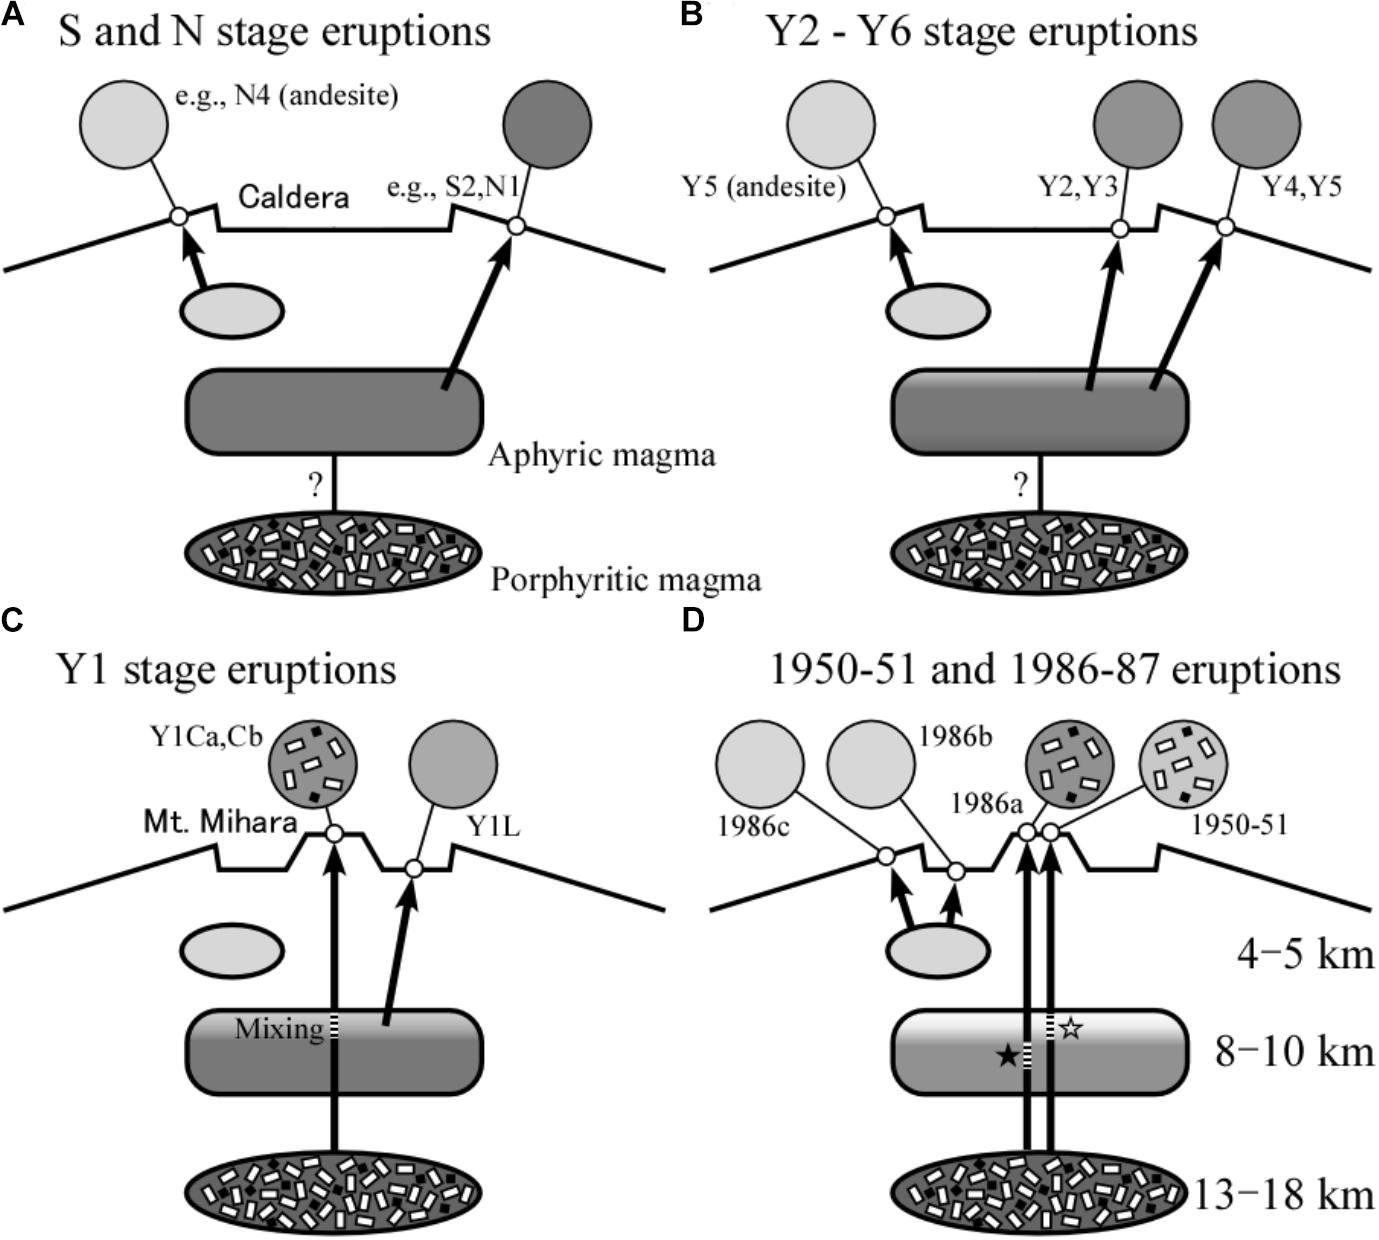
FIGURE 11. Illustrations of the magma plumbing system of the Izu-Oshima volcano for (A) S and N stage eruptions, (B) Y2–Y6 stage eruptions, (C) Y1 stage eruptions, and (D) 1950–51 and 1986–87 eruptions.
At each eruption stage of the recent YOG, volcanic activity has commonly started with the eruption of a phenocryst-bearing magma (e.g., Meteorological Agency, 2008) from the summit crater, such as Y1Ca from the 1777–78 eruption, the 1950–51 eruption, and 1986a from the 1986–87 eruption. This observation suggests that volcanic activity for recent eruptions has been triggered by the injection of porphyritic magmas derived from the 13–18 km-deep magma chamber into the 8–10 km-deep magma chamber. Therefore, to predict future eruptions, it is important to monitor the discharge of porphyritic magma from the magma chamber at 13–18 km depth.
Conclusion
To investigate the temporal evolution of the magma plumbing system for the Younger Oshima Group at the Izu-Oshima volcano, we conducted a petrological and geochemical analysis on the representative basaltic products. Based on the petrological analysis and previous geophysical studies, we propose that the main magma plumbing system consisted of magma chambers located at, most plausibly, 13–18 km depth and 8–10 km depth. In the 8–10 km-deep magma chamber, aphyric magmas progressively differentiated over time at least from the 7th to 20th century. The compositional variations in the basalts resulted from the mixing of the differentiating aphyric magmas with variable proportions of the porphyritic magmas, derived from the 13–18 km-deep magma chamber. The volcanic activities of recent eruptions, including those in 1777–78, 1950–51, and 1986–87, were triggered by the injection of porphyritic magmas into the magma chamber at 8–10 km depth. Therefore, it is important to monitor the discharge of porphyritic magma from the magma chamber located at 13–18 km depth to predict future eruptions of the Izu-Oshima volcano.
Author Contributions
TK and MN had the idea for this study. TK, AY, SF, AM, and TY carried out the analyses. All authors contributed to the interpretation of the data. TK took the lead in preparing the manuscript with inputs from AY, SF, AM, and MN.
Funding
This work was supported by research grants from JSPS KAKENHI (Grant Nos. 16H04071 and 25120006 to TK) and by the Ministry of Education, Culture, Sports, Science and Technology (MEXT) of Japan, under its Earthquake and Volcano Hazards Observation and Research Program and the Integrated Program for Next Generation Volcano Research and Human Resource Development.
Conflict of Interest Statement
The authors declare that the research was conducted in the absence of any commercial or financial relationships that could be construed as a potential conflict of interest.
Acknowledgments
We are grateful to Hidehiko Nomura and Kosuke Nakamura at Hokkaido University for their careful and painstaking work for creating thin sections. Editorial handling by PC and constructive review and fruitful comments by two reviewers are greatly appreciated. We thank J. P. Coumans for constructive comments on early version of the manuscript.
Supplementary Material
The Supplementary Material for this article can be found online at: https://www.frontiersin.org/articles/10.3389/feart.2018.00178/full#supplementary-material
References
Almeev, R. R., Ariskin, A. A., Kimura, J.-I., and Barmina, G. S. (2013). The role of polybaric crystallization in genesis of andesitic magmas: phase equilibria simulations of the Bezymianny vocanic subseries. J. Volcanol. Geotherm. Res. 263, 182–192. doi: 10.1016/j.jvolgeores.2013.01.004
Amma-Miyasaka, M., and Nakagawa, M. (2003). Evolution of deeper basaltic and shallower andesitic magmas during the AD 1469–1983 eruptions of Miyake-jima Volcano, Izu–Mariana arc: inferences from temporal variations of mineral compositions in crystal-clots. J. Petrol. 44, 2113–2138. doi: 10.1093/petrology/egg072
Bosch, D., Blichert-Toft, J., Moynier, F., Nelson, B. K., Telouk, P., Gillot, P.-Y., et al. (2008). Pb, Hf and Nd isotope compositions of the two reunion volcanoes (Indian Ocean): a tale of two small-scale mantle “blobs”? Earth Planet. Sci. Lett. 265, 748–765. doi: 10.1016/j.epsl.2007.11.018
Bryan, W. B., Finger, L. W., and Chayes, F. (1969). Estimating proportions in petrographic mixing equations by least-squares approximation. Science 163, 926–927. doi: 10.1126/science.163.3870.926
Fujii, T., Aramaki, S., Kaneko, T., Ozawa, K., Kawanabe, Y., and Fukuoka, T. (1988). Petrology of the lavas and ejecta of the November 1986 eruption of Izu-Oshima volcano (in Japanese with English abstract). Bull. Volcanol. Soc. Jpn. 33, S234–S254.
Hamada, M. (2016). Petrological constraints on the magma plumbing system of Izu-Oshima Volcano. Bull. Earthquake Res. Inst. 91, 41–54.
Hamada, M., Kawamoto, T., Takahashi, E., and Fujii, T. (2011). Polybaric degassing of island arc low-K tholeiitic basalt magma recorded by OH concentrations in Ca-rich plagioclase. Earth Planet. Sci. Lett. 308, 259–266. doi: 10.1016/j.epsl.2011.06.005
Hamada, M., Okayama, Y., Kaneko, T., Yasuda, A., and Fujii, T. (2014). Polybaric crystallization differentiation of H2O-saturated island arc low-K tholeiite magmas: a case study of the Izu-Oshima volcano in the Izu arc. Earth Planets Space 66:15. doi: 10.1186/1880-5981-66-15
Imai, N., Terashima, S., Itoh, S., and Ando, A. (1995). 1994 compilation values for GSJ reference samples, “Igneous rock series”. Geochem. J. 29, 91–95. doi: 10.2343/geochemj.29.91
Ishizuka, O., Taylor, R. N., Geshi, N., Oikawa, T., Kawanabe, Y., and Ogitsu, I. (2015). Progressive mixed-magma recharging of Izu-Ozhima volcano. Japan: a guide to magma chamber volume. Earth Planet. Sci. Lett. 430, 19–29. doi: 10.1016/j.epsl.2015.08.004
Kawanabe, Y. (1991). Petrological evolution of Izu Oshima volcano (in Japanese with English abstract). Bull. Volcanol. Soc. Jpn. 36, 297–310.
Kuritani, T. (2009). The relative roles of boundary layer fractionation and homogeneous fractionation in cooling basaltic magma chambers. Lithos 110, 247–261. doi: 10.1016/j.lithos.2008.12.012
Kuritani, T., Kimura, J.-I., Ohtani, E., Miyamoto, H., and Furuyama, K. (2013). Transition zone origin of potassic basalts from Wudalianchi volcano, northeast China. Lithos 15, 1–12. doi: 10.1016/j.lithos.2012.10.010
Kuritani, T., Tanaka, M., Yokoyama, T., Nakagawa, M., and Matsumoto, A. (2016). Intensive hydration of the wedge mantle at the Kuril Arc–NE Japan Arc junction: implications from mafic lavas from Usu Volcano, northern Japan. J. Petrol. 57, 1223–1240. doi: 10.1093/petrology/egw038
Kuritani, T., Yokoyama, T., Kobayashi, K., and Nakamura, E. (2003). Shift and rotation of composition trends by magma mixing: 1983 eruption at Miyake-jima Volcano, Japan. J. Petrol. 44, 1895–1916. doi: 10.1093/petrology/egg063
Langmuir, C. H. (1989). Geochemical consequences of in situ crystallization. Nature 340, 199–205. doi: 10.1038/340199a0
Lu, Y.-H., Makishima, A., and Nakamura, E. (2007). Coprecipitation of Ti, Mo, Sn and Sb with fluorides and application to determination of B, Ti, Zr, Nb, Mo, Sn, Sb, Hf and Ta by ICPMS. Chem. Geol. 236, 13–26. doi: 10.1016/j.chemgeo.2006.08.007
Marsh, B. D. (1996). Solidification fronts and magmatic evolution. Mineral. Mag. 60, 5–40. doi: 10.1180/minmag.1996.060.398.03
Meteorological Agency (2008). Report on Volcanic Activity of Izu-Oshima (Eruption Scenario of Izu-Oshima), the Coordination Committee for Prediction of Volcanic Eruption. Available at: http://www.data.jma.go.jp/svd/vois/data/tokyo/STOCK/kaisetsu/CCPVE/izu/izu-01.pdf
Mikada, H., Watanabe, H., and Sakashita, S. (1997). Evidence for subsurface magma bodies beneath Izu-Oshima volcano inferred from a seismic scattering analysis and possible interpretation of the magma pluming system of the 1986 eruptive activity. Phy. Earth Planet. Inter. 104, 257–269. doi: 10.1016/S0031-9201(97)00060-5
Misonou, Y., Takahashi, M., Yasui, M., and Hayashida, K. (2005). Whole-Rock Chemical Composition of Lava and Ejecta of the An-Ei Eruption, Izu-Oshima Volcano. Sapporo: Volcanological Society of Japan 2005 fall meeting: A42.
Miyazaki, T., and Shuto, K. (1998). Sr and Nd isotope ratios of twelve GSJ rock reference samples. Geochem. J. 32, 345–350. doi: 10.2343/geochemj.32.345
Nakamura, K. (1964). Volcano-stratigraphic study of Oshima Volcano, Izu. Bul. Earthquake Res. Inst. 42, 649–728.
Nakano, S., and Yamamoto, T. (1991). Chemical variations of magmas at Izu-Oshima volcano, Japan: plagioclase-controlled and differentiated magmas. Bull. Volcanol. 53, 112–120. doi: 10.1007/BF00265416
Nielsen, R. L., and Delong, S. E. (1992). A numerical approach to boundary layer fractionation: application to differentiation in natural magma systems. Contrib. Mineral. Petrol. 110, 355–369. doi: 10.1007/BF00310750
Noguchi, T., Shinjo, R., Ito, M., Takada, J., and Oomori, T. (2011). Barite geochemistry from hydrothermal chimneys of the Okinawa Trough: insight into chimney formation and fluid/sediment interaction. J. Mineral. Petrol. Sci. 106, 26–35. doi: 10.2465/jmps.090825
Pin, C., Briot, D., Bassin, C., and Poitrasson, F. (1994). Concomitant separation of strontium and samarium-neodymium for isotopic analysis in silicate samples, based on specific extraction chromatography. Anal. Chim. Acta 298, 209–217. doi: 10.1016/0003-2670(94)00274-6
Pin, C., and Zalduegui, J. F. S. (1997). Sequential separation of light rare-earth elements, thorium and uranium by miniaturized extraction chromatography: application to isotopic analyses of silicate rocks. Anal. Chim. Acta 339, 79–89. doi: 10.1016/S0003-2670(96)00499-0
Putirka, K. D. (2008). Thermometers and barometers for volcanic systems. Rev. Mineral. Petrol. 69, 61–120. doi: 10.2138/rmg.2008.69.3
Suda, Y., Koizumi, N., and Okudaira, T. (2011). X-ray fluorescence analysis of major, trace and rare earth elements for igneous rocks, sedimentary rocks, sediments and soil. MAGMA 93, 19–32.
Suda, Y., Okudaira, T., and Furuyama, K. (2010). X-ray fluorescence (XRF; RIX-2100) analysis of major and trace elements for silicate rocks by low dilution glass bead method. MAGMA 92, 21–39.
Sun, S.-S., and McDonough, W. F. (1989). “Chemical and isotopic systematics of oceanic basalts: implications for mantle composition and processes,” in Magmatism in the Ocean Basins, Vol. 42, eds A. D. Saunders and M. J. Norry (London: Geological Society London Special Publications), 313–345.
Ueki, K., and Iwamori, H. (2017). Geochemical differentiation processes for arc magma of the Sengan volcanic cluster, Northeastern Japan, constrained from principal component analysis. Lithos 29, 60–75. doi: 10.1016/j.lithos.2017.08.001
Waters, L. E., and Lange, R. A. (2015). An updated calibration of the plagioclase-liquid hygrometer-thermometer applicable to basalts through rhyolites. Am. Mineral. 100, 2172–2184. doi: 10.2138/am-2015-5232
Keywords: active volcano, Izu-Oshima volcano, magma mixing, magma plumbing system, principal component analysis
Citation: Kuritani T, Yamaguchi A, Fukumitsu S, Nakagawa M, Matsumoto A and Yokoyama T (2018) Magma Plumbing System at Izu-Oshima Volcano, Japan: Constraints From Petrological and Geochemical Analyses. Front. Earth Sci. 6:178. doi: 10.3389/feart.2018.00178
Received: 25 July 2018; Accepted: 10 October 2018;
Published: 30 October 2018.
Edited by:
Paterno Castillo, University of California, San Diego, United StatesReviewed by:
Chiara Maria Petrone, Natural History Museum, United KingdomOlivier Namur, KU Leuven, Belgium
Copyright © 2018 Kuritani, Yamaguchi, Fukumitsu, Nakagawa, Matsumoto and Yokoyama. This is an open-access article distributed under the terms of the Creative Commons Attribution License (CC BY). The use, distribution or reproduction in other forums is permitted, provided the original author(s) and the copyright owner(s) are credited and that the original publication in this journal is cited, in accordance with accepted academic practice. No use, distribution or reproduction is permitted which does not comply with these terms.
*Correspondence: Takeshi Kuritani, a3VyaXRhbmlAc2NpLmhva3VkYWkuYWMuanA=
 Takeshi Kuritani
 Azusa Yamaguchi1