- 1Guangdong Provincial Key Laboratory on Functional Soft Condensed Matter, School of Materials and Energy, Guangdong University of Technology, Guangzhou, China
- 2Macau Environmental Research Institute, Macau University of Science and Technology, Macao, China
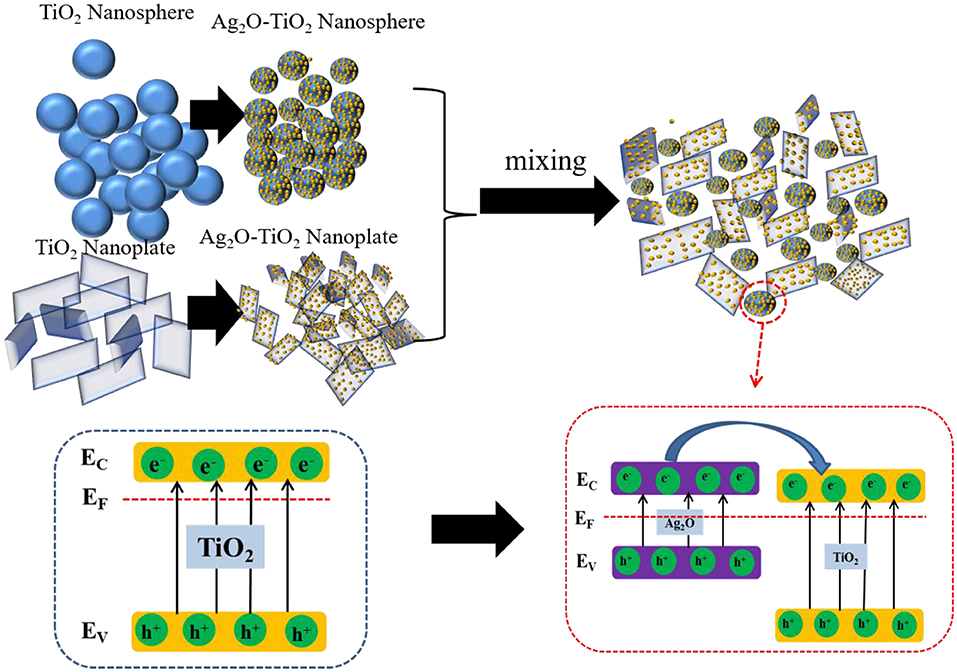
Solar-driven photocatalytic reforming of biomass-derived resources for hydrogen production offers a sustainable route toward the generation of clean and renewable fuels. However, the dispersion stability of the catalyst particles in the aqueous phase hinders the efficiency of hydrogen production. In this work, a novel method of mixing Ag2O-TiO2 photocatalysts with different morphologies was implemented to promote colloidal dispersion stability, thereby improving hydrogen production performance. A series of Ag2O-TiO2 nanoparticles with different morphologies were synthesized, and their dispersion stabilities in aqueous phase were investigated individually. Two types of Ag2O-TiO2 particles with different morphologies under certain proportions were mixed and suspended in glycerol aqueous solution without adding any dispersant for enhancing dispersion stability while reacting. From the results, photocatalytic hydrogen production was found to be strongly correlated to colloidal dispersion stability. The mixed suspension of Ag2O-TiO2 nanosphere and nanoplate achieved an excellent colloidal dispersion stability without employing any additives or external energy input, and the photoreforming hydrogen production obtained from this binary component system was around 1.1–2.3 times higher than that of the single-component system. From the calculated hydrogen production rate constants between continuous stirring and the binary system, there was only <6% difference, suggesting an efficient mass transfer of the binary system for photoreforming hydrogen production. The proposed method could provide some inspiration to a more energy-efficient heterogeneous catalytic hydrogen production process.
Introduction
Photoreforming hydrogen production route has been attracting great attention due to its integration of both solar energy and renewable sources utilization (Liu et al., 2014; Yu et al., 2015; Sadanandam et al., 2017). With the presence of renewable sacrificial organic compounds [e.g., glycerol (Shen Y. et al., 2019), lactic acid (Fu et al., 2019), or wood (Kawai and Sakata, 1980)],
the reaction efficiency of H2 generation could be significantly improved as those compounds are more readily to combine with photo-generated h+ than water splitting. Actually, the redox reaction between water and organic compounds into a one-step process could be defined as photoreforming which is a valid approach to produce H2 as it is more thermodynamically feasible than pure water splitting (Fu et al., 2008). It is worth noting that a large number of biomass-derived substrates, such as bio-alcohols, could be used for this photoreforming hydrogen production process. Among those biomass-derived substrates, glycerol (C3H8O3) as a by-product of biodiesel production attracts special interest for hydrogen production for its low cost and excess production (Daskalaki et al., 2011; Gombac and Falqui, 2016). In our recent studies, glycerol has been found to have great potential for both efficient thermo-chemical and photo-chemical hydrogen production (Wang et al., 2015, 2017a,b; Ni et al., 2017).
Titanium dioxide, one of the most promising photocatalysts, has been widely studied for photoreforming hydrogen production (Petala et al., 2015). However, there are some obstacles for further practical applications of bare TiO2: the severe electron-hole recombination of bare TiO2 catalyst caused by a mismatch between photo-excited charge carriers life span and redox reaction slow kinetics, and this could lead to low energy conversion efficiency (Patrocinio et al., 2015; Litke et al., 2017); the spontaneous aggregation of TiO2-based particles when they are being suspended in aqueous phase due to their exposed high-surface energy facets for particular crystals (Chen et al., 2015; Zhang et al., 2015). Thus, it is desirable to maintain certain dispersion stability during reaction and suppress electron-hole recombination to better achieve hydrogen production. Efforts in previous investigations have been made to enhance the TiO2-basis photocatalytic activity (Yang et al., 2013; Pan et al., 2018; Shen J. et al., 2019; Wang W. et al., 2019). In our previous studies, it was found that photoreforming H2 production could be improved by coupling other metal oxide semiconductors to bare TiO2 with a sol–gel method (Wang et al., 2017a). In particular, an efficient catalytic hydrogen production was achieved over Ag2O-TiO2 catalyst. This was mainly because Ag2O composite could form hetero-structures with TiO2, which could efficiently provide the rapid separation sites for the photo-generated electrons and holes.
Photocatalytic efficiency in an aqueous phase environment is found to be influenced by the catalyst aggregation to some extent (Li et al., 2010). In the works of Lakshminarasimhan et al. (2008), they concluded that the higher photocatalytic hydrogen yield was effected by the particle agglomeration of TiO2. Besides, physical dispersion such as ultrasonic dispersion and mechanical dispersion and chemical dispersion such as dispersant or surfactant addition and nanoparticle surface modification were pointed out to be effective for improving the stability of TiO2 particles in water (Kim and Nishimura, 2012; Othman et al., 2012). However, those methods requiring extra external energy input (e.g., ultrasonic dispersion, mechanical stirring, or electromagnetic stirring, etc.) obviously break the energy balance and increase the cost of large-scale application of photocatalytic hydrogen production. In other previous studies, it was found that the particle agglomeration could be minimized by controlling the pH of the suspension (Zhang et al., 2018), applying silane coupling agent modification of TiO2 (Wang C. et al., 2019) or fluorinating TiO2 particles by fluorine gas etc. (Kim et al., 2012). Kim et al. (2012) reported that the photocatalytic activity would be improved due to the surface fluorination of titanium dioxide by enhancing the dispersion stability of the TiO2 in the organic reagents (Kim and Nishimura, 2012). Theoretically, photocatalytic activity is greatly affected by the dispersion stability which is directly influenced by the electrostatic interactions between the solid surface and generated ions. However, the approaches of TiO2 surface modification may sacrifice the surface-active sites, resulting in a lower surface catalytic reaction efficiency. Those methods of regulating the composition of the liquid substrates (such as adjusting pH value) may also increase the complexity of the aqueous-phase reaction system and interfere with the mass transfer of the reactions. In addition, the high cost of surfactants and the disposal of generated residues would also be derivative issues. In our previous studies, it was discovered that TiO2-H2O nanofluids could be stabilized through the addition of ultra-thin ZrP nanoplatelets (Liu et al., 2015b). The means of mixing TiO2 particles with different shapes may be beneficial to the dispersion stability (Shao et al., 2015). We have achieved a preliminary enhancing hydrogen production by mixing two types of bare TiO2 with different shapes (Shao et al., 2015). The mixed suspension of TiO2 nanosphere and nanosheet still showed great colloidal dispersion stability and photocatalytic hydrogen production promoting at a specific mixing ratio.
Herein, this study attempts to investigate the dispersion stability of Ag2O-TiO2-based photocatalysts with different morphologies and its effect on photocatalytic activity for photoreforming hydrogen production. Various Ag2O-TiO2 nanoparticles with different morphologies were synthesized, and their microstructures were detected by X-ray diffraction (XRD), Brunauer-Emmett-Teller measurements (BET), and high-resolution transmission electron microscopy (HRTEM) analysis etc. The dispersion stabilities of the aqueous suspensions were characterized using zeta potential measurements and a Turbiscan Stability method. Based on the obtained results of previous studies, binary Ag2O-TiO2 systems were introduced by dispersing a certain ratio of two types of Ag2O-TiO2 nanoparticles to enhance the dispersion stabilities. Hydrogen production from photoreforming of glycerol aqueous solution was carried out to examine the relationship between dispersion stability and photocatalytic activity.
Experiment
Synthesis of Various Shapes of Ag2O-TiO2 Nanoparticles
The reason why Ag2O was utilized in the experiment is that Ag2O-TiO2 has the strongest photocatalysis ability among ZnO2-TiO2, Bi2O3-TiO2, and Ag2O-TiO2 due to its narrow band gap and absorption of more spectra energy (Wang et al., 2017a) and the high self-stable shown in the Ag2O to eliminate the external influence to the system stability (Yu et al., 2016).
All chemicals were purchased from Sigma-Aldrich Trading Co. Ltd., and the reagents with analytical grade were used as received without further purification. The deionized water was prepared by Millipore Milli-Q ultrapure water purification systems with a resistivity larger than 18.2 MΩ. Synthesis of various shapes of Ag2O-TiO2 nanoparticles could be summarized as follows: synthesis of TiO2 with various shapes and compounding Ag2O with the prepared TiO2. According to the previously study, TiO2 could be prepared to provide the desired morphologies by several methods. TiO2 nanosphere with the average diameter of 32 nm was directly used as received. The as-prepared TiO2 nanosphere was also served as a precursor in the process of TiO2 nanotube synthesized. The typical hydrothermal process in a certain concentration sodium hydroxide aqueous solution was applied to synthesize TiO2 nanotube (Kumar et al., 2016). At first, 2.5 g TiO2 sample was dispersed in 200 ml of NaOH solution (10 M). After stirring in the circumstance temperature for 1 h, the obtained slurry was transferred and sealed in a Teflon-lined autoclave for the hydrothermal treatment under 130°C in an atmospheric pressure for 20 h. The certain volume of 0.1 mol/L HCl and ethanol solution was applied to wash the precipitate alternately after the supernatant cooling down to the circumstance temperature. For the last step, the obtained solid was dried at 70°C under the atmosphere for 12 h. The hydrothermal process was also employed to prepare TiO2 nanoplate. In the beginning, 10 ml titanium tetra-isopropanolate was dissolved in 1.2 ml hydrofluoric acid with continuous stirring for 30 min. After that, a hydrothermal treatment was carried out for 24 h under 180°C and atmospheric pressure. The products were washed alternatively by water and ethanol in centrifugation until the final pH of the suspension reached 7. The sample was then dried for 12 h at 70°C. It should be noted that all TiO2 samples were calcined at 350°C under the atmosphere for 5 h in the last step of preparation.
After obtaining the TiO2 precursors with different morphologies, the corresponding Ag2O-TiO2 particles were prepared using a precipitation method (Zhou et al., 2010). TiO2 precursors (0.5 g) of each kind were dispersed in 100 ml of distilled water, followed by dissolving 0.725 g AgNO3 to each suspension while stirring (weight ratio of Ag2O:TiO2 = 1:1). Afterward, the excess amount 0.2 M NaOH solution was added to the mixture with continuously stirring to gain the precipitate. Finally, various Ag2O-TiO2 samples were obtained after washing and drying. Due to the control of the compositions, the morphologies of TiO2 were considered to be unchanged after compounding Ag2O. The obtained Ag2O-TiO2 nanosphere, Ag2O-TiO2 nanoplate, and Ag2O-TiO2 nanotubes were denoted as AS, AP, and AT, respectively.
Characterization of Catalysts
The BET (Brunauer-Emmett-Teller) method was employed to detect the specific areas of the catalysts that were detected by N2 adsorption and desorption isotherms at 77 K with Micrometric Acusorb 2100E apparatus. In a typical procedure, the sample was disposed in vacuum to degassed prior to the measurement at 100°C for 1 h and then at 120°C for 2 h in turn. The crystal phase and structure of the samples were investigated using powder XRD (Shimadzu XRD-6000) for diffraction angle 2 h from 20° to 80° where a Cu target Kα-ray (operating at 40 kV and 30 mA, with k = 0.1541 nm). In the applied continuous mode, a nominal step interval of 0.0025° 2θ with a step time of 100 s was set. According to the diffraction peaks and the mean crystallite size was calculated by the Scherrer equation. Detailed morphologies and structures of the catalysts were observed under the HRTEM using JEM-2100. UV-vis absorption spectra of the samples were obtained by a UV-3600 plus (Shimadzu, Japan) apparatus. The particle sizes were analyzed at 25°C by dynamic light scattering (DLS) at a scattering angle of 173 with a Zeta sizer Nano ZS particle size analyzer (Beckman Coulter, Inc., USA).
Colloidal Dispersion Stability Measurements
The dispersion stabilities of the nanoparticle suspensions were analyzed by the Turbiscan Lab® Expert type stability analyzer manufactured by Formulation (France) (Buron et al., 2004; Wiśniewska, 2010; Fang et al., 2012; Kang et al., 2012). A near-infrared light source λ = 880 nm based on multiple light scattering, transmission coefficients, and backscattered pulses was monitored by two simultaneous optical detectors. It should be noted that a fingerprint spectrum characterizing the dispersion performance of sample could be confirmed when the measurement frequency, scanning time, and scanning interval of the analyzer were set. The dispersion stability was evaluated by Turbiscan Stability Index (TSI) with the help of Turbiscan Easy Soft®. Based on the measured data, Turbiscan Stability Index (TSI) could be calculated using the following equation:
Where h is the height of the sample cell, and scani(h) denotes the light transmission or backscattering obtained by the i th scan at height h. Larger TSI value indicates less stable the dispersed system.
Zeta potential profiles of the suspension system were measured using a zeta-potential measurement device (Delsa Nano C/SS). The specific operation process was used to prepare the suspension: 2-mg sample was dispersed into 20-ml solvents and ultrasonicated for 1 h.
Photocatalytic Activity Measurements
The photoreforming H2 production experiments were carried out in a duplex Pyrex flask at nearly ambient temperature and −0.1 MPa pressure, where openings of the flask were sealed with a silicone rubber seals and glass lids. A 300W Xe arc lamp (50 W, 320–780 nm, Beijing Philae Technology Co., Ltd., China) was used as a light source and vertically placed at 10 cm away from the top of the photocatalytic reactor. The focused light intensity and area on the flask for xenon lamp were ca. 120 mW/cm2 and 0.2 cm2, respectively. In each photocatalytic experiment, 0.1 g total amount of catalyst (or mixed binary catalysts with different weight ratios) was suspended in 100-ml glycerol aqueous solution (containing 7 vol% of glycerol). Based on the previous study, different weight ratios were selected as: 20% of AS with 80% of AP (denoted as 1AS-4AP), 40% of AS with 60% of AP (denoted as 2AS-3AP), 60% of AS with 40% of AP (denoted as 3AS-2AP), 80% of AS with 20% of AP (denoted as 4AS-1AP). Before each test, the suspensions were stirred for 30 min and maintained in ultrasonic agitation for another 30 min to maintain the initial dispersion stability. Every effort was made to ensure that there was no external interference making sense to the colloidal stability during each experiment. The produced gaseous products were detected by gas chromatographer with a TCD detector (GC-2014c AT, Shimadzu, Japan) and 5Å molecular sieve column using N2 as a carrier gas. The following equation group would be applied to calculate the apparent quantum efficiency (AQE) and light-to-hydrogen energy conversion efficiency (LTH) according to the work by (Yu et al., 2011):
Where P is radiation flux, E is average irradiance, AR is light-receiving area of reactor; is number of incident photons, t is reaction time, is equivalent wavelength, h is Planck constant, c is constant speed of light;Φa is the apparent quantum efficiency (AQE) and RH2 is the obtained hydrogen production rate, NA is the Avogadro constant; ηis defined as the light-to-hydrogen (LTH) energy conversion efficiency, and is the enthalpy of combustion of hydrogen.
Density Function Theory Calculation
Figures 1A–D show the conventional cell of anatase TiO2 and different surface cells introduced for surface energy calculation in this experience. As known, anatase TiO2 has a tetragonal structure [space group: I41/amd, local symmetry: D4h Long, 2013] that contains two titanium atoms and four oxygen atoms in its unit cell. A range of surface slabs could be created by optimizing bulk unit cell of anatase at its Miller indices by surface builder module in materials studio. In this work, we employed a flat slab with a thickness of 2 atomic layers, which was vertical to the surface and could extend indefinitely in the other two directions to simulate the surface of anatase TiO2 and call periodic boundary conditions. Besides, each repeated replica with a certain vacuum width of 12 Å constituted each surface cell in this work. For example, the proposed supercell model of anatase TiO2 (001) consisted of 16 titanium atoms, 32 oxygen atoms. The layer model of Ag2O coupled with anatase TiO2 (001) consisted of 16 titanium atoms, 37 oxygen atoms, and 10 silver atoms shown in Figures 1E,F. The atomic concentration (the number of atoms that can fit into a given volume) of silver was about 15.87% (atomic fraction), which was referenced from the sample used in the experimental section. All calculations were performed with the CASTEP using a total energy plane-wave pseudo-potential method) module in Material Studio 7.0 on the basis of density function theory (DFT) (Payne et al., 1992). The expanding wave functions of the valence electrons using a plane wave (PW) basis set within a specified energy cut-off of 300 eV. In additionally, we described the exchange correlation energy with the generalized functional approximation of the Perdew-Burke-Ernzerhof gradient(GGA-PBE) (Perdew et al., 1996) and the pseudo-potential representation was in the reciprocal space (Troullier and Martins, 1991).
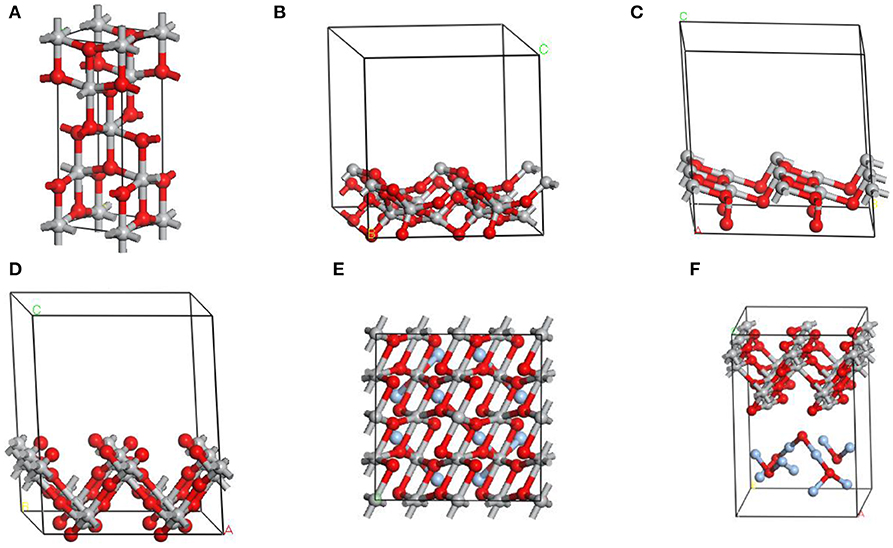
Figure 1. The image of (A) conventional cell of TiO2 in the anatase structure. Side view of crystal structures of different surface cells of TiO2 crystal used for surface energy calculation: (B) [101]; (C) [100]; (D) [001]. (E,F) Top and side views of the optimized geometric structures for Ag2O-TiO2 (001). Azury, red, and gray balls represent Ag, O, and Ti atoms, respectively.
In the calculation, the k-point mesh generated by Monkhorst-Pack scheme was set as 2 ×2 ×2 over Brillouim zone with a k-point spacing of 0.025Å−1. The Broyden-Fletcher-Goldfarb-Shanno (BFGS) method was set to relax the structure and the thresholds for the converged structure were set as following: energy change per atom was <2.0 ×10⁻⁵eV; residual force was <0.05 eV/Å; the displacement of atoms during the geometry optimization was <0.002 Å; and the residual bulk stress was <0.1 Gpa.
The thermodynamic stability of a given surface is dependent on its surface energy and a positive low value indicates a stable surface. The surface energy (Esurf) in a slab model could be calculated by (Meng et al., 2016):
where Eslab and Ebulk represents the total energies of the surface slab and the bulk unit cell, respectively. Nslab and Nbulk are the numbers of atoms contained in the slab and the bulk unit cells, respectively, while A is denoted the unit area of the surface and “2” means that the flat slab has two faces along the z-axis. The surface energy was calculated by the CASTEP module in Materials Studio (MS) on the basis of DFT.
Results and Discussion
Photocatalyst Characterization
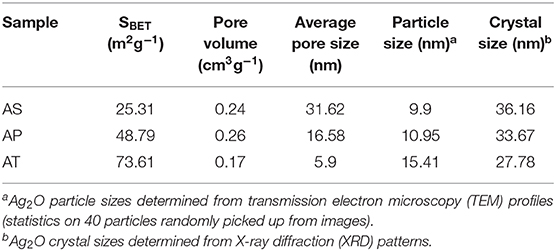
The pore structures and BET surface areas of the as-prepared samples were detected by the N2 adsorption–desorption measurement. Figure 2 showed the isotherms and the corresponding pore size distribution curves of the samples. According to the International Union of Pure and Applied Chemistry (IUPAC) classification, type IV isotherm is the most approximate to the nitrogen adsorption–desorption isotherms of all samples, indicating the presence of mesoporous structure (2–50 nm). The shapes of hysteresis loops were of type H3 at the relative pressure value of range of 0.8–1.0, suggesting the presence of slit-like pores due to the stacking of TiO2-based particles. The Barrett, Joyner, and Halenda (BJH) method was used to obtain the pore size distribution curve from the desorption branch of the nitrogen isotherm. After calculating through the BJH method, the pore diameters for AS, AP, and AT were about 31.62, 16.58, 5.9 nm, and the BET surface areas of AS, AP, and AT were 25.31, 48.79, and 73.61 m2g−1; the related details were listed in Table 1.
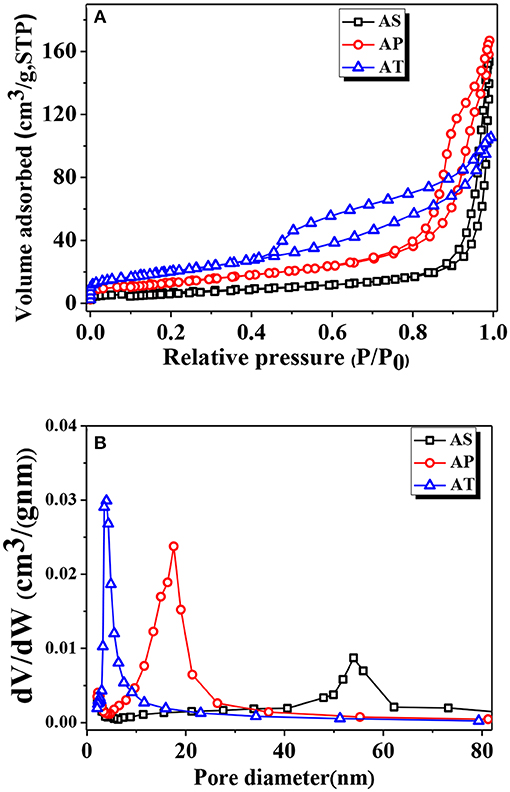
Figure 2. (A) Nitrogen adsorption–desorption isotherms and (B) pore size distributions [Barrett, Joyner, and Halenda (BJH) desorption] of Ag2O-TiO2 nanosphere (AS), Ag2O-TiO2 nanoplate (AP), and Ag2O-TiO2 nanotube (AT) samples.
The crystal structure and crystallinity of the synthesized photocatalysts were investigated using powder XRD analysis, and the results were demonstrated in Figure 3. The peaks at 2θ angles of 25.34, 48.08, and 64.52° for all samples corresponded to the (101), (200), and (204) crystal planes of anatase TiO2 (JCPDS 21-1272). Additionally, the diffraction peaks at 2θ angles of 32.9, 48.40, and 55.18° confirmed the presence of (111), (200), and (220) crystal planes of cubic Ag2O (JCPDS 41-1104). The appearance of Ag2O as a secondary phase in all samples indicated that Ag2O was well compounded with TiO2 particles of three different morphologies by the described synthesis method. As a matter of fact, such structures for all the samples may be beneficial for electron transfer which could be a benefit to the photocatalytic performance (Tan et al., 2003).
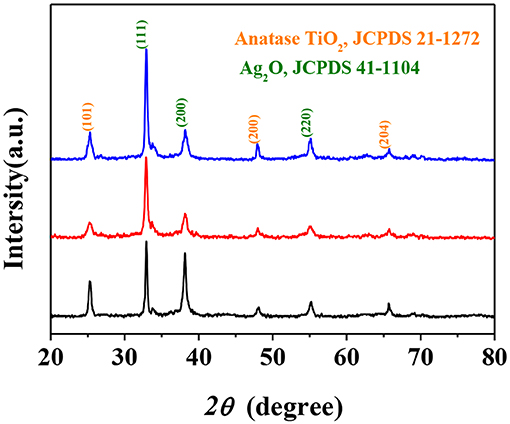
Figure 3. X-Ray Diffraction (XRD) patterns of Ag2O-TiO2 nanosphere (AS), Ag2O-TiO2 nanoplate (AP), and Ag2O-TiO2 nanotube (AT) samples.
As seen in the HRTEM image (Figure 4a), Ag2O grains were regarded as much tinier compared to the bright part and could be identified as dark spots on the surface of the nearly transparent TiO2 nanospheres. The average particles size of Ag2O particles was calculated as 9.9 nm from respective HRTEM image (analyzed by Nano Measurer 1.2.0 software®). In Figures 4b,d, Ag2O particles were also tiny and well-dispersed in the way of anchoring tightly onto the surface of the TiO2 nanoplates. The Ag2O nanoparticles on TiO2 nanoplates are very stable and will not break even after ultrasonic treatment, which is meaningless. It could be observed that the loaded Ag2O particles had a fairly wide range of sizes that varied from 5.64 to 17.93 nm. The HRTEM image of Figure 4c revealed that the structure of the prepared TiO2 nanotubes was of cylindrical shape and hollow inside. The outer and inner diameters of the tube were about 7 and 4 nm, respectively. Similarly, the black spot on the surface of the AT in the HRTEM image implied to the presence of the Ag2O nanoparticles. In the previous observation of Ag2O-TiO2 photocatalyst, some of the Ag2O particles could be reduced to metallic Ag particles (Wang et al., 2017b). The average Ag2O size (20 measurement objects were randomly selected) over AT was 15.41 nm. Furthermore, almost no free Ag2O was found in the background of the HRTEM images, which could confirm a high loading rate of the Ag2O particles. The histogram in Figure 4e demonstrated the identified size distributions of Ag2O particles in each sample. According to the related work (Ren and Yang, 2017), the influence of the ununiform distribution of the Ag2O nanoparticles could be ignored regarding to the H2 yield. In fact, the photoelectrochemical properties of the catalysts synthesized with the same idea had been examined in our previous work which showed a competitive performance (Wang C. et al., 2019).
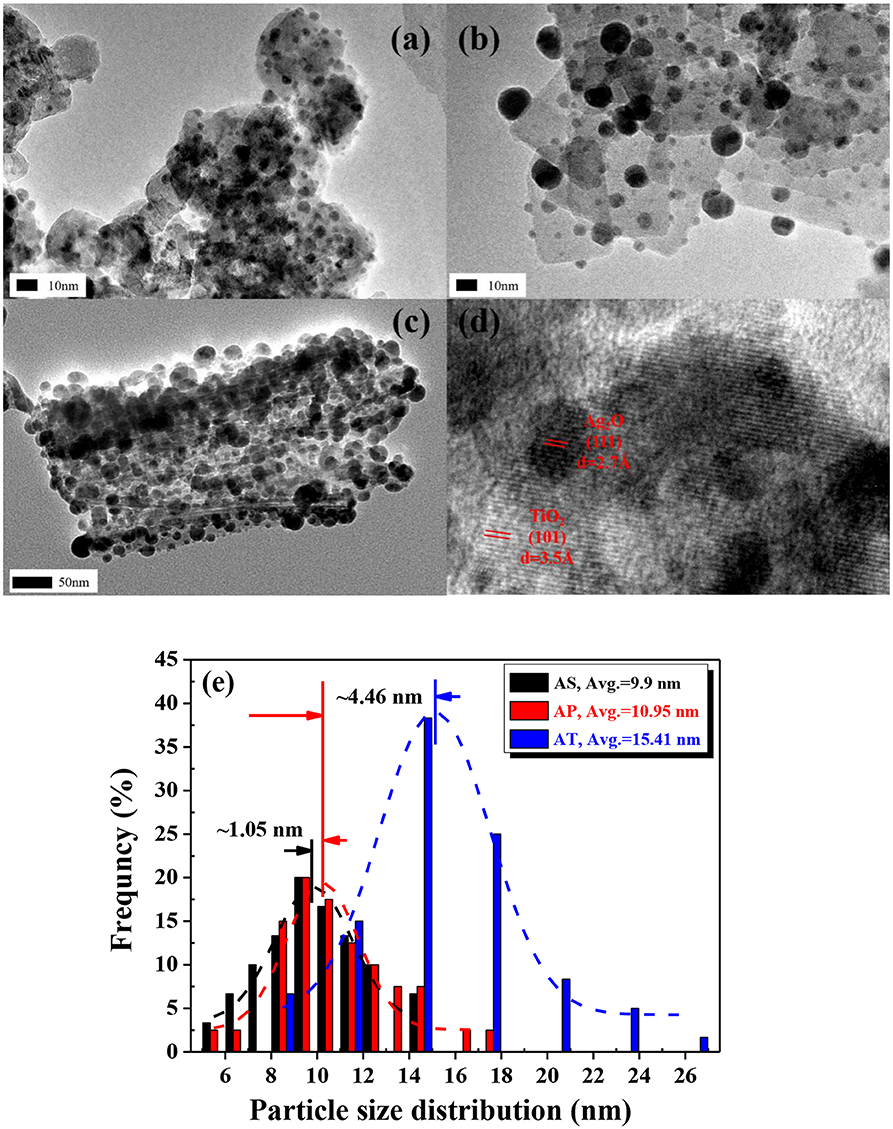
Figure 4. High-resolution transmission electron microscopy (HRTEM) images of: (a) Ag2O-TiO2 nanosphere (AS), (b) Ag2O-TiO2 nanoplate (AP), (c) Ag2O-TiO2 nanotube (AT), (d) the lattice of TiO2 and Ag2O, and (e) particle size distributions of Ag2O on AS, AP, and AT, respectively.
The apparent sizes of catalyst particles were measured in aqueous suspensions with certain concentrations using dynamic light scattering (DLS) technique. Just as the histogram in Figure 5 has shown, it could be observed that there was a wide range of particle diameters and particle aggregations. From the results of DLS measurements, two peaks were detected for all samples, about 5% of the detected particles for all those three samples were in the diameters between 90 and 150 nm. These parts might be formed by individual particles. The other parts of the detected particle sizes for AS, AP, and AT were in the range varying from 300 to 700 nm, 170 to 400 nm, and 250 to 550 nm, respectively, which might reflect their sizes of aggregations.
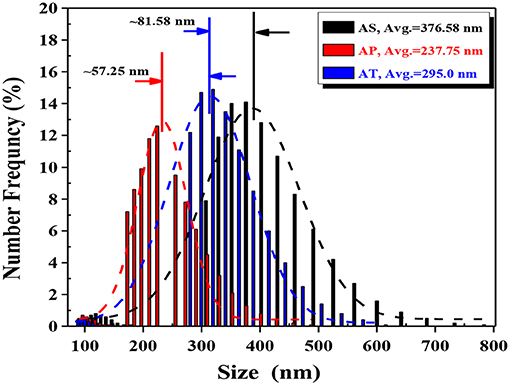
Figure 5. Particle size distribution histograms of dynamic light scattering (DLS) for the TiO2-based particles prepared. Average particle size is calculated from the Gaussian fittings of the histograms: Ag2O-TiO2 nanosphere (AS), Ag2O-TiO2 nanoplate (AP), and Ag2O-TiO2 nanotube (AT).
Figure 6 showed the UV-visible absorption spectra for the binary mixing systems with the Kubelka–Munk diagram for apparent band gap energies (Eg) to understand the optical properties and dispersion stability of the binary system, calculated by the Tauc equation in the following (Grover et al., 2013): (αhν)n = hν-Eg, where ν is frequency, h is Plank's constant, and n = 0.5 for indirect semiconductor, α is absorption coefficient, and Eg is the band gap energy. In fact, the absorptions above 400 nm in catalyst samples were ascribed to the presence of Ag2O as a functional visible-light sensitization compound which possessed both a tough and wide absorption band in the visible-light region (Zhou et al., 2010). The wavelength thresholds of the single-component system AS, AP, and AT were calculated to be 450, 450, and 520 nm, corresponding to the bandgaps of 2.75, 2.75, and 2.40 eV, respectively. The calculated Eg for AS, AP, and AT in this study were at the same level of the reported values of Ag2O-TiO2 (varied from 2.18 to 2.88 eV) (Zhou et al., 2010; Kumar et al., 2016; Ren and Yang, 2017). Here, it should be noted that 20% of AS and 80% of AP were denoted as 1AS-4AP. And other denote similar to the denoting rules. As known, the optical properties of TiO2 nanoparticles were sensitive to their morphologies, therefore the peak intensity differences of UV-vis absorption spectra for the single-component systems were mainly due to their morphological diversities. It could be deduced from the peak intensities of UV-vis light absorption (shown in Figure 6) that the light absorption abilities could be summarized as AS > AP > AT. The present result may be probably caused by the microscopic spatial structures of the materials and the different promoting effects of Ag2O for TiO2 with different morphologies. As shown, the light absorption capacity of AS-AT binary nanoparticle system was stronger than that of the AS single-component system. There was no obvious difference between AP and AT single-component systems in the light absorption capacities. Compared to AT or AP single-component systems, AT-AP binary system had not been improved in light absorption capacity. Generally speaking, the light absorption capacities of the binary systems located between the highest (AS) and lowest (AT) single-component system. From the results, the system of 60% AS mixed with 40% AP (3AS-2AP) exhibited the highest absorption capacity compared to other AS-AP binary systems, AS-AT systems, and AT-AP systems. Since the obtained specific surface areas and light absorption properties of Ag2O-TiO2 materials had no direct and obvious effect on the UV-vis absorption experimental results of the binary systems, it could be considered that the differences of light absorption properties might be caused by their different dispersion stabilities.
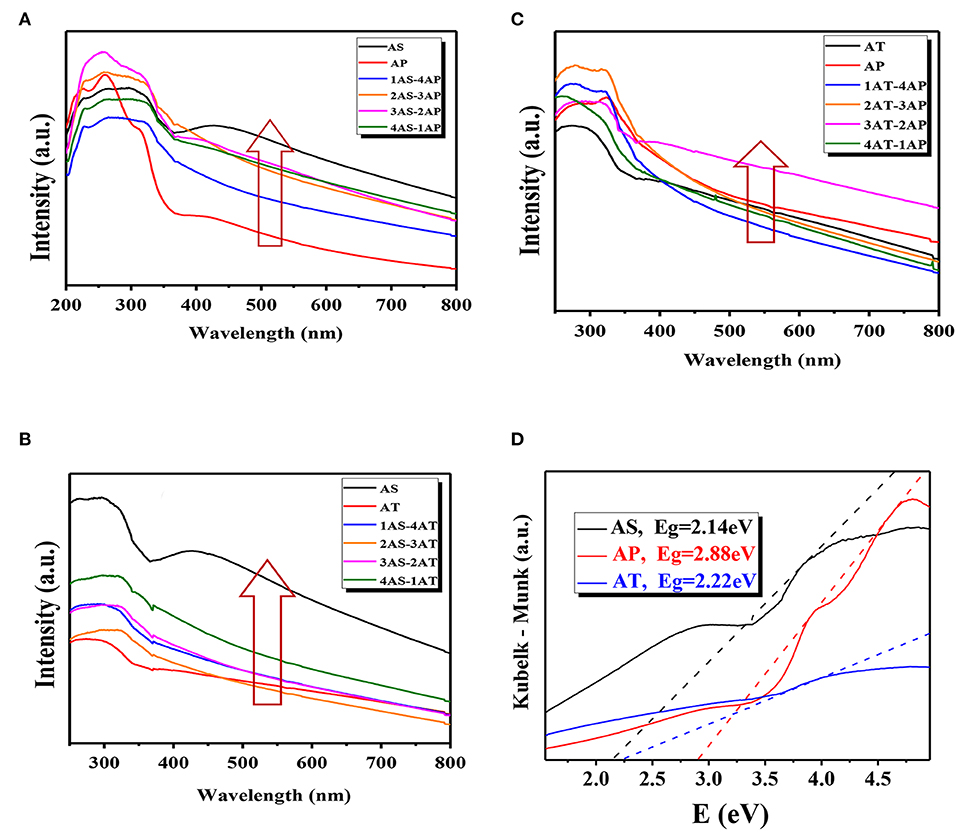
Figure 6. UV-vis absorption spectra (A–C) and the Kubelka–Munk diagrams (D, obtained from the data of the UV- vis absorption spectra) measured at different mixing binary component systems: (A) AS-AP, (B) AS-AT, and (C) AP-AT. AS, Ag2O-TiO2 nanosphere; AP, Ag2O-TiO2 nanoplate; AT, Ag2O-TiO2 nanotube.
Dispersion Stability Analysis
The dispersion stability could be analyzed by Turbiscan Stability Index (TSI), and the obtained TSI values for different systems were plotted in Figure 8. It should be noted that the TSI value shows a negative correlation to the dispersion stability for the suspension, and the increase of TSI value indicates a fast sedimentation process and a large thickness of the sediment. According to the results shown in Figure 7, AS single-component system performed the best dispersion stability among all samples, and the addition of AS with certain concentration improved the dispersion stability of AP- and AT-based systems, respectively. In the case of AP-AT binary system, the TSI values of the selected AT-AP binary systems were smaller than that of AT and AP single-component system, indicating the enhancing dispersion stabilities. Such increase in dispersion stability was possibly related to a comprehensive effect of electrostatic repulsion and steric hindrance according to the DLVO theory (Liu et al., 2015a). Generally speaking, this effect was caused by the reduction of particle collision frequency and agglomeration tendency.
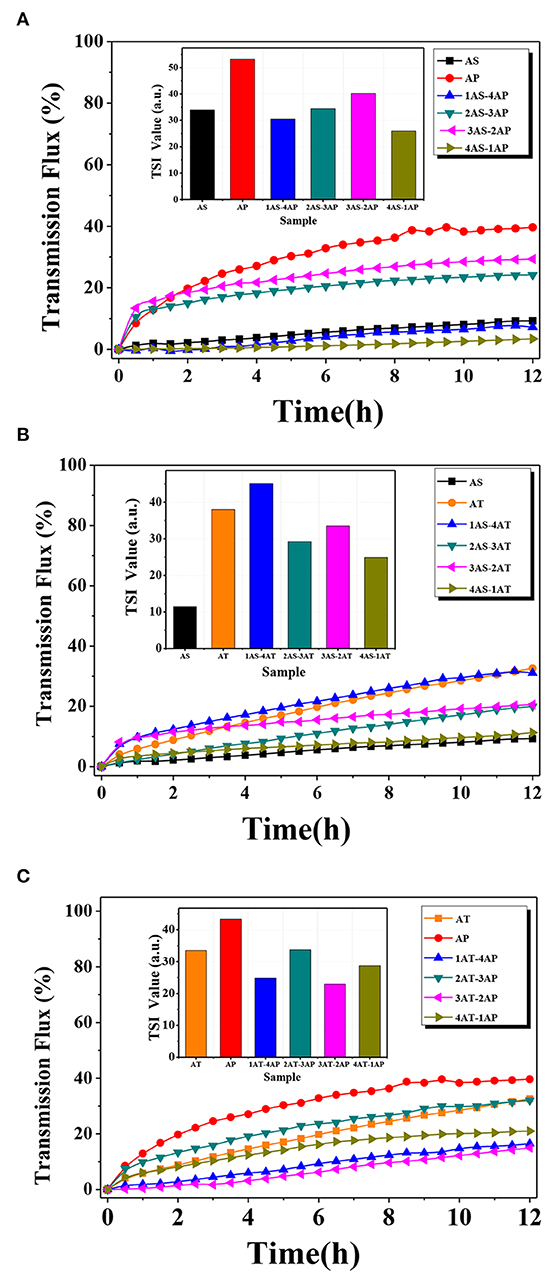
Figure 7. Transmission flux and the absolute value of Turbiscan Stability Indexes (inset) of the catalysts (total concentration of suspension = 0.1 wt.%) at different mixing binary component systems: (A) AS-AP, (B) AS-AT, and (C) AP-AT. AS, Ag2O-TiO2 nanosphere; AP, Ag2O-TiO2 nanoplate; AT, Ag2O-TiO2 nanotube.
The results of average transmission flux were also depicted in Figure 7. There was a fact that particles being homogeneously dispersed in water would block most of the laser to the detector, resulting in low transmission flux, while the formed sedimentations could not block most of the upper laser, so that the total transmission flux would be high. As the time increased, the transmission flux increased from 0 to 42% for the single-component systems, meaning agglomeration and sedimentation of AT and AP particles occurred due to the van der Waals force and the gravitational force. In Figure 7A, the dispersion stability of AP single-component system was significantly improved by mixing AS (AS varied from 0 to 40% of the mixing particles, while the mass of the mixing particles was 0.1 wt.% of total mass of the suspension). Nevertheless, the excessive AS (60%) declined dispersion stability of the suspension. It could be inferred that the depletion interaction between AS and AP was emphasized when reaching a critical ratio, and such depletion interaction between particles with different shapes might influence the dispersion stability (Mason, 2002; Zhang et al., 2013). In the case of AS-AT systems (Figure 7B), AT showed worse dispersion stability than AS with the same total concentration. This result suggested that AT in the suspension was easier to agglomerate resulting in the formation of large AT particles. Unfortunately, there was no obvious improvement in dispersion stability even mixing AS to AT. In Figure 7C, the dispersion stability of AT-AP binary system had been improved compared to AT or AP single-component system, indicating the generation of a strong electrostatic repulsion between the AT and AP solid surface.
Zeta potential (ζ) is widely recognized as an indicator of the stability of colloidal dispersions, revealing the potential difference between the dispersion medium and the fluidic connection of the stationary layer to the dispersed particles. Figure 8 displayed the absolute values of ζ for the single-component systems and the binary component systems. According to the previous study, the obtained values were large enough to maintain a relatively high stability (Patel and Agrawal, 2011). According to the most widely accepted DLVO theory, colloid stability depends on the sum of van der Waals attractions and electrostatic repulsive forces (Missana and Adell, 2000). The ζ value could provide information of the electrostatic repulsive force. On the other hand, the van der Waals force relies on the Hamaker constant, and this constant is determined by particle spatial configurations and other properties without considering the influence of an intervening medium between the two particles of interaction. When the Hamaker constant is small, the reflecting van der Waals force is weak, the low electrostatic repulsion reflected by small ζ may be appropriate to ensure colloid stability (Kim et al., 2014). Therefore, it is common to come across stable colloids with low ζ values.
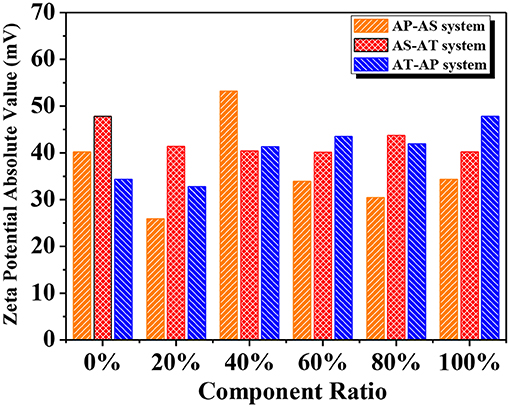
Figure 8. Zeta potential of different binary component systems (the x axis represents the mass ratio of the former component in the mixed system).
Photoreforming Hydrogen Production
The photoreforming H2 evolution over the single and binary systems were carried out in a glycerol-water system stimulated by 300 W xenon lamp. Figure 9 demonstrated the photocatalytic H2 evolution over time for different catalyst systems. As observed, the hydrogen production amount could be summarized as AP < AT < AS for the single-catalyst systems. Although AP with a large specific surface area and a high pore volume was considered as a two-dimensional (2D) material for excellent photo-generated carrier transfer property (Amano et al., 2009), the AP system did not exhibit a competitive photocatalytic hydrogen production performance. According to the analysis dispersion stability, both zeta potential and TSI value showed the poor dispersion stability of AP. In other words, the dispersion stability had a strong influence on hydrogen production performance. To be noted, AT with a 1D nanostructure exhibited higher photocatalytic activity among the single-component systems due to a better delocalization effect of the excited photo-generated electron–hole pairs and well-developed space charge region that reduced the recombination of photo-generated charge species effectively (Toledo Antonio et al., 2010; Kim et al., 2012; Zhao et al., 2014). Still, these advantages may be largely neutralized by the poor dispersion stability of AT. The poor dispersion stability of AT can be confirmed from the TSI value and the transmission flux. This result further indicated the importance of dispersion stability for photocatalytic hydrogen production. Compared with AP and AT single-component systems, AS with the lowest surface area, exhibited the best photocatalytic hydrogen production performance.
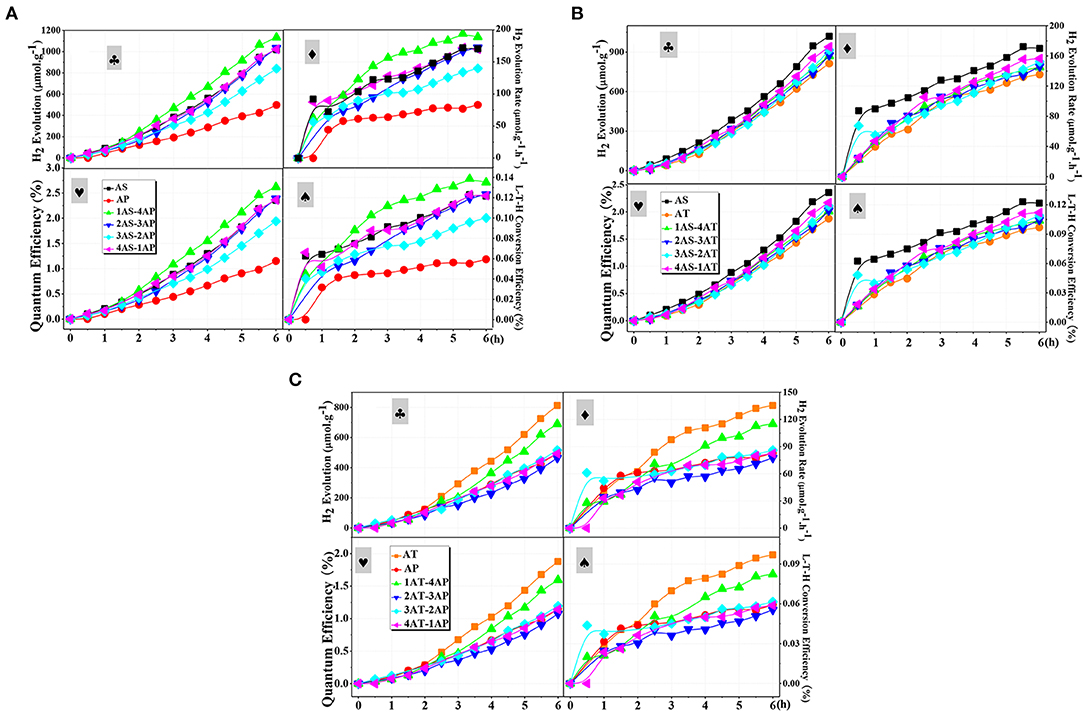
Figure 9. Typical time course of:  H2 production amount,
  hydrogen evolution rate,
  quantum efficiencies, and
  light-to-hydrogen energy efficiencies over the as-prepared photocatalysts in 7 vol.% aqueous solution of glycerol for different mixing binary component systems: (A) AS-AP, (B) AS-AT, and (C) AP-AT. AS, Ag2O-TiO2 nanosphere; AP, Ag2O-TiO2 nanoplate; AT, Ag2O-TiO2 nanotube.
Experiments were carried out to further confirm the role of binary systems with a high dispersion stability for photocatalytic hydrogen production. For AS-AP binary component system (Figure 9A), the photocatalytic activity of AP was significantly improved by mixing AS. From the results of the AS-AP binary systems, 3AS-2AP showed the least photocatalytic hydrogen production amount, while its dispersion stability appeared to be the worst of the binary systems. Since there were differences of catalytic performance and the dispersion stability between AS and AP, the binary system might present its catalytic performance within the range of those two single-component systems. Due to the doping of Ag2O–TiO2, a structure might be formed to display the antenna mechanism for promoting the catalytic activity, and the binary component system may have a more positive impact on the role of this mechanism compared to that of the single-component system (Wang et al., 2006). Among those binary systems, 20% AS and 80% AP system displayed the largest photocatalytic H2 production amount of 1,133.21 μmolg−1. In the suspension of AS-AT binary component system, the depletion interaction between AS and AT was weak, leading to little effect on the enhancement of dispersion stability. As illustrated in Figure 7B, the dispersion stability of AS-AT binary component systems was not effectively improved compared with AS and AT single-component suspensions; therefore, the photocatalytic hydrogen production performance was not enhanced (Figure 9B). In Figure 9C, the photocatalytic performance of the AT-AP binary component system was not significantly improved compared to that of single-component systems regardless of time effect on reaction kinetics, this result was highly consistent with the previous result of bare TiO2 catalyst (Cai et al., 2018). The dispersion stability results of AT-AP binary systems were roughly consistent with the trend of photocatalytic activities. If not considering AT single-component system, 1AT-4AP binary system displayed the photocatalytic H2 production amount of 690.16 μmol·g−1 and was about 1.5 times higher than that of the AP single-component system. However, AT with complex spatial structure and electronic transmission characteristics may have special microscopic particle interaction forces, and this result was similar to that of our previous study of bare TiO2 nanotubes meaning that doping Ag2O did not significantly change the spatial interaction of TiO2 nanotube particles (Cai et al., 2018).
The light source at the range of 320–780 nm was used in this experiment. In the range of UV light irradiation, both TiO2 and Ag2O could be excited to generate the photogenerated electron-hole pairs, while the visible light irradiation is only absorbed by Ag2O, according to (R1) and (R2). The Ag2O would be in situ reduced by the electrons to Ag according to (R3). Then, the photo-generated holes on both TiO2 and Ag2O will produce reactive oxygen species ·OH. At the same time, according to (3) and (5), the O2 obtained by the Ag2O reduced would react with the electrons to more ·OH, which could improve the TiO2 photocatalytic activity (Ran et al., 2019; Chen et al., 2020). Because of the band gap of the Ag2O and TiO2, the Ag2O can be excited to produce h+ and e− under the visible light and the electrons on the conduction would be transferred to the conduction band of TiO2 to produce H2. Thus, in this biphasic photocatalyst, the Ag2O acts as a visible light sensitizer to absorb more energy from the light source, while the Ag acts as an electron to transfer the photo-generated electrons to improve the H2 yield (Sadanandam et al., 2017).
Kinetic Analysis
During a typical heterogeneous photocatalytic hydrogen production from photoreforming, the organic substrates are considered to be strongly adsorbed on the catalyst surface to promote the direct reaction between positive holes and organics rather than those in the solutions (Clarizia et al., 2017). The reaction rate could be described by Langmuir–Hinshelwood (L-H) kinetics, which is dominated by different rate-determining steps under different concentrations of the adsorbed species (Rivero et al., 2019). In fact, the initial concentration of the glycerol solution in this study is an effective means of reflecting kinetic behavior for hydrogen production (shown in Figure 10). For each experiment, 1-h irradiation without stirring was carried out for photocatalyst with a total mass of 0.1 g (80% of AP and 20% of AS which was proved to have a better self-dispersion stability among binary systems). Meanwhile, another set of experiment was conducted under the same condition except for the continuous stirring. The L-H kinetic model could be described as follows:
Assuming the equilibrium of absorption and desorption:
where rH2 refers to H2 generation rate, the result of is the absorption equilibrium constant, kH2 is the rate constant of hydrogen production, θ is the cover degree, and C is the initial concentration of glycerol solution. As shown, the results of the kinetic calculations fitted well with the experimental data for both cases, indicating the wide applicability of L-H kinetics for photoreforming reactions. The increase of reaction rates was significantly reduced when the initial concentrations of the glycerol solutions came to 1 mmol/ml for both cases reflecting the key concentration of the speed-limiting step switching. As obtained, the values of kH2 and of the case under stirring were 217.9 μmol/g·h and 1.39 ml·μmol−1, respectively. On the other hand, the corresponding values of kH2 and b were 204.08 μmol/g·h and 0.90 ml·μmol−1 for the case of colloidal system with a self-dispersion stability. From these results, different reaction rate constants and absorption equilibrium constants for the two cases denoted their different mass transfer characteristics when using the same type of catalyst combination under the same light intensity and temperature. Although the binary system with a better self-dispersion stability was still less efficient than the mass transfer promoted by continuous stirring, it still can be kept at a high level of pseudo first-order kinetic constants. It is worth noting that the difference of hydrogen production rate constants between stirring and self-dispersion stability was <6%, showing that the mass transfer efficiency of the binary system for hydrogen production was high within the selected concentration range.
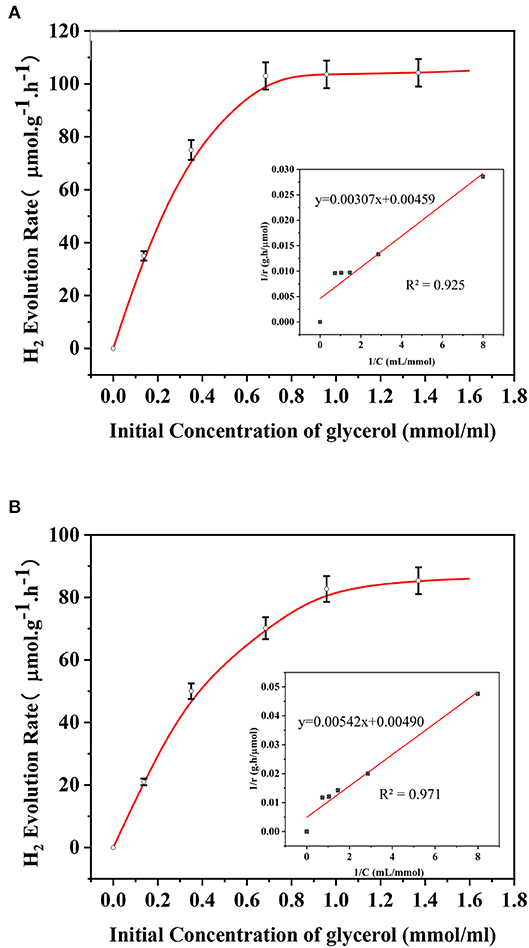
Figure 10. Initial H2 evolution rate curve (A) with stirring (B) without stirring and the fitting plot of 1/r vs. 1/C in the inset.
Density Function Theory Study
The crystal lattice of Ag2O and bulk anatase TiO2 had been optimized before calculated Ag2O and TiO2 surface and the lattice constant of Ag2O after optimizing is 4.728Å. The lattice parameter of bulk anatase TiO2 (a = 3.776Å, b = 3.776Å, c = 9.486Å), calculated by DFT method, corresponded to the experimental data (Arlt et al., 2000). The equilibrium morphology of a crystal was determined by its surface energy and the related growth rate of various surfaces (Cooper and de Leeuw, 2003), which means the certain surface with a high surface energy was supposed to have a great growth rate, and these fast growing surface would not be presented in the resulting crystal morphology. On the contrary, those surfaces with low surface energies and hence slow growing rates had the opposite situation in the resulting crystal morphology (Gao et al., 2013). According to the surface energies theory, the thermodynamic penalty for cleaving a surface from a bulk material was also detected. The calculated surface energies of three types of anatase TiO2 surfaces are shown in Table 2. According to Table 2, the surface energies of different anatase TiO2 surfaces followed the order of [001] > [100] > [101]. (101) surface with the lowest surface energy was the main cleavage and was expressed planes in the equilibrium morphology of anatase TiO2 crystal which matched well with the XRD results (in Figure 3). The total energy of a unit cell with formula Ti2O4 of anatase crystal is shown in the footnote in Table 2.
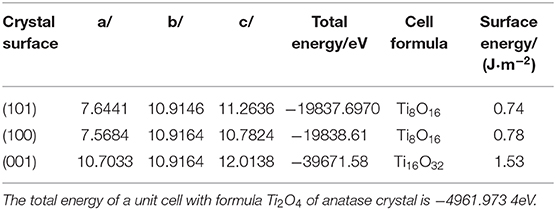
Table 2. Total energies of surface cells and surface energies of different surfaces of anatase TiO2.
Figures 11A,B displayed the obtained band structure and density of states DOS [including the total density of states (TDOS) and the partial density of states (PDOS)] of pure anatase TiO2. The calculated band gap of pure anatase TiO2 was 2.098 eV, which was underestimated comparing to the experimental Eg = 3.2eV for the reason that the framework of the DFT would not take discontinuity of the exchange-correlation potential into account (Stampfl and Van de Walle, 1999; Zhao et al., 2015). The valence band of the pure anatase TiO2 phase was mainly composed of the part from −20 to −15 eV and the one from −5 to 0 eV. The former part was mainly consisted by the O2s states, which were far away from the top of the valence band, and other electronic states were not obvious, so it had little impact on the physical properties of objects. The latter part was mainly consisted of both the O2p states and Ti3d states. As the Ti3d states were split into two parts (the t2g and eg states) in an octahedral ligand field with Oh symmetry, the CB could be divided into the lower and the upper parts (Fang et al., 2014). Additionally, the PDOS diagram showed that the conduction band mainly consisted by the Ti3d states. In general, the Ti3d states act a dominate role in the conduction band in the pure TiO2, while the O2p states act in the valence band. This result implies that the main cause of optical absorption is electrons transiting from O2p to Ti3d states, which is corresponding to the previous theoretical researches (Cao et al., 2014; Wang et al., 2017a).
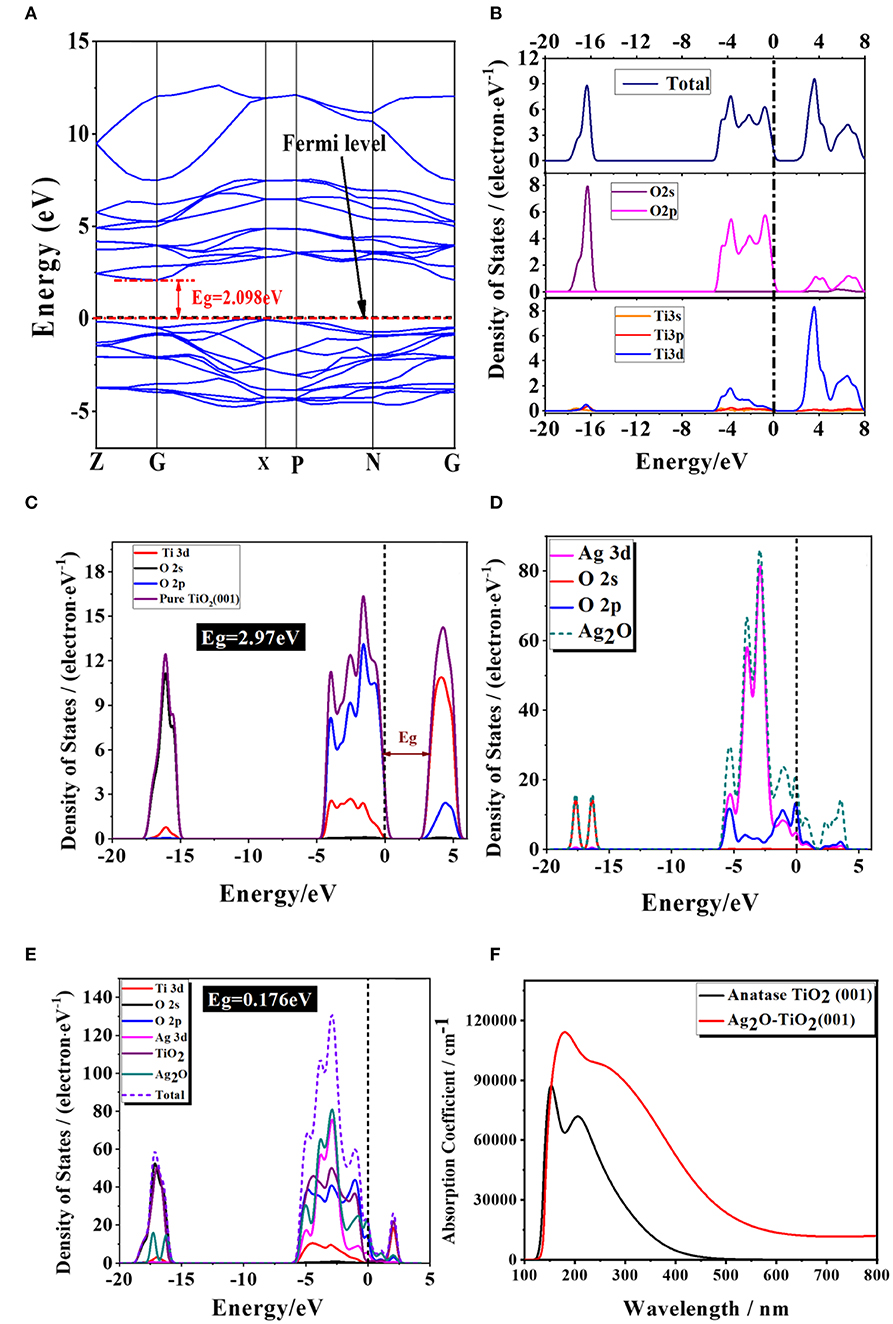
Figure 11. The image of (A) calculated properties of pure anatase TiO2 band structure; (B) the density of states; the density of states on Ag, Ti, and O atoms for (C) anatase TiO2 (001) slab, (D) Ag2O and (E) Ag2O-TiO2 (001), and (F) the calculated light absorption of the pure anatase TiO2 and Ag2O-TiO2. The short dotted lines denote the Fermi level.
As compared to the 2.97V of Eg of pristine TiO2 (001), the Eg was found to narrow to 0.176eV for Ag2O coupled with TiO2 (001). In general, in pure TiO2, the Ti3d states act a dominate role in the conduction band, while the O2p states act in the valence band. This result implies that the main cause of optical absorption is electrons transiting from O2p to Ti3d states, which is corresponding to the previous theoretical researches (Melrose and Stoneham, 1977; Wang et al., 2017a). Our previous studies reported that incorporation of Ag2O into TiO2 can extend the spectral response to the visible-light region, and the photocatalytic activity is greatly enhanced in hydrogen production from glycerol:water mixture systems (Melrose and Stoneham, 1977; Wang et al., 2017b). Our calculated results were well-agreed with these experimental results. The projected density of states has been corrected to the partial density of states (PDOS) were calculated and plotted in Figures 11D–F in order to further gain the origin of electronic structures of Ag2O-coupled TiO2. For comparison, the DOS and PDOS of pure TiO2 and Ag2O were also displayed in Figures 11D,E, respectively. According to the calculated results, the top of the valance band of pure Ag2O consists mainly of Ag3d states, while the bottom of the conduction band is dominated by O2p states. Whenever coupled on perfect and deficient TiO2 (001) surfaces, the characteristic DOS of Ag2O accounted for the fact that Ag2O is preserved well. Additionally, calculations indicated that the shift of Fermi level is up-shifted by 1.1 eV relative to the position of conduction band of TiO2. The appearance of the down-shifted of the bottom conduction band indicated the appearance of the Ag3d and O2p of Ag2O compared with pure TiO2 (001). For Ag2O-coupled TiO2, the splitting of the Ag3d and O2p orbitals into occupied and unoccupied states will cause an impurity band in the forbidden gap, which would express as a weak but visible peak in the vicinity of the Fermi level in the image (Figure 11E). These effects may result in the band gaps being narrowed (Fang et al., 2014).
To further analyze the optical absorption spectrum of pure and coupled TiO2, we calculated the complex dielectric function ε(ω) = ε1(ω)−iε2(ω) according to the obtained electronic structures. Generally speaking, the imaginary part, ε2(ω), of the dielectric function could be evaluated from the momentum matrix elements between the occupied and unoccupied wave functions. ε1(ω), the real part of the dielectric function, could be evaluated from ε2(ω) by the Kramer–Kronig relationship (Sun and Wang, 2005). The absorption spectra were calculated based on the equation (Zhang et al., 2017):
In this equation, I represents the optical absorption coefficient, ω represents the angular frequency. Based on the calculated electronic structures, the optical absorption spectra of the pure TiO2 and Ag2O-coupled TiO2 were calculated and shown in Figure 11C. It could be very clearly observed that the pure TiO2 had nearly no response to the range of the visible range and only absorbed actively to UV light. In contrast, for Ag2O-coupled Ag2O, the narrowed band gap will effectively absorb light in visible range due to the formation of the localized mad gap level above the conduction band by Ag2O compounding. The result is in line with that of DOS.
Conclusion
A series of Ag2O-TiO2 nanoparticles with different morphologies were prepared, and their dispersion stabilities in aqueous phase were investigated individually. Among those Ag2O-TiO2 composite catalysts, Ag2O-TiO2 nanosphere displayed a better colloidal dispersion stability in the suspensions. Using the as-prepared Ag2O-TiO2 catalysts, photoreforming H2 production was carried out from glycerol aqueous solution and the colloidal dispersion stability was found to be one of the dominant factors for heterogeneous catalysis in aqueous phase. Novel Ag2O-TiO2 binary component systems with proper ratios of mixture were successfully introduced to enhance the dispersion stability, thereby improving hydrogen production performance. Among the binary component systems, 20% Ag2O-TiO2 nanospheres mixing with 80% Ag2O-TiO2 nanoplates displayed the best photocatalytic activity with the maximum H2 production amounts around 11,33.21 μmolg−1. It was interesting that the difference of hydrogen production rate constants between continuous stirring and the binary system was <6%, indicating an efficient mass transfer of the binary system toward photoreforming hydrogen production. In order to further explore the mechanism, the photoelectrochemical characteristics are suggested for study in the future work. The proposed method of mixing Ag2O-TiO2 catalyst particles with different shapes could provide some inspiration to a more energy-efficient heterogeneous catalytic hydrogen production process.
Data Availability Statement
The raw data supporting the conclusions of this article will be made available by the authors, without undue reservation, to any qualified researcher.
Author Contributions
ZY and CW contributed experiment methods and design of DFT calculations. WZ and SM contributed the synthesis of the samples and the characteristics of the sample. YC, JZ, RS, and QS organized the literature research of this issue and wrote part of the manuscript. All authors contributed to manuscript revision, read, and approved the submitted version.
Funding
The authors gratefully acknowledge the financial support rovided by the Natural Science Foundation of China (Nos. 51706048 and 51606046) and Guangdong Special Support Plan for Leading Talents (No. 2017TX04N371).
Conflict of Interest
The authors declare that the research was conducted in the absence of any commercial or financial relationships that could be construed as a potential conflict of interest.
References
Amano, F., Prieto-Mahaney, O., Terada, Y., and Yasumoto, T. (2009). Decahedral single-crystalline particles of anatase titanium(IV) oxide with high photocatalytic activity. Chem. Mater. 21, 2601–2603. doi: 10.1021/cm9004344
Arlt, T., Bermejo, M., Blanco, M. A., Gerward, L., Jiang, J., Olsen, S, et al. (2000). High-pressure polymorphs of anatase TiO2. Phys. Rev. B 61, 21. doi: 10.1103/PhysRevB.61.14414
Buron, H., Mengual, O., Meunier, G., and Cayré, I. (2004). Optical characterization of concentrated dispersions: applications to laboratory analyses and on-line process monitoring and control. Polym. Int. 53, 1205–1209. doi: 10.1002/pi.1231
Cai, X., Wang, C., Chen, Y., Cheng, Z., Shu, R., Zhang, J., et al. (2018). A novel approach for enhancing hydrogen production from bio-glycerol photoreforming by improving colloidal dispersion stability. Sci. Total Environ. 627, 1464–1472. doi: 10.1016/j.scitotenv.2018.02.009
Cao, L., Wang, D., Xu, L., and Li, X. (2014). First-principles study on the synergistic effects of Mo-C codoped anatase TiO2. Solid State Commun. 185, 5–9. doi: 10.1016/j.ssc.2014.01.016
Chen, P., Liu, H., Sun, Y., Li, J., Cui, W., and Wang, L. (2020). Bi metal prevents the deactivation of oxygen vacancies in Bi2O2CO3 for stable and efficient photocatalytic NO abatement. Appl. Catalysis B 264:118545. doi: 10.1016/j.apcatb.2019.118545
Chen, W., Kuang, Q., Wang, Q., and Xie, Z. (2015). Engineering a high energy surface of anatase TiO2 crystals towards enhanced performance for energy conversion and environmental applications. RSC Adv. 5, 20396–20409. doi: 10.1039/C5RA00344J
Clarizia, L., Somma, I. D., Onotri, L., Andreozzi, R., and Marotta, R. (2017). Kinetic modeling of hydrogen generation over nano-Cu(s)/TiO2 catalyst through photoreforming of alcohols. Catalysis Today 281, 117–123. doi: 10.1016/j.cattod.2016.05.053
Cooper, T. G., and de Leeuw, N. H. (2003). A combined ab initio and atomistic simulation study of the surface and interfacial structures and energies of hydrated scheelite: introducing a CaWO4 potential model. Surf. Sci. 531, 159–176. doi: 10.1016/S0039-6028(03)00362-5
Daskalaki, V. M., Panagiotopoulou, P., and Kondarides, D. I. (2011). Production of peroxide species in Pt/TiO2 suspensions under conditions of photocatalytic water splitting and glycerol photoreforming. Chem. Eng. J. 170, 433–439. doi: 10.1016/j.cej.2010.11.093
Fang, F. F., Liu, Y. D., and Choi, H. J. (2012). Carbon nanotube coated magnetic carbonyl iron microspheres prepared by solvent casting method and their magneto-responsive characteristics. Colloids Surfaces A 412, 47–56. doi: 10.1016/j.colsurfa.2012.07.013
Fang, Y., Cheng, D., and Wu, W. (2014). Understanding electronic and optical properties of N-Sn codoped anatase TiO2. Computat. Mater. Sci. 85, 264–268. doi: 10.1016/j.commatsci.2014.01.018
Fu, J., Xu, Q., Low, J., Jiang, C., and Yu, J. (2019). Ultrathin 2D/2D WO3/g-C3N4 step-scheme H2-production photocatalyst. Appl. Catal. B 243, 556–565. doi: 10.1016/j.apcatb.2018.11.011
Fu, X., Long, J., Wang, X., Leung, D., Ding, Z., Wu, L., et al. (2008). Photocatalytic reforming of biomass: a systematic study of hydrogen evolution from glucose solution. Int. J. Hydrogen Energy 33, 6484–6491. doi: 10.1016/j.ijhydene.2008.07.068
Gao, Z., Sun, W., Hu, Y., and Liu, X. (2013). Surface energies and appearances of commonly exposed surfaces of scheelite crystal. Transact. Nonferrous Metals Soc. China 23, 2147–2152. doi: 10.1016/S1003-6326(13)62710-7
Gombac, V., and Falqui, T. M. A. (2016). From trash to resource: recovered-Pd from spent three-way catalysts as a precursor of an effective photo-catalyst for H2 production. Green Chem. 18, 2745–2752. doi: 10.1039/C5GC02908B
Grover, I. S., Singh, S., and Pal, B. (2013). The preparation, surface structure, zeta potential, surface charge density and photocatalytic activity of TiO2 nanostructures of different shapes. Appl. Surf. Sci. 280, 366–372. doi: 10.1016/j.apsusc.2013.04.163
Kang, E., Choi, S., Choi, C., and Shim, S. E. (2012). Aqueous dispersion of submicron-sized diamond particles for thermally conductive polyurethane coating. Colloids Surf. 415, 255–261. doi: 10.1016/j.colsurfa.2012.09.028
Kawai, T., and Sakata, T. (1980). Conversion of carbohydrate into hydrogen fuel by a photocatalytic process. Nature 286, 474–476. doi: 10.1038/286474a0
Kim, J., and Nishimura, F. (2012). Enhanced dispersion stability and photocatalytic activity of TiO2 particles fluorinated by fluorine gas. J. Fluor. Chem. 144, 165–170. doi: 10.1016/j.jfluchem.2012.08.010
Kim, K. M., Kim, H. M., Lee, W. J., Lee, C. W., Kim, T. I., Lee, J. K., et al. (2014). Surface treatment of silica nanoparticles for stable and charge-controlled colloidal silica. Int. J. Nanomed. 9, 29–40. doi: 10.2147/IJN.S57922
Kim, S., Lee, Y., Kim, B. H., Seo, S., Park, S. H., and Jung, S. J. (2012). Photocatalytic activity of titanate nanotube powders in a hybrid pollution control system. Int.J. Photoenergy 2012, 1–6. doi: 10.1155/2012/901907
Kumar, D. P., Reddy, N. L., Karthik, M., Neppolian, B., Madhavand, J., and Shankara, M. V. (2016). Solar light sensitized p-Ag2O/n-TiO2 nanotubes heterojunction photocatalysts for enhanced hydrogen production in aqueous-glycerol solution. Solar Energy Mater. Solar Cells 154, 78–87. doi: 10.1016/j.solmat.2016.04.033
Lakshminarasimhan, N., Kim, W., and Choi, W. (2008). Effect of the agglomerated state on the photocatalytic hydrogen production with in situ agglomeration of colloidal TiO2 nanoparticles. J. Phys. Chem. 112, 20451–20457. doi: 10.1021/jp808541v
Li, G., Lv, L., Fan, H., Ma, J., Li, Y., Wan, Y., et al. (2010). Effect of the agglomeration of TiO2 nanoparticles on their photocatalytic performance in the aqueous phase. J. Colloid Interface Sci. 348, 342–347. doi: 10.1016/j.jcis.2010.04.045
Litke, A., Su, Y., Tranca, I., Weber, T., Hensen, E. J. M., and Hofmann, J. P. (2017). Role of adsorbed water on charge carrier dynamics in photoexcited TiO2. J. Phys. Chem. C 121, 7514–7524. doi: 10.1021/acs.jpcc.7b00472
Liu, R., Yoshida, H., Fujita, S., and Arai, M. (2014). Photocatalytic hydrogen production from glycerol and water with NiOx/TiO2 catalysts. Appl. Catal. 144, 41–45. doi: 10.1016/j.apcatb.2013.06.024
Liu, Z., Chen, Y., Mo, S., Cheng, Z., and Li, H. (2015a). Stability of TiO2 nanoparticles in deionized water with ZrP nanoplatelets. J. Nanosci. Nanotechnol. 15, 3271–3275. doi: 10.1166/jnn.2015.9685
Liu, Z., Yin, T., Chen, Y., Cheng, Z., Mo, S., and Jia, L. (2015b). Improving the stability of TiO2 aqueous suspensions by coupling TiO2 nanoparticles on ZrP nanoplatelets. Energy Procedia 75, 2199–2204. doi: 10.1016/j.egypro.2015.07.377
Long, R. (2013). Electronic structure of semiconducting and metallic tubes in tio2/carbon nanotube heterojunctions: density functional theory calculations. J. Phys. Chem. Lett. 4, 1340–1346. doi: 10.1021/jz400589v
Mason, T. G. (2002). Osmotically driven shape-dependent colloidal separations. Phys. Rev. 66:60402. doi: 10.1103/PhysRevE.66.060402
Melrose, D. B., and Stoneham, R. J. (1977). The polarization tensor for a magnetized vacuum. J. Phys. A-Math. Gen. 10, 1211–1224. doi: 10.1088/0305-4470/10/7/018
Meng, A., Zhang, J., Xu, D., and Cheng, B. (2016). Enhanced photocatalytic H2 -production activity of anatase TiO2 nanosheet by selectively depositing dual-cocatalysts on {101} and {001} facets. Appl. Catal. Environ. 198, 286–294. doi: 10.1016/j.apcatb.2016.05.074
Missana, T., and Adell, A. (2000). On the applicability of DLVO theory to the prediction of clay colloids stability. J. Colloid Interface Sci. 230, 150–156. doi: 10.1006/jcis.2000.7003
Ni, Y., Wang, C., Chen, Y., Cai, X., and Dou, B. (2017). High purity hydrogen production from sorption enhanced chemical looping glycerol reforming: Application of NiO - based oxygen transfer materials and potassium promoted Li2ZrO3 as CO2 sorbent. Appl. Therm. Eng. 124, 454–465. doi: 10.1016/j.applthermaleng.2017.06.003
Othman, S. H., Rashid, S. A., Tinia, I. M. G., and Abdullah, N. (2012). Dispersion and stabilization of photocatalytic TiO2 nanoparticles in aqueous suspension for coatings applications. J. Nanomater. 2012:718214. doi: 10.1155/2012/718214
Pan, D., Han, Z., Miao, Y., Zhang, D., and Li, G. (2018). Thermally stable TiO2 quantum dots embedded in SiO2 foams: characterization and photocatalytic H2 evolution activity. Appl. Catal. B 229, 130–138. doi: 10.1016/j.apcatb.2018.02.022
Patel, V. R., and Agrawal, Y. K. (2011). Nanosuspension: an approach to enhance solubility of drugs. J. Adv. Pharmaceut. Tech. Res. 2, 81–87. doi: 10.4103/2231-4040.82950
Patrocinio, A. O. T., Schneider, J., França, M. D., Santos, L. M., Caixeta, B. P. A., and Machadoa, E. H. (2015). Charge carrier dynamics and photocatalytic behavior of TiO2 nanopowders submitted to hydrothermal or conventional heat treatment. RSC Adv. 5, 70536–70545. doi: 10.1039/C5RA13291F
Payne, M. C., Teter, M. P., Allan, D. C., Arias, T. A., and Joannopoulos, J. D. (1992). Iterative minimization techniques for ab initio total-energy calculations: molecular dynamics and conjugate gradients. Rev. Modern Phys. 64, 1045–1097. doi: 10.1103/RevModPhys.64.1045
Perdew, J. P., Burke, K., and Ernzerhof, M. (1996). Generalized gradient approximation made simple. Phys. Rev. Lett. 77, 3865–3868. doi: 10.1103/PhysRevLett.77.3865
Petala, A., Ioannidou, E., Georgaka, A., Bourikas, K., and Kondaridesa, D. I. (2015). Hysteresis phenomena and rate fluctuations under conditions of glycerol photo-reforming reaction over CuOx/TiO2 catalysts. Appl. Catal. 178, 201–209. doi: 10.1016/j.apcatb.2014.09.021
Ran, M., Wang, H., Cui, W., Li, J., Chen, P., Sun, Y., et al. (2019). Light-induced generation and regeneration of oxygen vacancies in BiSbO4 for sustainable visible light photocatalysis. ACS Appl. Mater. Interf. 11, 47984–47991. doi: 10.1021/acsami.9b18154
Ren, H., and Yang, Q. (2017). Fabrication of Ag2O/TiO2 with enhanced photocatalytic performances for dye pollutants degradation by a pH-induced method. Appl. Surf. Sci. 396, 530–538. doi: 10.1016/j.apsusc.2016.10.191
Rivero, M. J., Iglesias, O., Ribao, P., and Ortiz, I. (2019). Kinetic performance of TiO2/Pt/reduced graphene oxide composites in the photocatalytic hydrogen production. Int. J. Hydrogen Energy 44, 101–109. doi: 10.1016/j.ijhydene.2018.02.115
Sadanandam, G., Valluri, D. K., and Scurrell, M. S. (2017). Highly stabilized Ag2O-loaded nano TiO2 for hydrogen production from glycerol: water mixtures under solar light irradiation. Int. J. Hydrogen Energy 42, 807–820. doi: 10.1016/j.ijhydene.2016.10.131
Shao, X., Chen, Y., Mo, S., Cheng, Z., and Yin, T. (2015). Dispersion stability of TiO2-H2O nanofluids containing mixed nanotubes and nanosheets. Energy Procedia 75, 2049–2054. doi: 10.1016/j.egypro.2015.07.282
Shen, J., Wang, R., Liu, Q., Yang, X., Tang, H., and Yang, J. (2019). Accelerating photocatalytic hydrogen evolution and pollutant degradation by coupling organic co-catalysts with TiO2. Chinese J. Catal. 40, 380–389. doi: 10.1016/S1872-2067(18)63166-3
Shen, Y., Mamakhel, A., Liu, X., Hansen, T. W., Tabanelli, T., and Bonincontro, D. (2019). Promotion mechanisms of au supported on TiO2 in thermal and photocatalytic glycerol conversion. J. Phys. Chem. 123, 19734–19741. doi: 10.1021/acs.jpcc.9b05475
Stampfl, C., and Van de Walle, C. G. (1999). Density-functional calculations for III-V nitrides using the local-density approximation and the generalized gradient approximation. Phys. Rev. B 59, 8–15. doi: 10.1103/PhysRevB.59.5521
Sun, J., and Wang, H. (2005). Ab initio investigations of optical properties of the high-pressure phases of ZnO. Phys. Rev. B 71, 12–15. doi: 10.1103/PhysRevB.71.125132
Tan, T. T. Y., Yip, C. K., Beydoun, D., and Amal, R. (2003). Effects of nano-Ag particles loading on TiO2 photocatalytic reduction of selenate ions. Chem. Eng. J. 95, 179–186. doi: 10.1016/S1385-8947(03)00103-7
Toledo Antonio, J. A., Cortes-Jacome, M. A., Orozco-Cerros, S. L., Montiel-Palacios, E., Suarez-Parra, R., Angeles-Chavez, C., et al. (2010). Assessing optimal photoactivity on titania nanotubes using different annealing temperatures. Appl. Catal. 100, 47–54. doi: 10.1016/j.apcatb.2010.07.009
Troullier, N., and Martins, J. L. (1991). Efficient pseudopotentials for plane-wave calculations. Phys. Rev. B Condens. Matter. 43, 1993–2006. doi: 10.1103/PhysRevB.43.1993
Wang, C., Bu, E., Chen, Y., Cheng, Z., Zhang, J., Shu, R., et al. (2019). Enhanced photoreforming hydrogen production: pickering interfacial catalysis from a bio-derived biphasic system. Renew. Energy 134, 113–124. doi: 10.1016/j.renene.2018.09.001
Wang, C., Cai, X., Chen, Y., Cheng, Z., Luo, X., Mo, S., et al. (2017a). Improved hydrogen production from glycerol photoreforming over sol-gel derived TiO2 coupled with metal oxides. Chem. Eng. J. 317, 522–532. doi: 10.1016/j.cej.2017.02.033
Wang, C., Cai, X., Chen, Y., Cheng, Z., Luo, X., Mo, S., et al. (2017b). Efficient hydrogen production from glycerol photoreforming over Ag2O-TiO2 synthesized by a sol-gel method. Int. J. Hydrogen Energy 42, 17063–17074. doi: 10.1016/j.ijhydene.2017.05.183
Wang, C., Chen, Y., Cheng, Z., and Luo, X. (2015). Sorption-enhanced steam reforming of glycerol for hydrogen production over a NiO/NiAl2O4 catalyst and Li2ZrO3-based sorbent. Energy Fuels 29, 7408–7418. doi: 10.1021/acs.energyfuels.5b01941
Wang, C., Pagel, R., Dohrmann, J. K., and Bahnemann, D. W. (2006). Antenna mechanism and deaggregation concept: novel mechanistic principles for photocatalysis. Comptes Rendus Chim. 9, 761–773. doi: 10.1016/j.crci.2005.02.053
Wang, W., Zhu, S., Cao, Y., Tao, Y., Pan, D., Phillips, D. L., et al. (2019). Edge-enriched ultrathin MoS2 embedded yolk-shell TiO2 with boosted charge transfer for superior photocatalytic H2 evolution. Adv. Funct. Mater 2019:1901958. doi: 10.1002/adfm.201901958
Wiśniewska, M. (2010). Influences of polyacrylic acid adsorption and temperature on the alumina suspension stability. Powder Technology 198, 258–266. doi: 10.1016/j.powtec.2009.11.016
Yang, X., Qin, J., Li, Y., Zhang, R., and Tang, H. (2013). Graphene-spindle shaped TiO2 mesocrystal composites: facile synthesis and enhanced visible light photocatalytic performance. J. Hazard. Mater. 261, 342–350. doi: 10.1016/j.jhazmat.2013.07.044
Yu, H., Chen, W., Wang, X., Xu, Y., and Yc, J. (2016). Enhanced photocatalytic activity and photoinduced stability of Ag-based photocatalysts: the synergistic action of amorphous- Ti (IV) and Fe(III) cocatalysts. Appl. Catal. B 187, 163–170. doi: 10.1016/j.apcatb.2016.01.011
Yu, J., Hai, Y., and Cheng, B. (2011). Enhanced photocatalytic H2-production activity of TiO2 by Ni(OH)2 cluster modification. J. Phys. Chem. C 115, 4953–4958. doi: 10.1021/jp111562d
Yu, Y., Chen, Y., and Cheng, Z. (2015). Microwave-assisted synthesis of rod-like CuO/TiO2 for high-efficiency photocatalytic hydrogen evolution. Int. J. Hydrogen Energy 40, 15994–16000. doi: 10.1016/j.ijhydene.2015.09.115
Zhang, B., Wei, F., Wu, Q., Piao, L., Liu, M., and Jin, Z. (2015). Formation and evolution of the high-surface-energy facets of anatase TiO2. J. Phys. Chem. C 119, 6094–6100. doi: 10.1021/acs.jpcc.5b00087
Zhang, H., Zhu, Y. F., and Zhao, M. (2017). Interface charge transfer and enhanced visible light response of graphene/anatase TiO2 (110) systems with and without oxygen vacancy: a DFT+U calculation. Appl. Surf. Sci. 420, 105–109. doi: 10.1016/j.apsusc.2017.05.142
Zhang, J., Jiang, P., and Sun, P. (2018). Role of ammonium ions on the stability of TiO2 sol. J. Dispersion Sci. Technol. 40, 425–430. doi: 10.1080/01932691.2018.1472002
Zhang, J., Lang, P. R., Meyer, M., and Dhont, J. K. (2013). Synthesis and self-assembly of squarelike PbCrO4 nanoplatelets via Micelle-Mediated depletion attraction. Langmuir 29, 4679–4687. doi: 10.1021/la4001347
Zhao, C., Luo, H., Chen, F., Zhang, P., Yi, L., and You, K. (2014). A novel composite of TiO2 nanotubes with remarkably high efficiency for hydrogen production in solar-driven water splitting. Energy Environ. Sci. 7:1700. doi: 10.1039/c3ee43165g
Zhao, Z., Zhao, X., Yi, J., and Liu, Q. (2015). Effects of nonmetal doping on electronic structures and optical property of anatase TiO2 from First-Principles Calculations. Rare Metal Mater. Eng. 44, 1568–1574. doi: 10.1016/S1875-5372(15)30094-1
Keywords: hydrogen production, bio-glycerol, photoreforming, colloidal dispersion stability, Ag2O-TiO2 nanoparticles
Citation: Yang Z, Zhong W, Chen Y, Wang C, Mo S, Zhang J, Shu R and Song Q (2020) Improving Glycerol Photoreforming Hydrogen Production Over Ag2O-TiO2 Catalysts by Enhanced Colloidal Dispersion Stability. Front. Chem. 8:342. doi: 10.3389/fchem.2020.00342
Received: 25 January 2020; Accepted: 01 April 2020;
Published: 19 May 2020.
Edited by:
Guisheng Li, Shanghai Normal University, ChinaReviewed by:
Fan Dong, University of Electronic Science and Technology of China, ChinaXiaofei Yang, Nanjing Forestry University, China
Wenchao Wang, The University of Hong Kong, Hong Kong
Copyright © 2020 Yang, Zhong, Chen, Wang, Mo, Zhang, Shu and Song. This is an open-access article distributed under the terms of the Creative Commons Attribution License (CC BY). The use, distribution or reproduction in other forums is permitted, provided the original author(s) and the copyright owner(s) are credited and that the original publication in this journal is cited, in accordance with accepted academic practice. No use, distribution or reproduction is permitted which does not comply with these terms.
*Correspondence: Chao Wang, Y2hhb3dhbmdAZ2R1dC5lZHUuY24=; Qingbin Song, cWJzb25nQG11c3QuZWR1LmNu
†These authors have contributed equally to this work
 Zhi Yang1†
 Weilin Zhong
 Chao Wang
 Riyang Shu