 Wanting Chen1
 Hao Ding
- 1Beijing Key Laboratory of Materials Utilization of Nonmetallic Minerals and Solid Wastes, National Laboratory of Mineral Materials, School of Materials Science and Technology, China University of Geosciences, Beijing, China
- 2School of Materials Science and Technology, Shenyang University of Chemical Technology, Shenyang, China
Zirconium (Zr)-containing silica residue purification (ZSR-P) discharged from industrial production of ZrOCl2 was used as an adsorbent, and CdCl2 solution was used as the simulated wastewater containing cadmium ions (Cd2+). The properties and mechanisms of ZSR-P absorbing Cd2+ were studied. The results showed that ZSR-P had a good effect on the adsorption and removal of Cd2+ in water. The adsorption time, initial concentration of Cd2+, and pH of the solution had a significant effect on the adsorption behavior, whilst the pH value had the greatest effect amongst them. Under optimal conditions, the amount of Cd2+ adsorbed by ZSR-P was 43.1 mg/g. The isothermal adsorption conformed to the Langmuir adsorption model, and the adsorption kinetics conformed to the secondary adsorption rate model. In ZSR-P-Cd, Cd2+ was uniformly distributed on the surface of SiO2 particles and in the pores formed by the accumulation of particles. Adsorption of Cd2+ by ZSR-P was achieved through the reaction between Si-OH on the surface of SiO2 and Cd2+ hydroxyl compounds.
Introduction
In recent decades, especially in some developing countries, the world economy has been growing rapidly. The process of industrialization, agricultural economy, and urbanization have been speeding up, which results in heavy metal pollution in water due to mining, metal smelting process, electroplating, and pesticide and fertilizer abuse. The excess emissions of sewage have become more critical than ever (Sekhar et al., 2004; Srivastava and Majumder, 2008; Fu and Wang, 2011; Huang et al., 2014). Heavy metal ions are the main water pollutants. They are easy, biologically enriched and hard to degrade and have high toxicity and stable chemical property, so their damage is extremely serious (Sha et al., 2010). Cadmium ion (Cd2+) is one of the most hazardous ions among these heavy metal ions. It has a strong chemical activity in the environment and can easily migrate into the food chain and endanger human health (Solenkova et al., 2014; Venza et al., 2014). Chronic exposure to Cd could cause great damage to cardiovascular system, nervous system, and livers of mammals and humans and may lead to renal failure and ultimately death (Romero-Gonzalez et al., 2001). For this reason, international regulatory agencies have issued wastewater standards for the discharge of various heavy metal ions, including Cd, to limit their entry into surface water and municipal sewers. However, due to the high cost of compliance with pollution control legislation, some small businesses cannot afford it. Therefore, some efficient, convenient, and cost effective processes need to be found for removing heavy metal ions from wastewater.
Currently, there are many available methods to remove heavy metals from the environment (Basci et al., 2004; Dabrowski et al., 2004; Ho and Ofomaja, 2006; Janin et al., 2009; Soylak et al., 2010), including oxidation reduction, chemical precipitation, ion exchange, membrane separation and adsorption, etc. Amongst these methods, oxidation reduction and chemical precipitation are traditional methods which cause some issues such as the large amount of chemical reagents, a secondary source of pollution to the environment, and poor treatment of low-concentration wastewater. Although the methods of ion exchange and membrane separation are effective, the processing scale is small and both the investment cost and operation cost are high. In contrast, the adsorption method, which is highly efficient and simple, suitable for renewable use and is applicable for low-concentration wastewater, requires low investment. Therefore, it is an attractive method with a vital potential for further development. At present, in addition to some nonmetallic minerals, the adsorbents used to treat the wastewater containing heavy metal ions also include activated carbon, humic acid adsorbents, macromolecule materials, biomaterials, and industrial solid wastes (Wong et al., 2003; Sprynskyy et al., 2006; Fan et al., 2007; Veli and Alyüz, 2007; Mohammad-Khah and Ansari, 2009). Bhattacharyya and Gupta (2008), Zhu et al. (2009), and Hong-Ping et al. (2001) studied the adsorption behavior of Cd2+ by using montmorillonite and kaolinite with the adsorption method and found that the adsorption capacity of different minerals for Cd2+ was different. However, since the surface area of the mineral material is not high, the amount of adsorption is reduced; therefore, a large amount of the adsorbent is required for the operation, which may cause a certain proportion of resources to be wasted. Bayat (2002) used fly ash as an adsorbent to adsorb Zn2+ and Cd2+ in wastewater. Because of its porous honeycomb structure and large surface area in the internal structure, it has a good adsorption capacity for various metal ions in wastewater. The unmodified fly ash needs to be chemically modified in order to improve its adsorption performance as the small number of functional groups contained on the surface invisibly increases the processing cost of the adsorption process, thus complicating it. The adsorption capacity of the modified fly ash can be compared with that of activated carbon, and the cost is only one third of the activated carbon.
Recently, more attention has been paid to low-cost adsorbents that can be used to replace carbonaceous and mineral materials. Industrial solid waste has become a hot adsorbent material because of its dual advantages in cost and technology. Zirconium (Zr)-containing silica residue is the solid gelatinous waste during industrial acid reaction process in the production of zirconium oxychloride (ZrOCl2) from zirconite as the raw material. It is a loose-type gel. The main solid components of the gel are amorphous SiO2 and a small amount of unreacted zirconite, crystalline NaCl, and other impurities. The main liquid components are water, some dissolved substances such as hydrochloric acid (HCl), ZrOCl2, Na+, Cl−, and Fe3+, Zr4+, etc. In addition, the Zr-containing silica residue is purified to obtain Zr-containing silica residue purification (ZSR-P), which is mainly composed of amorphous SiO2. It is expected to be an excellent adsorbent for the treatment of heavy metal ions in the water by means of the surface charge properties of SiO2, the characteristics of functional groups, and the pore channels formed by the accumulation of particles. This work undoubtedly has a positive significance for recycling solid waste and reducing the cost of wastewater treatment. However, very few reports have been made on the adsorption behavior and the thermodynamics of heavy metal ions by ZSR-P.
In this work, the adsorption behavior of Cd2+ from an aqueous solution using ZSR-P was studied by a set of experiments at various conditions, including temperature, adsorption time, initial concentration of Cd2+, and initial pH value. In order to identify the possible mechanisms involved in Cd2+ binding by ZSR-P, some characterization methods such as Fourier transform infrared spectrometer (FTIR) and X-ray photoelectron spectroscopy (XPS) were performed along with the analysis.
Experiments
Raw Materials, Reagents, and Instruments
Zirconium-containing silica residue purification was obtained by purifying Zr-containing silica residue using a physical method. The Zr-containing silica residue raw material was produced by Henan Baililian Chemical Co. Ltd., Henan, China. The purification process involved the following steps. (1) The Zr-containing silica residue and water were added to a dispersing machine at a solid-liquid ratio of 7% to be crushed and mixed to form a uniform slurry. (2) The mixed slurry was pre-ground by an ultrafine grinder at 1,200 r/min. After 10 min, the alumina grinding balls were added to the mixed slurry at a ball ratio of 15:1. The grinding time was 35 min. (3) The mixed slurry containing the grinding balls was sieved to obtain the slurry. (4) The mixed slurry was separated by centrifugation, and each group of samples was centrifuged three times in order to obtain a gel of high purity containing amorphous silica. (5) The gel obtained after centrifugation was dried to finally obtain ZSR-P (Zhang et al., 2011). Additionally, ZSR-P had a specific surface area of 680.08 m2/g, and the pore diameter was 3.83 nm. The main chemical components before and after purification are shown in Table 1. The X-ray diffraction (XRD) analysis of ZSR-P is shown in Figure 1. It can be seen that a broad characteristic peak appears at a diffraction angle (2θ) of 20–25°, indicating that ZSR-P contains a large amount of amorphous phase components. In addition, there are no characteristic peaks of other impurities in the XRD pattern. So, combining with chemical analysis results (SiO2 content of 94.63%), it suggests that the main component of ZSR-P should be amorphous SiO2. Obviously, the properties of amorphous SiO2 determine the performance of ZSR-P.
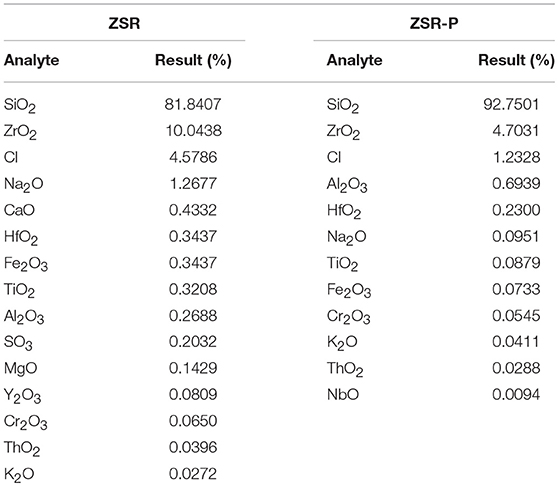
Table 1. Comparison XRF of ZSR-P before and after purification.
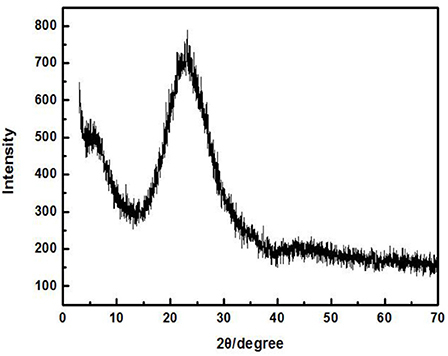
Figure 1. XRD of ZSR-P.
The CdCl2 solution was used as the simulated wastewater containing Cd2+. A certain amount of solid CdCl2 was weighed and added into distilled water, followed by stirring and dissolving to prepare the CdCl2 solution with different Cd2+ contents. An NaOH solution of 0.1 mol/L or HCl of 0.1 mol/L was used for pH adjustment. All chemicals used were of analytical reagent grade and were obtained from Beijing Chemical Works, China.
The main test equipments used are described as follows. The adsorption reaction of ZSR-P on heavy metal simulated wastewater under different conditions was carried out by using a SHZ-82 Thermostatic Bath Oscillator (Beijing Guohua Technology Group Ltd., Beijing, China). In addition, pHS-3C (Inesa Analytical Instrument Co., Ltd, Shanghai, China) was used to adjust the pH of the reaction solution. Prodigy Inductively Coupled Plasma Atomic Emission Spectrometry (Leeman Labs INC., USA) was used to test the residual heavy metal ion content after the adsorption reaction. The potential of the surface before and after the adsorption of heavy metals by the adsorbent was tested by using a Zetasizer Nano ZS Potentiometer (Malvern Panalytical, UK). The structural characteristics of mesoporous materials were characterized by a specific surface area and porosity analyzer (BET, Quadrasorb Si-MP, Quantachrome, USA). The characterization was mainly at liquid nitrogen temperature (77K), and the relative pressure was P/Po = 0~0.35. The particle size, surface morphology, and elemental content distribution of ZSR-P were determined by using a scanning electronic microscope combined with an energy dispersive X-ray detector (SEM-EDX, Hitachi High-Technologies Corporation, Tokyo, Japan). The particle size of the sample material and the comparative sample was observed using a FEI Tecnai G2F30 Field transmission electron microscope (TEM; acceleration voltage of 300 kV). The XRD analyses were conducted on a Rigaku D/max-rA (12 KW) X-ray powder diffractometer (XRD, D/MAX-2000, Rigaku Corporation,Tokyo, Japan) to determine the mineral composition operated with Cu Kαradiation at 40 kV and 100 mA and with a scanning speed of 0.5° (2θ)/min. A Fourier transform infrared spectroscope (FTIR, Perkin Elmer, Shanghai, China) was used to evaluate the distribution of functional groups on the surface between different materials. The XPS (Kratos Axis Ultra, UK) was used to characterize the surface composition and the combination state of the elements of ZSR-P before and after adsorption. Binding energies were referenced to the C1s peak at 284.8 eV. The oxide content and the elemental composition of the samples were analyzed by X-ray fluorescence (XRF) spectroscopy (S4-Explorer, Brukeraxs, Germany).
Adsorption Experiments
The 100 ml Cd2+ solution with a known concentration was weighed and transferred into a 250 mL Erlenmeyer flask, regulating the pH value and adding a certain amount of ZSR-P into the suspension. The suspension was shaken for a certain period of time and then centrifuged to obtain a precipitate and a supernatant liquid, which were the ZSR-P products adsorbing Cd2+ (ZSR-P-Cd) and the Cd2+ removed from the solution, respectively. The Cd2+ content in the supernatant can be measured to evaluate the adsorption effect.
Characterization and Evaluation Method
(1) Calculation of adsorption amount
Inductively coupled plasma atomic emission spectrometry (ICP-AES) was used to determine the Cd2+ concentration of the supernatant after adsorption. The adsorption amount of Cd2+ by ZSR-P was calculated by the following formula:
where C0 and C are the initial concentration and residual concentration of Cd2+ in the solution, respectively, which are also called the concentrations before and after adsorption by ZSR-P (mg/L); q is the adsorption capacity of Cd2+ adsorbed by ZSR-P (mg/g); V is the solution volume (L); and m is the quality of ZSR-P added (g).
(2) Surface hydroxyl test
An amount of 2 g of the sample to be tested was weighed and placed in a 200 mL beaker, adding 75 mL of NaCl solution, which had a quality score of 0.2; 25 mL of absolute ethanol was added to the mixture, and then the mixture was stirred evenly with a magnetic stirrer. After adjusting the pH of the solution to 4 by using 0.1 mol/L NaOH or 0.1 mol/L HCl, 0.1 mol/L NaOH was added to raise the pH of the solution to 9 slowly and the pH value was kept unchanged for 20 s. The volume of NaOH used was recorded, and the number of hydroxyl groups N per square nanometer of the sample was calculated according to the following formula:
where C is the concentration of the NaOH solution (mol/L); V is the volume (L) of the NaOH solution; NA is Avogadro's constant; S is the specific surface area of the sample (m2/g); and m is the mass of the sample (g).
Results and Discussion
Study on Adsorption Properties
Effect of Temperature
The Cd2+ solution with a concentration of 100 mg/L (actual measured value was 94.97 mg/L by ICP-AES) was adjusted to an initial pH of 8. Later, 3 g/L of ZSR-P was added and heated to a certain temperature; the thermal insulation oscillation time was 10 min. Figure 2 shows the effect of solution temperature on the adsorption of Cd2+ by ZSR-P. It can be seen that as the temperature rose from 25°C (room temperature) to 45°C, the amount of Cd2+ adsorbed by ZSR-P remained unchanged. When the temperature rose to 65°C, the adsorption amount increased slightly, indicating that temperature had little effect on the adsorption of Cd2+ by ZSR-P. According to the test results, considering the cost and operation conveniences for the treatment of the actual wastewater, the adsorption of the Cd2+ solution should be carried out at a temperature of 25°C, which is the normal temperature.
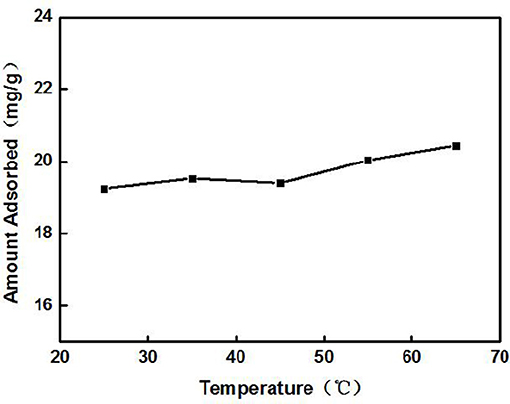
Figure 2. Effect of solution temperature on adsorption of Cd2+ by ZSR-P.
Adsorption Kinetics
The effect of the adsorption time on the adsorption of Cd2+ by ZSR-P is shown in Figure 3. The concentration of the Cd2+ solution used was 100 mg/L (actual measured value was 106.87 mg/L by ICP-AES), initial pH was 8, temperature was 25°C, and ZSR-P dosage was 3 g/L. It can be seen from Figure 3 that ZSR-P showed a fast adsorption behavior when the adsorption time was between 0 and 3 min. The adsorption time exceeded 3 min, and the adsorption capacity increased slowly and reached an equilibrium value at 7 min; the value was 22 mg/g. It showed that ZSR-P had a good effect on Cd2+ adsorption, and the effect of Cd2+ removal from the water was obvious.
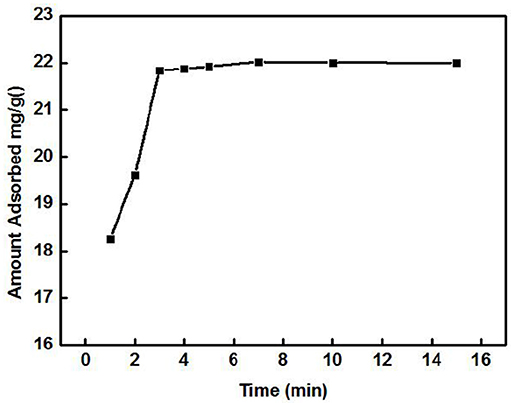
Figure 3. Effect of solution time on adsorption of Cd2+ by ZSR-P.
According to the adsorption data of Cd2+ by ZSR-P in Figure 3, fitting was performed according to Lagergren quasi-first-order kinetic model and quasi-second-order kinetic model. The equations of the two models are as follows:
In the formula, Qe is the quality (mg/g) of Cd2+ adsorbed by ZSR-P in solution during adsorption equilibrium; Qt is the quality (mg/g) of Cd2+ adsorbed by ZSR-P in solution at adsorption time t; and K1 and K2 are empirical factors.
Table 2 shows the parameters of the fitted kinetic equations. Figure 4 compares the fitting curves and the distribution of the experimental data points. According to the quasi-first-order kinetic model, the correlation coefficient R2 was only 0.035, indicating a low level of fitting degree. According to the quasi-second-order kinetic model, R2 was as high as 0.999, indicating a high fitting degree. Obviously, the adsorption of Cd2+ by ZSR-P conformed to the pseudo-second-order kinetic model, and it also indicated that this adsorption was the surface adsorption reaction control process (Ho et al., 2000).
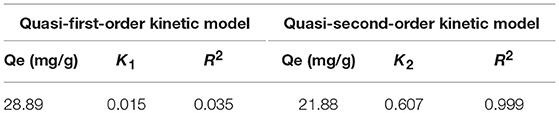
Table 2. ZSR-P adsorption kinetic parameters of Cd2+.
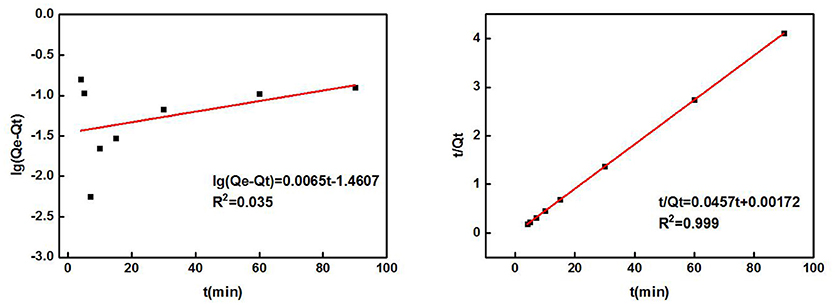
Figure 4. ZSR-P adsorption of Cd2+ kinetic equation fitting results. (A) Quasi-first-order kinetic model; (B) quasi-second-order kinetic model.
Equilibrium Isotherms
Figure 5 shows the relationship between Cd2+ residual concentration (equilibrium concentration) in the solution and Cd2+ adsorption amount under the conditions of solution temperature 25°C, pH 8, ZSR-P dosage 3g/L, and adsorption time 15 min (In order to ensure that the adsorption reaction of Cd2+ by ZSR-P was fully balanced, the adsorption time was increased to 15 min), which is called the adsorption isotherm. It can be seen that with the increase in the concentration of Cd2+, the adsorption amount of Cd2+ by ZSR-P continued to increase until the concentration of Cd2+ was more than 80 mg/L; the stable value of the adsorption amount was 28 mg/g. According to the data in Figure 5, the isotherm of Cd2+ adsorbed by ZSR-P can be model-regressed. The Langmuir and Freundlich adsorption isothermal models commonly used are as follows.
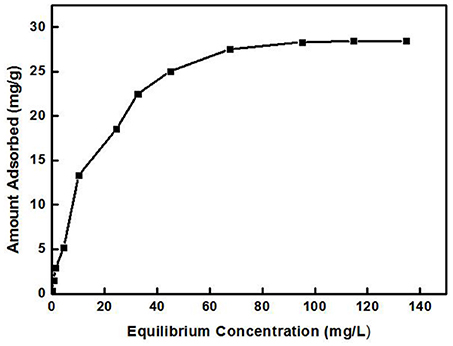
Figure 5. Adsorption isotherm equations of Cd2+.
Langmuir equation:
Freundlich equation:
In the formula, Ce is the equilibrium concentration (mg/L) of Cd2+ adsorbed by ZSR-P in solution, Qe is the adsorption amount (mg/g), Qm is the saturated adsorption amount (mg/g), and KL, Kf, and n are all empirical coefficients.
The data in Figure 5 were processed and model-fitted to obtain the adsorption isotherm equations described by the Langmuir and Freundlich models, as shown in Table 3 and Figure 6. It can be seen that the correlation constants R2 of the fitted Langmuir and Freundlich adsorption models were 0.994 and 0.85, respectively, indicating that the Langmuir model can better describe the adsorption isothermal behavior on Cd2+ by ZSR-P. The above results indicated that the adsorption of Cd2+ by ZSR-P was a monolayer adsorption, which indicated that the adsorption site was a single layer arrangement. The adsorption constant KL was 0.058 (the value was small), indicating that the adsorption sites have a strong affinity (Langmuir, 2015).
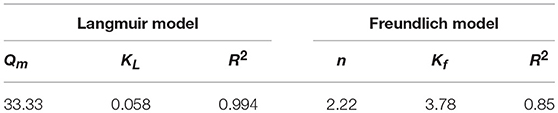
Table 3. Results of the fitting models of Cd2+ adsorption by ZSR-P.
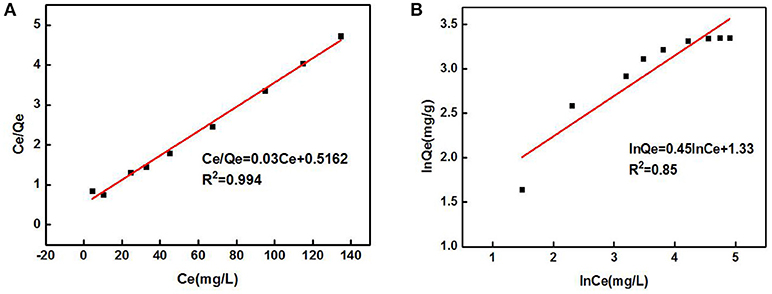
Figure 6. Adsorption isothermal models of Cd2+ adsorption by ZSR-P. (A) Langmuir model fitting results. (B) Freundlich model fitting results.
Effect of pH
A 3 g/L solution of ZSR-P was added to the Cd2+ solution with different pH values under the conditions of solution Cd2+ concentration of 100 mg/L (actual measured value was 108.39 mg/L by ICP-AES) and temperature of 25°C, and then it was oscillated for 10 min to perform adsorption. Figure 7 shows the effect of solution pH on adsorption. From Figure 7, it can be seen that the solution pH had a great influence on the adsorption of Cd2+ by ZSR-P. When pH value was less than 6, the adsorption amount of Cd2+ was less than 10 mg/g, indicating that when pH was low, the adsorption of Cd2+ by ZSR-P was poor. When the pH was higher than 7, the adsorption amount increased greatly, and the maximum value was reached at pH 9, which was 43.1 mg/g. It showed that increasing the pH of the Cd2+ solution can greatly enhance the adsorption of Cd2+ by ZSR-P. The main reason was that Cd2+ was prone to hydrolysis at a higher pH, while ZSR-P has a stronger affinity to Cd2+ hydrolysate than free Cd2+ (Bayat, 2002). Obviously, the pH value of the solution was crucial for the adsorption of Cd2+ by ZSR-P.
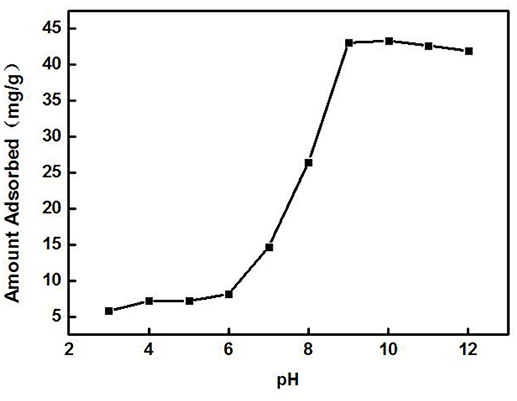
Figure 7. Effect of pH on the adsorption of Cd2+ by ZSR-P.
Adsorption Mechanism
Analysis of Adsorption Position
Figure 8 shows the SEM images and the surface distribution of the elements, such as O, Si, Zr, and Cd, of ZSR-P raw material and adsorbed Cd2+ product (ZSR-P-Cd). Table 4 shows the energy spectrum analysis (EDX) values of each element on the surface. It can be seen that there was no Cd in the ZSR-P raw material while there was a large amount of Cd in ZSR-P-Cd, which was consistent with the test results of the adsorption amount of Cd2+. The distribution area of Cd was consistent with the position of ZSR-P particles in the SEM images, indicating that Cd2+ was uniformly adsorbed on the surface of SiO2 particles in ZSR-P.
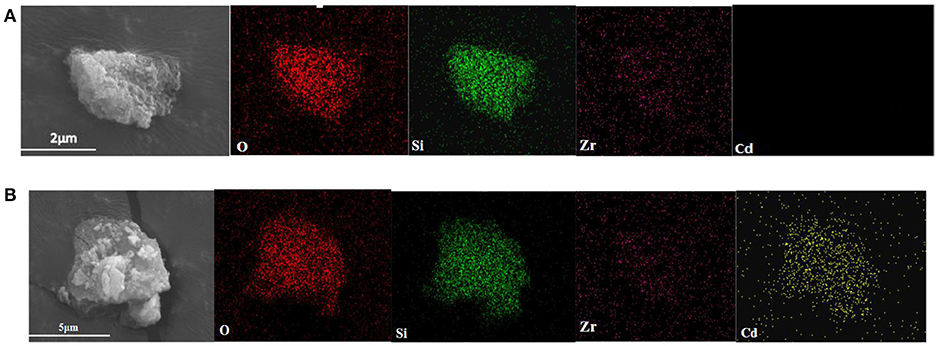
Figure 8. SEM images of ZSR-P (A) and adsorbed Cd2+ product (B).
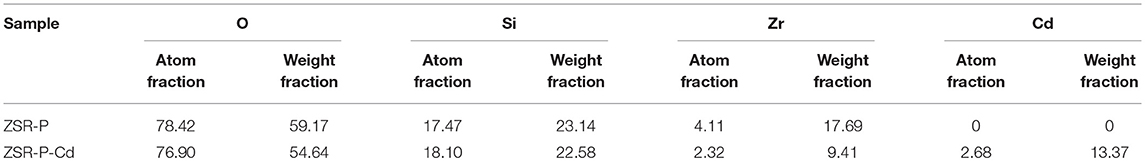
Table 4. Elemental analysis of ZSR-P and adsorbed Cd2+ product.
Figure 9 shows the TEM images of ZSR-P and ZSR-P-Cd. It can be clearly seen from Figure 9A that ZSR-P is mainly composed of aggregates formed by combining primary particles with sizes of about 20 nm. The small particles adhere to each other, and large aggregates of particles were formed. Due to the small particle size of the primary particles, ZSR-P had a large specific surface area, which was consistent with the test results. The large amount of hydroxyl groups present on the surface may provide a large number of adsorption and reaction binding sites for Cd2+. Figure 9B shows the TEM images of ZSR-P-Cd. It can be seen that the aggregated shape of ZSR-P-Cd particles was consistent with that of ZSR-P, indicating that no new substances were produced in the adsorption reaction. It was inferred that Cd2+ was adsorbed on the surface of ZSR-P and binding occurs between their interfaces.
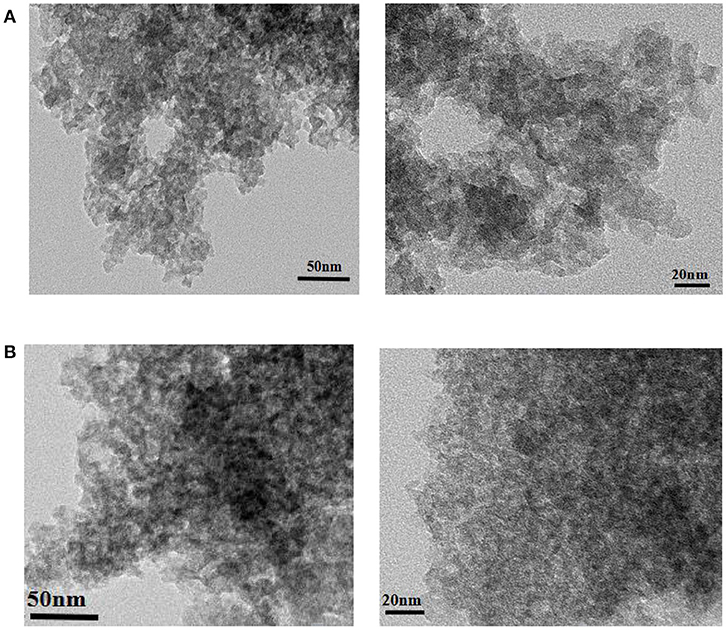
Figure 9. TEM images of ZSR-P (A) and adsorbed Cd2+ product (B).
Adsorbent Properties
Changes of Zeta Potential
The zeta potential is the difference between the shear plane of the solid-liquid relative movement and the potential inside the solution. The magnitude and the positive and negative values are determined by the solid surface properties, the Stern layer of the solid-liquid interface, the properties of the medium, and the concentration and nature of the ions in the solvation layer, which can reflect the difference in surface properties of ZSR-P before and after the adsorption of Cd2+ (Moreno-Castilla et al., 2000, 2001). Figure 10 shows the surface zeta potential values of ZSR-P raw materials and adsorbed Cd2+ products (ZSR-P-Cd) at different pH conditions. It can be seen that the zeta potential of the surface before and after the adsorption of Cd2+ by ZSR-P in the water system decreased with the increase in the pH value. When pH was less than 5.92, the zeta potential of the ZSR-P surface was positive, which indicated that the surface charge of ZSR-P was positive, and the counter ion of the Stem layer in the solution was negative. As the pH increased, the H+ ions in the solution gradually decreased, and the OH− ions in the Stern layer and the diffusion layer of the ZSR-P surface gradually increased. The zeta potential of the ZSR-P surface was negative, and the absolute value gradually increased. When ZSR-P adsorbed Cd2+, the point of zero charge of ZSR-P-Cd shifted to the right to pH 6.7, indicating that more cations were adsorbed on the surface of the particles. When the pH was less than 6.7, the surface charge value of ZSR-P-Cd was larger than that of ZSR-P under the same pH condition. When the pH was greater than 6.7, the absolute surface charge value of ZSR-P-Cd was smaller than that of ZSR-P at the same pH.
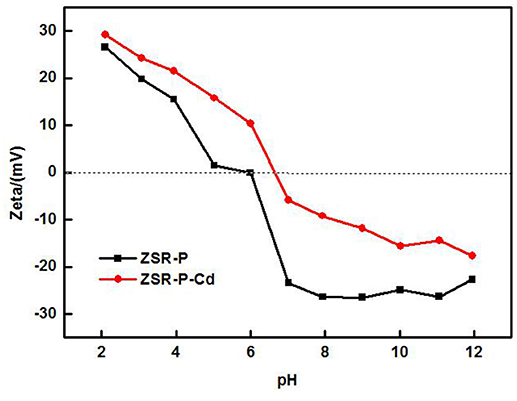
Figure 10. Zeta potential of ZSR-P and adsorbed Cd2+ product.
Using the surface hydroxyl test method in formula (2), the surface hydroxyl groups before and after adsorption of Cd2+ by ZSR-P were 1.39/nm2 and 1.06/nm2, respectively. Therefore, it can be seen from the changes in surface zeta potential and hydroxyl density that under the same pH condition, the number of hydroxyl groups on the surface of the product after adsorption of Cd2+ were much smaller than that on the surface of ZSR-P. This indicates that when Cd2+ was added to the solution, ZSR-P was surrounded by a large number of cations in the solution, and the large amount of hydroxyl groups on the surface became the main binding site of the adsorption reaction; therefore, Cd2+ ions occupy the surface of the ZSR-P particles and the pores formed by the accumulation of particles.
Fourier Transform Infrared (FTIR) Spectroscopy
Figure 11 is the infrared spectra of ZSR-P and its adsorbed Cd2+ product (ZSR-P-Cd). In the infrared spectrum of ZSR-P, the peak at 3,438 cm−1 was OH stretching of water; 1,637 cm−1 was OH deformation of water; the strong absorption band caused by Si-O stretching appeared at 1,090 cm−1 and 791 cm−1; the peak at 970 cm−1 belonged to Si-OH stretching; and the peak at 463 cm−1 was Si-O-Si deformation, reflecting the characteristics of amorphous SiO2 in ZSR-P. The peaks located at 1,637 cm and 3,438 cm were attributed by the abundant hydroxyl groups, which existing on the large specific surface area, absorb the surrounding water molecules. The comparison showed that the above absorption peaks appeared in the spectrum of ZSR-P adsorbed Cd2+ product except for the absorption peak at 970 cm−1, and the peaks at 1,090 cm−1 were slightly moved to 1,096 cm−1. It was speculated that the Si-O stretching (Da-Qing et al., 2000) formed on the surface of SiO2 hydrolyzed to form –SiOH (Bogdan et al., 1996) and combined with Cd2+ (d'espinose de la Caillerie et al., 1997). The disappearance of the Si-OH stretching at 970 cm−1 was presumed to be due to the dehydroxylation reaction on the surface of ZSR-P after the adsorption of Cd2+.
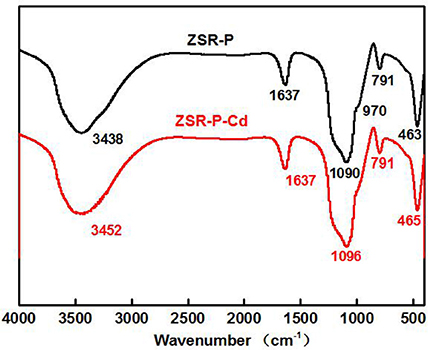
Figure 11. Infrared spectra of ZSR-P and ZSR-P-Cd.
XPS Analysis
X-ray photoelectron spectroscopy analysis of ZSR-P and ZSR-P-Cd was performed, and the results are shown in Figure 12. The results show that the peaks of O, Si, and Zr appeared in the ZSR-P spectrum, reflecting the characteristics of ZSR-P being a component of SiO2 and a small quantity of Zr-containing impurities. However, the peak of Cd3d5/2 appeared in the XPS of ZSR-P-Cd, and its binding energy was 405.72eV, indicating that Cd2+ was adsorbed on the surface of SiO2, which was consistent with the results of SEM. In addition, the binding energies of Si2s and Si2p in the XPS of ZSR-P were 153.64 and 102.83 eV, respectively. While their binding energies in the XPS of ZSR-P-Cd were 154.07 and 103.04 eV, respectively. The larger binding energy value indicated that the chemical environment of Si had changed after the adsorption of Cd2+, which was consistent with the results of Si-OH on the SiO2 surface and Cd2+ hydrate reactions.
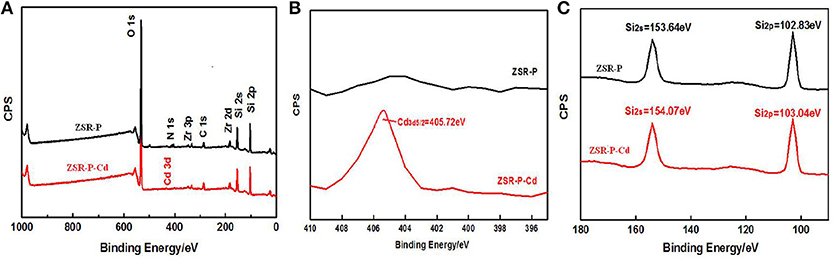
Figure 12. XPS of ZSR-P and ZSR-P-Cd. (A) The XPS full spectrum of ZSR-P and ZSR-P-Cd. (B) The Cd3d spectrum of ZSR-P-Cd. (C) The Si2s and Si2p spectra of ZSR-P and ZSR-P-Cd.
Adsorption Model
Based on the above analysis of the properties and mechanisms of ZSR-P adsorbing Cd2+, an interaction model reflecting this property, mechanism, and process was established and shown in Figure 13.
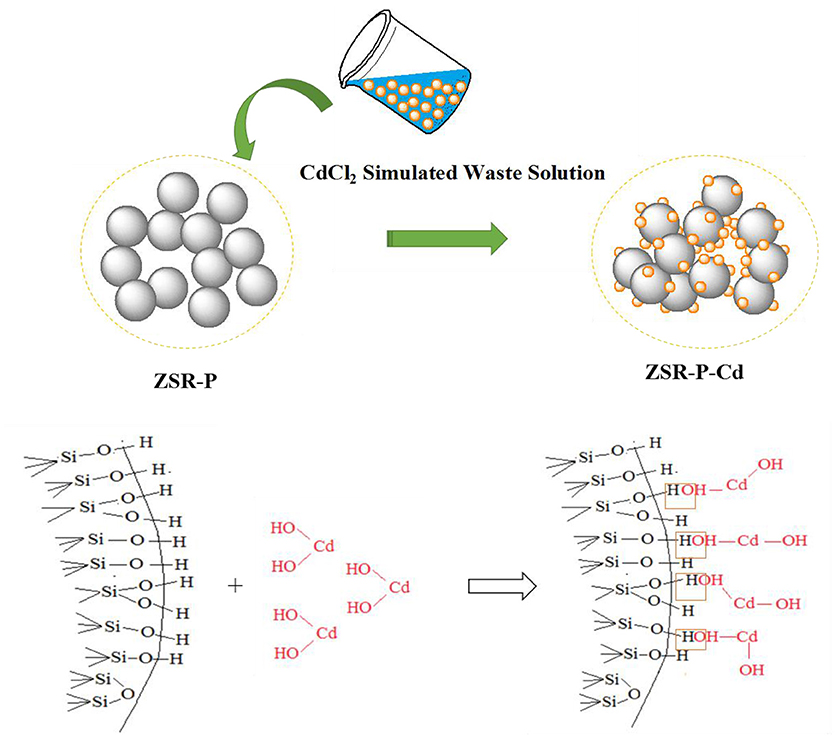
Figure 13. ZSR-P adsorption model of Cd2+.
Conclusions
(1) Zirconium-containing silica residue purification is mainly composed of aggregates of amorphous SiO2 nanoparticles. It has an excellent adsorption and removal effect on Cd2+ in water. The pH value of the solution, Cd2+ concentration, and adsorption time have a significant effect on the removal effect. In addition, ZSR-P, at a dosage of 3 mg/L, was added to an aqueous solution, which had a Cd2+ concentration of 100 mg/L and pH 9, and then the mixture was shaken for 10 min; subsequently, the adsorption reached an equilibrium. The adsorption amount of Cd2+ by ZSR-P is 43.1 mg/g.
(2) The isothermal adsorption of Cd2+ by ZSR-P is in accordance with the Langmuir adsorption model, consistent with the adsorption characteristics of general microporous materials. The adsorption kinetics equation of ZSR-P for Cd2+ conforms to the second-order model for adsorption rate.
(3) The removal of Cd2+ in aqueous solution by ZSR-P is mainly based on the adsorption between them. In addition, Cd2+ is uniformly distributed on the surface of SiO2 particles and in the pores formed by the accumulation of particles in ZSR-P-Cd. Adsorption between SiO2 and Cd2+ is achieved by the reaction between Si-OH on the surface of SiO2 and Cd2+ hydroxyl compounds.
Author Contributions
WC, HZ, HD, and SS conceived and designed the experiments. WC, HZ, and YL performed the experiments. WC and SS analyzed the data. HZ, YL, and SS contributed reagents. WC wrote the manuscript. YL retouched the document.
Conflict of Interest Statement
The authors declare that the research was conducted in the absence of any commercial or financial relationships that could be construed as a potential conflict of interest.
Acknowledgments
The authors are thankful to the School of Materials Science and Technology, China University of Geoscience (Beijing), China for providing laboratory facilities.
References
Basci, N., Kocadagistan, E., and Kocadagistan, B. (2004). Biosorption of copper (ii) from aqueous solutions by wheat shell. Desalination 164, 135–140. doi: 10.1016/S0011-9164(04)00172-9
Bayat, B. (2002). Combined removal of zinc (ii) and cadmium (ii) from aqueous solutions by adsorption onto high-calcium turkish fly ash. Water. Air. Soil. Poll. 136, 69–92. doi: 10.1023/A:1015296032528
Bhattacharyya, K. G., and Gupta, S. S. (2008). Adsorption of a few heavy metals on natural and modified kaolinite and montmorillonite: a review. Adv. Colloid. Interfac. 140, 114–131. doi: 10.1016/j.cis.2007.12.008
Bogdan, A., Kulmala, M., Gorbunov, B., and Kruppa, A. (1996). Nmr study of phase transitions in pure water and binary H2O/HNO3 films adsorbed on surface of pyrogenic silica. J. Colloid. Interf. Sci. 177, 79–87. doi: 10.1006/jcis.1996.0008
Dabrowski, A., Hubicki, Z., Podkościelny, P., and Robens, E. (2004). Selective removal of the heavy metal ions from waters and industrial wastewaters by ion-exchange method. Chemosphere 56, 91–106. doi: 10.1016/j.chemosphere.2004.03.006
Da-Qing, W. U., Diao, G. Y., Wei, J. F., and Yuan, P. (2000). Surface function groups and surface reactions of minerals. Geol. J. China Univ. 6, 225–226. doi: 10.16108/j.issn1006-7493.2000.02.019
d'espinose de la Caillerie, J. B., Aimeur, M. R., Kortobi, Y. E., and Legrand, A. P. (1997). Water adsorption on pyrogenic silica followed by 1h mas nmr. J. Colloid. Interf. Sci. 194, 434–439. doi: 10.1006/jcis.1997.5126
Fan, Z., Yu, B., Yue, Z., Wang, T., Xian, W., Liu, Z., et al. (2007). Preparation of porous chitosan gel beads for copper(ii) ion adsorption. J. Hazard. Mater. 147, 67–73. doi: 10.1016/j.jhazmat.2006.12.045
Fu, F., and Wang, Q. (2011). Removal of heavy metal ions from wastewaters: a review. J. Environ. Manage. 92, 407–418. doi: 10.1016/j.jenvman.2010.11.011
Ho, Y. S., Ng, J. C. Y., and Mckay, G. (2000). Kinetics of pollutant sorption by biosorbents: review. Separ. Purif. Method. 29, 189–232. doi: 10.1081/SPM-100100009
Ho, Y. S., and Ofomaja, A. E. (2006). Kinetic studies of copper ion adsorption on palm kernel fibre. J. Hazard. Mater. 137, 1796–1802. doi: 10.1016/j.jhazmat.2006.05.023
Hong-Ping, H. E., Guo, J. G., Zhu, J. X., and Yang, D. (2001). An experimental study of adsorption capacity of montmorillonite, kaolinite and illite for heavy metals. Acta Petrologica Et Mineralogica. 20, 573–578.
Huang, J., Lei, P., Zeng, G., Li, X., Zhao, Y., Liu, L., et al. (2014). Evaluation of micellar enhanced ultrafiltration for removing methylene blue and cadmium ion simultaneously with mixed surfactants. Sep. Purif. Technol. 125, 83–89. doi: 10.1016/j.seppur.2014.01.020
Janin, A., Zaviska, F., Drogui, P., Blais, J. F., and Mercier, G. (2009). Selective recovery of metals in leachate from chromated copper arsenate treated wastes using electrochemical technology and chemical precipitation. Hydrometallurgy 96, 318–326. doi: 10.1016/j.hydromet.2008.12.002
Langmuir, I. (2015). The adsorption of gases on plane surfaces of glass, mica and platinum. J. Chem. Phys. 40, 1361–1403. doi: 10.1021/ja02242a004
Mohammad-Khah, A., and Ansari, R. (2009). Activated charcoal: preparation, characterization and applications: a review article. Int. J. Chemtech. Res. 1, 859–864.
Moreno-Castilla, C., Carrasco-Mari, N. F., Parejo-Pérez, C., and Ramón, M. V. L. (2001). Dehydration of methanol to dimethyl ether catalyzed by oxidized activated carbons with varying surface acidic character. Carbon. 39, 869–875. doi: 10.1016/S0008-6223(00)00192-5
Moreno-Castilla, C., López-Ramón, M. V., and Carrasco-MariN, F. (2000). Changes in surface chemistry of activated carbons by wet oxidation. Carbon 38, 1995–2001. doi: 10.1016/S0008-6223(00)00048-8
Romero-Gonzalez, M. E., Williams, C. J., and Gardiner, P. H. (2001). Study of the mechanisms of cadmium biosorption by dealginated seaweed waste. Environ. Sci. Technol. 35, 3025–3030. doi: 10.1021/es991133r
Sekhar, K. C., Chary, N. S., Kamala, C. T., Suman Raj, D. S., and Sreenivasa Rao, A. (2004). Fractionation studies and bioaccumulation of sediment-bound heavy metals in Kolleru lake by edible fish. Environ. Int. 29, 1001–1008. doi: 10.1016/S0160-4120(03)00094-1
Sha, L., Guo, X. Y., Feng, N. C., and Tian, Q. H. (2010). Effective removal of heavy metals from aqueous solutions by orange peel xanthate. T. Nonferr. Metal. So. C. 20, 187–191. doi: 10.1016/S1003-6326(10)60037-4
Solenkova, N. V., Newman, J. D., Berger, J. S., Thurston, G., Hochman, J. S., and Lamas, G. A. (2014). Metal pollutants and cardiovascular disease: mechanisms and consequences of exposure. Am. Heart. J. 168, 812–822. doi: 10.1016/j.ahj.2014.07.007
Soylak, M., Unsal, Y. E., Kizil, N., and Aydin, A. (2010). Utilization of membrane filtration for preconcentration and determination of cu(ii) and pb(ii) in food, water and geological samples by atomic absorption spectrometry. Food. Chem. Toxicol. 48, 517–521. doi: 10.1016/j.fct.2009.11.005
Sprynskyy, M., Buszewski, B., Terzyk, A. P., and Namieśnik, J. (2006). Study of the selection mechanism of heavy metal (Pb2+, Cu2+, Ni2+, and Cd2+) adsorption on clinoptilolite. J. Colloid. Interf. Sci. 304, 21–28. doi: 10.1016/j.jcis.2006.07.068
Srivastava, N. K., and Majumder, C. B. (2008). Novel biofiltration methods for the treatment of heavy metals from industrial wastewater. J. Hazard. Mater. 151, 1–8. doi: 10.1016/j.jhazmat.2007.09.101
Veli, S., and Alyüz, B. (2007). Adsorption of copper and zinc from aqueous solutions by using natural clay. J. Hazard. Mater. 149, 226–233. doi: 10.1016/j.jhazmat.2007.04.109
Venza, M., Visalli, M., Biondo, C., Oteri, R., Agliano, F., Morabito, S., et al. (2014). Epigenetic effects of cadmium in cancer: focus on melanoma. Curr. Genom. 15, 420–435. doi: 10.2174/138920291506150106145932
Wong, K. K., Lee, C. K., Low, K. S., and Haron, M. J. (2003). Removal of Cu and Pb by tartaric acid modified rice husk from aqueous solutions. Chemosphere 50, 23–28. doi: 10.1016/S0045-6535(02)00598-2
Zhang, X. J., Ding, H., and Wang, B. K. (2011). Recycling and characterisation of amorphous silica from zr-containing silica residue. Adv. Mater. Res. 194–196, 2109–2114. doi: 10.4028/www.scientific.net/AMR.194-196.2109
Keywords: Zr-containing silica residue purification, adsorption, Cd2+, kinetic model, isothermal models
Citation: Chen W, Zhang H, Liang Y, Ding H and Sun S (2018) Adsorption Properties and Mechanism of Cd2+ in Water by Zr-containing Silica Residue Purification. Front. Chem. 6:556. doi: 10.3389/fchem.2018.00556
Received: 27 July 2018; Accepted: 29 October 2018;
Published: 23 November 2018.
Edited by:
Wenbo Wang, Lanzhou Institute of Chemical Physics (CAS), ChinaReviewed by:
Jianxi Zhu, Guangzhou Institute of Geochemistry (CAS), ChinaShiyong Sun, Southwest University of Science and Technology, China
Copyright © 2018 Chen, Zhang, Liang, Ding and Sun. This is an open-access article distributed under the terms of the Creative Commons Attribution License (CC BY). The use, distribution or reproduction in other forums is permitted, provided the original author(s) and the copyright owner(s) are credited and that the original publication in this journal is cited, in accordance with accepted academic practice. No use, distribution or reproduction is permitted which does not comply with these terms.
*Correspondence: Hao Ding, dinghao113@126.com