- Advanced Catalysis and Green Manufacturing Collaborative Innovation Center, Changzhou University, Changzhou, China
The Er3+:CeO2/ATP (attapulgite) nanocomposites were prepared by a facile precipitation method. The samples were characterized by various measurements. XRD and TEM showed that Er3+:CeO2 nanoparticles were well-crystallized and loaded on the surface of ATP. The visible light was converted into ultraviolet light by Er3+:CeO2 as evidenced by upconversion photoluminance (PL) analysis. The mass ratio of Er3+:CeO2 to ATP on the desulfurization efficiency was investigated. Results showed that the desulfurization rate reached 87% under 4 h visible light irradiation when the mass ratio was 4:10. The mechanism was put forward as follows. Er3+:CeO2 and ATP formed Z-scheme heterostructure intermediated by oxygen vacancy, leading to the enhanced separation of photogenerated charges and preservation of high oxidation-reduction potential, both of which favored for the generation of radicals to oxidize sulfur species.
Introduction
Massive use of fuel has given rise to serious environmental problem including acid rain and atmospheric haze, since the combustion of sulfur compounds in fuels leads to the emission of pernicious SOx. Therefore, it is imperative to develop new desulfurization technology to satisfy fuel purification (Liu et al., 2017; Zhang et al., 2018). The conventional hydrodesulfurization (HDS) has been extensively used in removing sulfur compound in fuel, which requires high temperature, pressure and expensive hydrogen (Wang et al., 2016; Zeng et al., 2017). Owing to the drawbacks of HDS for removing sulfur compound, many alternative strategies have been developed, including extractive desulfurization (Raj et al., 2017), oxidative desulfurization (Khodadadi Dizaji et al., 2018), biodesulfurization (Agarwal et al., 2016) and adsorption desulfurization (Yang et al., 2018). Among these strategies, oxidative desulfurization is considered as one of the promising strategy for deep desulfurization due to its cheap and efficient features. Particularly, photocatalytic oxidative desulfurization is deemed as a potential candidate. In our previous work, we have prepared attapulgite-CeO2/MoS2, CeO2/attapulgite/g-C3N4 and BiP1−xVxO4/attapulgite nanocomposites and found that the photocatalytic oxidative desulfurization rate reached as high as more than 90% under the irradiation of visible light (Li et al., 2016, 2017, 2018). As a natural clay material, attapulgite (ATP) has large specific surface area, superior adsorption performance and unique pore structure, which is widely used in catalyst support (Zhang et al., 2016b). Interestingly, the incorporation of Fe2O3 endows ATP with semiconductor property to some extent. Zhang et al. (Zhang et al., 2013, 2016a) sensitized ATP by taking advantage of eosine Y and CdS to generate hydrogen from water. Li et al. (Ma et al., 2018) prepared CQDs/ATP nanocomposites with visible light response. However, ATP can only be stimulated by ultraviolet light which is accounted for 5% in solar light due to its wide band gap (Balaji et al., 2017).
The upconversion luminescence materials have attracted great attentions since they can absorb and upconvert long wave light with low-energy to short wave light with high-energy (Feng et al., 2013). In the general composition of upconversion luminescence material, the rare earth element has a rich 4f energy level enabling the electrons jump easily from high to low energy level. Among the rare earth family, Er3+ has abundant energy levels and higher upconversion luminescence efficiency, making it as a excellent candidate for the conversion from visible to UV light (Pickering et al., 2017). The Er3+ can be easily doped into the crystal lattice of CeO2 along with the production of oxygen vacancy since the ion radius of Ce4+ is very close to Er3+ (Wu et al., 2014). Meanwhile, CeO2 has high chemical stability and low phonon energy, making it suitable as matrix materials in upconversion. Han et al prepared upconversion Er, Yb-CeO2 hollow spheres for improving the efficiency of dye-sensitized solar cells (Han et al., 2017). However, rare report has been put on the heterostructure constructed by rare earth doped upconversion luminescence materials (Bhethanabotla et al., 2016). Moreover, the decline of oxidation-reduction ability in traditional type heterostructure is non-negligible. It is worth noting that Z-type heterostructure causes the annihilation of photo-generated charges with lower reduction and oxidation potential, therefore leading to the preservation of high redox potential for the heterostructure (Šutka et al., 2018). Intriguingly, the self-generated oxygen vacancy has been proposed as mediator in the indirect Z-scheme with the absence of noble metals, such as Au, Ag, etc. For instance, Ding et al. (Ding et al., 2016) prepared BiO1−xBr/Bi2O2CO3 in which the oxygen vacancy of BiO1−xBr acted as the medium of transmission for electrons and the recombination center of photogenerated electrons and holes.
In this work, the Er doped CeO2 upconversion luminescence oxide was immobilized on ATP. The doping fraction of Er3+ was adjusted to achieve the strongest emission of ultraviolet light to stimulate ATP. Meanwhile, CeO2:Er and ATP formed Z-type heterostructure intermediated by oxygen vacancy, which effectively preserved redox potential so as to improve the photocatalytic desulfurization activity of Er3+:CeO2/ATP.
Experimental Section
Materials
ATP powders were obtained from Xuyi, China. Ce(NO3)3·6H2O, Er(NO3)3·5H2O, hexamine (C2H12N4, HMT), octane (C8H18), dibenzothiophene (C12H8S) and acetonitrile (C2H3N) were purchased from Sionpharm Chemical Reagent Co., Ltd. All reagents were analytical grade without further purification.
Synthesis of Er3+:CeO2/ATP
Er3+:CeO2/ATP composites were synthesized via a one-step precipitation method. Typically, adequate amount of Ce(NO3)3·6H2O, Er(NO3)3·5H2O and 1 g ATP were dissolved in 100 mL deionized water and mixed together, followed by adding excess HMT (molar ratio of HMT to Ce(NO3)3 was 5:1). The molar fraction of Er (Er/Ce+Er) was adjusted from 0.5 to 2.5%, and the mass ratio of Er3+:CeO2 to ATP was adjusted from 1:10 to 5:10. Then the mixture was heated in a water bath at 80°C for 2 h. After cooled down to room temperature, the precipitate was washed with deionized water for three times. Subsequently, the obtained solid was dried in vacuum at 80°C for 10 h, and finally calcined at 300°C for 2 h.
Materials Characterization
The powder X-ray diffraction (XRD) was performed with a D/max 2500PC diffractometer equipped with a Cu-Kα radiation (λ = 1.5406 Å) at a scanning speed of 6° min−1 from 5 to 80°. The morphology was investigated with a JEM-2100 transmission election microscope (TEM) operating at 200 kV. Raman spectra were collected with a Renishaw (UK) spectrometer with an Ar ion laser of 514 nm excitation. The ultraviolet visible (UV–Vis) spectra were acquired using a UV-2500 Shimadzu UV–Vis spectrophotometer. The photoluminescence (PL) spectra were collected with the PerkinElmer LS45 at room temperature. The X-ray photoelectron spectroscopy (XPS) was performed with a PHI 5300 equipped with Kα in the condition of 284.6 eV for C 1s.
Photocatalytic Oxidative Desulfurization
The photocatalytic desulfurization performance of Er3+:CeO2/ATP was carried out by degradating the model gasoline using a photocatalytic reaction apparatus (GHX-2) which was equipped with a 300 W xenon lamp. 0.4 g DBT was dissolved into 500 mL octane to acquire the model gasoline with sulfur compounds of 200 ppm. Then the model gasoline and catalysts were added into the photocatalytic reactor and kept 30 min with magnetic stirring to ensure adsorption equilibrium. Subsequently, simulated solar light using UV-cut off was irradiated during the reaction with the irradiation intensity of 30 W/cm2. The samples were collected twice an hour to satisfy the extraction process. The rest of sulfur content was measured by a sulfur determination device (THA2000S), and the desulfurization rate D was calculated based on the following formula:
where C0 is the initial sulfur content of the model gasoline and C is the final sulfur content.
Results and Discussions
XRD Analysis
Figure 1 shows the XRD patterns of ATP, CeO2/ATP and Er3+:CeO2/ATP. In Figure 1A the characteristic peaks at 8.21, 19.75, and 26.54°Correspond to the (110), (040), and (400) plane of pure ATP (Zhao et al., 2016). The characteristics at 28.55, 33.07, 47.48, and 56.34°Correspond to the (111), (200), (220), and (311) plane of CeO2 (JCPDS 43-1002). However, there is no characteristic peak of Er in Er3+:CeO2/ATP composites, which may be due to the small doping amount of Er. In Figure 1B, the characteristic peak at 28.55° shows slight shift to higher Bragg angle, implying that the Er3+ dopant results in the lattice contraction due to the fact that Er3+ (0.88 Å) replaced the Ce4+ (0.92 Å), subsequently leading to the lattice distortion and formation of oxygen vacancies (Li et al., 2012). Figure 1C shows the XRD patterns of different mass ratio of Er3+:CeO2 to ATP. With the increase of mass ratio, the characteristic peak intensity of ATP is gradually weakened whereas the intensity of CeO2 is strengthened without any change of peak position, suggesting the immobilization of Er3+:CeO2 on ATP.
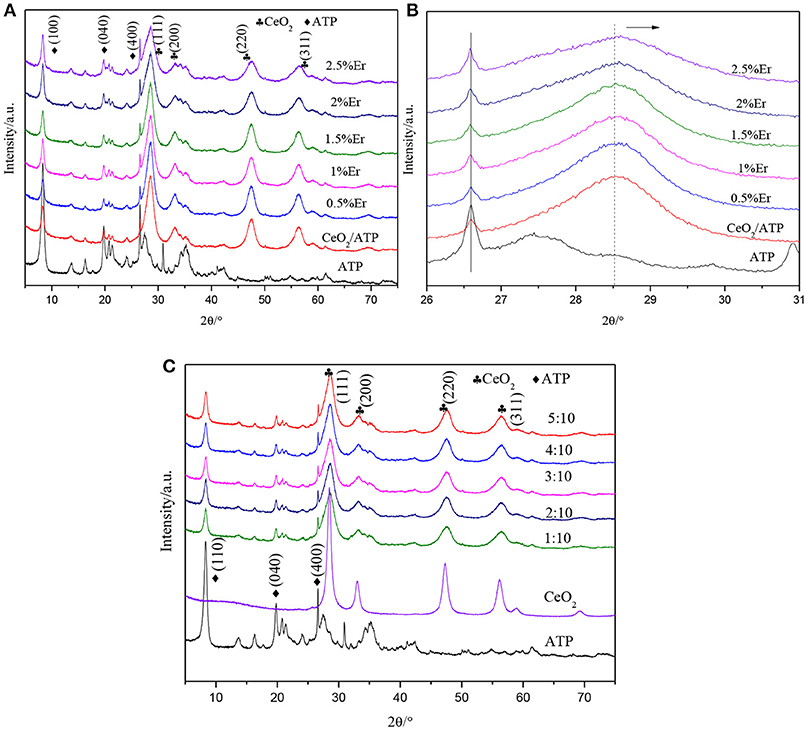
Figure 1. XRD patterns of ATP, CeO2/ATP and Er3+:CeO2/ATP with various molar fractions of Er doping (A), the enlarged diffraction peak from 26 to 31° (B), and different mass ratio of Er3+:CeO2 to ATP (C).
Raman Analysis
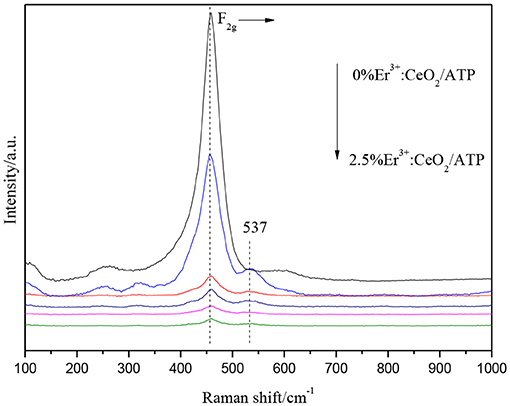
Figure 2 shows the Raman patterns of CeO2/ATP and Er3+:CeO2/ATP. The peaks appearing in 454–459 cm−1 represent the F2g vibration mode for cubic CeO2 (Kumar and Kumar, 2017). Meanwhile, the peak intensity of F2g is gradually decreased and the peak position is shifted to high wavenumber with the increase of Er, implying that Er is doped into CeO2 lattice. The peaks located at 537 cm−1 can be attributed to the formation of oxygen vacancies (Mamontov et al., 2016), due to the fact that Er3+ replaces Ce4+ resulting in the transformation from Ce4+ to Ce3+, subsequently oxygen vacancies are produced which is consistent with the results of XRD.
Optical Analysis
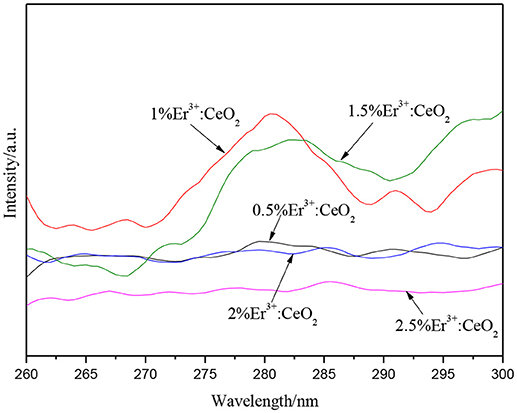
Figure 3 demonstrates the upconversion PL spectra of Er3+:CeO2 with different Er molar fraction. The upconversion luminescence was tested by the visible light of 488 nm as excitation light, while ultraviolet light was emitted near 281 nm, corresponding to the energy transfer from the 2D5/2 excited state to the 4I15/2 ground state. The upconversion luminescence intensity of Er3+:CeO2 is gradually increased below 1%, which reach strongest when the doping fraction is 1%. Afterwards, the upconversion luminescence intensity is obviously decreased when doping fraction is more than 1% due to the fact that the excessive doping of Er3+ shortens the distance and enhances the interaction among Er3+ ions, leading to the concentration quenching of the upconversion luminescence (Ramasamy et al., 2013). Therefore, the upconversion luminescence intensity is gradually decreased, and the doping fraction is optimized to be 1%.
TEM Analysis
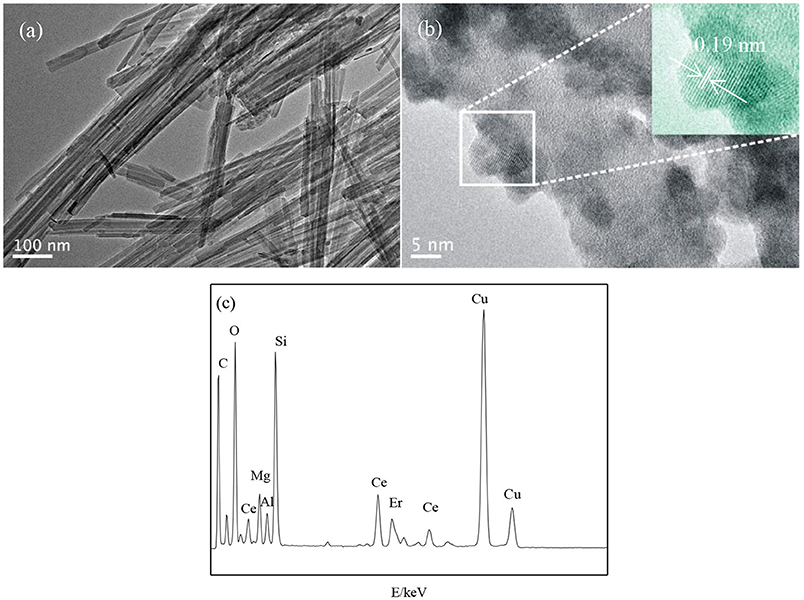
Figure 4 shows the TEM results of ATP and Er3+:CeO2/ATP. Figure 4a shows the pure ATP with a rod like structure having average diameter of 20–30 nm. Figure 4b shows the HRTEM image of 1% Er3+:CeO2/ATP (4:10), and apparent nanoparticles are loaded on the surface of ATP. The inset lattice distance of CeO2 is 0.19 nm corresponding to the (220) plane of CeO2. Energy-dispersive spectroscopy (EDS) in Figure 4c displays Ce, Er, Si, Fe, Mg, and Al elements, in which Si, Fe, Mg and Al are derived from ATP.
UV–Vis Analysis
Figure 5A shows the UV–Vis image of CeO2, ATP, and Er doping fraction for 1%. CeO2 has a certain response to visible light, while the absorption edge of CeO2 appears slightly red shift after doping of Er, which due to the fact that Er doping may change the band gap of the CeO2. Figure 5B shows the plots of transformed Kubelka-Munk function vs. light energy of CeO2 and 1% Er3+:CeO2. The band gap of CeO2 and 1% Er3+:CeO2 is estimated to be 2.53 and 2.51 eV, respectively. As shown in Figure 5C, the band gap of ATP is estimated to be 3.75 eV, indicating ATP has ultraviolet response ability. It is reported that a semiconductor absorbs energy which is equal or larger than its band gap to produce photogenerated e− and h+ (Zhuo et al., 2012). According to the results in Figure 3, the upconversion wavelength of 1% Er3+:CeO2 locates at 281 nm corresponding to the band gap of 4.41 eV larger than the band gap of ATP with 3.75 eV. Therefore, ATP can be excited by the upconversion emission of 1% Er3+:CeO2. Figure 5D shows the UV–Vis pattern of ATP, CeO2/ATP and 1%Er3+:CeO2/ATP. Compared with ATP, the absorption edge of CeO2/ATP and 1% Er3+:CeO2/ATP shows obviously red shift, which may favor for the photocatalytic performance.
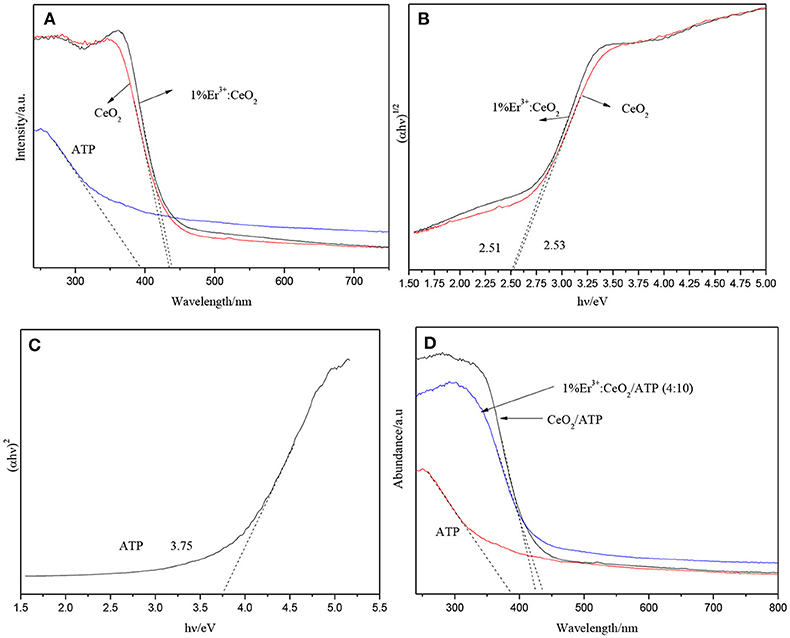
Figure 5. UV–Vis patterns of ATP, CeO2, and 1%Er3+:CeO2 (A), the plots of transformed Kubelka-Munk function vs. light energy of CeO2, and 1%Er3+:CeO2 (B), the plots of transformed Kubelka-Munk function vs. light energy of ATP (C), and the UV–Vis patterns of ATP, CeO2, and 1%Er3+:CeO2 (4:10) (D).
PL Analysis
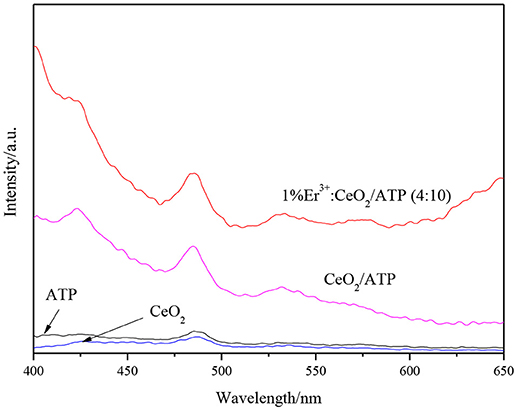
In order to investigate the recombination effect of photogenerated electrons and holes, PL analysis is performed under excitation of 300 nm. Figure 6 shows the PL patterns of ATP, CeO2, CeO2/ATP and 1% Er3+:CeO2/ATP (4:10). The emission peak of ATP is displayed, indicating that the photogenerated electrons and holes were recombined due to the fact that few Fe2O3 is stimulated to produce the photogenerated electrons and holes. Compared with pure ATP and CeO2, the intensity of the emission peak of CeO2/ATP and 1%Er3+:CeO2/ATP (4:10) is significantly increased. In general, the intensity of the emission peak of PL is inversely proportional to the separation efficiency of the photogenerated charges. Obviously, the phenomenon described in the Figure 6 violates the traditional law, which may be due to the unique Z-type heterostructure formed by Er3+:CeO2 and ATP.
XPS Analysis
Figure 7 shows the XPS patterns of ATP and 1%Er3+:CeO2/ATP (4:10). Figure 7A is the survey scan indicating the existence of Mg, Fe, Si, Al, Ce, Er, and C elements where Mg, Fe, Si, and Al are originated from ATP, Ce and Er are originated from Er3+:CeO2. As shown in Figure 7B, the characteristic peaks of 883.2, 898.6, and 907.9 eV are ascribed to Ce3+ while the characteristic peaks of 889.5, 901.3, and 917.1 eV are ascribed to Ce4+, which is close to our previous result with respect to Ce 3d in CeO2/ATP, (Li et al., 2017) indicating that the surface of CeO2 contains oxygen vacancy. (Peng et al., 2017) The characteristic peak position of Si 2p in 1% Er3+:CeO2/ATP (4:10) is lower than that of ATP shown in Figure 7C, due to the fact that the Si-O-Si bond may be replaced by Si-O-Ce bond since the electronegativity of Ce is less than that of Si.
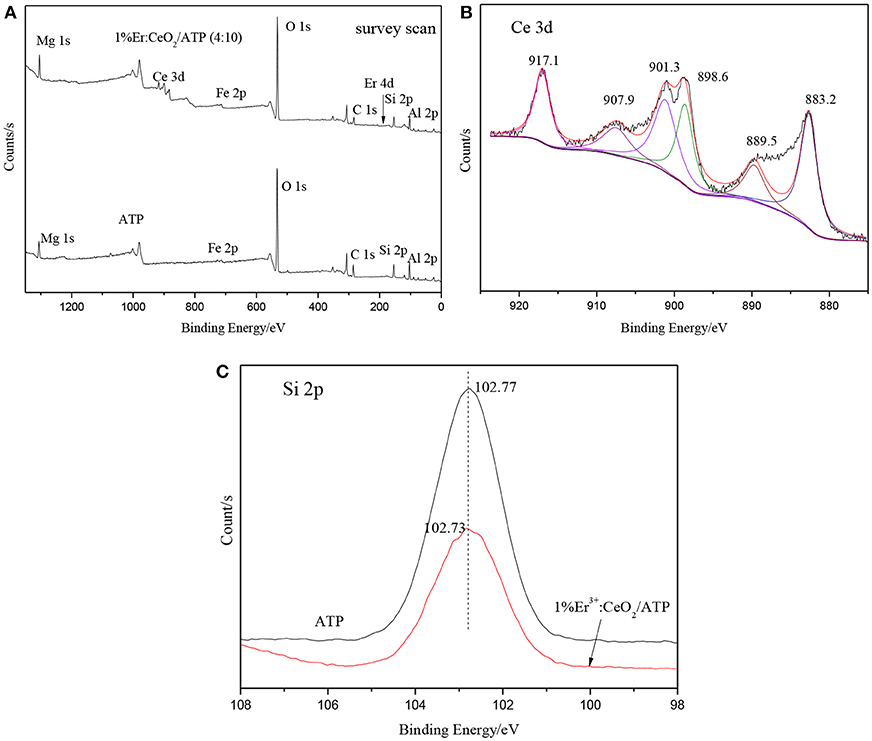
Figure 7. XPS patterns of ATP, and 1%Er3+:CeO2/ATP (4:10), (A) Survey scan, (B) Ce 3d, and (C) Si 2p.
Photocatalytic Oxidation Desulfurization
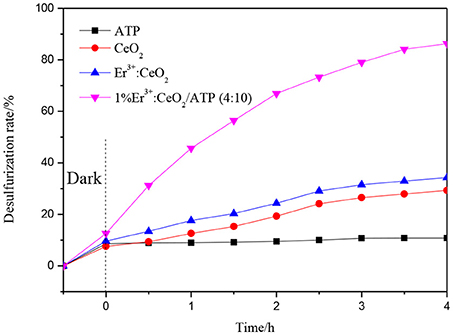
The photocatalytic oxidation desulfurization is performed using various catalysts. As shown in Figure 8, the desulfurization rate is 10.8, 29.3, and 34.3% corresponding to ATP, CeO2 and 1%Er3+:CeO2 samples. Meanwhile, the photocatalytic oxidation desulfurization rate of 1%Er3+:CeO2/ATP (4:10) reaches 87%. The 1%Er3+:CeO2 and ATP may have synergy which accelerates the migration of photogenerated electrons and holes. Furthermore, a unique Z-type structure may form perseving the high redox potential, thus leads to the improved desulfurization performance.
Figure 9 shows the photocatalytic desulfurization performance with different mass ratios of 1%Er3+:CeO2 and ATP. The desulfurization rate is enhanced gradually with the increase of the mass ratio. When the mass ratio is 4:10, the photocatalytic desulfurization rate of 1%Er3+:CeO2/ATP reached 87% within 4 h, which may be due to the fact that with the content of 1%Er3+:CeO2 increased, the concentration of oxygen vacancy is increased favoring for the transmission of charges. When the mass ratio is more than 4:10, the photocatalytic desulfurization rate is decreased, since the excess Er3+:CeO2 nanoparticles may lead to aggregation restraining the exposure of surface active sites and destroying the balance of recombination of charges.
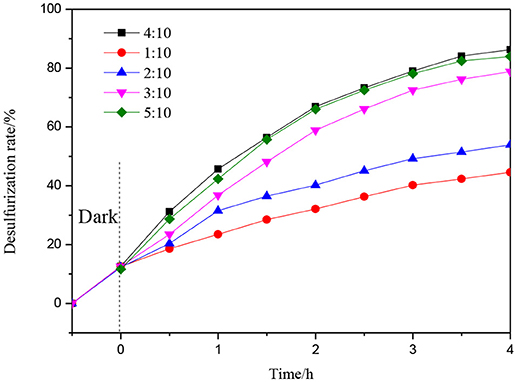
Figure 9. Photocatalytic desulfurization efficiency with different mass ratio of 1%Er3+:CeO2, and ATP.
Photocatalytic Desulfurization Mechanism
The position of conduction band (CB), valence band (VB) and Fermi energy levels (Ef) of 1%Er3+:CeO2 and ATP were calculated, respectively. Figures 10A,B show the Mott-schottky patterns of ATP and 1%Er3+:CeO2, where the flat band tential (identical Ef) of ATP and 1%Er3+:CeO2 is determined to be 0.1 and −0.84 eV, respectively. Figure 10C shows the Mott-schottky pattern of 1%Er3+:CeO2/ATP (4:10) after contact, and the equilibrium Ef level is shifted to −0.44 eV located between that of Er3+:CeO2 and ATP. Figure 10D shows the VB-XPS pattern of ATP, in which the VB value of ATP is determined to be 3.25 eV. In addition, the empirical formula of VB and CB is as follows (Obregón et al., 2016):
where EVB and ECB represent the VB and CB edge potential, respectively, X represents the electronegativity, Ee (about 4.5 eV) is the energy of free electrons on the hydrogen, and Eg is the band gap of the semiconductor. According to the above formula, the VB value for 1%Er3+:CeO2 is calculated to be −0.42 eV. Since the Eg of ATP and 1%Er3+:CeO2 is 3.75 and 2.51 eV by UV–Vis analysis in Figure 5, the corresponding CB for ATP and 1%Er3+:CeO2 is −0.5 and −2.93 eV, respectively.
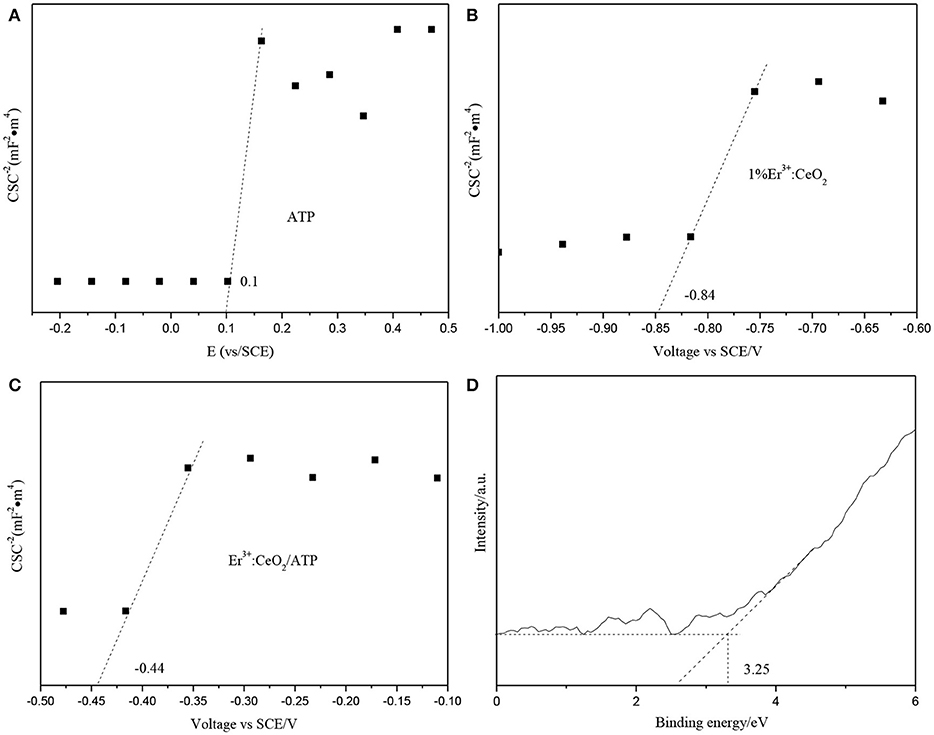
Figure 10. Mott-schottky patterns of ATP (A), 1%Er3+:CeO2 (B), 1%Er3+:CeO2/ATP (4:10) (C), and VB-XPS pattern of ATP (D).
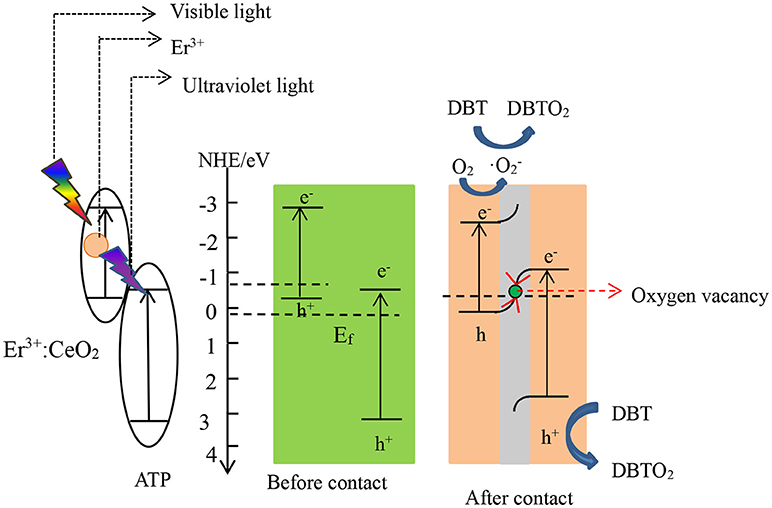
According to the above analysis, the photocatalytic desulfurization mechanism of 1%Er3+:CeO2/ATP (4:10) is proposed as shown in Figure 11. After contact, free electrons may flow from 1%Er3+:CeO2 to ATP due to the disparity of Ef until they reach equilibrium, which forms an internal electric field, leading to the consumption and accumulation of free electrons (Huang et al., 2017). Simultaneously, the energy band edge of Er3+:CeO2 is bended upward whereas the energy band edge of ATP is bended downward. Under visible light irradiation, the 1%Er3+:CeO2 is stimulated to produce photogenerated e− and h+ while Er3+ converts visible light to ultraviolet light. Subsequently, ATP is stimulated by the upconverted ultraviolet light to produce photogenerated e− and h+. Then the downward band bending of ATP allows e− flow to the oxygen vacancy in CeO2 while the upward band bending of 1%Er3+:CeO2 allows h+ flow to the oxygen vacancy which acted as the recombination center for the e− and h+ (Ding et al., 2016). Finally, the photogenerated e− in the CB of 1%Er3+:CeO2 is preserved and reacts with O2 to produce ·. Then, · and h+ in the VB of ATP synergistically oxidize DBT to DBTO2 (Li et al., 2018). According to the above statement, the reaction equations are put forward as follows:
Conclusion
In this work, Er3+:CeO2/ATP nanocomposites have been successfully prepared via a one-step precipitation method. Doping of Er not only alters the band gap of CeO2, but also converts visible light to ultraviolet light and reach the strongest when the doping fraction of Er is 1%. Er3+:CeO2 and ATP form Z-type heterostructure intermediated by oxygen vacancy, which promotes the transfer of photogenerated electrons and holes and preserves the charges with higher oxidation-reduction ability. The photocatalytic desulfurization rate reaches the highest 87% when the mass radio of Er3+:CeO2 and ATP is 4:10. This novel photocatalyst integrated by natural clay and rare earth upconversion may pave a new way for design of eco-friendly materials and beyond.
Author Contributions
FW drafted the manuscript, XL made analysis and revision, HZ synthesized the samples and conducted desulfurization experiment, SZ characterized the samples, CY provided the idea and proposed the mechanism.
Funding
This work was supported by the National Science Foundation of China (51674043, 51702026), Jiangsu Key Laboratory of Advanced Catalytic Materials and Technology (BM2012110) and Priority Academic Program Development of Jiangsu Higher Education Institutions (PAPD).
Conflict of Interest Statement
The authors declare that the research was conducted in the absence of any commercial or financial relationships that could be construed as a potential conflict of interest.
References
Agarwal, M., Dikshit, P. K., Bhasarkar, J. B., Borah, A. J., and Moholkar, V. S. (2016). Physical insight into ultrasound-assisted biodesulfurization using free and immobilized cells of Rhodococcus rhodochrous MTCC 3552. Chem. Eng. J. 295, 254–267. doi: 10.1016/j.cej.2016.03.042
Balaji, R., Kumar, S., Reddy, K. L., Sharma, V., Bhattacharyya, K., and Krishnan, V. (2017). Near-infrared driven photocatalytic performance of lanthanide-doped NaYF4@CdS core-shell nanostructures with enhanced upconversion properties. J. Alloys Compd. 724, 481–491. doi: 10.1016/j.jallcom.2017.07.050
Bhethanabotla, V. C., Russell, D. R., and Kuhn, J. N. (2016). Assessment of mechanisms for enhanced performance of Yb/Er/titania photocatalysts for organic degradation: part 2. Role of rare earth elements in the titania phase. Appl. Catal. B Environ. 202, 156–164. doi: 10.1016/j.apcatb.2016.09.008
Ding, J., Dai, Z., Qin, F., Zhao, H., Zhao, S., and Chen, R. (2016). Z-scheme BiO1−xBr/Bi2O2CO3 photocatalyst with rich oxygen vacancy as electron mediator for highly efficient degradation of antibiotics. Appl. Catal. B Environ. 205, 281–291. doi: 10.1016/j.apcatb.2016.12.018
Feng, W., Han, C., and Li, F. (2013). Upconversion-nanophosphor-based functional nanocomposites. Adv. Mater. 25, 5287–5303. doi: 10.1002/adma.201301946
Han, G., Wang, M., Li, D., Bai, J., and Diao, G. (2017). Novel upconversion Er, Yb-CeO2 hollow spheres as scattering layer materials for efficient dye-sensitized solar cells. Solar Energy Mater. Solar Cells 160, 54–59. doi: 10.1016/j.solmat.2016.10.021
Huang, Z.-F., Song, J., Wang, X, Pan, L., Li, K., Zhang, X., et al. (2017). Switching charge transfer of C3N4/W18O49 from type-II to Z-scheme by interfacial band bending for highly efficient photocatalytic hydrogen evolution. Nano Energy 40, 308–316. doi: 10.1016/j.nanoen.2017.08.032
Khodadadi Dizaji, A., Mortaheb, H. R., and Mokhtarani, B. (2018). Complete oxidative desulfurization using graphene oxide-based phosphomolybdic acid catalyst: process optimization by two phase mass balance approach. Chem. Eng. J. 335, 362–372. doi: 10.1016/j.cej.2017.10.129
Kumar, S., and Kumar, A. (2017). Enhanced photocatalytic activity of rGO-CeO2 nanocomposites driven by sunlight. Mater. Sci. Eng. B 223, 98–108. doi: 10.1016/j.mseb.2017.06.006
Li, X., Li, F., Lu, X., Zuo, S., Li, Z., Yao, C., et al. (2018). Microwave hydrothermal synthesis of BiP1−xVxO4/attapulgite nanocomposite with efficient photocatalytic performance for deep desulfurization. Powder Technol. 327, 467–475. doi: 10.1016/j.powtec.2018.01.005
Li, X., Ni, C., Yao, C., and Chen, Z. (2012). Development of attapulgite/Ce1−xZrxO2 nanocomposite as catalyst for the degradation of methylene blue. Appl. Catal. B Environ. 117–118, 118–124. doi: 10.1016/j.apcatb.2012.01.008
Li, X., Zhang, Z., Yao, C., Lu, X., Zhao, X., and Ni, C. (2016). Attapulgite-CeO 2 /MoS 2 ternary nanocomposite for photocatalytic oxidative desulfurization. Appl. Surf. Sci. 364, 589–596. doi: 10.1016/j.apsusc.2015.12.196
Li, X., Zhu, W., Lu, X., Zuo, S., Yao, C., and Ni, C. (2017). Integrated nanostructures of CeO2/attapulgite/g-C3N4 as efficient catalyst for photocatalytic desulfurization: mechanism, kinetics and influencing factors. Chem. Eng. J. 326, 87–98. doi: 10.1016/j.cej.2017.05.131
Liu, R., Zhang, J., Xu, Z., Zhao, D., and Sun, S. (2017). Visible light photocatalytic oxidative desulfurization using Ti-MCM-41-loaded iron phthalocyanine combined with ionic liquid extraction. J. Mater. Sci. 53, 4927–4938. doi: 10.1007/s10853-017-1954-0
Ma, S., Li, X., Lu, X., Zuo, S., Li, Z., and Yao, C. (2018). Carbon quantum dots/attapulgite nanocomposites with enhanced photocatalytic performance for desulfurization. J. Mater. Sci. Mater. Electron. 29, 2709–2715. doi: 10.1007/s10854-017-8197-3
Mamontov, G. V., Grabchenko, M. V., Sobolev, V. I., Zaikovskii, V. I., and Vodyankina, O. V. (2016). Ethanol dehydrogenation over Ag-CeO2/SiO2 catalyst: role of Ag-CeO2 interface. Appl. Catal. A Gen. 528, 161–167. doi: 10.1016/j.apcata.2016.10.005
Obregón, S., Zhang, Y., and Colón, G. (2016). Cascade charge separation mechanism by ternary heterostructured BiPO4/TiO2/g-C3N4 photocatalyst. Appl. Catal. B Environ. 184, 96–103. doi: 10.1016/j.apcatb.2015.11.027
Peng, R., Li, S., Sun, X., Ren, Q., Chen, L., Fu, M., et al. (2017). Size effect of Pt nanoparticles on the catalytic oxidation of toluene over Pt/CeO2 catalysts. Appl. Catal. B Environ. 220, 462–470. doi: 10.1016/j.apcatb.2017.07.048
Pickering, J. W., Bhethanabotla, V. R., and Kuhn, J. N. (2017). Assessment of mechanisms for enhanced performance of TiO2/YAG:Yb+3,Er+3 composite photocatalysts for organic degradation. Appl. Catal. B Environ. 202, 147–155. doi: 10.1016/j.apcatb.2016.09.007
Raj, J. J., Magaret, S., Pranesh, M., Lethesh, K. C., Devi, W. C., and Mutalib, M. I. A. (2017). Extractive desulfurization of model fuel oil using ester functionalized imidazolium ionic liquids. Sep. Purif. Technol. 196, 115–123. doi: 10.1016/j.seppur.2017.08.050
Ramasamy, P., Chandra, P., Rhee, S. W., and Kim, J. (2013). Enhanced upconversion luminescence in NaGdF4:Yb,Er nanocrystals by Fe3+ doping and their application in bioimaging. Nanoscale 5, 8711–8717. doi: 10.1039/c3nr01608k
Šutka, A., Vanags, M., Joost, U., Šmits, K., RuŽa, J., Ločs, J., et al. (2018). Aqueous synthesis of Z-scheme photocatalyst powders and thin-film photoanodes from earth abundant elements. J. Environ. Chem. Eng.6, 2606–2615. doi: 10.1016/j.jece.2018.04.003
Wang, L., Wang, W. Y., Mominou, N., Liu, L. X., and Li, S. Z. (2016). Ultra-deep desulfurization of gasoline through aqueous phase in-situ hydrogenation and photocatalytic oxidation. Appl. Catal. B Environ. 193, 180–188. doi: 10.1016/j.apcatb.2016.04.032
Wu, H., Yang, Z., Liao, J., Lai, S., Qiu, J., Song, Z., et al. (2014). Upconversion luminescence properties of three-dimensional ordered macroporous CeO2:Er3+,Yb3+. J. Alloys Compd. 586, 485–487. doi: 10.1016/j.jallcom.2013.10.124
Yang, Y., Lv, G., Li, J., Guo, W., and Zhang, Y. (2018). Synthesis of ceria nanorods as adsorbent for the adsorption desulfurization of gasoline fuel. J. Alloys Compd. 747, 189–196. doi: 10.1016/j.jallcom.2018.03.026
Zeng, X., Xiao, X., Li, Y., Chen, J., and Wang, H. (2017). Deep desulfurization of liquid fuels with molecular oxygen through graphene photocatalytic oxidation. Appl. Catal. B Environ. 209, 98–109. doi: 10.1016/j.apcatb.2017.02.077
Zhang, G., Ren, J., Liu, B., Tian, M., Zhou, H., and Zhao, J. (2018). In situ hydrothermal preparation and photocatalytic desulfurization performance of metallophthalocyanine sensitized SnO2. Inorg. Chim. Acta 471, 782–787. doi: 10.1016/j.ica.2017.12.025
Zhang, G., Wang, H., Guo, S., Wang, J., and Liu, J. (2016b). Synthesis of Cu/TiO2/organo-attapulgite fiber nanocomposite and its photocatalytic activity for degradation of acetone in air. Appl. Surf. Sci. 362, 257–264. doi: 10.1016/j.apsusc.2015.11.218
Zhang, J., Chen, A., Wang, L., Li, X. A., and Huang, W. (2016a). Striving toward visible light photocatalytic water splitting based on natural silicate clay mineral: the interface modification of attapulgite at the atomic-molecular level. ACS Sust. Chem. Eng. 4, 4601–4607. doi: 10.1021/acssuschemeng.6b00716
Zhang, J., He, R., and Liu, X. (2013). Efficient visible light driven photocatalytic hydrogen production from water using attapulgite clay sensitized by CdS nanoparticles. Nanotechnology 24:505401. doi: 10.1088/0957-4484/24/50/505401
Zhao, H., Qiu, F., Yan, J., Wang, J., Li, X., and Yang, D. (2016). Preparation of economical and environmentally friendly graphene/palygorskite/TiO2 composites and its application for the removal of methylene blue. Appl. Clay Sci. 121–122, 137–145. doi: 10.1016/j.clay.2015.12.009
Keywords: attapulgite, upconversion, rare earth, Z scheme, photocatalyst
Citation: Wu F, Li X, Zhang H, Zuo S and Yao C (2018) Z-Scheme Photocatalyst Constructed by Natural Attapulgite and Upconversion Rare Earth Materials for Desulfurization. Front. Chem. 6:477. doi: 10.3389/fchem.2018.00477
Received: 25 June 2018; Accepted: 20 September 2018;
Published: 05 October 2018.
Edited by:
Wenbo Wang, Lanzhou Institute of Chemical Physics (CAS), ChinaReviewed by:
Jinxing Ma, University of New South Wales, AustraliaFenghua Liu, Ningbo Institute of Industrial Technology (CAS), China
Copyright © 2018 Wu, Li, Zhang, Zuo and Yao. This is an open-access article distributed under the terms of the Creative Commons Attribution License (CC BY). The use, distribution or reproduction in other forums is permitted, provided the original author(s) and the copyright owner(s) are credited and that the original publication in this journal is cited, in accordance with accepted academic practice. No use, distribution or reproduction is permitted which does not comply with these terms.
*Correspondence: Xiazhang Li, eGlhemhhbmdAY2N6dS5lZHUuY24=
Chao Yao, eWFvY2hhb0BjY3p1LmVkdS5jbg==
 Fengqin Wu
 Xiazhang Li