- Department of Chemical and Biomolecular Engineering, North Carolina State University, Raleigh, NC, United States
Elucidation of kinetics of photocatalyzed chemical mechanisms occurring at interfaces (gas-solid, liquid-solid) has been challenging. We summarize here five lessons learned over five decades.
1. An assumed reaction network leads to a single kinetic model, but a common model, the Langmuir–Hinshelwood rate equation, r = kcat K C/ [1 +KC], arises from multiple mechanisms, hence models alone do not reveal unique mechanisms.
2. The Langmuir–Hinshelwood model parameter kcat represents the slow step at a catalyst surface, and in thermal catalysis, depends upon the reactant structure. However, early photocatalysis work with light chlorinated hydrocarbons in aqueous solutions showed a single kcat value, independent of reactant structure.
3. The dependence of the Langmuir-Hinshelwood parameters, kcat and K, upon intensity indicates that a pseudo-steady state approach is more fundamental than the presumed equilibrated adsorption of the LH model.
4. Dyes and phenols are commonly studied, and claimed as first order reactions, despite often exhibiting rate constants which diminish with increasing contaminant concentration. We show that such studies are the result of intrinsic zero order data plotted on a semilog graph, and involve zero order rate limitation by reactant saturation, electron transfer to O2, oxygen mass transfer, or light supply.
5. The apparent kinetics for contaminant removal from photocatalytic self-cleaning surfaces depends upon multiple circumstances, including the geometry of reactant deposit, catalyst porosity, and reactant light absorption. A single decision table suffices to indicate the apparent reaction order, n, to assume when fitting photocatalytic kinetic data from self-cleaning surfaces to a power law rate form, rate = k Cn.
Introduction
Catalysts, by definition, allow for an increased reaction rate without themselves undergoing any permanent change. Kinetic mechanisms and corresponding reaction rate models are central to characterization and comparisons of catalysts. We summarize here the evolution and refinement of kinetic analyses of photocatalyzed reactions which demonstrate the care and consistency required to obtain and interpret kinetic data. Five examples are discussed which illustrate central issues in photocatalysis.
Lesson 1: Mechanisms Lead to Rate Forms, but Rate Forms Do Not Imply Unique Mechanisms
It is established that photocatalysts produce active species, including OH radicals and h+ holes in the semiconductor (Turchi and Ollis, 1990). The majority of photocatalyzed oxidations in water involve OH radicals, so we considered these only for the present discussion. We imagined four mechanisms by which OH radicals participate in oxidation of reactant, C:
Langmuir–Hinshelwood biomolecular: C(ads) + OH(ads) = > products
Eley–Rideal biomolecular: C(ads) + OH (sol'n) = > products
Eley–Rideal biomolecular: C(sol'n) + OH(ads) = > products
Solution phase oxidation: C(sol'n) + OH (sol'n) = > products.
A detailed analysis (Turchi and Ollis, 1990) indicated that kinetic rate forms resulting from each of these assumed mechanisms yields some version of the Langmuir–Hinshelwood rate form:
The conclusion is that in photocatalysis, as in many other areas of kinetics, a given mechanism leads to a unique rate form, but the converse is not true. Thus, the true photocatalyzed mechanism must be established by demonstrations beyond showing merely a satisfactory fit to Equation (1).
We note that other primary oxidizers are discussed as well, including OH radical production from surface lattice oxygen (Montoya et al. (2014), and radicals in carbonate containing solutions (Xiong et al., 2016). These circumstances both involve photoproduced active centers, the concentrations of which would be intensity dependent, and would again involve a fast reaction step for the active forms, and thus again displace any upstream equilibria, leading again to a required usage of a pseudo-steady state analysis.
Lesson 2: The Photocatalytic Oxidation Rate Constant, kcat, is a Property of the Photocatalyst, and Does Not Depend Appreciably Upon Reactant Structure
The classical test for the LH rate form is to plot reciprocal rate vs. reciprocal reactant concentration:
In thermal heterogeneous catalysis, both the strength of adsorption and the magnitude of the rate constant usually vary with reactant structure.
Photocatalysis provides an interesting exception as shown by kinetic results from multiple papers examining the photocatalyzed destruction of chlorinated and brominated light hydrocarbons. Reciprocal rate vs. reciprocal concentration data plots for photocatalyzed oxidative destruction of these reactants show a common intercept (Turchi and Ollis, 1990) as seen in Figures 1A,B, thus indicating identical values of kcat for all reactants shown. In other words, kcat is essentially independent of reactant structure. If kcat is the product of an intrinsic rate constant and OH concentration (surface or solution), then the product kcat OH is a fundamental measure of photocatalyst activity, and clearly in turn depends on intensity, as OH derives from reactions involving surface species h+ and e– which in turn are produced via photon absorption in the semiconductor.
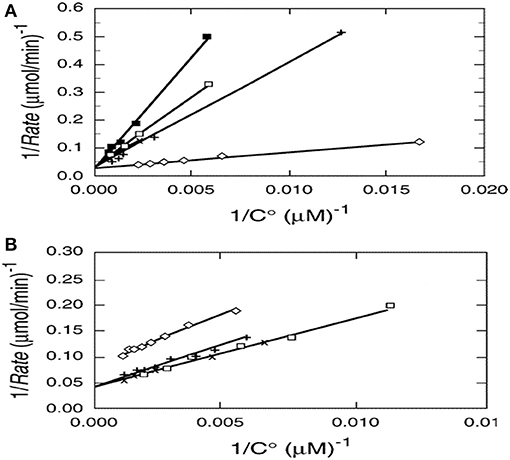
Figure 1. (A)Reciprocal initial rate vs. reciprocal initial concentration for (□) chloroform, (x) dicloromethane, (♢) perchloroethylene (PCE), (x) chloroacetic acid, and (+) dichloroacetic acid. (B) Reciprocal initial rate vs. reciprocal initial concentration for (□) tribromomethane, (x) dibromomethane, (♢) 1,2 dibromoethane, (+) 1,1-dibromooethane. Catalyst; 1.0 g/L Fisher Chemical TiO2, Lot 773688. Excepting 1,2 dibromomethane, the y-axis intercepts, 1/kcat, appear to be identical (Turchi and Ollis, 1990; reprinted by permission of Elsevier).
This intriguing result reflects the better known conclusion from gas phase kinetics: Excepting fully saturated hydrocarbons possessing only methyl groups, most other hydrocarbons exhibit gas phase second order rate constants for (OH + hydrocarbon) which are similar, of the order of 10−11 cm3 molecule−1 s−1 (Atkinson et al., 2006), and thus essentially independent of reactant structure.
Lesson 3: Photocatalysis Kinetics Require a Pseudo-Steady State Analysis Because the Equilibrium Adsorption Model Is Invalid
The earliest photocatalysis papers routinely utilized Langmuir-Hinshelwood rate forms for one simple reason: Photocatalysis is a subfield of heterogeneous catalysis, and the latter field has historically been dominated by this analytic function,
where kcat is a fundamental representation of catalyst activity, and Kads is, historically, the adsorption equilibrium constant of the Langmuir isotherm,
where k1 and k−1 are reactant adsorption and desorption constants, respectively.
In photocatalysis, kcat is the product of a rate constant, k′, and some active specie such as OH radicals or semiconductor hole concentration, h+. Since these active species are the presumed result of photoactivation, their concentrations, and thus the catalytic rate constant, kcat, are expected to be a function of light intensity, I. In contrast, the traditional Langmuir-Hinshelwood approach assuming adsorption/desorption equilibrium contains rate constants k1 and k−1 which are not assumed to depend on intensity. The experimental observation that not only kcat, but also Kads, depend upon intensity (Emeline et al., 2000; Ollis, 2005; Mills et al., 2015) indicated failure of the equilibrated adsorption assumption.
This situation has been rectified by invoking a pseudo-steady state (PSS) assumption, commonly used in other kinetic analyses involving highly unstable intermediates such as free radicals. This analysis allows kcat to have any value relative to k−1. In particular, the PSS analysis leads to an apparent adsorption constant, Kads, which depends upon kcat, and thus varies with intensity (Ollis, 2005):
Because all photocatalyzed aqueous phase oxidations carried out in the presence of water and molecular oxygen produce the same active species, OH and h+, we may expect that all such conversions require PSS rather than Langmuir-Hinshelwood analyses.
Mills et al. (2015) have termed this pseudo steady state approach the “disrupted adsorption kinetic model” and analyzed it along with other pseudo-steady state models for photocatalyzed reactions, paying particular attention to the most promising, those of Gerischer (1995); Emeline et al. (2000), Valencia et al. (2011), and Montoya et al. (2014). They concluded that “The best of those tested, in terms of overall fit, simplicity, usefulness, and versatility is the disrupted adsorption kinetic model proposed by Ollis.”
Lesson 4: Only Initial Rate Analysis Reveals Intrinsic Reaction Order, n, Whereas Temporal Data May Yield Kinetic Disguises
Oxidation of organic reactants has been one of the most investigated aspects of research in photocatalysis. Two of the most frequently studied reactant classes are phenols and dyes, for which Web of Science (5/20/2018) indicates that 5,363 and 19,129 papers, respectively have been published to date.
A number of these reports find that semilog plots of reactant concentration, C(t), vs. time yield linear forms, but that the slope of such plots, and thus the apparent first order rate constant, kcat, decrease with increased initial concentration, Co These results indicate that the presumed rate constant (slope) of such plots is not, in fact, a constant, and thus that the assumption of first order mechanism is incorrect, as we demonstrate for phenol.
An early example is provided by Kawaguchi (1983) who explored phenol photocatalyzed oxidation by ZnO using a high pressure Hg lamp. At each of five different ZnO photocatalyst concentrations (Cz), a ln-ln plot of apparent first order rate constant vs. initial phenol concentration, Co, yielded a straight line (Figure 2A). We claim these results represent a disguised zero order process. We first establish zero order rate, then later explain the apparent first order temporal result.
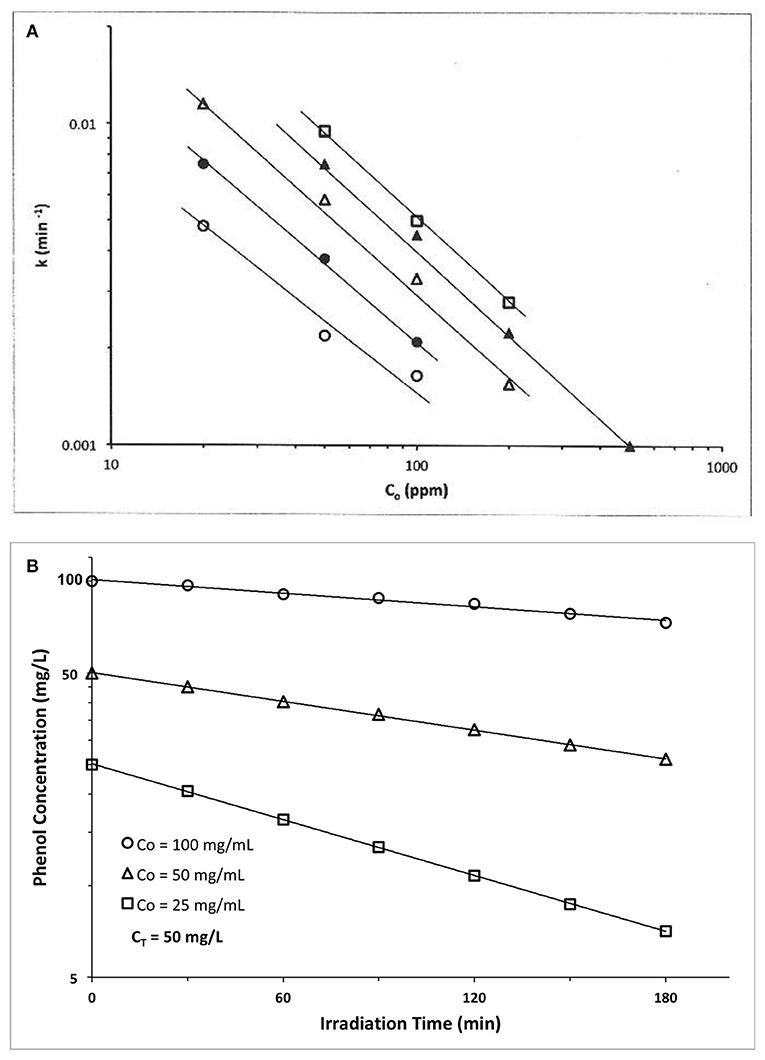
Figure 2. (A) Photocatalyzed oxidation of phenol by illuminated ZnO. Semilog plots of apparent first order rate constants vs. initial solution concentration. All plots exhibit slopes of approximately −1, confirming our claim that these data actually represent a zero order reaction, because the y-x product of apparent first order rate constant(y) times the initial concentration(x) is a constant, i.e., (yx) = k1 Co = ko = zero order rate ((Kawaguchi, 1983); Reprinted with permission). (B) Photocatalyzed oxidation of phenol by illuminated TiO2(anatase). The product of apparent first order rate constant (slope) times the initial concentration, Co, is a constant, of average value 0.194 mg phenol/l-min (Table 1), thus indicating presence of a zero order reaction (Kawaguchi, 1984).
At each catalyst concentration in Figure 2A, the doubly logarithmic plot of apparent first order rate constant [evaluated from ln C(t) vs. t plots] vs. initial concentration, Co, is linear with negative slopes of −0.85, −0.91, −0.1.04, −0.97, and −0.95, respectively, for five different catalyst concentrations. Since we claim here that ko = k1(apparent) Co, then ln k1 = ln ko – ln Co, and a graph of ln k1 vs. ln Co should have a slope of −1.0, as verified by the experimental results of Figure 2B and the slopes calculated therefrom. Thus, this photocatalyzed reaction exhibits a zero order behavior, because the product of apparent first order rate constant, k1, times initial phenol concentration, Co, is a constant, ko. The zero order constant, ko, is, however, dependent on photocatalyst concentration as Figure 2A indicates.

Table 1. ZnO photocatalyzed oxidation of phenol Kawaguchi, 1984.
A second example is also provided by Kawaguchi (1984) for the TiO2 (anatase) photocatalyzed oxidation of phenol (Figure 2B). The initial rate of reaction we recover from the Figure 2B results by multiplying each slope (k1, apparent first order rate constant) × its initial phenol concentration, Co. If the rate is truly zero order, then the initial rate, ro = ko = k1 Co. = should again be constant, so we calculate ro from the product k1 Co to recover the experimental initial rate results which appear in the Table 1 below.
Thus, all three data sets in Figure 2B are represented by a zero order average rate of magnitude ko = 0.194 mg/l-min !
A similar behavior of first order rate constants varying with Co is periodically reported for photocatalyzed oxidation of organics dyes (e.g., Chen et al., 2011; Figure 3) and (Muruganandham and Swaminathan, 2006; Figure 4). Prabha and Lathasree (2014) also found this behavior; Prabha's thesis contains dye date showing initial loading of dye, and resultant bulk phase equilibrated dye concentration, from which the initial amount of dye adsorbed can be calculated. This calculation (Figure 5) shows that the photocatalyst surface was saturated in dye over nearly the entire concentration range studied, even though an apparent first order behavior for each Co value was reported. Such saturation implies a zero order rate of reaction as we have argued above.
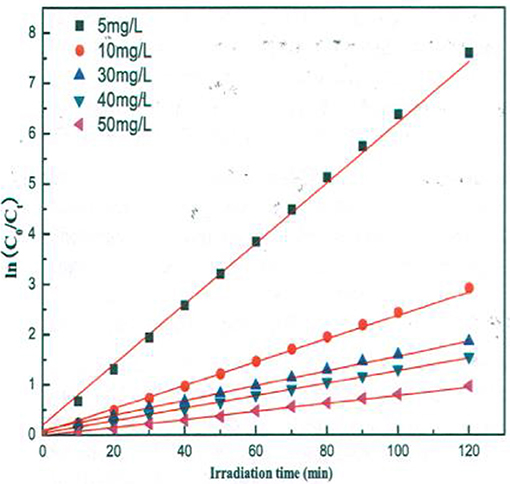
Figure 3. Kinetics of methyl orange degradation catalyzed by ZnO nanoparticles (Chen et al., 2011; Reproduced by permission).
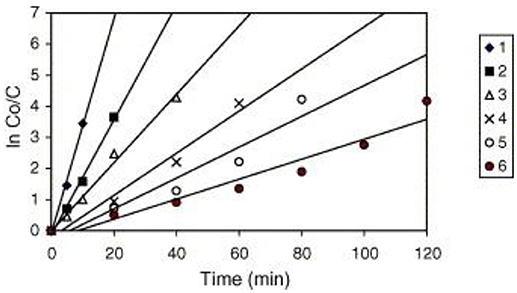
Figure 4. Kinetics of RY14 decolorization by UV/TiO2-P25 for different initial dye concentrations. TiO2-P25 = 4 g/l, pH 5.5 ± 0.1. [1] = 1 × 10⁻⁴ mol/l, [2] = 2 × 10⁻⁴ mol/l, [3] = 3 × 10⁻⁴ mol/l, [4] = 5 × 10⁻⁴ mol/l, [5] = 7 × 10⁻⁴ mol/l, and [6] = 9 × 10⁻⁴ mol/l ((Muruganandham and Swaminathan, 2006); Reprinted by permission).
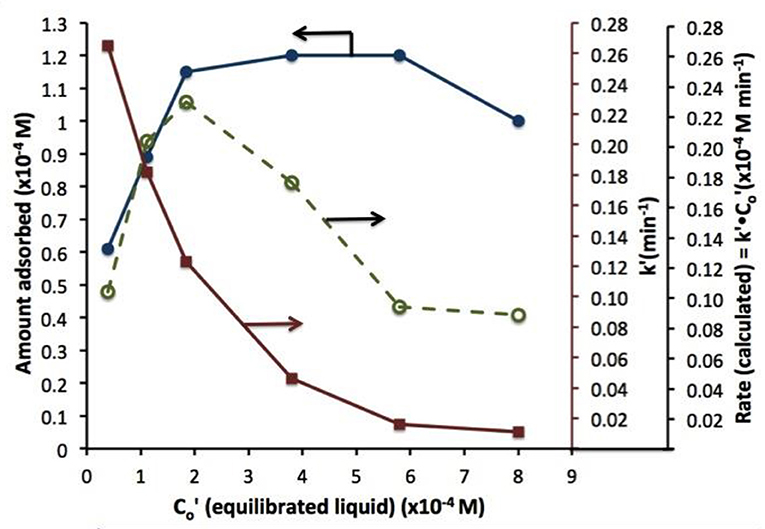
Figure 5. Dye absorbed (left axis), rate constant k'(closed circles), and rate (calculated) vs. equilibrated liquid phase dye concentration (open circles). Beyond 2 10−4 M dye, the coverage is complete; eventual rate decline at higher Co is likely due to photon absorption by dye.
This dye situation is more complicated that the phenol example above, as photolysis, photocatalysis, and photosensitization may all play a role, depending on the dye, wavelength, and photocatalyst used. These cases are analyzed in a future paper, but the “take away” message is already clear: variable first order rate “constants” strongly suggest a kinetic disguise of e.g., a zero order process, be it due to reactant saturated surface, oxygen supply limitation, or light limitation.
It is curious that authors of such studies have limited their kinetic analyses to semilog plots to determine reaction order, rather than also exploring the zero order possibility. The existence of a zero order rate of reaction may arise from multiple circumstances:
(a) The surface is saturated in organic reactant, e.g., phenol.
(b) The reaction rate is limited by some other participant, e.g., light supply or oxygen mass transfer (Ollis et al., 2015). In each case, the constant, but limiting, supply of light or oxygen would lead to a zero order rate of reaction.
The observed linearity of semilog plots of C(t) vs. time shown in Figure 2A and Table 1 then requires an alternate explanation, if the initial reaction rate is truly of zero order. We consider competition for oxidant between the original reactant and a series of also oxidizable, organic intermediates (Ollis et al., 2015). The fraction of oxidant consumed by the initial dye reactant is given by
where kdye, ki, are the second order rate constants for reaction of dye and intermediates, i, respectively with the rate limiting oxidant, e.g., OH radical. Since the kis are expected to be similar, the denominator is expected to be relatively constant (the sum term grows as the dye concentration term decreases over time, and the denominator will remain approximately constant). As a result, the reaction rate, proportional to OH × fdye, will exhibit an apparent first order behavior over time, even while the initial rate is zero order within the concentration range studied.
Lesson 5: The Apparent Order of Reaction, N, for Photocatalyzed Self-Cleaning of Deposits on (Air)-Solid(Photocatalyst) Surfaces May Exhibit a Value Lying Between 0 and 2, and Depends on Five Reaction Conditions
Two surveys and analyses of literature data for photocatalytic self-cleaning surfaces (Ollis, 2010, 2017) show that when rate data are analyzed by fitting a power law expression,
the value of n found falls in the range 0 < n < 2. The apparent value of n revealed for a given set of experiments depends on the answers to five questions:
(i) Is the photocatalyst porous or non-porous ?
(ii) Is the reactant deposited on the outer surface, or distributed within a porous catalyst ?
(iii) Is the photocatalyst optically thick (OD > 2) or thin (OD < 0.3)?
(iv) Is the reactant deposited as a submonolayer or a multilayer ?
(v) Is the reactant present as a continuous film or as discrete deposits? If as discrete deposits, is the deposit size distribution monodisperse, narrow, or broad?
We have shown elsewhere (Ollis, in press) that, equipped with the answers to these questions, the reaction order, n, can be predicted. The possibilities for catalyst-reactant circumstances are collected in a decision tree diagram, a format commonly used in statistical analyses when the outcome of a question, e.g., “What is the apparent order of reaction, n?” depends on the answers to multiple queries, each of which requires only a binary (e.g., yes/no) response. This decision table, which should guide those seeking to measure activity of self-cleaning surfaces, appears in Figure 6.
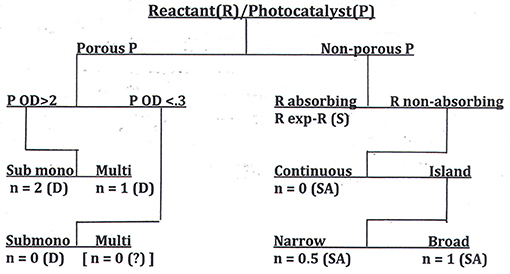
Figure 6. A decision tree for determination of reaction order, n, for the photocatalyzed removal of deposits from surfaces. P, photocatalyst; R, reactant; D, dye; SA, stearic acid; S, soot (Ollis, in press).
Conclusion
Analysis of the kinetics of photocatalyzed reactions was early on assumed to be rather simple, as early data for liquid-solid systems, as well as gas-solid examples, were fitted to Langmuir-Hinshelwood rate forms, with the equilibrium adsorption assumption implicit in these reports. More detailed analyses have revealed a more complex world, in which the five lessons cited above serve to aid current researchers in finding more fundamental, if more complicated, rationales for their observed kinetic behaviors.
Author Contributions
The author confirms being the sole contributor of this work and approved it for publication.
Conflict of Interest Statement
The author declares that the research was conducted in the absence of any commercial or financial relationships that could be construed as a potential conflict of interest.
References
Atkinson, R., Baulch, D., Cox, R., Crowley, J., Hampson, R., Hynes, R., et al. (2006). Evaluated kinetic and photochemical data for atmospheric chemistry: volume II - gas phase reactions of organic species. Atmos. Chem. Phys. 6, 36225–34055. doi: 10.5194/acp-6-3625-2006
Chen, S., Liu, J, Liu, P., and Yu, B (2011). Investigation of photocatalytic degradation of methyl orange by using nano-sized ZnO catalysts. Adv. Chem. Eng. Sci. 1, 9–14. doi: 10.4236/aces.2011.11002
Emeline, A., Ryabchuk, V., and Serpone, N. (2000). Factors affecting the efficiency of a photocatalyzed process in aqueous metal-oxide dispersions: prospect of distinguishing between two kinetic models. J. Photochem. Photobiol. A Chem. 133, 89–97. doi: 10.1016/S1010-6030(00)00225-2
Gerischer, H. (1995). Photocatalysis in aqueous solution with small TiO2 particles and the dependence of the quantum yield on particle size and light intensity. Electrochem. Acta 40, 1277–1281. doi: 10.1016/0013-4686(95)00058-M
Kawaguchi (1984). Photocatalytic decomposition of phenol in the presence of titanium dioxide. Environ. Sci. Technol. 5, 471–474.
Kawaguchi, H. (1983). Photochemical decomposition of phenol in presence of photocatalyst. Kagaka Kugukuro Banshu 9, 107–109.
Mills, A., O'Rourke, C., and Moore, K. (2015). Powder semiconductor photocatalysis in aqueous solution: an overview of kinetics-based reaction mechanisms. J. Photochem. Photobiol. A Chem. 310, 66–105. doi: 10.1016/j.jphotochem.2015.04.011
Montoya, J., Peral, J., and Salvador, P. (2014). Comprehensive kinetic and mechanistic analysis of TiO2 photocatalytic reactions according to the direct-indirect model: a theoretical approach. J. Phys. Chem. 118, 14266–14275. doi: 10.1021/jp4121645
Muruganandham, M., and Swaminathan, M. (2006). TiO2-UV photocatalytic oxidation of reactive yellow 14: effect of operational parameters. J. Hazard. Mater. 135, 78–86. doi: 10.1016/j.jhazmat.2005.11.022
Ollis, D. (2010). Kinetics of photocatalyzed film removal on self-cleaning surfaces: simple configurations and useful models. Appl. Catal. B Environ. 99, 478–484. doi: 10.1016/j.apcatb.2010.06.029
Ollis, D. (2017). Removal kinetics of stearic acid discrete deposits on photocatalytic self-cleaning surfaces: effect of deposit initial size distribution. Appl. Catal. B Environ. 209, 174–182. doi: 10.1016/j.apcatb.2017.02.029
Ollis, D (in press). Kinetics of photocatalytic, self-cleaning surfaces: A decision tree approach for determination of reaction order. Appl. Catal. B.
Ollis, D., Silva, C., and Faria, J. (2015). Simultaneous photochemical and photocatalyzed liquid phase reactions: dye decolorization kinetics. Catal. Today 240, 80–85. doi: 10.1016/j.cattod.2014.03.062
Ollis, D. F (2005), Kinetics of liquid phase photocatalyzed reactions: an illuminating approach. J. Phys.Chem. B. 109, 2439–2444. doi: 10.1021/jp040236f.
Prabha, I., and Lathasree, S. (2014). Photodegradation of phenol by zinc oxide, titania and zinc oxide–titania composites: nanoparticle synthesis, characterization and comparative photocatalytic efficiencies. Mat. Sci. Semiconductor Process. 26, 603–613. doi: 10.1016/j.mssp.2014.05.031
Turchi, C., and Ollis, D. F. (1990). Photocatalytic degradation of organic water contaminants: mechanisms involving hydroxyl radical attack. J. Catal. 122, 178–192. doi: 10.1016/0021-9517(90)90269-P
Valencia, S., Catano, F., Rios, L., Restropo, G., and Marin, J. (2011). A new kinetic model for heterogeneous photocatalysis with titanium dioxide: case of non-specific adsorption considering back reaction. Appl. Catal. B Environ. 104, 300–304. doi: 10.1016/j.apcatb.2011.03.015
Keywords: photocatalysis, kinetic model, Langmuir-Hinshelwood, pseudo-steady state, self-cleaning surfaces, initial rate, reactant size distribution
Citation: Ollis DF (2018) Kinetics of Photocatalyzed Reactions: Five Lessons Learned. Front. Chem. 6:378. doi: 10.3389/fchem.2018.00378
Received: 16 April 2018; Accepted: 03 August 2018;
Published: 31 August 2018.
Edited by:
Kangle Lv, South-Central University for Nationalities, ChinaReviewed by:
Yiming Xu, Zhejiang University, ChinaMaría De Los Milagros Ballari, CONICET Santa Fe, Argentina
Copyright © 2018 Ollis. This is an open-access article distributed under the terms of the Creative Commons Attribution License (CC BY). The use, distribution or reproduction in other forums is permitted, provided the original author(s) and the copyright owner(s) are credited and that the original publication in this journal is cited, in accordance with accepted academic practice. No use, distribution or reproduction is permitted which does not comply with these terms.
*Correspondence: David F. Ollis, b2xsaXNAbmNzdS5lZHU=
 David F. Ollis