
94% of researchers rate our articles as excellent or good
Learn more about the work of our research integrity team to safeguard the quality of each article we publish.
Find out more
PERSPECTIVE article
Front. Chem. , 22 August 2018
Sec. Chemical Physics and Physical Chemistry
Volume 6 - 2018 | https://doi.org/10.3389/fchem.2018.00371
This article is part of the Research Topic Towards the Control of Thermal Expansion: from 1996 to today View all 19 articles
Negative thermal expansion (NTE) upon heating is an unusual property but is observed in many materials over varying ranges of temperature. A brief review of mechanisms for NTE and prominent materials will be presented here. Broadly there are two basic mechanisms for intrinsic NTE within a homogenous solid; structural and electronic. Structural NTE is driven by transverse vibrational motion in insulating framework–type materials e.g., ZrW2O8 and ScF3. Electronic NTE results from thermal changes in electronic structure or magnetism and is often associated with phase transitions. A classic example is the Invar alloy, Fe0.64Ni0.36, but many exotic mechanisms have been discovered more recently such as colossal NTE driven by Bi–Ni charge transfer in the perovskite BiNiO3. In addition there are several types of NTE that result from specific sample morphologies. Several simple materials, e.g., Au, CuO, are reported to show NTE as nanoparticles but not in the bulk. Microstructural enhancements of NTE can be achieved in ceramics of materials with anisotropic thermal expansion such as beta–eucryptite and Ca2RuO4, and artificial NTE metamaterials can be fabricated from engineered structures of normal (positive) thermal expansion substances.
NTE (negative thermal expansion) refers to the unusual phenomenon of volume contraction upon heating. Although most materials display positive thermal expansion (PTE) on heating, NTE is found in a wide variety of substances over varying ranges of temperature. This brief review is an attempt to summarize the mechanisms and prominent materials that show NTE. Further details may be found in more substantial reviews published by other authors in recent years (Lind, 2012; Takenaka, 2012; Chen et al., 2015; Dove and Fang, 2016; Liu et al., 2018; Mittal et al., 2018) and in the other papers in this special issue.
Control of thermal expansion is important for many applications from ceramic cooker hobs to housings for optical devices, with zero thermal expansion (ZTE) materials or composites of PTE and NTE components being particularly useful. Thermal expansion is quantified through the linear or volume (bulk) thermal expansion coefficients (TECs), αL = (1/L)(dL/dT), and αV = (1/V)(dV/dT), which respectively measure the change in length L or volume V of an object with temperature T. αL and αV are typically quoted in 10−6 K−1 units, equivalent to ppm (parts per million) K−1 or MK−1. Isotropic substances such as simple liquids, glasses, polycrystalline ceramics, and cubic crystals, have the same αL in all directions with αV = 3αL. ZrW2O8 is a famous example of a cubic NTE material (Mary et al., 1996). However uniaxial (tetragonal, hexagonal, or trigonal) crystals may have different linear TECs α|| and α⊥ parallel and perpendicular to the unique symmetry axis, respectively, and crystals with orthorhombic or lower symmetry have three different values α1, α2, and α3 in mutually perpendicular directions. The volume TEC is given by αV = α|| + 2α⊥ or αV = α1 + α2 + α3 and when the linear TECs are very different, such as a mix of negative and positive values, then highly anisotropic thermal expansion may be obtained. TECs of crystalline materials are usually measured by determining how unit cell lengths change with temperature from diffraction measurements. Direct strain gauge (dilatometry) measurements of crystals can also be used, and are particularly useful for ceramics and amorphous materials such as glasses. Diffraction and dilatometry expansion measurements can give different results due to the effects of microstructure, as discussed in section Microstructural NTE.
NTE materials have negative αV over some temperature range. Reported αV values vary from −1 to −1,000 × 10−6 K−1, but it is also important to consider the temperature range to which the quoted αV refers as very large negative αV's may result from modest volume decreases over very narrow temperature ranges at a phase transition. For this reason it is often more useful to consider the overall volume decrease; materials with –ΔL/L > 1% and so –ΔV/V > 3% have notably large NTE.
The thermodynamic origin of thermal expansion in solids is expressed through the relation αV = γCV/BV where CV is heat capacity at constant V, B = –V(dp/dV) is the bulk modulus with p being pressure, and γ is the weighted or macroscopic Grüneisen parameter summed over values for the active phonon frequencies ωi as γi = –d(ln ωi)/d(ln V). CV and B always take positive values, hence variations in the sign of αV arise from corresponding variations in the sign of γ. NTE is often associated with other unusual lattice properties such as negative linear compressibility under applied pressure (Mittal et al., 2018) and pressure-induced softening where dB/dp becomes negative (Dove and Fang, 2016).
Conventional PTE arises because γ is usually positive as a consequence of the shape of the interatomic potential for bonding between two atoms, as shown in Figure 1. Anharmonicity in the shape of the potential leads to an increase in the average interatomic distance as higher vibrational states become more populated as temperature rises. As this pairwise potential shape applies qualitatively to all type of chemical bonding, it might appear that PTE should be a universal behavior, but NTE can arise from two “escapes” that circumvent the latter argument.
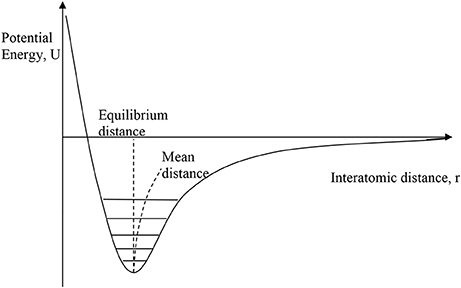
Figure 1. The interatomic bonding potential, showing the variation of potential energy with interatomic distance for a pair of bonded atoms. Vibrational energy levels are quantised and with increasing temperature the occupation of higher levels leads to a slight increase in the mean interatomic distance relative to the minimum–energy equilibrium distance as shown.
The first “escape” from the universal PTE behavior expected from the interatomic potential in Figure 1 arises from the more complex vibrational properties of large arrays of atoms. Figure 2 shows some of the possible motions for a chain of atoms. Longitudinal (L) vibrations in the direction of the bonds (Figure 2A) tend to lengthen the chain as temperature increases through thermal expansion of the individual bonds via the anharmonicity of the interatomic potential (Figure 1). However, transverse (T) motions perpendicular to the direction of the chain tend to shorten the chain–length as the amplitude of vibration increases with temperature (Figures 2B,C) and so can lead to NTE. This is sometimes known as the tension or “guitar string” effect. Lattice vibrations, also known as phonons, are usefully classified as optic (O) with short wavelengths and high frequencies and energies, or acoustic (A) with long wavelengths and low frequencies and energies. Transverse optic (TO) phonons like that shown in Figure 2B lead to large chain shortening (NTE) but may only be excited at high temperatures in view of their high energies, whereas transverse acoustic (TA) modes that lead to more modest NTE are excited at lower temperatures. Detailed theoretical and experimental analyses of phonon spectra are needed to assess the contributions of TO and TA vibrations to the NTE of real materials (Dove and Fang, 2016; Mittal et al., 2018).
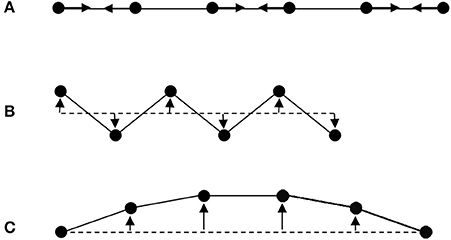
Figure 2. Schematic illustrations of lattice modes for a chain of atoms. (A) Longitudinal optic (LO) mode leading to PTE through asymmetry of the pairwise bonding potential shown in Figure 1. (B) High energy transverse optic (TO) mode that greatly shortens the chain giving large NTE as the vibrational amplitude increases with temperature. (C) Low energy transverse acoustic (TA) mode leading to more modest NTE as temperature increases.
Structural NTE results when the shortening effects of the transverse phonon amplitudes due to bending or torsional motions outweigh the expansion effects of the longitudinal modes. Low atomic connectivity so that atoms have free space to move into during transverse motions leading to large amplitudes is a necessary feature for NTE to prevail. Planar 3-coordination is the maximum connectivity known to lead to negative expansion, as exemplified by graphene sheets of carbon atoms (Yoon et al., 2011). However when these sheets are stacked in the three-dimensional lattice of graphite, conventional PTE arising from soft van der Waals bonding potentials in the stacking (high symmetry) direction gives a large α|| = 23.1 × 10⁻⁶ K−1 that outweighs the NTE in the perpendicular directions (α⊥ = −0.6 × 10⁻⁶ K−1) leading to bulk PTE (αV = α|| + 2α⊥ = 21.9 × 10⁻⁶ K−1) (Morgan, 1972).
Bulk structural NTE requires a large proportion of 2-coordinate linker groups, connecting more highly-coordinated atoms into a three-dimensional structure. Some representative examples of structural NTE material types, with 2-connected linkers underlined, are ScF3, Ag2O, ZrW2O8, ZrV2O7, LiAlSiO4 (the mineral β-eucryptite), zeolitic forms of SiO2 (e.g., ITQ-4) and related AlPO4 (e.g., AlPO4-17) frameworks, Cd(CN)2, Co3[Co(CN)6]2, and metal organic frameworks such as IRMOF-1 (Zn4O(bdc)3, where bdc is 1,4-benzodicarboxylate). These have αV values of magnitude −20 to −120 × 10−6 K−1 over typical temperature ranges of a few hundred K; details and citations are shown in Dove and Fang (2016). All of these materials have the majority of their atoms in the 2-connected linkers. The metal fluoride and oxide examples have 2-coordinate atoms linking tetrahedral or octahedral units together. These polyhedra tend to be rigid so the transverse vibrations of the lattice may be described in the rigid unit mode (RUM) picture (Dove and Fang, 2016).
The importance of the transverse motions of the linker atoms or groups to NTE is further demonstrated by changes observed when additional molecules or ions are inserted into NTE materials. The inserted species within cavities in the structure are adjacent to the linkers and so reduce the amplitudes of their transverse vibrations. Redox insertion of only 6% Li into Fe-doped ScF3 switches the TEC from negative to positive (Chen et al., 2017), and the same change is found when K+ or H2O is inserted into the channels of the cyanide framework material YFe(CN)6 (Gao et al., 2017).
A disparate group of materials, usually dense metal alloys or ceramics, display NTE that is not driven by the structural (transverse vibration) mechanism. Although they have a wide variety of physical properties, and so are sometimes described as having different NTE mechanisms, they have the common feature that NTE results from thermal changes in the interatomic bonding potential, as illustrated in Figure 3. Changes in bonding with temperature such that the interatomic potential becomes more strongly bonding can shift the curve to a smaller equilibrium distance at higher temperature. This may occur through a relatively sharp first order phase transition between two distinct states, or the potential may gradually evolve with changing temperature through a second or higher order transition. When the effect of this “escape” outweighs the usual PTE from the anharmonicity of the potentials then NTE may be observed over temperature range of the crossover.
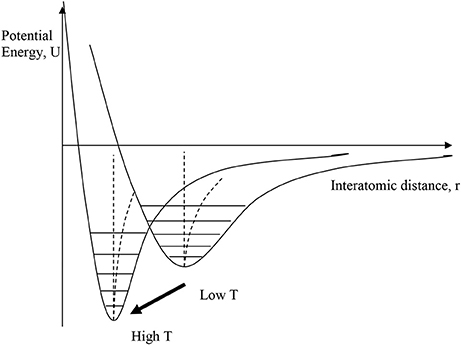
Figure 3. Illustration of electronic mechanisms for NTE, where the interatomic bonding potential changes with temperature, moving to a more strongly bonding curve with smaller equilibrium distance at higher temperature. This may occur through a relatively sharp first order phase transition between two distinct states, or the potential may gradually evolve with changing temperature.
Figure 4 illustrates the schematic changes in lattice volume with temperature for a material displaying electronic NTE. Both the larger-volume low-T and the smaller-volume high-T states shown in Figure 3 display conventional PTE behavior, but the change between them in the crossover region with lower and upper temperatures Tl and Tu leads to NTE. Tu often marks an ordering temperature such as a magnetic or ferroelectric Curie transition, and the lower limit Tl is reached where the order parameter (magnetization or electric polarization) is fully saturated. In other cases such as charge transfer materials, Tl and Tu mark the lower and upper limits of the two-phase region where the low-T and high-T phases coexist. The electronically-induced excess volume ΔVex relative to the extrapolated volume of the high-T state, VHT, may be used to calculate the spontaneous volume striction ΔVex/VHT. Variations in the magnitude of ΔVex and in the separation between Tl and Tu may be used to tune electronic materials from reduced PTE, through ZTE to NTE behavior. A famous material that launched the study of unusual thermal expansion properties is the Invar alloy Fe0.64Ni0.36 named for an invariant length with a very small αL = 1 × 10⁻⁶ K−1 (effectively ZTE) below magnetic TC = 500 K.
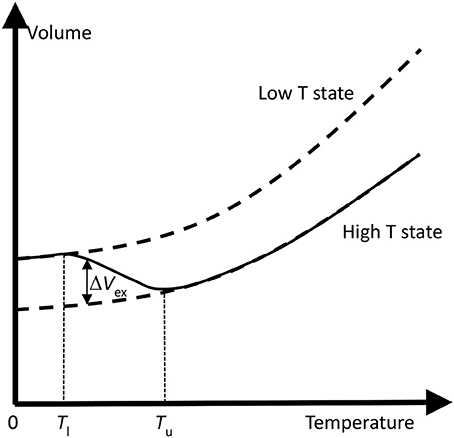
Figure 4. Schematic changes in lattice volume with temperature for a material displaying electronic NTE. The change from the larger-volume low-T to the smaller-volume high-T states (as shown in Figure 3) leads to NTE in the crossover region with lower and upper temperatures Tl and Tu. Tu often marks an ordering temperature such as a magnetic or ferroelectric Curie transition. The electronically-induced excess volume ΔVex relative to the extrapolated volume of the high-T state is shown.
The transitions or changes that give rise to electronic NTE are usually associated with an increase in electron delocalization on passing from the low-T to the high-T phase. The low-T phase is more electron localized or correlated (e.g., magnetically ordered), due to electron-electron repulsions that may be described by the Hubbard U energy, while the more electron delocalized or disordered high-T phase is stabilized by entropy. Electrons near the Fermi level are often in d- or f-states that are non-bonding or weakly antibonding, so their delocalization allows the bonding potential to become more negative and shift to shorter distance as shown in Figure 3.
Classes of materials where electronic NTE is found are;
• Metallic magnets, notably the Invar alloy above, also R2Fe17 (R = rare earth) and related intermetallics, the permanent magnet family R2Fe14B, the Mn3(Cu,Ge)N antiperovskites, and metallic perovskite oxides SrRuO3 and manganites such as La0.8Ba0.2MnO3. NTE is usually observed over a wide temperature range below the magnetic Curie transition.
• Insulating magnets—these generally do not show NTE but some examples are found for frustrated spinels e.g., CdCr2O4 and CdCr2S4, the multiferroic Pb(Fe0.5Nb0.5)O3, and orbitally ordered MnF3, below their Curie or Néel temperatures.
• Charge transfer materials, e.g., Bi0.95La0.05NiO3, LaCu3Fe4O12, Sm0.67Y0.33S, Sm2.75C60, and Yb8Ge3Sb5, can show very large NTE resulting from volume collapses at metal to insulator charge transfer transitions. Bi0.95La0.05NiO3 has αV = −410 × 10−6 K−1 between 300 and 370 K, termed colossal NTE (CNTE). The oxides have intermetallic Bi/Ni or Cu/Fe charge transfer transitions, whereas electrons released through the ionization process R2+ → R3+ + e− in the R = Sm, Yb materials are delocalized in the conduction band at high temperatures. NTE in V2OPO4 where charge ordering occurs without a metal-insulator transition was recently reported (Pachoud et al., 2018).
• Orbital ordering transitions usually associated with first-order Jahn-Teller distortions give rise to NTE in several materials. Ca2RuO4 has orbital order associated with a metal-insulator transition, while insulating LaMnO3 which is much studied as the parent phase of the perovskite manganites undergoes a 0.4% cell volume decrease at 750 K where the orbital order-disorder transition occurs.
• Ferroelectrics associated with off-center displacements of cations to give a net polarization sometimes show NTE below their Curie transitions. Prominent examples are perovskite oxides of lead with transition metal cations showing a second-order Jahn-Teller effect such as PbTiO3, Pb(Mg0.33Ta0.67)O3, and Pb(Fe0.5Nb0.5)O3. Cooling below TC leads to a change from symmetric O–M–O–M–O to asymmetric O……M-O……M-O chains of atoms leading to polarity in the chain direction. The lengthening of O……M bonds where electrons are localized in antibonding states outweighs the shortening of the M-O bonds, leading to a net expansion in the polar chain direction on cooling and hence the excess volume associated with NTE below TC. This can lead to very large volume collapses on warming, for example, Pb0.8Bi0.2VO3 shows ΔV/V = −7.9% around TC ≈ 600 K (Yamamoto et al., 2018).
• Superconductors sometimes show an excess volume and NTE below their critical temperatures Tc, for example in MgB2, La1.85Sr0.15CuO4, and NdFeAsO0.89F0.11. Electron-phonon coupling is directly implicated in the superconducting mechanism for BCS-type MgB2, whereas the latter two materials are unconventional superconductors where a magnetic pairing mechanism may be important. Loss of bonding electron density at the Fermi level due to electron-pairing below Tc is the general cause of NTE in superconductors.
Further details and citations when not shown above are given in the comprehensive review of NTE in functional materials by Chen et al. (2015).
The structural and electronic mechanisms for NTE described above apply to chemically homogenous materials such as a single crystal. However, there are further instances where NTE can arise or differ from the normal bulk behavior due to the specific morphology of the sample.
A variety of materials that show bulk PTE have been found to display NTE when prepared as small particles, usually in the nanoscale regime. For example, the magnetic insulators CuO and MnF2 show PTE in the bulk but as 5 nm particles they display NTE below their Néel temperatures. CuO has a giant NTE of αV = −110 × 10−6 K−1 between 20 and 170 K (Zheng et al., 2008). Nanoparticles of Au (Li et al., 2002) and TiO2 (Zhu et al., 2016) are also reported to display NTE.
The origin of nanoparticle NTE is usually electronic as, for example, the excess volume of CuO particles above follows the general behavior shown in Figure 4. Localization of ordered or correlated states tends to be enhanced at and near surfaces so the associated lattice expansion on cooling can dominate the overall behavior in small particles with a large proportion of surface atoms. The structural NTE mechanism could also play a part as surface atoms have a lower connectivity than the bulk so transverse vibrational amplitudes may be enhanced.
Direct measurement of αV for ceramic samples sometimes gives a more negative value than that expected from crystallographic measurement of the linear TECs. The excess negative expansion is achieved by reducing the volumes of microcracks or voids within the ceramic on heating, as illustrated schematically in Figure 5. Microstructural NTE was reported in an early study of β-eucryptite (LiAlSiO4) (Gillery and Bush, 1959) and very large effects have recently been discovered in Ca2RuO4 (Takenaka et al., 2017a). These ceramic materials both have anisotropic thermal expansion with one strongly negative coefficient that dominates the expansion of their ceramics. For example, on heating from 150 to 340 K, the orthorhombic a, b, and c axes of Ca2RuO4 show length changes of −0.6, −5.0, and +4.5% respectively, so an overall ΔV/V = −1.1% is expected. However an 80% dense ceramic sample gave ΔV/V = −6.7% revealing a substantial microstructural NTE effect.
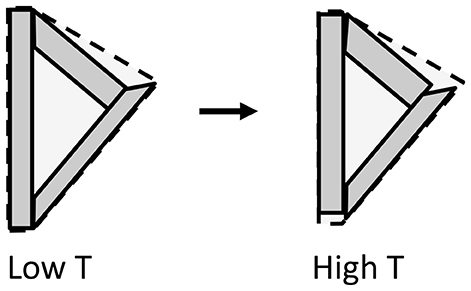
Figure 5. Illustrative two-dimensional model for the microstructural NTE effect, showing three crystallites enclosing a void. The crystallites shown have contracted by 10% along their long axis and expanded by 10% in the perpendicular direction on changing from low T to high T, so their total area has not changed. However, the enclosing area for the ensemble shown by broken lines undergoes an overall decrease of 8%, illustrating how anisotropic thermal expansion may lead to overall NTE.
Anisotropic thermal expansion leads to stresses at grain boundaries that result in microcracking in β-eucryptite ceramics on cooling to room temperature after sintering. Reduction of the microcrack volumes on subsequent heating results in bulk NTE and an enhancement of the excess NTE with increasing grain size (and hence internal microcrack volume) has been established (Pelletant et al., 2012). However, this is less problematic for Ca2RuO4-based ceramics, which have been combined with epoxy resin to generate ZTE materials that are stable to microcracking on thermal cycling (Takenaka et al., 2017b).
Artificial structures consisting of two or more materials with different TECs (which may all be positive) can be engineered to contract when heating. A simple example based on bonded strips of two materials with different positive TECs is shown in Figure 6. The structure contracts on heating through reduction of the volume of internal voids, which outweighs the increase in volume of the materials themselves. Designs for three-dimensional cellular metamaterials with varying TECs based on the use of such bimaterial connectors were proposed by Lakes (2007).
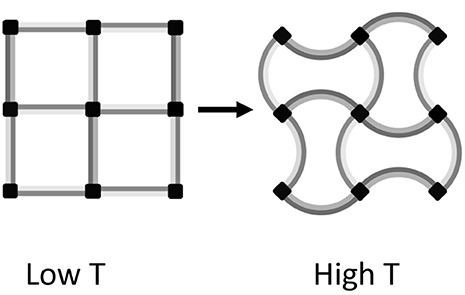
Figure 6. Illustrative two-dimensional example of an NTE metamaterial consisting of a square lattice of bimaterial strips acting as struts between 4-connected nodes. On heating from the low T to the high T state, the light and dark gray materials respectively expand in length by 6 and 17%, but the separation between nodes decreases by 4% corresponding to an 8% area contraction. Hence the metamaterial consisting of only PTE substances shows bulk NTE.
Recent developments in additive manufacturing through three-dimensional printing technologies have enabled metamaterials with bulk NTE to be generated. In a recent example, a two-component polymer metamaterial showed bulk negative expansion with αL = −50 × 10−6 K−1 although the individual components had PTE with an average αL = 40 × 10−6 K−1 (Qu et al., 2017).
Although many diverse examples of NTE materials are reported, they may be classified according to two types of intrinsic mechanism. Electronic NTE arises from reduction in first-neighbor distances upon heating due to changes in the interatomic potential. These changes may arise from a variety of physical property transitions such as magnetism, charge transfer, ferroelectricity, and superconductivity that alter the distribution of electron density. Structural NTE occurs through reduction in second- or higher- neighbor distances upon heating due to dominant effects of transverse vibrations such as bending or torsional modes, and is found in many framework-type materials with a high proportion of 2-connected linkers.
The intrinsic NTE mechanisms may be enhanced in nanoparticles, most likely through electronic effects from localization of ordered or correlated states near surfaces. Further morphological mechanisms for NTE of bulk artifacts result from reducing the volume of internal voids upon heating. Microstructural NTE is found for ceramics of materials having anisotropic thermal expansion coefficients. Artificial structures of substances with different expansion coefficients may be used to generate metamaterials with NTE even when the individual components have PTE behavior.
The author confirms being the sole contributor of this work and approved it for publication.
The author acknowledges financial support from EPSRC.
The author declares that the research was conducted in the absence of any commercial or financial relationships that could be construed as a potential conflict of interest.
This paper is based upon a talk presented at the 2nd International Symposium on Negative Thermal Expansion and Related Materials (ISNTE-II) at Tokyo Institute of Technology, Yokohama, Japan in December 2017. The author thanks the organizers and participants for their contributions that helped to shape the ideas presented in this paper.
Chen, J., Gao, Q., Sanson, A., Jiang, X., Huang, Q., Carnera, A., et al. (2017). Tunable thermal expansion in framework materials through redox intercalation. Nat. Commun. 8:14441. doi: 10.1038/ncomms14441
Chen, J., Hu, L., Deng, J., and Xing, X. (2015). Negative thermal expansion in functional materials: controllable thermal expansion by chemical modifications. Chem. Soc. Rev. 44, 3522–3567. doi: 10.1039/C4CS00461B
Dove, M. T., and Fang, H. (2016). Negative thermal expansion and associated anomalous physical properties: review of the lattice dynamics theoretical foundation. Rep. Prog. Phys. 79:066503. doi: 10.1088/0034-4885/79/6/066503
Gao, Q., Chen, J., Sun, Q., Chang, D., Huang, Q., Wu, H., et al. (2017). Switching between giant positive and negative thermal expansions of a YFe(CN)6-based Prussian blue analogue induced by guest species. Angew. Chem. Int. Ed. 56, 9023–9028. doi: 10.1002/anie.201702955
Gillery, F. H., and Bush, E. A. (1959). Thermal contraction of β-eucryptite-. (Li2O.Al2O3.2SiO2) by X-ray and dilatometer methods. J. Am. Cer. Soc. 42, 175–177. doi: 10.1111/j.1151-2916.1959.tb12942.x
Lakes, R. (2007). Cellular solids with tunable positive or negative thermal expansion of unbounded magnitude. Appl. Phys. Lett. 90:221905. doi: 10.1063/1.2743951
Li, W. H., Wu, S. Y., Yang, C. C., Lai, S. K., Lee, K. C., Huang, H. L., et al. (2002). Thermal contraction of Au nanoparticles. Phys. Rev. Lett. 89:135504. doi: 10.1103/PhysRevLett.89.135504
Lind, C. (2012). Two decades of negative thermal expansion research: where do we stand? Materials 5, 1125–1154. doi: 10.3390/ma5061125
Liu, Z., Gao, Q., Chen, J., Deng, J., Lin, K., and Xing, X. R. (2018). Negative thermal expansion in molecular materials. Chem. Commun. 54, 5164–5176. doi: 10.1039/C8CC03219J
Mary, T. A., Evans, J. S. O., Vogt, T., and Sleight, A. W. (1996). Negative thermal expansion from 0.3 to 1050 Kelvin in ZrW2O8. Science 272, 90–92. doi: 10.1126/science.272.5258.90
Mittal, R., Gupta, M. K., and Chaplot, S. L. (2018). Phonons and anomalous thermal expansion behavior in crystalline solids. Prog. Materials Sci. 92, 360–445. doi: 10.1016/j.pmatsci.2017.10.002
Morgan, W. C. (1972). Thermal expansion coefficients of graphite crystals. Carbon 10, 73–79. doi: 10.1016/0008-6223(72)90011-5
Pachoud, E., Cumby, J., Lithgow, C. T., and Attfield, J. P. (2018). Charge order and negative thermal expansion in V2OPO4. J. Am. Chem. Soc. 140, 636–641. doi: 10.1021/jacs.7b09441
Pelletant, A., Reveron, H., Chêvalier, J., Fantozzi, G., Blanchard, L., Guinot, F., et al. (2012). Grain size dependence of pure β-eucryptite thermal expansion coefficient. Mater. Lett. 66, 68–71. doi: 10.1016/j.matlet.2011.07.107
Qu, J., Kadic, M., Naber, A., and Wegener, M. (2017). Micro-structured two-component 3D metamaterials with negative thermal-expansion coefficient from positive constituents. Sci. Rep. 7:40643. doi: 10.1038/srep40643
Takenaka, K. (2012). Negative thermal expansion materials: technological key for control of thermal expansion. Sci. Technol. Adv. Mater. 13:013001. doi: 10.1088/1468-6996/13/1/013001
Takenaka, K., Okamoto, Y., Shinoda, T., Katayama, N., and Sakai, Y. (2017a). Colossal negative thermal expansion in reduced layered ruthenate. Nature Comm. 8:14102. doi: 10.1038/ncomms14102
Takenaka, K., Shinoda, T., Inoue, N., Okamoto, Y., Katayama, N., Sakai, Y., et al. (2017b). Giant negative thermal expansion in Fe-doped layered ruthenate ceramics. Appl. Phys. Express 10:115501. doi: 10.7567/APEX.10.115501
Yamamoto, H., Imai, T., Sakai, Y., and Azuma, M. (2018). Colossal negative thermal expansion in electron-doped PbVO3 perovskites. Angew. Chem. Int. Ed. 57, 1–5. doi: 10.1002/anie.201804082
Yoon, D., Son, Y. W., and Cheong, H. (2011). Negative thermal expansion coefficient of graphene measured by Raman spectroscopy. Nano Lett. 11, 3227–3231. doi: 10.1021/nl201488g
Zheng, X. G., Kubozono, H., Yamada, H., Kato, K., Ishiwata, Y., and Xu, C. N. (2008). Giant negative thermal expansion in magnetic nanocrystals. Nature Nat. Nanotechnol. 3, 724–726. doi: 10.1038/nnano.2008.309
Keywords: thermal expansion, negative thermal expansion, thermal expansion coefficient, structural NTE, electronic NTE, morphological NTE
Citation: Attfield JP (2018) Mechanisms and Materials for NTE. Front. Chem. 6:371. doi: 10.3389/fchem.2018.00371
Received: 21 June 2018; Accepted: 02 August 2018;
Published: 22 August 2018.
Edited by:
Andrea Sanson, Università degli Studi di Padova, ItalyReviewed by:
Angus Wilkinson, Georgia Institute of Technology, United StatesCopyright © 2018 Attfield. This is an open-access article distributed under the terms of the Creative Commons Attribution License (CC BY). The use, distribution or reproduction in other forums is permitted, provided the original author(s) and the copyright owner(s) are credited and that the original publication in this journal is cited, in accordance with accepted academic practice. No use, distribution or reproduction is permitted which does not comply with these terms.
*Correspondence: J. Paul Attfield, ai5wLmF0dGZpZWxkQGVkLmFjLnVr
Disclaimer: All claims expressed in this article are solely those of the authors and do not necessarily represent those of their affiliated organizations, or those of the publisher, the editors and the reviewers. Any product that may be evaluated in this article or claim that may be made by its manufacturer is not guaranteed or endorsed by the publisher.
Research integrity at Frontiers

Learn more about the work of our research integrity team to safeguard the quality of each article we publish.