
95% of researchers rate our articles as excellent or good
Learn more about the work of our research integrity team to safeguard the quality of each article we publish.
Find out more
ORIGINAL RESEARCH article
Front. Cell Dev. Biol. , 11 August 2020
Sec. Cellular Biochemistry
Volume 8 - 2020 | https://doi.org/10.3389/fcell.2020.00768
This article is part of the Research Topic Lipid-Protein Mesophases and Cell Organelle Ultrastructure in Health and Disease View all 17 articles
Amyloid-beta (Aβ) is produced by the cleavage of amyloid precursor proteins in the cell membrane by β-secretase and γ-secretase into a monomeric form with peptides of different lengths such as Aβ1–40 or Aβ1–42, which is then transformed into oligomeric and fibril forms and is considered to be one of the hallmarks of Alzheimer’s disease (AD). The plasma concentrations of Aβ1–40 and Aβ1–42 are unstable after blood samples have been obtained. In order to examine the dynamic changes of plasma Aβ1–42 and Aβ1–40 in blood samples, we used fresh blood samples in ethylenediaminetetraacetic acid tubes from 32 clinically diagnosed AD patients. Each sample was subdivided into eight sub-samples, and levels of Aβ1–40 and Aβ1–42 were measured at 0 (baseline), 0.5, 1, 2, 3, 5, 8, and 24 h, respectively. All samples were incubated at 37°C before being measuring. The results showed that compared to baseline, 87.5 and 62.5% of the patients had higher plasma levels of Aβ1–42 and Aβ1–40 at 24 h, respectively. The patients with an increased amyloid level did not have a significantly different apo-lipoprotein E4 allele (APOE4) gene status for either Aβ1–40 (p = 0.422) or Aβ1–42 (p = 1.000). However, for plasma Aβ1–42, the APOE4 carriers had a significantly lower level than the non-carriers at baseline [31.2 ± 6.5 (mean ± SD) ng/ml vs. 50.4 ± 47.7 ng/ml, p = 0.031] and 0.5 h (37.5 ± 7.6 ng/ml vs. 51.9 ± 30.8 ng/ml, p = 0.043). There were no significant differences between the APOE4 carriers and non-carriers in plasma Aβ1–42 concentration at 1, 2, 3, 5, 8, and 24 h (p = 0.112, p = 0.086, p = 0.112, p = 0.263, p = 0.170 and p = 0.621, respectively). The Aβ1–40 level was related to disease severity as assessed using the clinical dementia rating (CDR) scale. Patients with advanced stages of dementia (CDR = 1 and CDR = 2) had a significantly higher Aβ1–40 level compared to those with very mild stage dementia (CDR = 0.5) at all time points (p < 0.05) except for 24 h (p = 0.059). Our findings illustrate the effects of APOE4 status on dynamic changes in plasma Aβ1–40 and Aβ1–42 levels, and significant associations between Aβ1–40 level and disease severity. Further studies are needed to investigate the exact mechanisms of how APOE4 affects the dynamic changes in plasma Aβ1–40 and Aβ1–42, and the association between Aβ1–40 and advanced dementia.
As people age, the aging process, cardiovascular disease (Prince, 2015; Yang et al., 2018) and other factors (Winblad et al., 2016; Yang et al., 2019) may increase the risk of Alzheimer’s disease (AD). It has been estimated that 46.8 million people worldwide were living with dementia in 2015, and this number is expected to reach 74.7 million by 2030 and 131.5 million by 2050 (Hebert et al., 2004; Prince, 2015). AD is the most common form of dementia worldwide (Hebert et al., 2004; Prince, 2015; Yang et al., 2019). The neuropathological hallmarks of AD are formations of senile plaques composed of amyloid-beta (Aβ) peptides and neurofibrillary tangles consisting of abnormal deposition of tau protein in the brain (Karn et al., 2007; Tapiola et al., 2009). Aβ is produced by the cleavage of amyloid precursor proteins into a monomeric form with peptides of different lengths by β-secretase and γ-secretase, which is then transformed into oligomeric and fibril forms, and eventually into amyloid plaques (Haass and Selkoe, 2007; Tapiola et al., 2009) in brain tissue. Aβ1–42 and Aβ1–40 in cerebrospinal fluid (CSF) are regarded to be biomarkers in the diagnosis of AD (Strozyk et al., 2003; Tapiola et al., 2009), although consensus with regards to the standard procedures for detecting Aβ1–42 and Aβ1–40 concentrations in CSF is currently lacking. Moreover, given the invasiveness of obtaining CSF for examinations and inter-laboratory variability in the detection of Aβ1–42 and Aβ1–40 concentrations (Mattsson et al., 2010, 2012, 2013), CSF examinations for Aβ1–40 and Aβ1–42 level are not always practical.
To overcome this problem, many researchers have focused on identifying blood-based biomarkers for AD, however the results have been inconsistent (van Oijen et al., 2006). van Oijen et al. (2006) reported that a higher Aβ1–40 concentration but not Aβ1–42 or Aβ1–40/Aβ1–42 ratio was associated with a higher risk of AD. In addition, several studies have reported that a higher plasma Aβ1–42 level was mildly associated with AD, but that this association was not found in subsequent longitudinal examinations of Aβ1–40, Aβ1–42 level, or its ratio (Lopez et al., 2008; Mayeux and Schupf, 2011). These discrepant results may be due to several causes. First, it is not currently known whether plasma Aβ1–40 or Aβ1–42 peptides in AD patients originate from the brain, peripheral tissues or both sources (Kuo et al., 1999). Second, variations in laboratory protocols for handling samples of Aβ1–40 and Aβ1–42, and the physicochemical properties of Aβ1–40 and Aβ1–42 peptides. However, supporting evidence for these hypotheses is currently lacking (Mattsson et al., 2011; Rissman et al., 2012).
Enzyme-linked immunosorbent assay (ELISA) has been reported to be a standardized method for the quantification of Aβ1–40 and Aβ1–42 in clinical studies as biomarkers of AD (Mattsson et al., 2012). In a comparison study of different immunoassay platforms, the Alzheimer’s Association quality-control program (Mattsson et al., 2013) reported 20–30% within- and between-laboratory variability in the quantification of Aβ1–42 and Aβ1–40. A consensus with regards to the protocol for the ELISA quantification of Aβ1–42 and Aβ1–40 is still lacking.
Confounding factors for ELISA measurements include automatic plate washing, the use of polypropylene plates for pre-incubation, and the duration of sample thawing at room temperature. ELISA usually uses samples that are thawed at room temperature before being measured, which does not accurately reflect the condition in human blood, at around 37°C. In addition, the duration of sample thawing at room temperature may be associated with changes in the concentration of amyloid peptides because the process of amyloid aggregation from monomers to oligomers or fibrils is continuous, and some peptides would degrade over time.
The aim of this study was to understand the actual status of Aβ1–40 and Aβ1–42 in human blood and the possible changes in Aβ1–40 and Aβ1–42 during the measuring process in relation to other factors such as apo-lipoprotein E gene (APOE) status (Kang et al., 2015) and disease severity. We examined the concentrations of plasma Aβ1–40 and Aβ1–42 at different time points and assessed their associations with APOE genetic status and disease severity in fresh blood samples obtained from AD patients.
All patients diagnosed with AD were recruited from the Department of Neurology, Kaohsiung Municipal Ta-Tung Hospital, an area hospital in southern Taiwan. The diagnosis of AD was based on the NINCDS-ADRDA criteria (McKhann et al., 2011), and involved a series of comprehensive neuropsychological tests, including the Mini-Mental State Examination (MMSE) derived from the Cognitive Abilities Screening Instrument (CASI) (Lin et al., 2002), CASI, and Clinical Dementia Rating (CDR) scale (Morris, 1991). Patients with other conditions possibly contributing to the diagnosis of AD were excluded.
All procedures were approved by the Kaohsiung Medical University Hospital Institutional Review Board, and written informed consent was obtained from all participants or their legal representatives. For each recruited AD patient, a series of neuropsychological assessments, including the MMSE, CASI, and CDR, were administered every 12 months to trace the clinical outcomes. The MMSE, CASI, and CDR were conducted by a senior neuropsychologist and an experienced physician based on information from a knowledgeable collateral source (usually a spouse or adult child).
For every AD patient, restriction enzyme isotyping of the APOE allele was performed following a modification of the protocol developed by Pyrosequencing1. In brief, 10 ng of DNA was amplified in a 20 μL reaction volume in which dGTP was replaced by a mixture of 25% dGTP and 75% dITP to facilitate analysis of the GC-rich fragment. A 276-bp fragment was generated using the forward primer AGA CGC GGG CAC GGC TGT and reverse biotin-labeled primer CTC GCG GAT GGC GCT GAG. Single-strand DNA was prepared using streptavidin coated beads, and APOE gene variants at codons 112 and 158 were sequenced using the following primers and dispensation order: SNP112 GAC ATG GAG GAC GTG and SNP158 CCG ATG ACC TGC AGA and dispensation order GCTGAG CTAGCGT. Individuals with one or two copies of the APOE4 allele were considered to be APOE4 positive [APOE4(+)], and otherwise APOE4 negative [APOE4(−)].
Venous blood was drawn by venipuncture in the morning after an overnight fast. Plasma samples were collected in ethylenediaminetetraacetic acid (EDTA) vacutainers, which were immediately centrifuged for 10 min at 3000 rpm. After centrifugation, each sample was divided into eight sub-samples and incubated at 37°C. Aβ1–42 and Aβ1–40 levels were measured in the eight sub-samples at different time points, including baseline (0 h), immediately after obtaining the blood sample (0.5 h), and then at 1, 2, 3, 5, 8, and 24 h, respectively. All samples were incubated at 37°C before being measured. An increase in Aβ1–42 or Aβ1–40 level was defined according to the difference in concentration between baseline and 24 h. If the 24-h concentration was higher/lower than the baseline level, the patient was defined as having an increase/decrease in Aβ1–42 or Aβ1–40. Quantification of Aβ1–42 and Aβ1–40 in plasma was performed using a specific ELISA kit (Human Amyloid β(1–40) Assay Kit – IBL, code number 27713; and Human Amyloid β(1–42) Assay Kit – IBL, code number 27711). All assays were performed according to the manufacturer’s protocol. All reagents were prepared at room temperature (20–25°C) approximately 30 min before use.
Data analysis was performed using SPSS statistical software (Standard version 11.5.0; SPSS Inc., Chicago, IL, United States). All statistical tests were two-tailed, and p > 0.05 was taken to indicate significance. Age, education, CASI, MMSE, Aβ1–42, and Aβ1–40 were treated as continuous variables, and sex, APOE4 status, CDR, increase in Aβ1–40 and increase in Aβ1–42 were treated as categorical variables.
Independent t-tests for the two independent groups [APOE4(+) and APOE4(−) groups] were used to assess differences in plasma concentrations of Aβ1–42 and Aβ1–40. Repeated measures ANOVA was used to examine differences in Aβ1–42 and Aβ1–40 across all eight sub-samples.
In total, 32 AD patients were recruited into the study. The mean (±SD) age of the patients was 77.7 ± 7.3 years, and 28.1% were APOE4(+) (Table 1). Each patient had eight samples in which plasma Aβ1–42 and Aβ1–40 levels were measured at different time points. Compared to the baseline level, 87.5 and 62.5% of the patients had an increase in plasma Aβ1–42 and Aβ1–40 levels at 24 h, respectively (Table 1). Other clinical and demographic characteristics are shown in Table 1.
The mean baseline level of plasma Aβ1–40 was 314.1 ± 178.9 pg/ml, compared to 320.3 ± 157.9 pg/ml at 24 h. Overall, 62.5% of the patients had an increase in the level of plasma Aβ1–40 at 24 h (Table 2 and Figure 1). There was no significant difference in the ratio of AD patients having an increase in Aβ1–40 level between the APOE4(+) and APOE4(−) groups (p = 0.422).

Table 2. Plasma concentration of amyloid β1–40 (Aβ1–40) by time in the patients with Alzheimer’s disease.
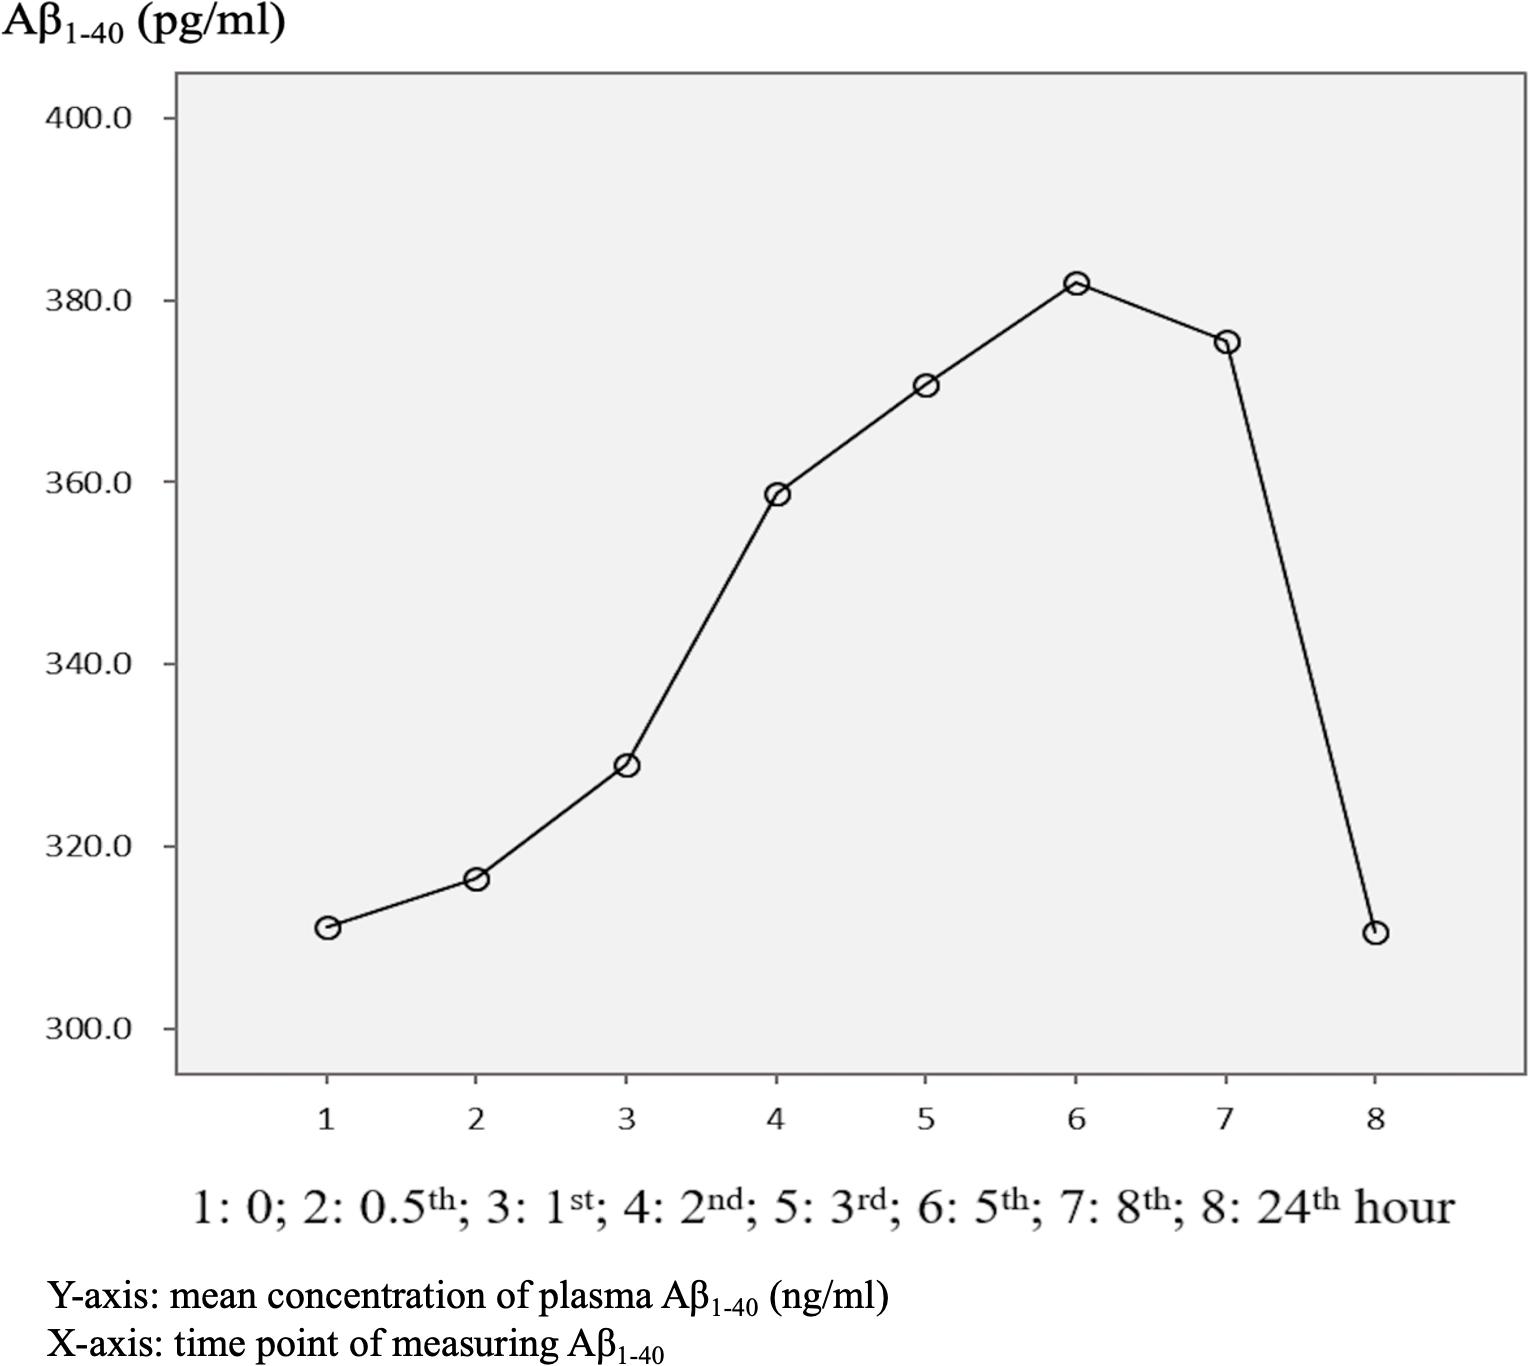
Figure 1. Overview of mean plasma beta-amyloid1–40 (Aβ1–40) concentration in AD patients (N = 32) in relation to time.
There were significant differences in Aβ1–40 level at all time points, and the concentration for any one was significantly different to the others (p = 0.001). However, there were no significant differences in Aβ1–40 level at any time point between the APOE4(+) and APOE4(−) groups (p = 0.386–1.000) (Table 2 and Figure 2). In addition, there were significant differences in Aβ1–40 level according to disease severity at all time points (p = 0.008–0.024) except for 24 h (p = 0.059) (Table 2). The patients with very mild stage dementia (CDR = 0.5) had a lower Aβ1–40 level compared to those with an advanced stage of dementia (CDR > 0.5) (Table 2 and Figure 3).
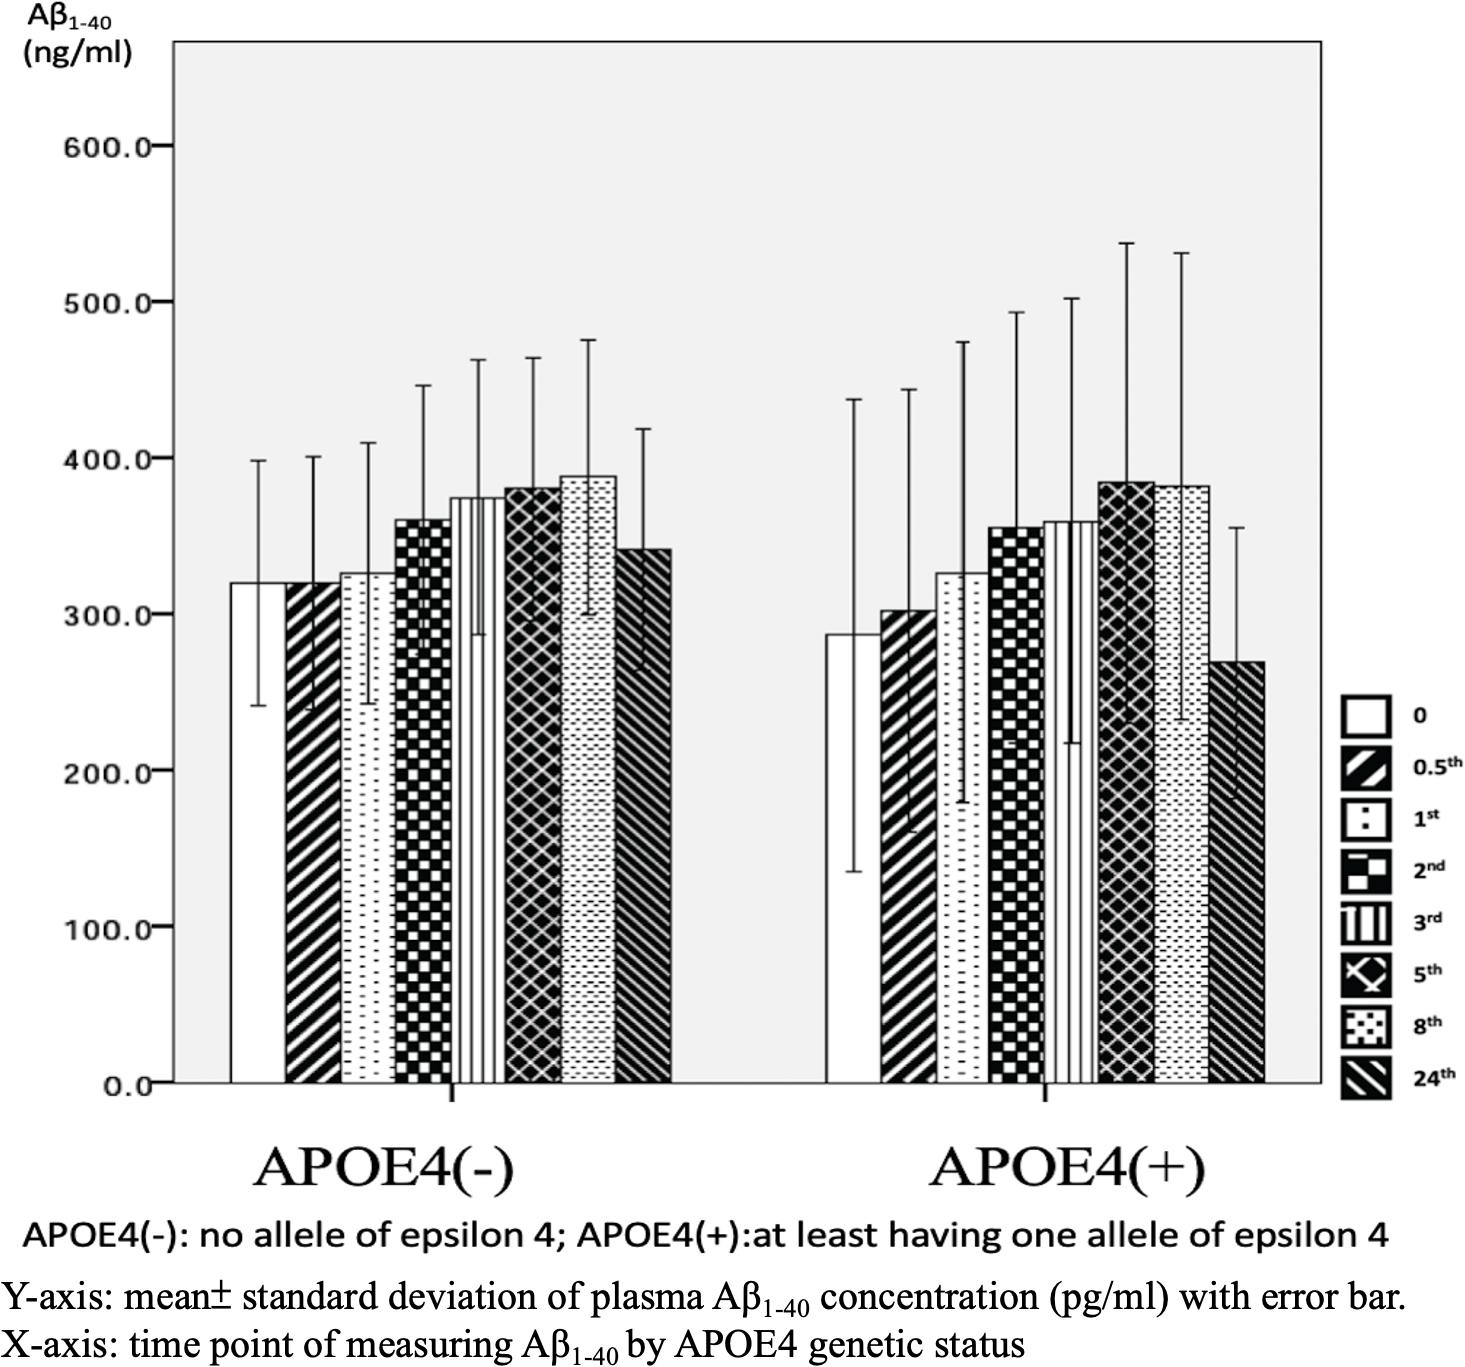
Figure 2. Plasma concentration of beta-amyloid1–40 (Aβ1–40) at different time point by apolipoprotein E4 (APOE4) genetic status (N = 32).
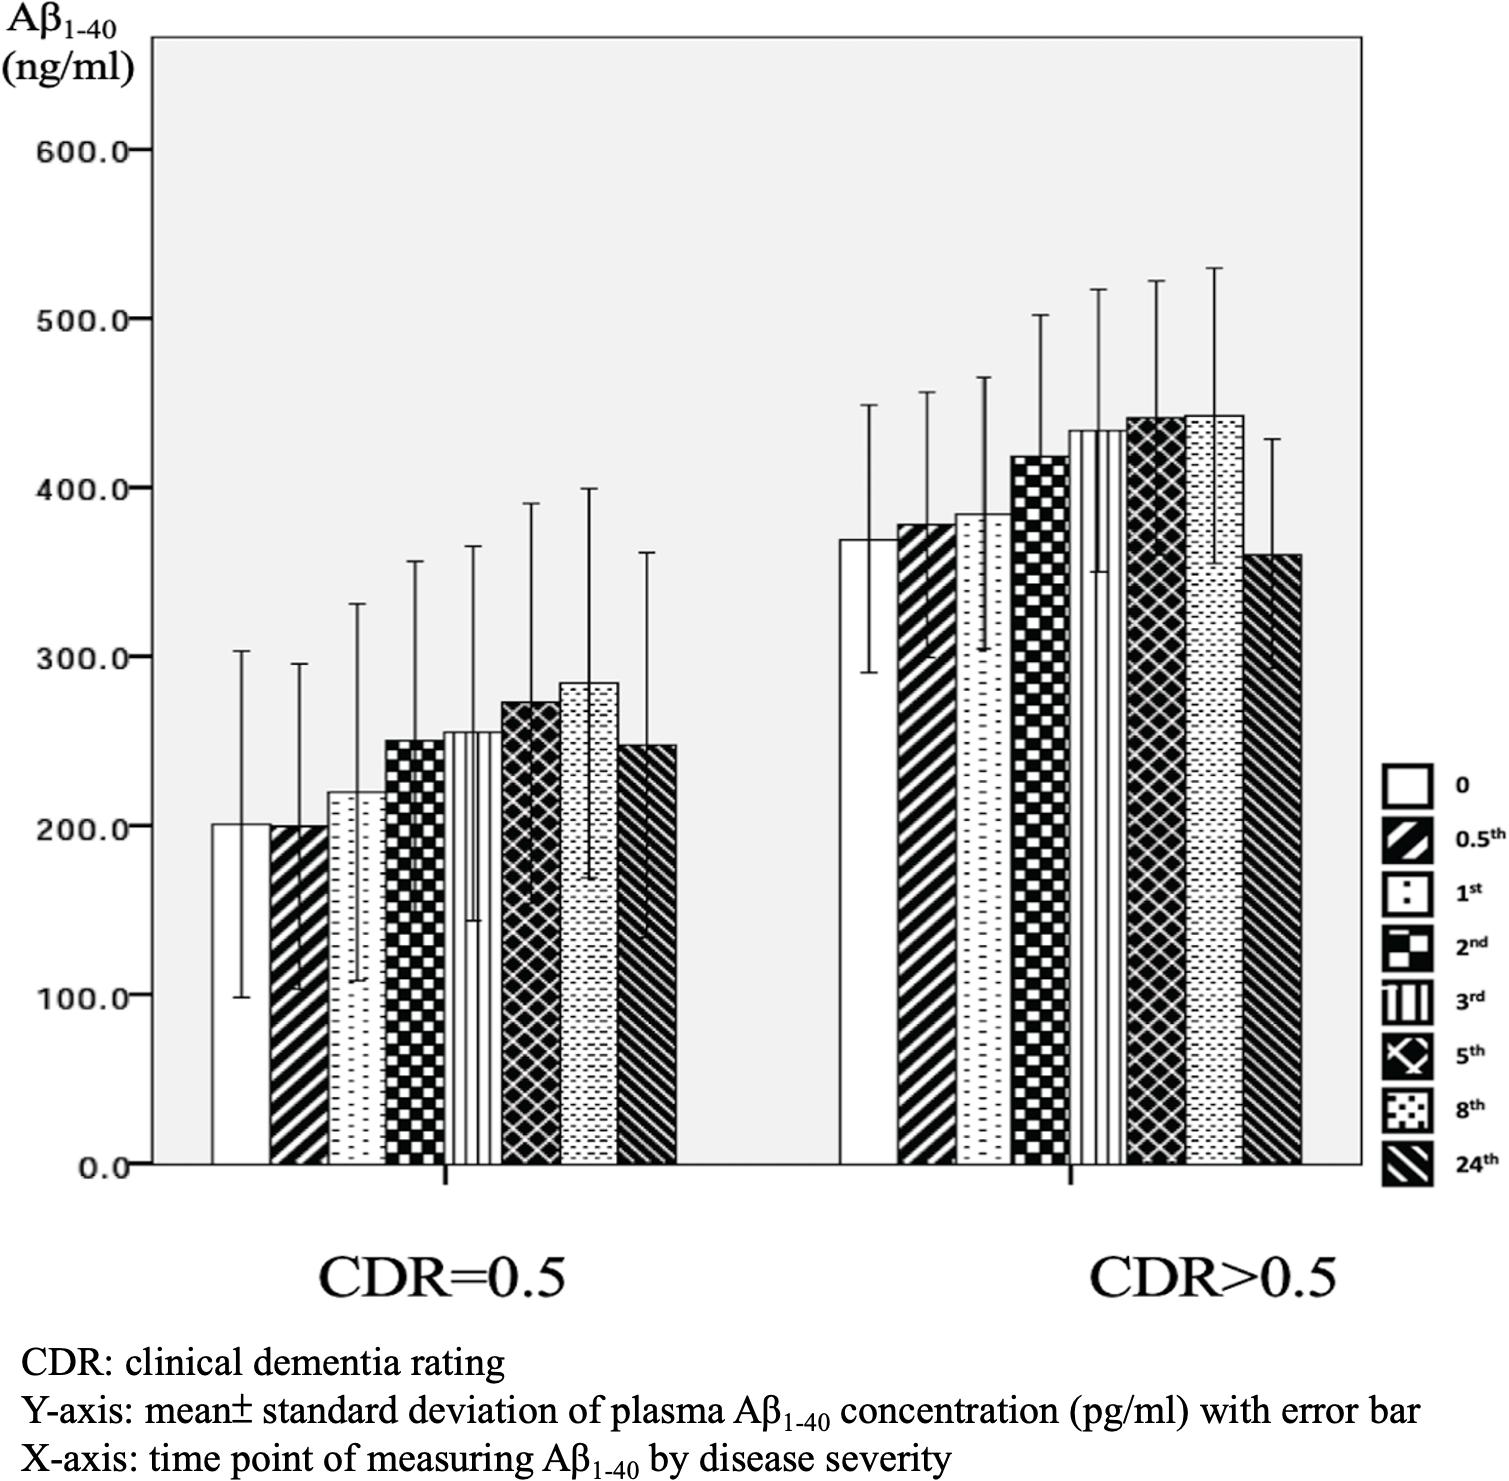
Figure 3. Plasma concentration of beta-amyloid1–40 (Aβ1–40) at different time point by disease severity (N = 32).
The mean baseline plasma Aβ1–42 level was 45.0 ± 41.3 pg/ml, compared to 63.6 ± 59.4 pg/ml at 24 h. Compared to the baseline level, 87.5% of the patients had an increase in the level at 24 h (Table 3 and Figure 4). There was no significant difference in the ratio of AD patient having an increase in Aβ1–40 level between the APOE4(+) and APOE4(−) groups (p = 1.000).

Table 3. Plasma concentration of amyloid β1–42 (Aβ1–42) by time in the patients with Alzheimer’s disease.
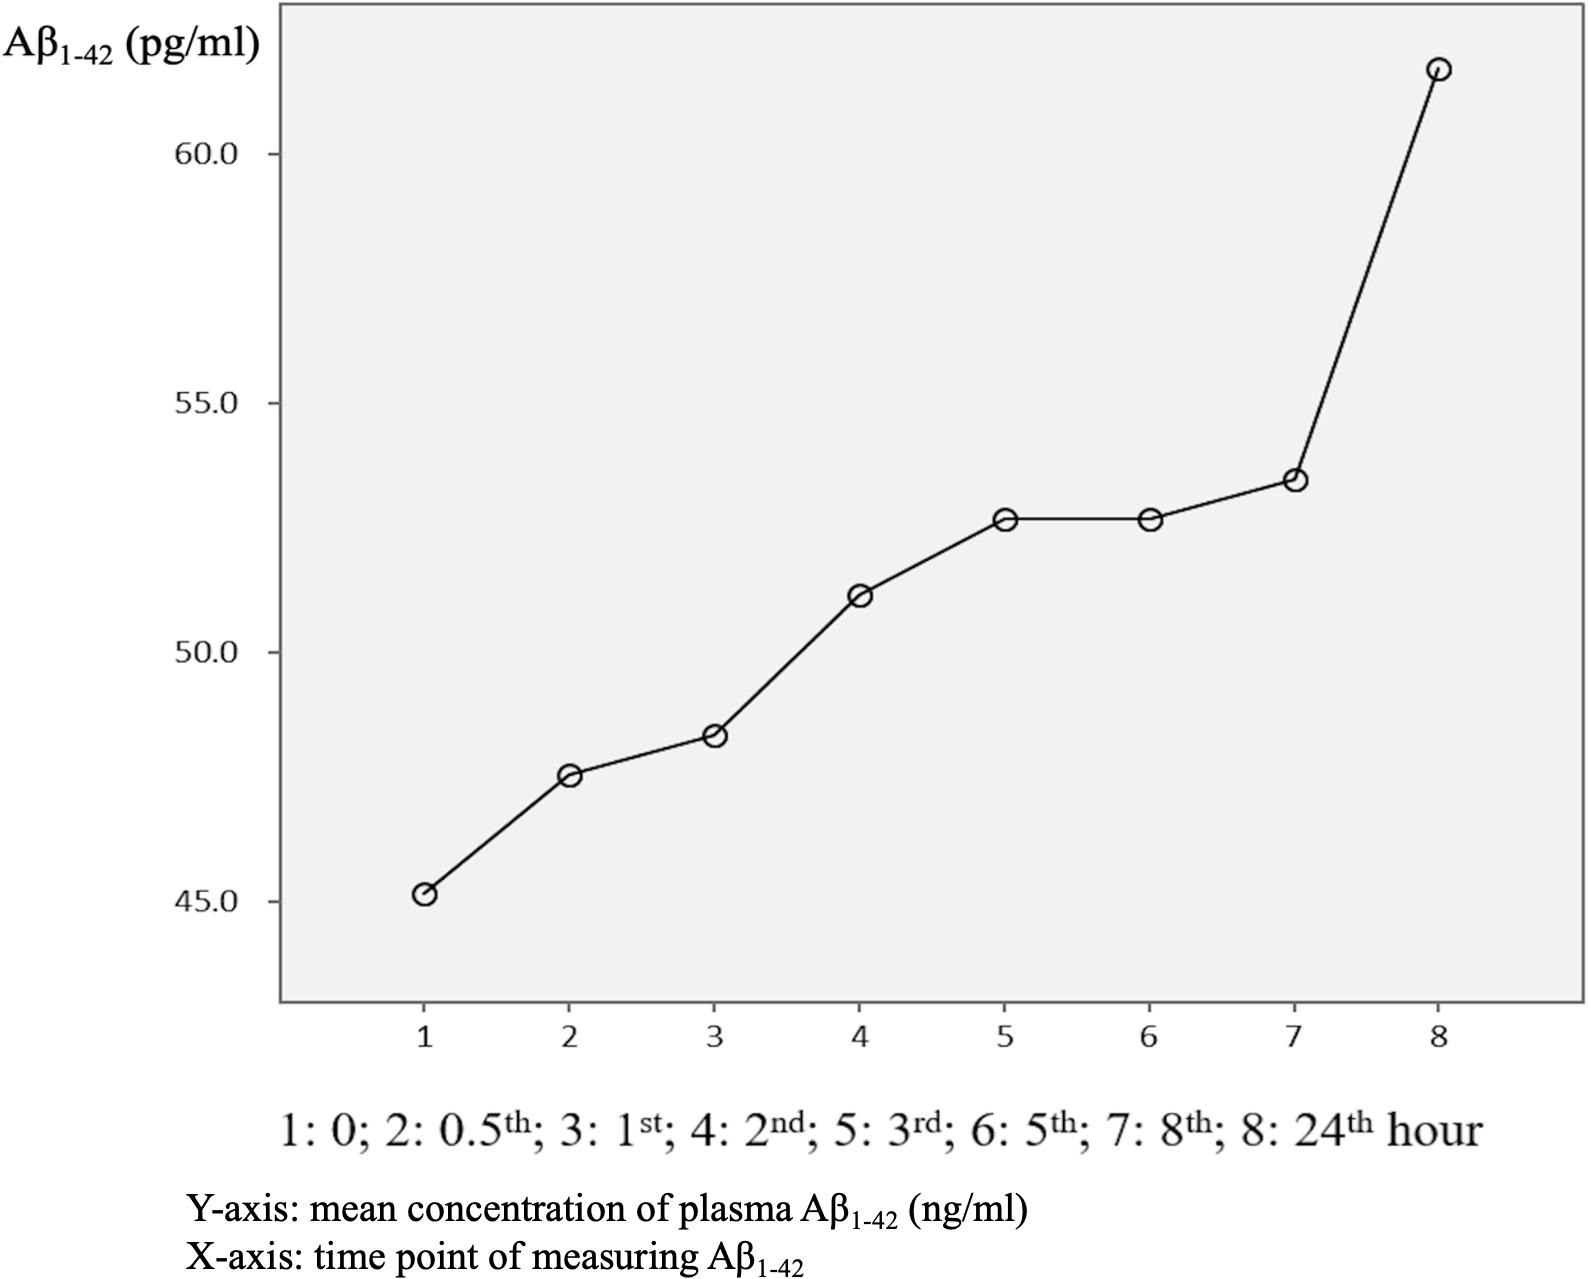
Figure 4. Overview of mean plasma beta-amyloid1–40 (Aβ1–40) concentration in AD patients (N = 32) in relation to time.
There were significant differences in Aβ1–42 level at all time points, and the concentration for any one was significantly different to the others (p = 0.042). There were significant differences between the APOE4(+) and APOE4(−) groups in Aβ1–42 level at baseline (31.2 ± 6.5 pg/ml vs. 50.4 ± 47.7 pg/ml, p = 0.031) and 0.5 h (37.5 ± 7.6 pg/ml vs. 51.9 ± 30.8 pg/ml, p = 0.043). Apart from these two time points, there were no significant differences in the other time points between the APOE4(+) and APOE4(−) groups (p = 0.086–0.621) (Table 3 and Figure 5). There were also no significant differences in Aβ1–42 level at any time point by disease severity (p = 0.427–0.867) (Table 3 and Figure 6). We also analyzed the associations between the Aβ1–40/Aβ1–42 ratio and APOE4 genotypes and disease severity at all time points, and the results were similar to those for Aβ1–40 and Aβ1–42 alone. Aβ1–40/Aβ1–42 ratio was not significantly associated with APOE4(+) status or disease severity at any of the eight time points (all p > 0.05).
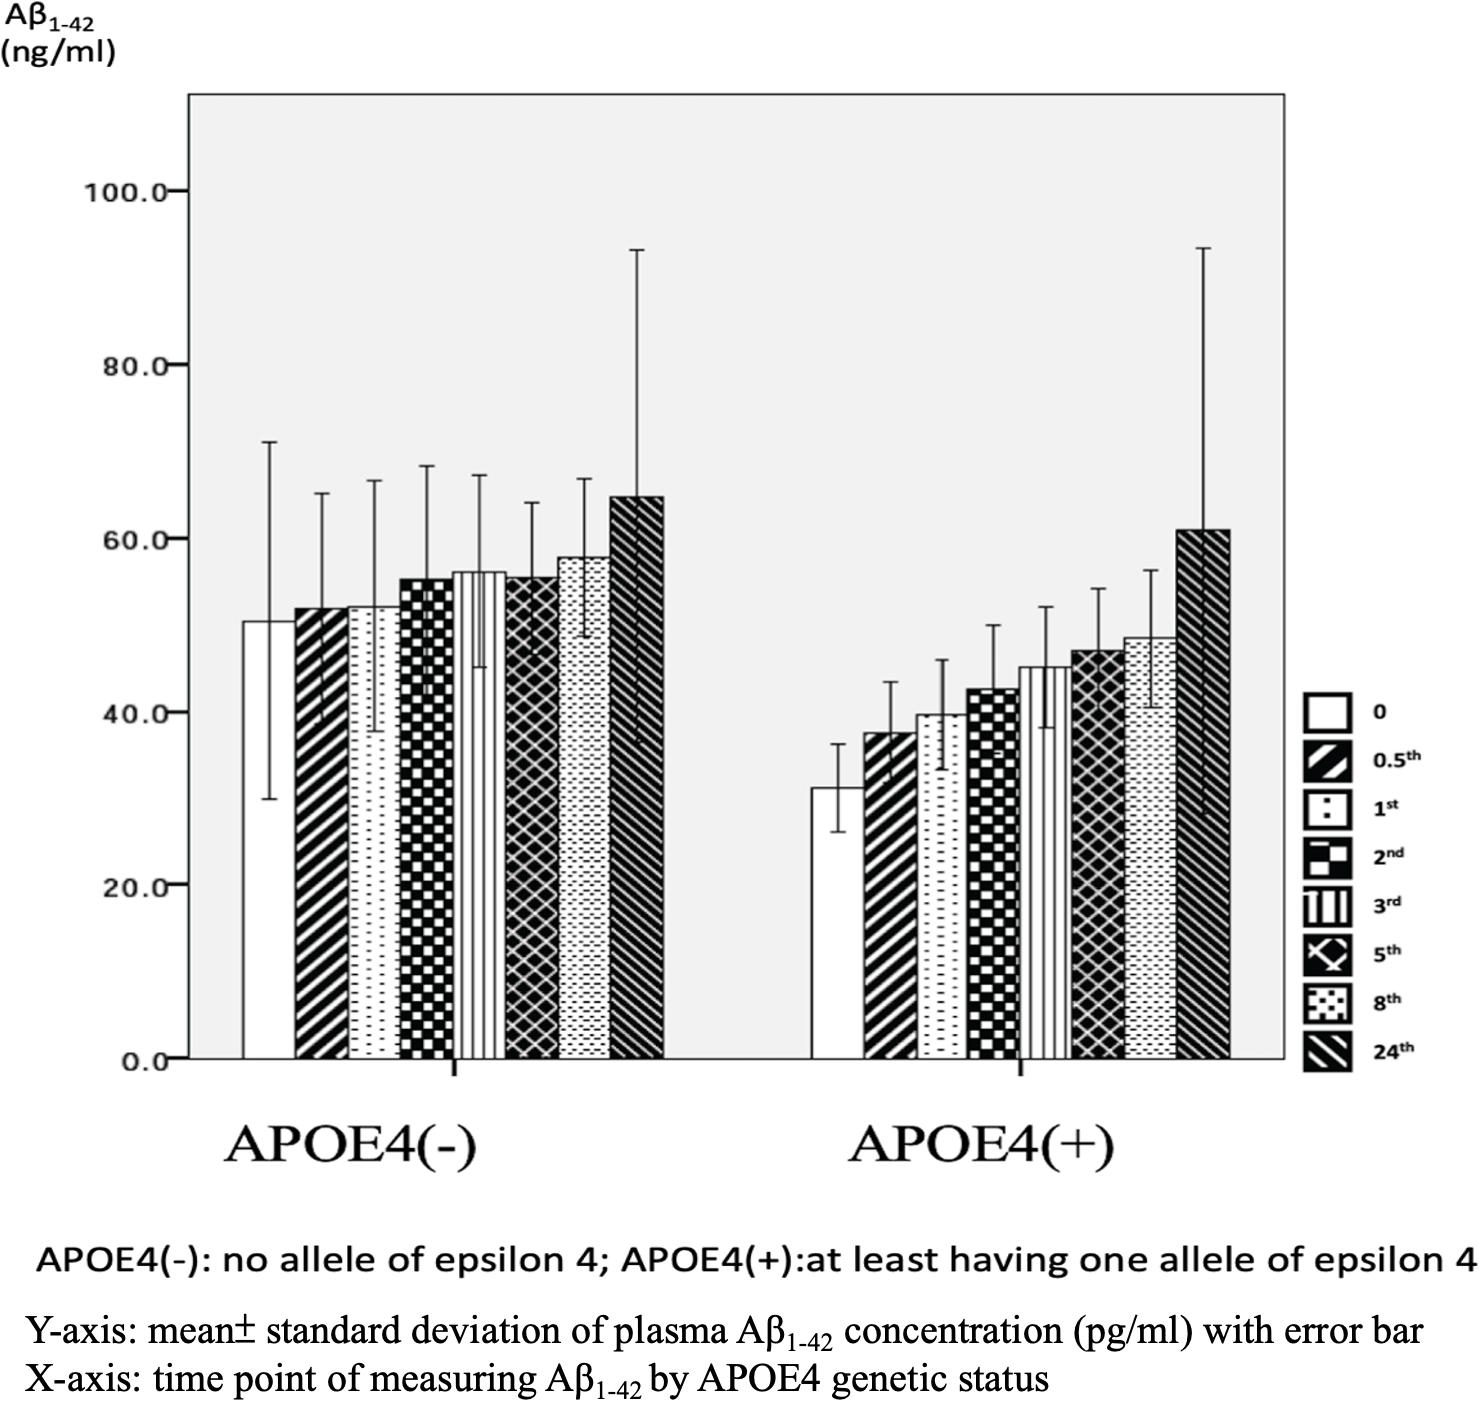
Figure 5. Plasma concentration of beta-amyloid1–42 (Aβ1–42) at time point by apolipoprotein E4 (APOE4) genetic status (N = 32).
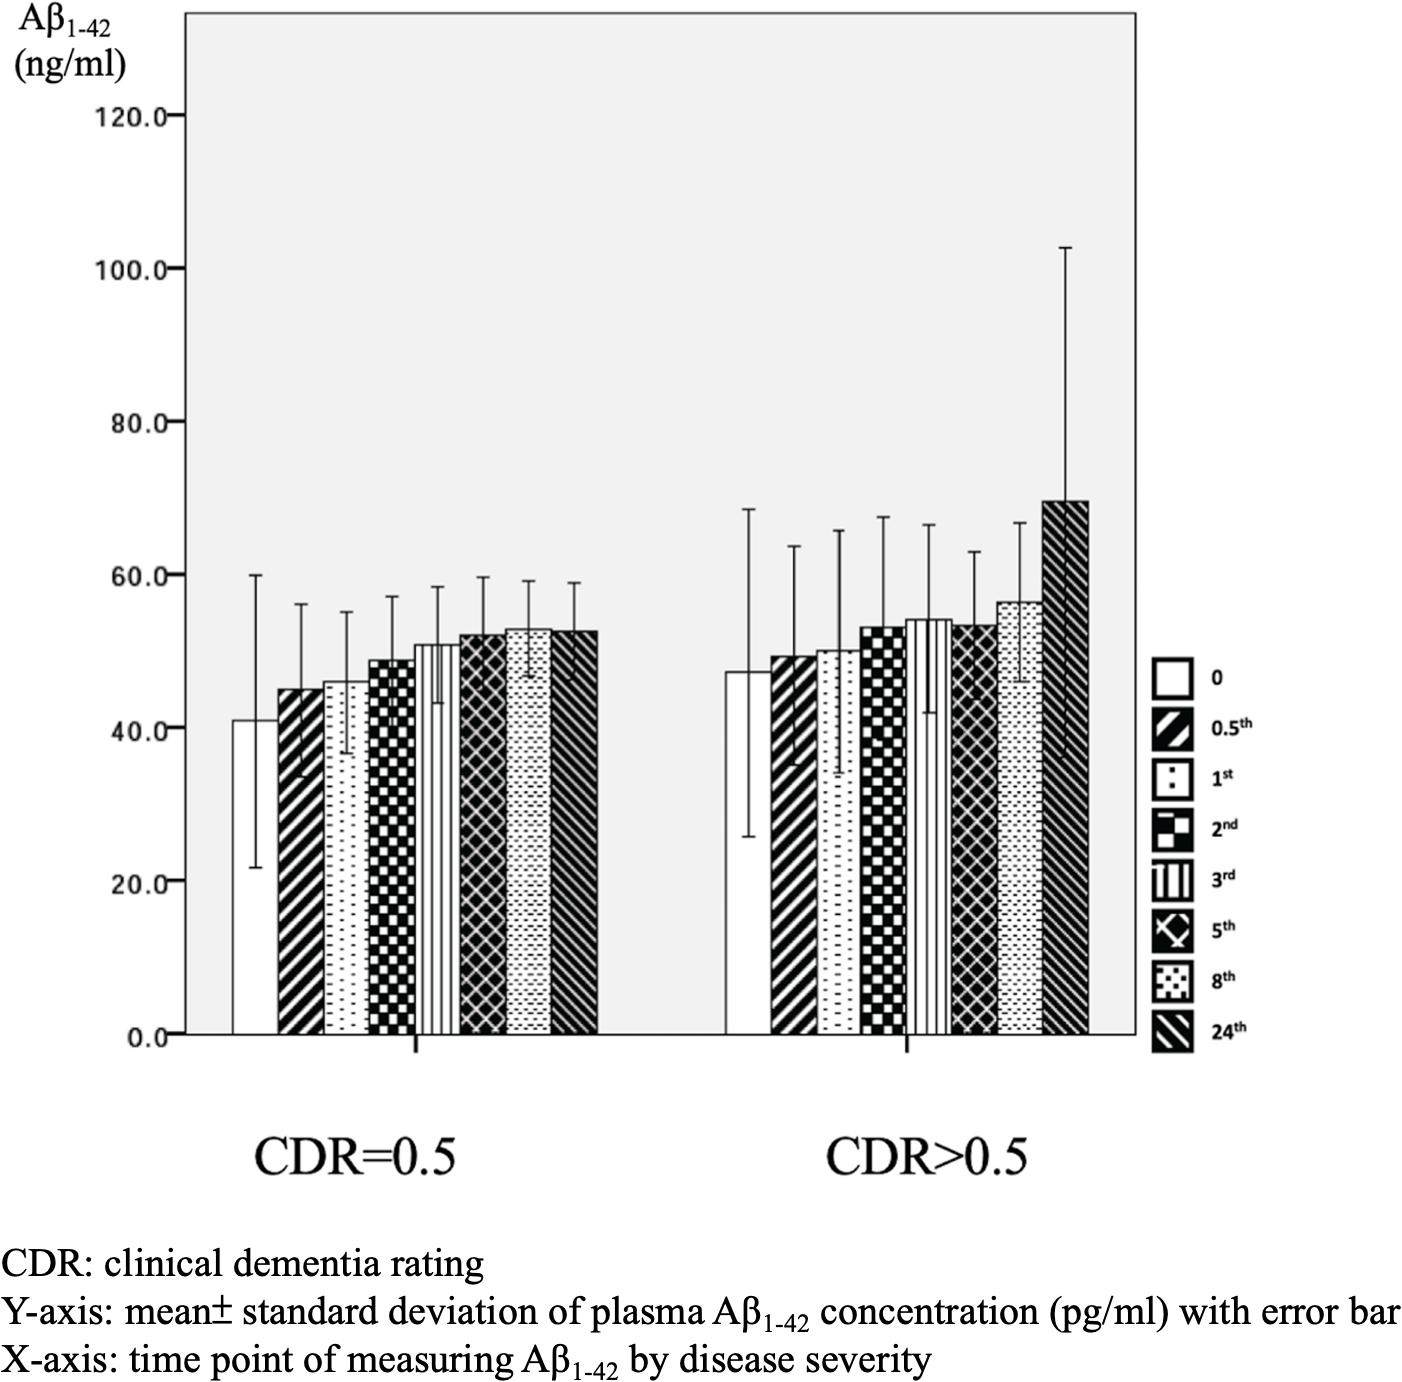
Figure 6. Plasma concentration of beta-amyloid1–42 (Aβ1–42) at different time point by disease severity (N = 32).
We further compared the standard deviation of Aβ1–42 level between the APOE4(+) and APOE4(−) patients, and found that the APOE4(+) patients had smaller standard deviations at each time point (Table 3).
In this study, we investigated dynamic changes in plasma Aβ1–40 and Aβ1–42 concentrations from fresh blood samples at eight time points. The results showed that not every sample had a consistent increase in Aβ1–40 and Aβ1–42 level after 24 h (Aβ1–40: 62.5% and Aβ1–42: 87.5%). The effects of APOE4 genetic status on plasma Aβ1–42 level were observed only in sample measured within 30 min. Moreover, APOE4 genetic status did not affect plasma Aβ1–40 level at any time point. However, Aβ1–40 level was significantly higher in the patients with advanced stage dementia (CDR = 1 and CDR = 2) compared to those with mild stage dementia (CDR = 0.5).
We used fresh plasma, and found significant differences in plasma Aβ1–42 at baseline (p = 0.031) and 0.5 h (p = 0.043) by APOE4 genetic status. However, no significant effects were noted at any other time points (Table 3), and no significant effects were observed in Aβ1–40 level at any time point. These findings are to some extent different to another study which examined plasma amyloid peptides in 19 non-demented participants immediately and after storage at room temperature for 24 and 48 h, respectively (Bibl et al., 2012). In their study, the authors reported that sample storage led to a significant loss of measurable amyloid peptide levels, and that this was most pronounced during the first 24 h of storage regardless of whether the distinct Aβ peptide species was Aβ1–42 or Aβ1–40 (Bibl et al., 2012). The differences between our study and Bibl’s study are that their samples came from non-demented participants, and they did not analyze changes in Aβ1–42 or Aβ1–40 between baseline and 24 h or control for APOE genetic status in their participants.
The effects of APOE4 genetic status on plasma Aβ1–42 level but not Aβ1–40 level in our samples indicates the possibility that there is an increase in the aggregation process of Aβ1–42 from the monomer to fibril form in APOE4 carriers. Similar findings have also been reported in a previous study, in which apo-lipoprotein E4 protein, mediated by the APOE4 gene, was shown to induce the aggregation of Aβ1–42 more specifically and rapidly than that of Aβ1–40 (Kang et al., 2015). The authors used a simple method to assess APOE4-mediated Aβ aggregation in physiological conditions using single gold nanoparticles based on localized surface plasmon resonance, which could be directly observed with a dark-field microscope or even by the naked eye, although some evidence of the biophysical properties of the interaction between apo-lipoprotein E4 protein and Aβ1–42 was unclear (Kang et al., 2015).
As mentioned, our results indicated that minor effects of APOE4 on plasma Aβ1–42 level and no significant effect on Aβ1–40 level. This is consistent with a previous longitudinal study which examined Aβ1–40 and Aβ1–42 levels in clinical trials (Donohue et al., 2015). In that study, there were no significant differences in Aβ1–40 and Aβ1–42 levels between AD patients who were and were not APOE4 carriers. However, there were significant differences in patients with mild cognitive impairment who had minor symptoms that were not sufficiently severe to be classified as AD (Donohue et al., 2015). The exact and detailed mechanisms by which APOE4 genetic status affects Aβ1–40 and Aβ1–42 levels should be clarified in other studies. However, the effects of APOE4 genetic status on our 0 and 0.5-h samples could more directly reflect the real situation of Aβ1–42 and Aβ1–40 in human blood because of the limited time from obtaining the venous samples.
In our samples, the patients with an advanced stage of dementia (CDR = 1 and CDR = 2) had increased Aβ1–40 levels compared to those with a very mild stage of dementia (CDR = 0.5). These findings could be, in part, attributed to the increased vascular contributions in advanced dementia (Yang et al., 2018), as the Aβ1–40 level has been reported to be higher in vascular amyloid deposition compared to Aβ1–42 (Iwatsubo et al., 1994; Gravina et al., 1995).
In this study, 87.5% of the AD patients had a higher mean Aβ1–42 level after 24 h (Figure 4), whereas only 62.5% of the AD patients had a higher mean Aβ1–40 level after 24 h (Figure 1). This finding is different to previous studies that reported a significant loss of measurable Aβ1–42 and Aβ1–40 peptide levels in their stored samples (Donohue et al., 2015; Kang et al., 2015). Donohue et al. (2015) examined the plasma concentrations of Aβ1–42 or Aβ1–40 after a longer storage time ranging from 0 to 1.8 years, and found that they declined significantly over time (−14.42 pg/ml Aβ1–40 per storage year, p < 0.001; −1.893 pg/ml Aβ1–42 per storage year, p = 0.003). In addition, Kang et al. (2015) reported that the loss of Aβ1–40 and Aβ1–42 was most pronounced during the first 24 h, in which the level of Aβ1–40 decreased from 267 ± 46 pg/ml at baseline to 190 ± 41 pg/ml at 24 h, and the level of Aβ1–42 decreased from 29 ± 4 pg/ml at baseline to 2 ± 4 pg/ml at 24 h. In order to avoid these declines or loss of Aβ1–40 and Aβ1–42, the authors recommended completing the measurements within 24 h after collecting the sample (Donohue et al., 2015). Compared to these studies, we provide more precise information with eight time points for both Aβ1–42 and Aβ1–40 levels within 24 h, and found that the changes in plasma Aβ1–42 and Aβ1–40 were dynamic and individualized.
The increase in mean plasma Aβ1–42 level at each time point in our AD patients may be due to several reasons. First, the Aβ1–42 aggregation process is continuous, from monomer, oligomer, protofibril, and eventually to fibril forms (Sinha and Lieberburg, 1999; Selkoe and Hardy, 2016). Compared to healthy subjects, the plasma of AD patients has been hypothesized to have a tendency to foster Aβ1–42 aggregation (Haass and Selkoe, 2007; Youn et al., 2019). Consistent with this hypothesis, the detected Aβ1–42 plasma levels increased from baseline to 24 h in this study. Second, the commercial kit that used to detect Aβ1–42 may not have only examined the monomer form of Aβ1–42, as the antibody in the kit may also have recognized the specific area of amyloid peptide, and amyloid peptide would continue the aggregation process to the formation of the fibril form. Third, Aβ1–42 may bind to carrier proteins such as apo-lipoprotein E and apo-lipoprotein J present in plasma (Matsubara et al., 1995; Zlokovic, 1996) that would possibly make the measurements difficult and result in a higher level. It is also possible that the commercial kit captured and detected oligomers in the sample. This would have resulted in an increase in the detected Aβ1–42 level at 24 h.
This study has several strengths. First, we examined eight time points from 0 to 24 h and reported detailed changes in Aβ1–42 and Aβ1–40, and we also examined the effects of APOE4 genetic status and disease severity on plasma levels of Aβ1–42 and Aβ1–40. Second, we incubated all of the samples at 37°C before measurement to mimic the temperature of human blood in order to reduce possible confounding effects and approximate the actual level of Aβ1–42 and Aβ1–40. However, we do not know how beneficial this study design was, and the detailed effects and mechanisms of such design could be examined in another study. Third, we used the same protocol, commercial kits, and technician for all the examinations to avoid variabilities. There are also several limitations to this study. We reported changes in plasma Aβ1–42 and Aβ1–40 across all time points, however we did not examine the exact mechanisms, especially with regards to the possible effects of APOE genetic status, disease severity, or the possible bidirectional conversion between monomers and fibrils or oligomers. As there is currently no consensus on how best to evaluate dynamic changes in plasma Aβ1–42 and Aβ1–40, we chose the eight time points arbitrarily. These time points could be revised in future studies. In addition, our sample size was small, and further studies with a larger sample size comprehensively controlling for other confounding factors are warranted.
The raw data supporting the conclusions of this article will be made available by the authors, without undue reservation, to any qualified researcher.
The studies involving human participants were reviewed and approved by the Kaohsiung Medical University Hospital IRB. The patients/participants provided their written informed consent to participate in this study.
Y-HY designed the study and wrote the manuscript. L-CH and S-WH recruited patients and collected samples. L-JH performed the ELISA analyses. All authors contributed to the article and approved the submitted version.
This study was supported by the Neuroscience Research Center, Kaohsiung Medical University (Grant No: KMU-TC108B01; KMTTH-DK109007).
The authors declare that the research was conducted in the absence of any commercial or financial relationships that could be construed as a potential conflict of interest.
Bibl, M., Welge, V., Esselmann, H., and Wiltfang, J. (2012). Stability of amyloid-β peptides in plasma and serum. Electrophoresis 33, 445–450. doi: 10.1002/elps.201100455
Donohue, M. C., Moghadam, S. H., Roe, A. D., Sun, C.-K., Edland, S. D., Thomas, R. G., et al. (2015). Longitudinal plasma amyloid beta in Alzheimer’s disease clinical trials. Alzheimers Dement. 11, 1069–1079.
Gravina, S. A., Ho, L., Eckman, C. B., Long, K. E., Otvos, L., Younkin, L. H., et al. (1995). Amyloid β Protein (Aβ) in Alzheimeri’s disease brain biochemical and immunocytochemical analysis with antibodies specific for forms ending at Aβ40 or Aβ42 (43). J. Biol. Chem. 270, 7013–7016.
Haass, C., and Selkoe, D. J. (2007). Soluble protein oligomers in neurodegeneration: lessons from the Alzheimer’s amyloid β-peptide. Nat. Rev. Mol. Cell Biol. 8, 101–112. doi: 10.1038/nrm2101
Hebert, L., Scherr, P., Bienias, J., Bennett, D., and Evans, D. (2004). State-specific projections through 2025 of Alzheimer disease prevalence. Neurology 62:1645. doi: 10.1212/01.wnl.0000123018.01306.10
Iwatsubo, T., Odaka, A., Suzuki, N., Mizusawa, H., Nukina, N., and Ihara, Y. (1994). Visualization of Aβ42 (43) and Aβ40 in senile plaques with end-specific Aβ monoclonals: evidence that an initially deposited species is Aβ42 (43). Neuron 13, 45–53. doi: 10.1016/0896-6273(94)90458-8
Kang, M. K., Lee, J., Nguyen, A. H., and Sim, S. J. (2015). Label-free detection of ApoE4-mediated β-amyloid aggregation on single nanoparticle uncovering Alzheimer’s disease. Biosens. Bioelectron. 72, 197–204. doi: 10.1016/j.bios.2015.05.017
Karn, S., Wei, Z., MacTavish, D., Kabogo, D., Song, M.-S., and Jhamandas, J. H. (2007). Amyloid β-Peptide and Central Cholinergic Neurons: Involvement in Normal Brain Function and Alzheimer’s Disease Pathology. Abeta Peptide and Alzheimer’s Disease. Cham: Springer, 159–178.
Kuo, Y.-M., Emmerling, M. R., Lampert, H. C., Hempelman, S. R., Kokjohn, T. A., Woods, A. S., et al. (1999). High levels of circulating Aβ42 are sequestered by plasma proteins in Alzheimer’s disease. Biochem. Biophys. Res. Commun. 257, 787–791. doi: 10.1006/bbrc.1999.0552
Lin, K.-N., Wang, P.-N., Liu, C.-Y., Chen, W.-T., Lee, Y.-C., and Liu, H.-C. (2002). Cutoff scores of the cognitive abilities screening instrument, Chinese version in screening of dementia. Dement. Geriatr. Cogn. Disord. 14, 176–182. doi: 10.1159/000066024
Lopez, O., Kuller, L., Mehta, P., Becker, J., Gach, H., Sweet, R., et al. (2008). Plasma amyloid levels and the risk of AD in normal subjects in the Cardiovascular Health Study. Neurology 70, 1664–1671. doi: 10.1212/01.wnl.0000306696.82017.66
Matsubara, E., Frangione, B., and Ghiso, J. (1995). Characterization of apolipoprotein J-Alzheimer’s Aβ interaction. J. Biol. Chem. 270, 7563–7567.
Mattsson, N., Andreasson, U., Persson, S., Arai, H., Batish, S. D., Bernardini, S., et al. (2011). The Alzheimer’s Association external quality control program for cerebrospinal fluid biomarkers. Alzheimers Dement. 7, 386.e6–395.e6.
Mattsson, N., Andreasson, U., Persson, S., Carrillo, M. C., Collins, S., Chalbot, S., et al. (2013). CSF biomarker variability in the Alzheimer’s Association quality control program. Alzheimers Dement. 9, 251–261.
Mattsson, N., Blennow, K., and Zetterberg, H. (2010). Inter-laboratory variation in cerebrospinal fluid biomarkers for Alzheimer’s disease: united we stand, divided we fall. Clin. Chem. Lab. Med. 48, 603–607.
Mattsson, N., Zegers, I., Andreasson, U., Bjerke, M., Blankenstein, M. A., Bowser, R., et al. (2012). Reference measurement procedures for Alzheimer’s disease cerebrospinal fluid biomarkers: definitions and approaches with focus on amyloid β42. Biomark. Med. 6, 409–417. doi: 10.2217/bmm.12.39
Mayeux, R., and Schupf, N. (2011). Blood-based biomarkers for Alzheimer’s disease: plasma Aβ40 and Aβ42, and genetic variants. Neurobiol. Aging 32, S10–S19.
McKhann, G. M., Knopman, D. S., Chertkow, H., Hyman, B. T., Jack, C. R. Jr., Kawas, C. H., et al. (2011). The diagnosis of dementia due to Alzheimer’s disease: recommendations from the National Institute on Aging-Alzheimer’s Association workgroups on diagnostic guidelines for Alzheimer’s disease. Alzheimers Dement. 7, 263–269.
Prince, M. J. (2015). World Alzheimer Report 2015: The Global Impact of Dementia: An Analysis of Prevalence, Incidence, Cost and Trends. London: Alzheimer’s Disease International.
Rissman, R. A., Trojanowski, J. Q., Shaw, L. M., and Aisen, P. S. (2012). Longitudinal plasma amyloid beta as a biomarker of Alzheimer’s disease. J. Neural. Transm. 119, 843–850. doi: 10.1007/s00702-012-0772-4
Selkoe, D. J., and Hardy, J. (2016). The amyloid hypothesis of Alzheimer’s disease at 25 years. EMBO Mol. Med. 8, 595–608.
Sinha, S., and Lieberburg, I. (1999). Cellular mechanisms of β-amyloid production and secretion. Proc. Natl. Acad. Sci. U.S.A. 96, 11049–11053. doi: 10.1073/pnas.96.20.11049
Strozyk, D., Blennow, K., White, L., and Launer, L. (2003). CSF Aβ 42 levels correlate with amyloid-neuropathology in a population-based autopsy study. Neurology 60, 652–656. doi: 10.1212/01.wnl.0000046581.81650.d0
Tapiola, T., Alafuzoff, I., Herukka, S.-K., Parkkinen, L., Hartikainen, P., Soininen, H., et al. (2009). Cerebrospinal fluid β-amyloid 42 and tau proteins as biomarkers of Alzheimer-type pathologic changes in the brain. Arch. Neurol. 66, 382–389.
van Oijen, M., Hofman, A., Soares, H. D., Koudstaal, P. J., and Breteler, M. M. (2006). Plasma Aβ1–40 and Aβ1–42 and the risk of dementia: a prospective case-cohort study. Lancet Neurol. 5, 655–660. doi: 10.1016/s1474-4422(06)70501-4
Winblad, B., Amouyel, P., Andrieu, S., Ballard, C., Brayne, C., Brodaty, H., et al. (2016). Defeating Alzheimer’s disease and other dementias: a priority for European science and society. Lancet Neurol. 15, 455–532.
Yang, Y., Fuh, J., and Mok, V. C. (2018). Vascular contribution to cognition in stroke and Alzheimer’s disease. Brain Sci. Adv. 4, 39–48. doi: 10.26599/bsa.2018.9050001
Yang, Y.-H., Liscic, R., and Dominguez, J. (2019). Framework of treating Alzheimer’s dementia. Brain Sci. Adv. 5, 82–93. doi: 10.1177/2096595820902580
Youn, Y. C., Kang, S., Suh, J., Park, Y. H., Kang, M. J., Pyun, J.-M., et al. (2019). Blood amyloid-β oligomerization associated with neurodegeneration of Alzheimer’s disease. Alzheimers Res. Ther. 11:40.
Keywords: amyloid-beta-protein, Alzheimer’s disease, APOE, CDR, dementia
Citation: Yang Y-H, Huang L-C, Hsieh S-W and Huang L-J (2020) Dynamic Blood Concentrations of Aβ1–40 and Aβ1–42 in Alzheimer’s Disease. Front. Cell Dev. Biol. 8:768. doi: 10.3389/fcell.2020.00768
Received: 07 April 2020; Accepted: 21 July 2020;
Published: 11 August 2020.
Edited by:
Md. Shamim Hossain, Kyushu University, JapanReviewed by:
Sandra Donnini, University of Siena, ItalyCopyright © 2020 Yang, Huang, Hsieh and Huang. This is an open-access article distributed under the terms of the Creative Commons Attribution License (CC BY). The use, distribution or reproduction in other forums is permitted, provided the original author(s) and the copyright owner(s) are credited and that the original publication in this journal is cited, in accordance with accepted academic practice. No use, distribution or reproduction is permitted which does not comply with these terms.
*Correspondence: Yuan-Han Yang, ZW5kbGVzc3loeUBnbWFpbC5jb20=
Disclaimer: All claims expressed in this article are solely those of the authors and do not necessarily represent those of their affiliated organizations, or those of the publisher, the editors and the reviewers. Any product that may be evaluated in this article or claim that may be made by its manufacturer is not guaranteed or endorsed by the publisher.
Research integrity at Frontiers

Learn more about the work of our research integrity team to safeguard the quality of each article we publish.