
94% of researchers rate our articles as excellent or good
Learn more about the work of our research integrity team to safeguard the quality of each article we publish.
Find out more
ORIGINAL RESEARCH article
Front. Cell Dev. Biol., 11 July 2019
Sec. Cell Adhesion and Migration
Volume 7 - 2019 | https://doi.org/10.3389/fcell.2019.00124
This article is part of the Research TopicCell Migration in Neurological DisordersView all 6 articles
 Lana Vasung1,2
 Arthur Rezayev1,2Hyuk Jin Yun1,2
 Jae W. Song3
 Andre van der Kouwe4Natalie Stewart1,2Arthi Palani1,2
 Tadashi Shiohama1,2,5Francois Chouinard-Decorte6
 Jacob Levman1,2,7
 Emi Takahashi1,2*
The development of cortical convolutions, gyri and sulci, is a complex process that takes place during prenatal development. Lissencephaly, a rare genetic condition characterized by the lack of cortical convolutions, offers a model to look into biological processes that lead to the development of convolutions. Retrospective, qualitative, and quantitative analyses of structural magnetic resonance imaging (MRI) and diffusion tensor imaging (DTI) were performed in patients with lissencephaly (N = 10) and age-/sex-matched controls (N = 10). In order to identify microstructural correlates of structural MRI and DTI findings, postmortem brains of patients with lissencephaly (N = 4) and age-matched controls (N = 4) were also examined with histology. Patients with lissencephaly had significantly smaller gyrification index and volumes of hemispheric white and gray matter, compared to the age-/sex-matched control group. However, there was no significant difference between groups in the subcortical gray matter volumes. Although the majority of patients with lissencephaly had a preserved normal-like appearance of major fissures and primary sulci, the spatial distribution of agyric cortical regions was different in patients with lissencephaly-1 (LIS1) and doublecortin (DCX) mutations. Lastly, in patients with lissencephaly, the spatiotemporal distribution of projection pathways was preserved while short- to medium-range cortico-cortical pathways were absent or fewer in number. Our results indicate that in the patients with lissencephaly cortical system is affected more than the subcortical one.
Lissencephaly is a rare genetic condition characterized by a lack of cortical convolutions. It has been associated most frequently with the mutations of the lissencephaly-1 (LIS1) (Reiner et al., 1993), doublecortin (DCX) (des Portes et al., 1998), and tubulin alpha 1A (TUBA1A) genes (Poirier et al., 2007). At the cellular level, lissencephaly results from insufficient neuronal migration. LIS1 lissencephaly is characterized by the “four-layered cortex” while in DCX lissencephaly the cerebral cortex displays six-layers (Viot et al., 2004). This is important because the appearance of cortical convolutions has been linked to the intensity of neurogenic processes such as the development of radial glial scaffolding (Fernández et al., 2016) used for radial migration of neurons (Rakic, 1972), differences in the rate of increasing thickness of supragranular (I–III) vs. infragranular layers (V–VI) (Armstrong et al., 1991), sequential cortical ingrowth of fibers (Kostovic and Rakic, 1990), increases in brain volume (Zilles et al., 2013), and accelerated growth of white compared to gray matter, reflecting the development of connectivity (Herculano-Houzel et al., 2010). Recently, Di Donato et al. (2018) reported differences in the phenotype between subjects that have mutations in single lissencephaly-associated gene. For example, mutations of LIS1 gene are associated with a higher occurrence of posterior pachygyria (sulci 1.5–3 cm apart with abnormally wide gyri) or posterior agyria–pachygyria. In contrast, mutations of the DCX gene are more frequently characterized by a diffuse agyria or predominantly frontal pachygyria. Therefore, identifying genotype–phenotype relations in lissencephaly can provide insights into the biological processes that drive the development of cortical convolutions (Dobyns, 1987).
The appearance of cortical convolutions is evident during the second half of pregnancy and it is accompanied by a 50-fold increase in the surface area of the cerebral cortex (Vasung et al., 2016). During this period, the ratio of the cortical volume (cortical plate and subplate) to the white matter (WM) volume decreases from approximately three to one, while the thickness of the cortical plate increases by less than a millimeter (Vasung et al., 2016; Andescavage et al., 2017). Since all of the neurogenic processes that occur during the second trimester can be disrupted in lissencephaly, our aim will be to quantitatively determine differences in gyrification and volumetric measurements between a heterogeneous group of patients and age-matched controls, as well as to qualitatively observe which measures may be associated with the absence of cortical convolutions.
Since this study was retrospective in nature and no identifying information would be requested by the researchers, it was determined that the informed consent would not be sought from the patients due to the low risk this study would present to them. Thus, a waiver of consent, in addition to all other procedures, was approved after due consideration by the Boston Children’s Hospital (BCH) Institutional Review Board. We retrospectively reviewed 14 MRI examinations from 10 patients with lissencephaly (0.68–21.67 years; Supplementary Tables S1–S3), and compared them with 10 age-matched neurologically healthy control subjects. All patients and control subjects were male.
Coronal blocks of specimens with lissencephaly (N = 3) and the coronal blocks of age and sex-matched post-mortem control brains (N = 4) were obtained from the Brain and Tissue Bank for Developmental Disorders supported by the Eunice Kennedy Shriver National Institute of Child Health and Development1 (Supplementary Table S4). The coronal brain blocks were approximately 2 cm thick. Age, cause of death, brain malformation, and additional information can be found in Supplementary Table S2. After the successful MR scan, tissue blocks were cut and histological slices were stained with neurofilament staining that has previously been reported to be successful in the staining of axonal fibers of immature fetal brains (Widjaja et al., 2010).
Participants were imaged with a clinical 3T or 1.5T MRI scanner (Skyra, Siemens Medical Systems, Erlangen, Germany) at BCH, yielding T1 and T2 structural MRI and DTI. Due to the retrospective nature of the study, there was variability in the MRI parameters employed (Supplementary Table S1).
The blocks of postmortem brain were prepared for MRI scanning by soaking in Ziploc bags containing Fomblin oil (same used as, e.g., Takahashi et al., 2012). These bags were placed parallel to each other in a container, separated by plastic boards. The scans were performed at the Athinoula A. Martinos Center for Biomedical Imaging. Diffusion-weighted data were acquired using a 3 Tesla Siemens TIM Trio MRI machine with a 32 channel head coil, a 100 Hz/px bandwidth, and steady-state free-precession (SSFP)-based diffusion sequence. Each slab was 192 mm thick. Following parameters were used for SSFP: TR/TE = 24.82/18.76 ms, a = 60°, nex = 2, in-plane imaging matrix = 200 × 200, in-plane field of view = 160 × 160 mm2, in-plane imaging resolution 0.8 × 0.8 mm2, and slice thickness = 0.8 mm without a gap. Diffusion weighting was performed along 44 directions (b = 800 s/mm2) with 4b = 0 images. The directions used in the imaging were generated via electrostatic repulsion on the surface of a sphere to ensure equidistant spacing with some approximations. The total scan time was 17 h 35 min 24 s. When using SSFP, it is difficult to achieve a much higher b-value due to long scan time and constraints on gradient heating. The use of SSFP is relatively new but is effective when a high-resolution ex vivo diffusion is required.
Aside from standard clinical reports, two investigators (JS and LV) independently analyzed MR images following the guidelines of the new radiological classification for lissencephaly (Di Donato et al., 2017). The following categories were assessed: (i) gradient of gyral malformation, (ii) grade of gyral malformation, (iii) cortical thickness and appearance, and (iv) non-cortical brain malformations. A “thin” cortex in lissencephaly was defined as a cortex thinner than 10 mm in the majority of areas across the entire telencephalon.
Digital imaging and communications in medicine (DICOM) MR images of patients with lissencephaly were converted to the analyze format and were segmented semi-automatically using the ITK-SNAP software2 into gray and WM, and cerebrospinal fluid (CSF). Afterward, we manually segmented the gray matter into cortical gray matter (CGM) and basal ganglia with the thalamus. DICOM MR images of age-matched control subjects were automatically segmented with the CIVET processing pipeline using a web-based portal, CBRAIN (Sherif et al., 2014). An example of the tissue classification and segmentation in lissencephaly and control subjects can be found in Supplementary Figure S1.
Based on the segmented images, individual hemispheric outer surfaces were extracted by the Automated Segmentation with Proximities algorithm (MacDonald et al., 2000). This algorithm was used to deform a spherical mesh onto smoothed images using a threshold of 0.5. The gyrification index (GI) was defined as the ratio of the area of a surface model to that of its convex hull (Zilles et al., 1988). Convex hulls were extracted using a built-in function of CIVET 1.1.10, which then allowed for the calculation of the convex hull area and GI.
Finally, on the reconstructed cortical surfaces (Figure 1), we identified gyri and sulci as well as the deepest parts of the sulci, so-called the sulcal pits (Lohmann et al., 2008) or roots (Régis et al., 2005).
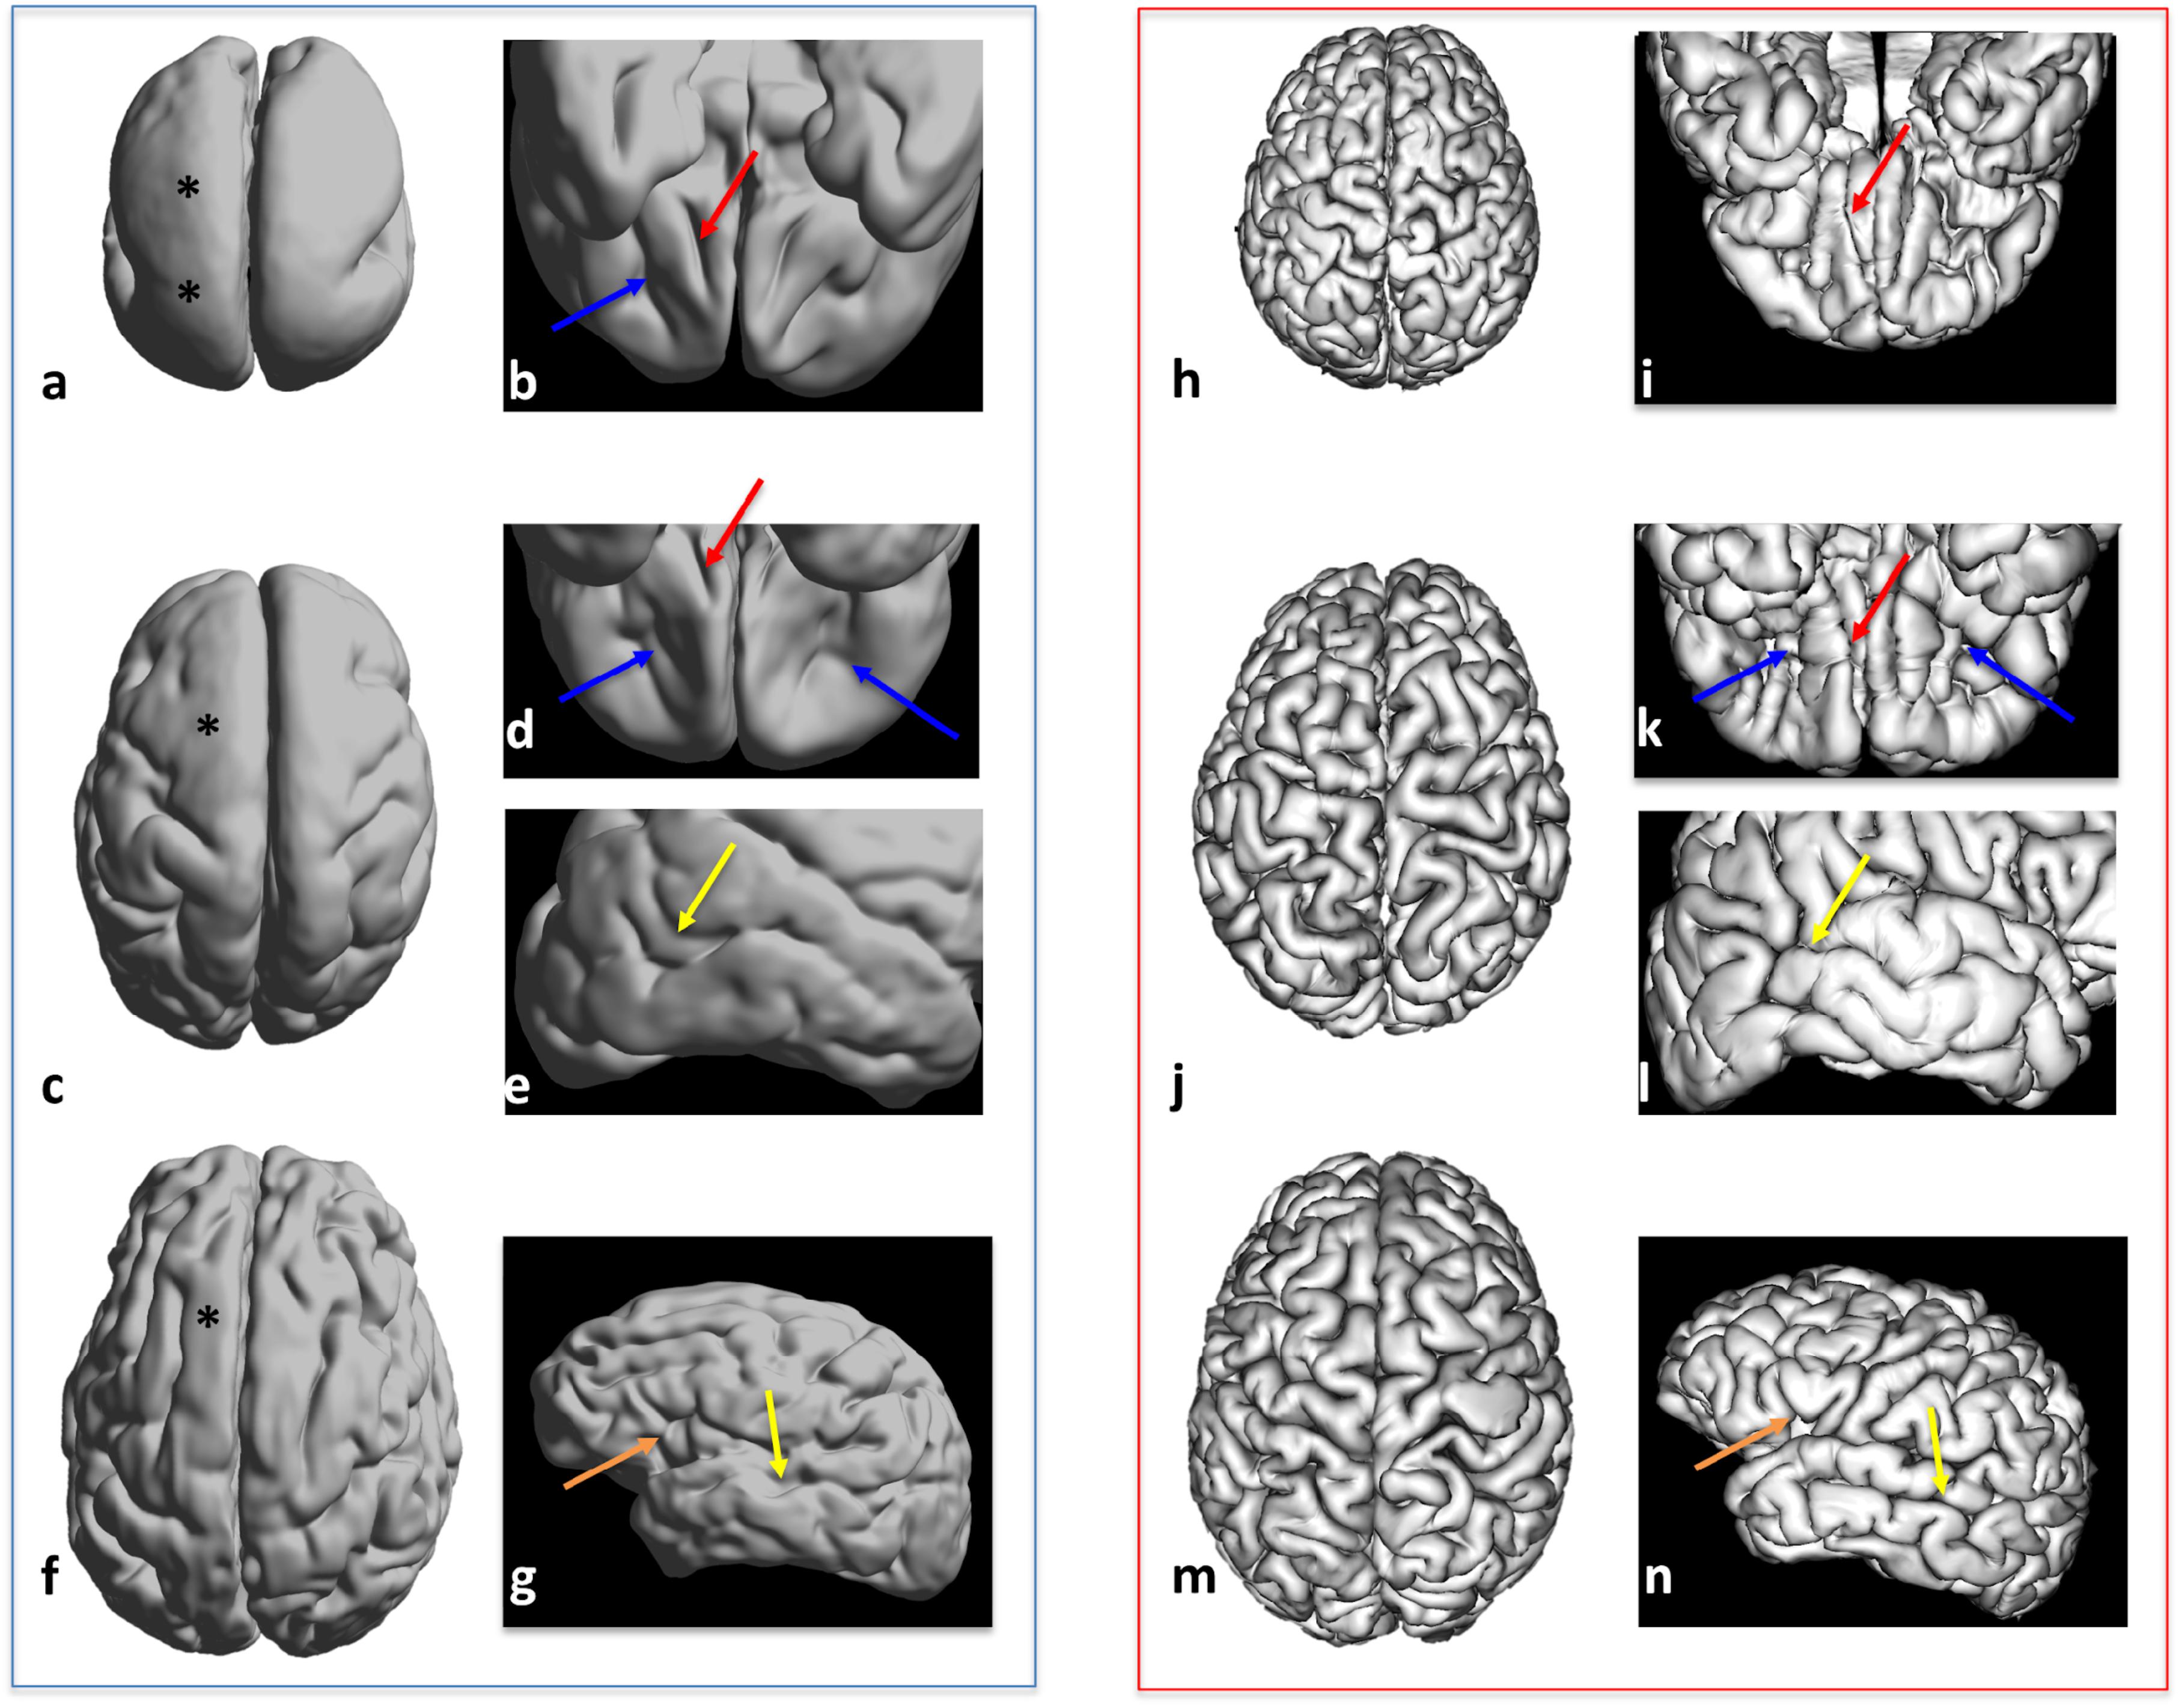
Figure 1. Three-dimensional views of cortical surface reconstruction of three subjects with lissencephaly: LIS_3 subject aged 5 years (a,b), LIS_9 subject aged 2 years (c–e), and LIS_8 subject aged 22 years (f,g) with age-matched controls (h–n). Dorsal views (a,c,f,h,j,m), ventral views (b,d,i,k), and lateral views (e,g,l,n) are shown. Magnified areas showing normal-like simplified sulcal patterns in patients with lissencephaly and corresponding sulcal patterns in controls are shown in b, d, e, and g: olfactory sulcus (red arrow in b, d, i, and k), transverse orbital sulcus (blue arrow in b, d, and k), superior temporal sulcus (yellow arrow in e, l, g, and n), and ascending sulcus (ascending ramus of the lateral fissure, orange arrow in g and n). Areas of agyric cortex are marked by ∗.
Diffusion Toolkit and TrackVis3 were used to reconstruct and visualize tractography pathways. Tractography pathways were reconstructed using a HARDI model with a streamline/FACT algorithm and a 45° angle threshold. No threshold of fractional anisotropy (FA) was used for the fiber reconstruction. Brain mask volumes were used to terminate tractography structures instead of the standard FA threshold (Takahashi et al., 2012), because progressive myelination and crossing fibers in the developing brain can result in low FA values that may potentially incorrectly terminate tractography tracing in brain regions with low FA values.
The reconstruction of tractography pathways was performed using Diffusion Toolkit, and visualized with TrackVis3. A streamline algorithm for tractography was used for track reconstruction (Mori et al., 1999). A one-ROI approach was employed to reconstruct tracts with known anatomical landmarks (Catani and Thiebaut de Schotten, 2008). The following pathways were reconstructed both in vivo and ex vivo based on the methodology previously described (Vasung et al., 2017): basal forebrain and striatal pathways conveyed to the external capsule, pathways from the basal ganglia, thalamic pathways, and short-/long-range cortico-cortical pathways.
Metric data were described using minimum, maximum, mean, and standard deviation statistics for each group of subjects. Nominal data were described using absolute frequencies and percentages. Statistical analysis was performed using the SPSS® software and estimationstats (Ho et al., 2018). Differences between the two groups in measured volumes, volume ratios, and GI for each hemisphere were assessed using a Student’s t-test. After the Bonferroni correction, a p-value ≤ 0.0038 was set as significant for all analyses. A linear mixed model for GI and for CGM/WM with group and hemisphere as factors, age, ventricular volumes, and interaction between group and age as covariates, and subject within a group as a random factor was used for which a p-value of ≤0.05 was considered significant.
After successful MR scans, the coronal slabs were sectioned and stained with neurofilament-specific antibody (SMI-312), which has been used to stain axonal fibers in immature fetal brains. Imaging was performed using a Nikon Instruments Eclipse Ti-E Inverted Microscope.
Ten patients with lissencephaly were scanned. Patient characteristics, patient age at scan, and MRI findings additional to lissencephaly were described in Supplementary Table S2.
The distribution of gyral malformations, agyria or pachygyria, and a “thin” or “thick” cortex was described in Supplementary Table S3. Non-cortical malformations were dysgenesis of the corpus callosum (N = 4), microcephaly (N = 4), ventriculomegaly (N = 3), and subcortical band heterotopia (N = 2) (Supplementary Table S2 and Supplementary Figures S1–S5). The cerebellum appeared properly foliated in all patients.
Quantitative MR measurements of the hemispheric GI and volumes of the third and lateral ventricles, hemispheric CGM, subcortical gray matter, hemispheric WM, the ratio between volume of the CGM and WM for 40 hemispheres across lissencephaly (n = 20 hemispheres) and control subjects (n = 20 hemispheres) are reported in Table 1.
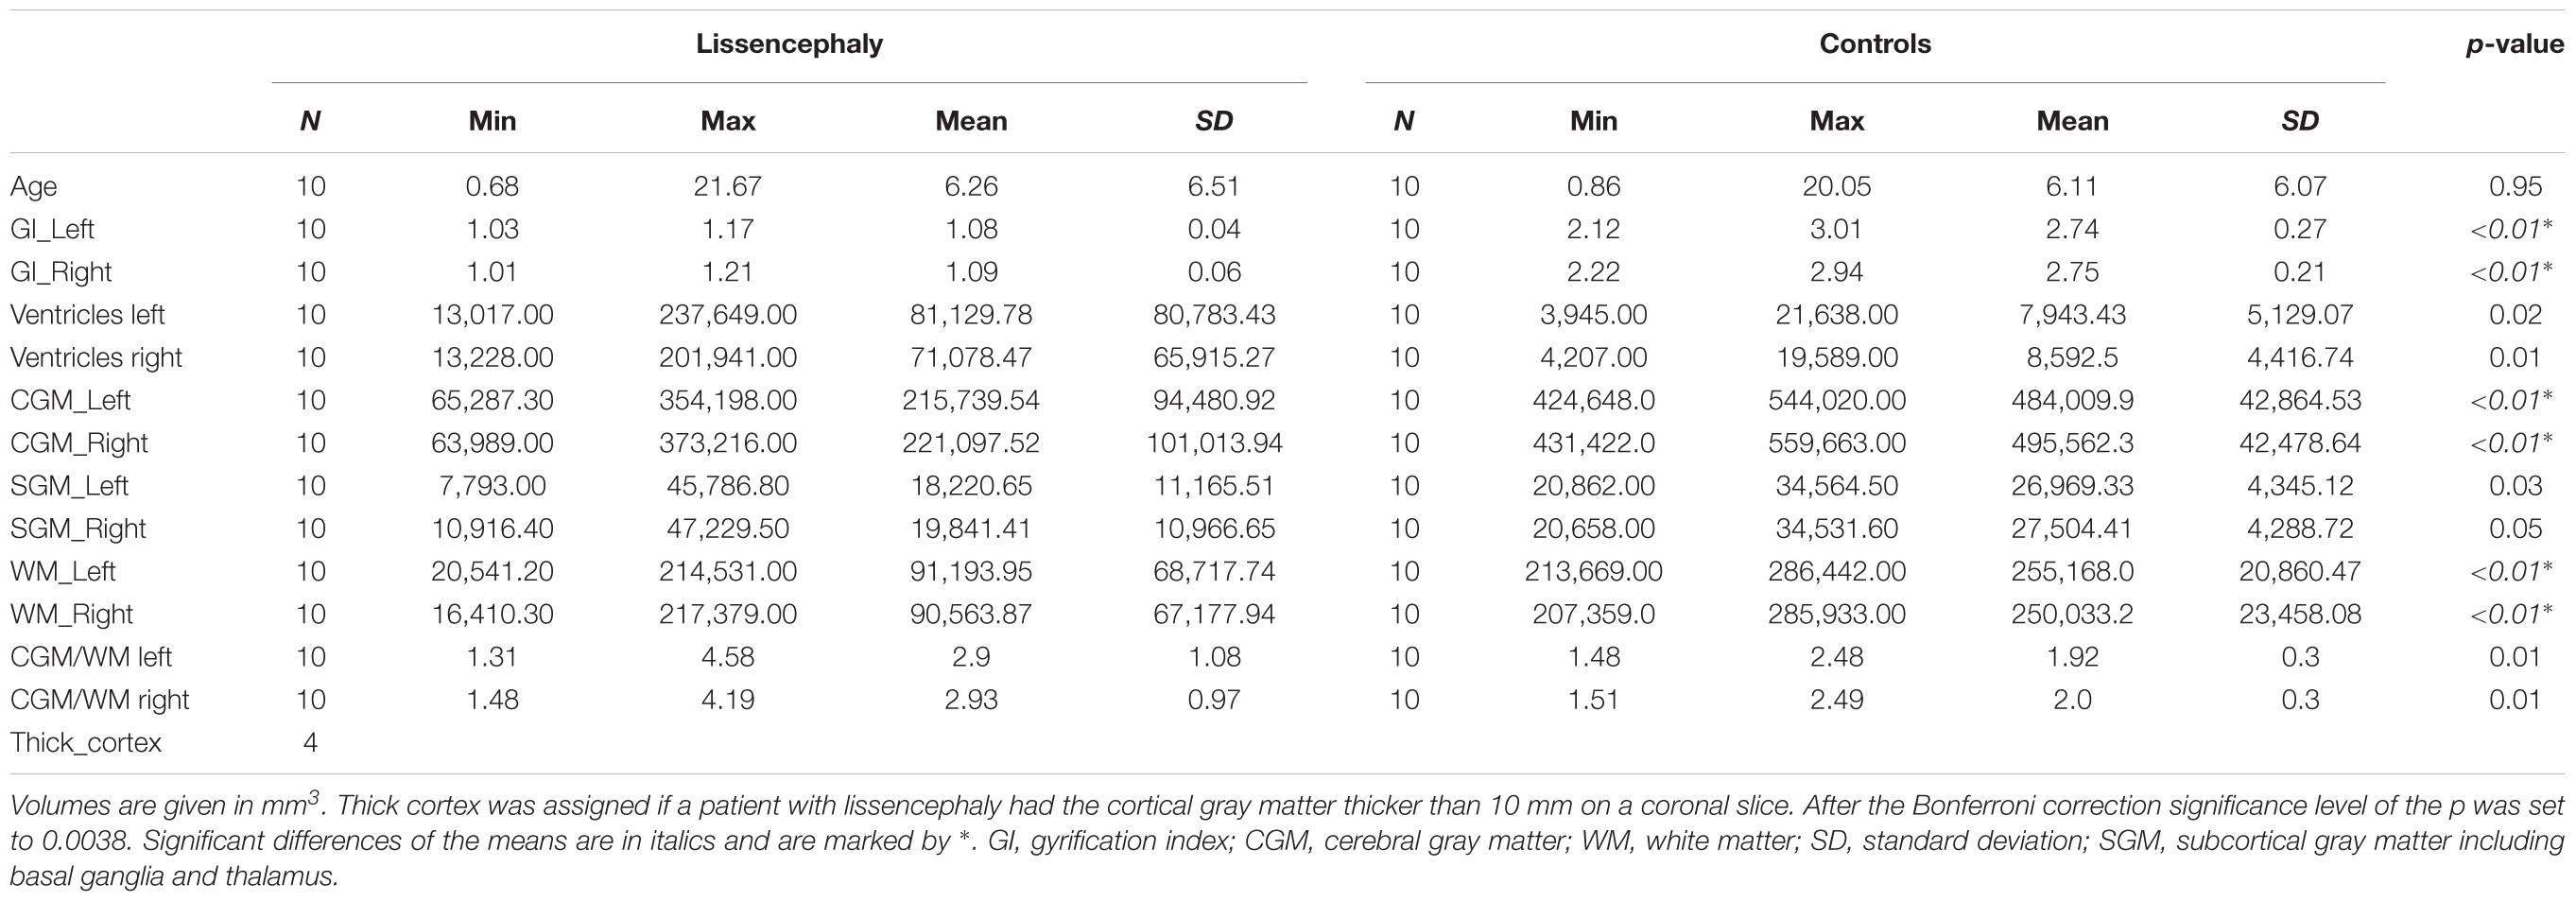
Table 1. Age and hemispheric measurements in lissencephaly and control group.
Hemispheric volumes of WM, CGM, and GI were significantly smaller in the lissencephaly group, compared to the control group (Figure 2 and Table 1). However, there was no significant difference between groups in the volumes of the subcortical gray matter (Figure 2 and Table 1).
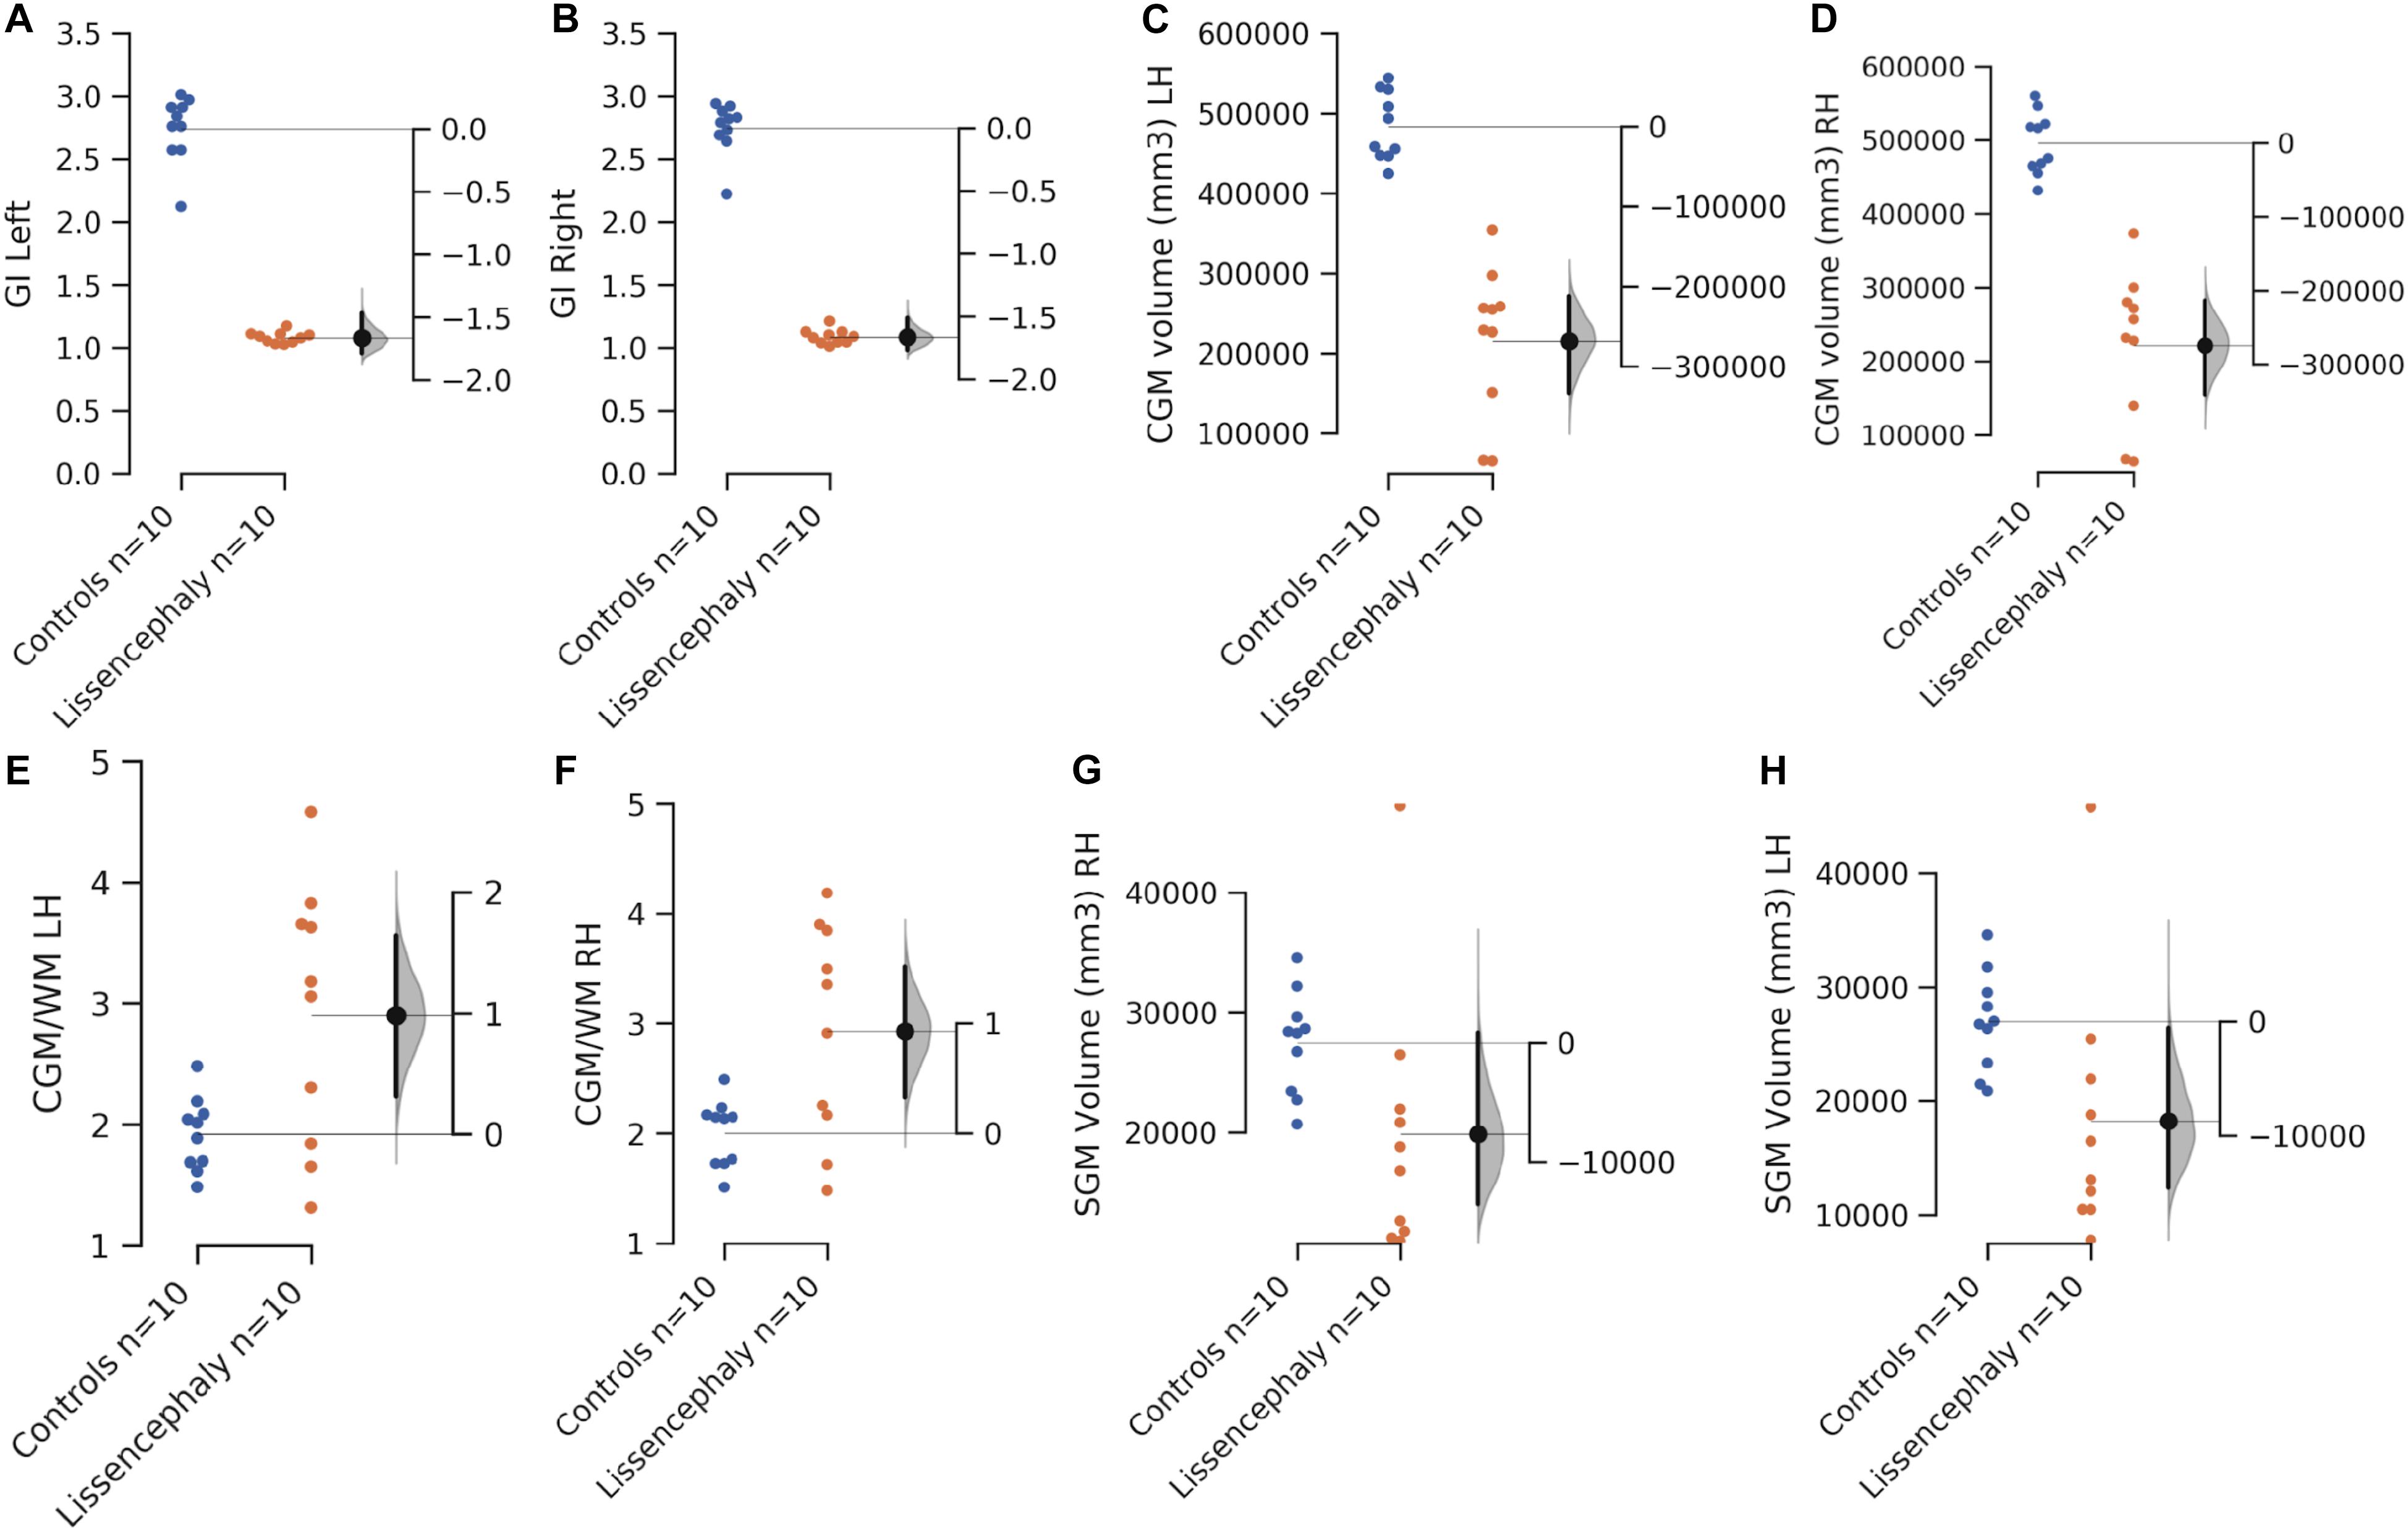
Figure 2. Scatterplots showing the comparison of the mean left and right hemispheric gyrification index (A,B), CGM volume (C,D), CGM/WM volume ratio (E,F), and SGM volume (G,H) between controls (blues) and patients with lissencephaly (orange). The y-axis on the left side of each scatterplot shows the measured values. The shorter y-axis on the right is to show the difference of the means. The filled gray curve on the right of each scatterplot indicates the complete distribution of the effect size (difference of the means, Δ). The black line on the right of each scatterplot illustrates the 95% confidence interval of the Δ.
The ratio of CGM/WM was not significantly different between hemispheres when controlling for age and pathological status. In addition, no significant correlation between ventricular volume and CGM/WM was found. This was tested because the presence of ventriculomegaly with hydrocephalus could produce the pressure to the WM and reduce its volume. CGM/WM was larger in the lissencephaly group, compared to the control group, after controlling for the volume, hemisphere, and age (Table 2). In addition, age-related decline in CGM/WM was significantly faster in the lissencephaly group (Table 2).
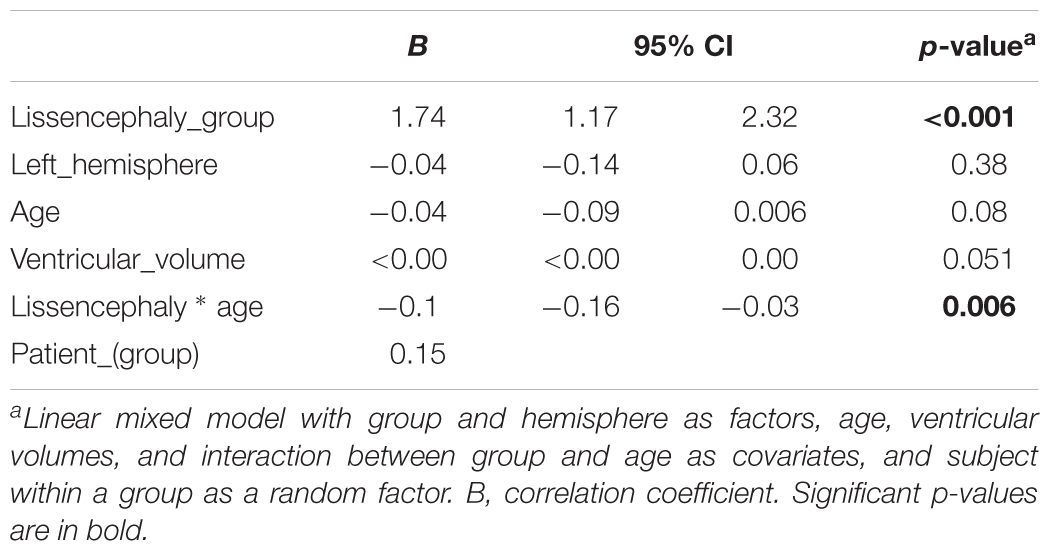
Table 2. Parameter estimates for linear mixed model of cortex/white matter volume ratio.
Reconstructed cortical surfaces demonstrated that despite the presence of agyria or pachygyria, certain cortical regions showed a relatively normal pattern of primary gyri and sulci (Figure 1). LIS_1 and LIS_2 patients had Sylvian fissures and well-developed deep sulcal pits of the superior frontal sulcus. LIS_2 had well-developed bilateral superior temporal sulci at the first time-point (1st year), but without secondary and tertiary sulci. However, during the first 2 years of life, morphological changes of these sulci were very discrete. LIS_3 patient had well-developed primary sulci [Figures 1a,b: transverse orbital sulcus (blue arrow); olfactory sulcus (red arrow)], as well as a definitive calcarine fissure and Sylvian fissure, and anterior deep sulcal pits of the parahippocampal and cingulate gyri. LIS_4 had detectable, normal-like shallow primary sulci of the frontal lobe. LIS_5 had a seemingly normal cingulate sulcus and identifiable sulcal pits of the anterior parahippocampal sulcus. LIS_6 had well-developed central and cingulate sulci. LIS_7 had primary and secondary sulci developed across the cerebral cortex; however, tertiary sulci were missing or appeared simplified (especially in frontal regions). LIS_8 had a simplified pattern of gyri and sulci, with all of the primary sulci [Figures 1f,g: superior temporal sulcus (yellow arrow)] and some secondary well-developed sulci [Figures 1f,g: ascending ramus of the lateral fissure (orange arrow)]. LIS_9 had a simplified pattern of primary gyri and sulci [Figures 1c–e: transverse orbital sulcus (blue arrows); olfactory sulcus (red arrow)], and few developed secondary sulci across the cerebral cortex (except in the frontal regions) [Figures 1c–e: superior temporal sulcus (yellow arrow)]. LIS_10 had a very shallow and undulating appearance of sulci across the entire cortex, making it difficult to distinguish between primary and secondary sulci.
Qualitative analysis and DTI tract reconstructions revealed an altered spatiotemporal composition of projection pathways in lissencephaly (Figure 3), i.e., thalamocortical (Figures 3a,c, blue) and basal ganglia (Figures 3a,c, green) pathways appeared segregated in a crossing fiber-rich area (Figure 3a, asterisk) compared to controls (Figures 3b,d). Furthermore, our results revealed that compared to the normal age-matched brains (Figure 3d, orange–red pathways), brains with lissencephaly had a reduced amount of association pathways (Figure 3c, orange–red pathways) that showed altered, tangential orientations (Figure 3c, arrow).
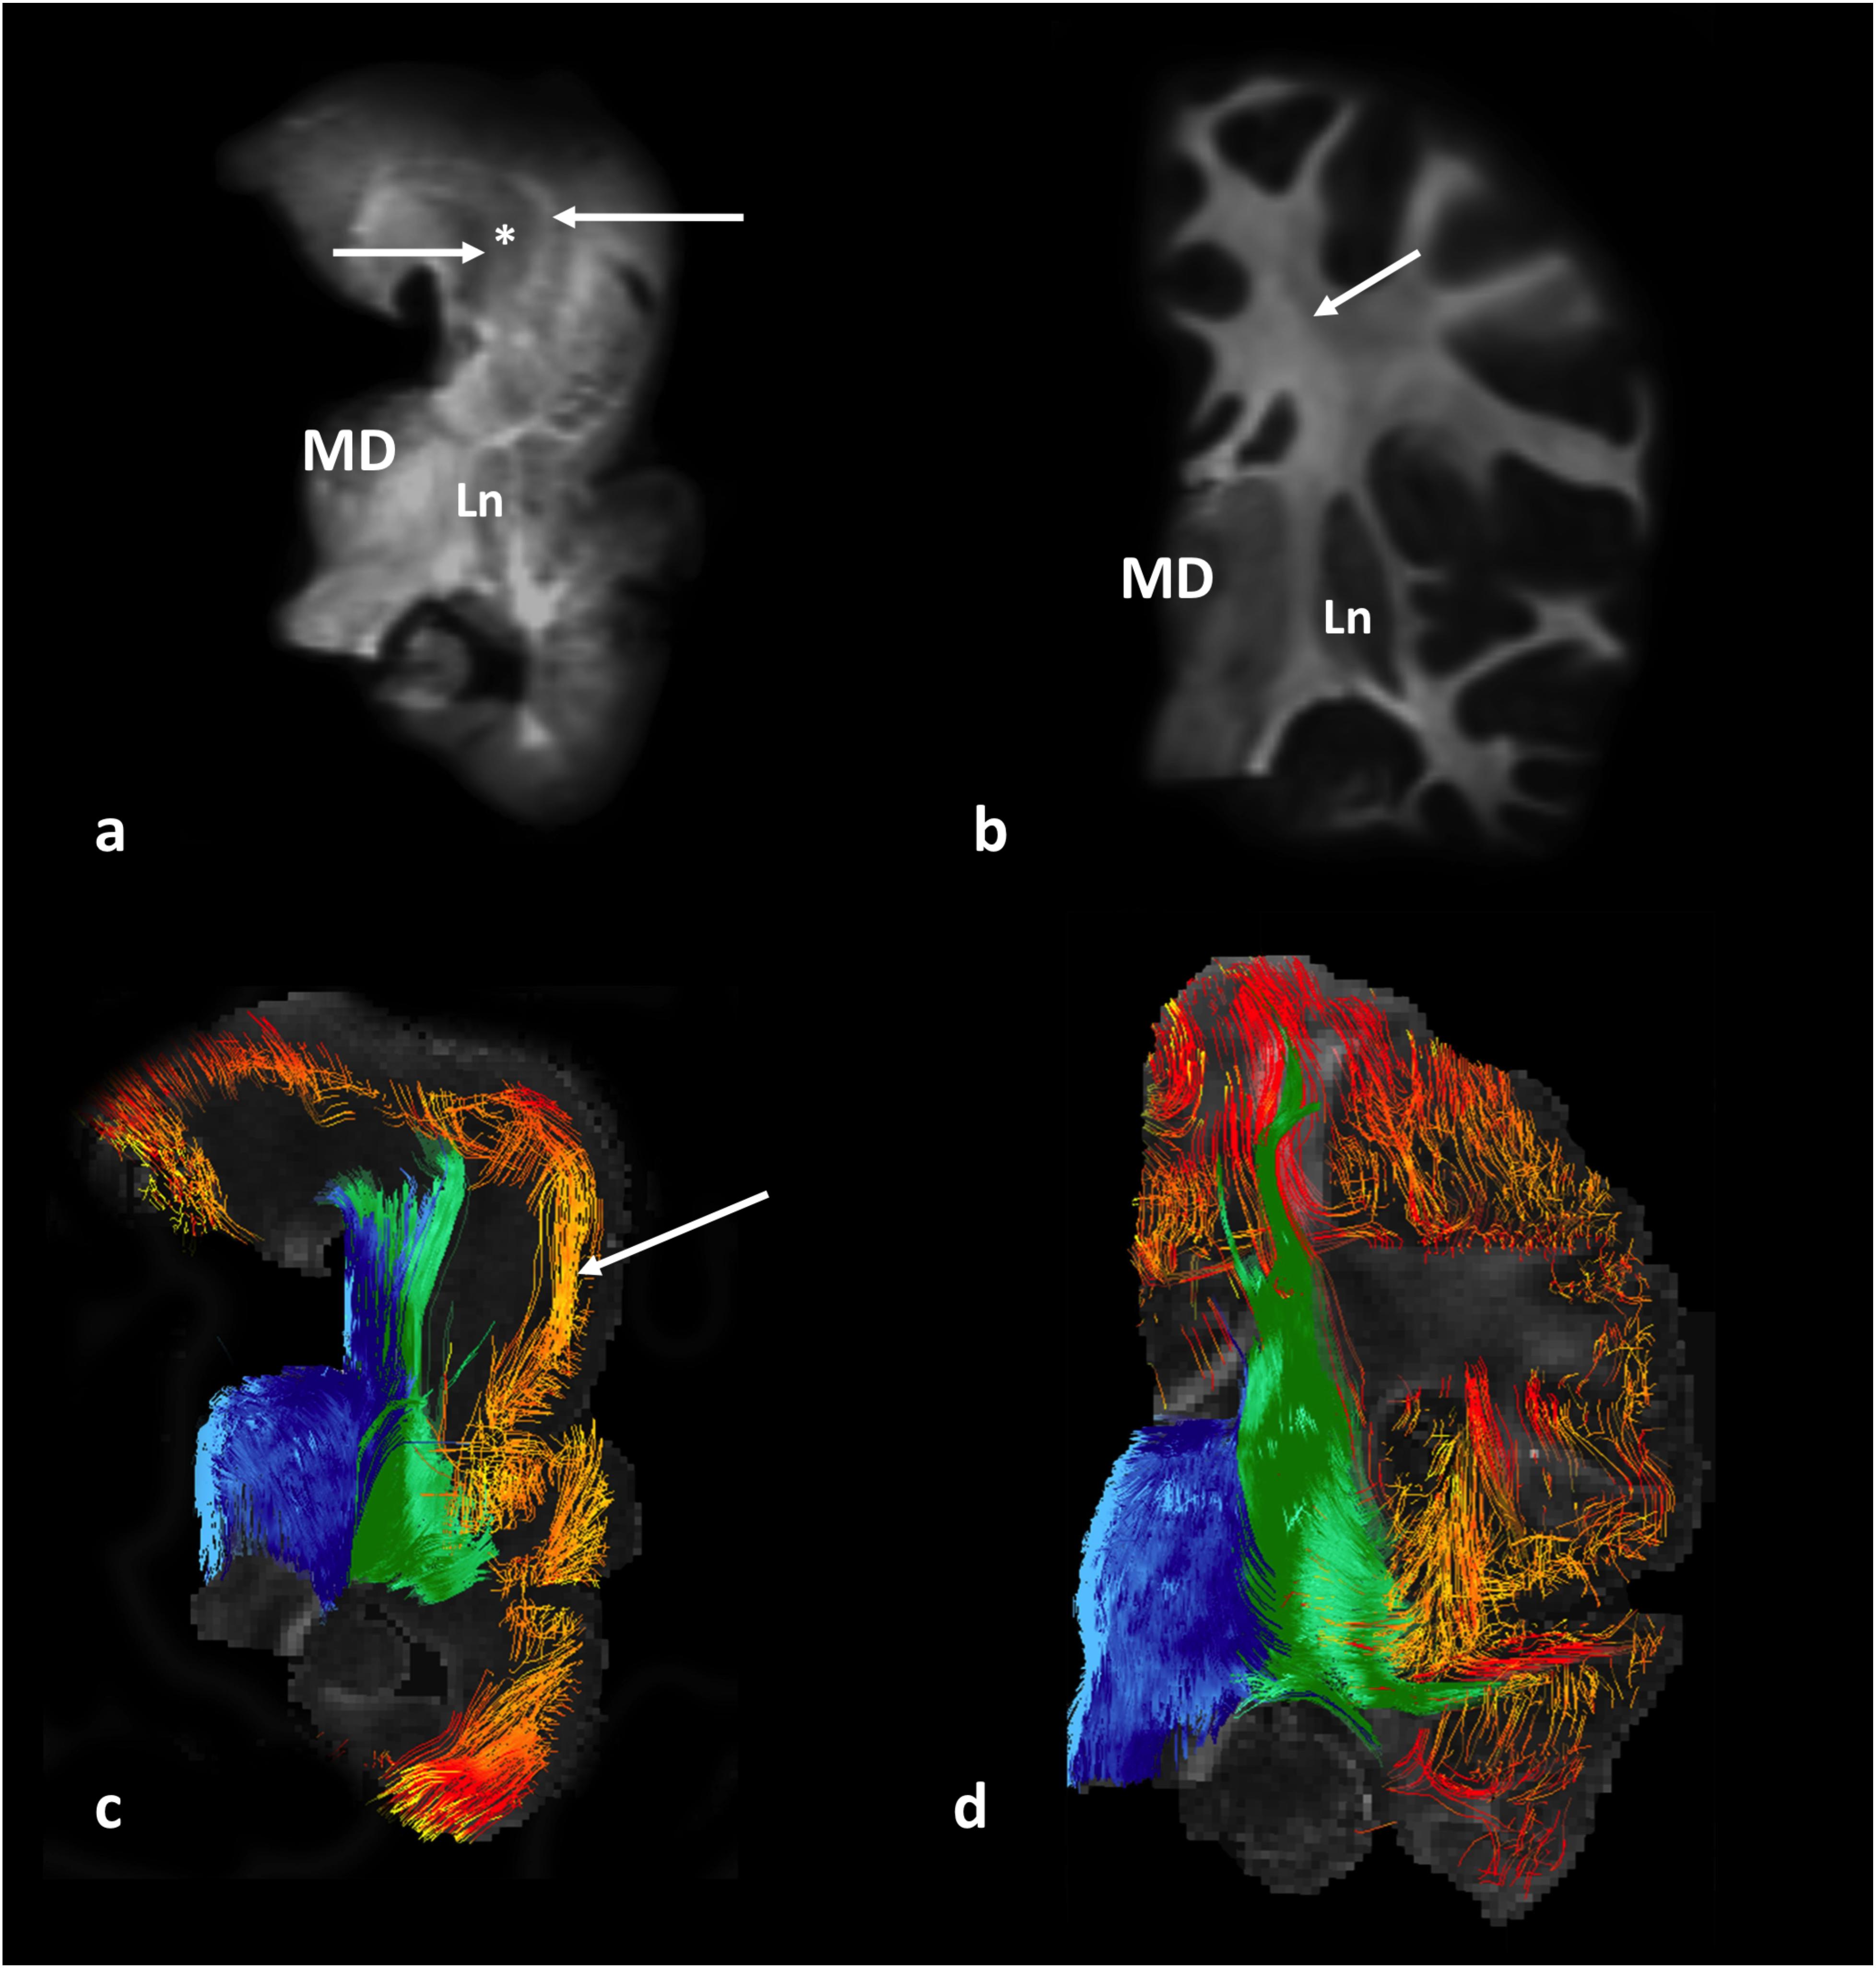
Figure 3. Diffusion-weighted MR images (upper row) and tract reconstructions (lower row) of post-mortem 1-year-old brain, specimen No. 641. Coronal slab passing through the mediodorsal nucleus of the thalamus (MD) with lissencephaly (a,c), and an age-matched control, specimen No. 1798 (b,d) are shown. Arrows in (a) indicate areas of identified projection pathways (that normally pass through fiber crossing area) next to a hypo-intense area (∗). Arrow in (b) indicates a fiber crossing area, composed of callosal, projection, and association fibers. The composition of fibers that pass through this crossing area and originate from the thalamus (blue) and lentiform nucleus and basal forebrain fibers (green) can be seen in c and d. Note the rostro-caudal orientation of “cortical fibers of undetermined origin/ending” (in red/yellow) in the prospective area of the inferior frontal gyrus in the brain with lissencephaly (arrow in c). MD, mediodorsal nucleus of the thalamus; Ln, lentiform nucleus.
Brain slices with neurofilament staining were processed and compared with tractography results in order to confirm that the reconstructed tractography pathways correspond to axonal fibers in lissencephaly and in control tissue slabs (Supplementary Figures S2, S3).
Finally, longitudinal in vivo analysis of DTI images of a subject with lissencephaly revealed altered fiber-architecture at two different time points: newborn and 5 years old (Supplementary Figure S4). Intra-cortical pathways placed in upper cortical layers showed tangential orientation (Supplementary Figure S4c, white arrow) while those in lower cortical layers showed radial orientation (Supplementary Figure S4c, black arrow). At both time points, we were not able to reconstruct pathways that connected cortical regions over a short distance (Supplementary Figure S4). Nevertheless, the inferior fronto-occipital fasciculus [Supplementary Figure S4d (in purple)] was reconstructed at both time points. Lastly, projection fiber bundles [Supplementary Figure S4d, thalamic fibers (in blue), basal ganglia, and basal forebrain fibers (in green)] continued to increase in volume with age.
Morphology and fiber pathways in the brain were examined using structural and diffusion MRI of patients with lissencephaly and neurologically healthy subjects. As could be expected, there was a significant difference in the hemispheric GI between the lissencephaly and age-/gender-matched control group (lissencephaly < control). In our dataset, the spatial distribution of agyric cortical regions was different in patients with LIS1 (PAFAH1B1 gene) and DCX mutations. LIS1 mutation was linked to diffuse agyria or predominant posterior regions of agyria, while DCX mutation predominantly affected anterior regions. Patients with lissencephaly had a preserved normal-like appearance of fissures and primary sulci in certain brain regions. Although patients with lissencephaly had significantly smaller hemispheric CGM and WM volume, we did not found significant differences between the groups in the volumes of the SGM. The patients with lissencephaly had a preserved spatiotemporal distribution of projection pathways, while short- to medium-range cortico-cortical association pathways were absent or fewer in number. Only a few detected cortico-cortical pathways in patients showed aberrant tangential trajectories within superficial cortical layers. There were also a number of radially oriented pathways within the lower cortical layers in patients with thick cortex-type lissencephaly, which were not present in control brains at the same age range. Lastly, we found a significant difference between the groups in the association between the age and CGM/WM volume ratio.
Although the mechanism for controlling global gyrification remains unclear, the majority of researchers suggest that there is a strong relationship between brain volume and the degree of gyrification (Im et al., 2008). However, others revealed, by a mathematical approach, that the absolute brain size plays a minor role in gyrification, and the length/number of fiber connections and the degree of gyrification are directly related across mammalian species (Herculano-Houzel et al., 2010). In agreement with the previous research, Germanaud et al. (2014) recently showed that there is a strong and positive relationship between the brain size and the level and complexity of gyrification and that this relationship can be characterized by allometric scaling laws for the general population. Moreover, using only the allometric scaling laws, one is able to fully explain the simplified gyral pattern and its variations in typically developing children with the smaller brain size. Contrarily, although these allometric scaling laws can be applied on children with brain development disorders (e.g., fetal alcohol syndrome or microcephaly), the gyrification complexity in these children might be unpredictable, i.e., disease-specific (Germanaud et al., 2014). Thus, the research from Germanaud et al. (2014) suggests that in the presence of brain development disease measurements of the brain size only might not be enough to predict the complexity of gyrification. Therefore, additional quantitative measures of the brain structures, such as volumes of the cerebral cortex, WM, and subcortical gray matter might be highly relevant for the identification of disease-specific gyrification pattern. In our study, we have measured volumes of the CGM, WM, and SGM in controls and patients with lissencephaly. Patients with lissencephaly had significantly smaller volumes of both CGM and WM and reduced gyral complexity. Although our results are in agreement with the previous research suggesting the link between gyrification and brain size, the smaller volumes of CGM and WM found in patients with lissencephaly might indicate the relevance of proper WM connectivity and cortical growth in the process of formation of cortical convolutions.
Patients with lissencephaly showed a negative association between the CGM/WM volume ratio and age indicating disproportional growth of WM compared to the CGM with age. These findings, limited by small number of subjects, resemble to the findings in normal human fetuses in which, during the last two trimesters [the periods of peak gyrification (Vasung et al., 2016) and rapid increase in the number of cortico-cortical connections (Vasung et al., 2017)], growth of WM volume surpasses the growth of CGM. Given that patients with lissencephaly showed atypical spatiotemporal patterns of brain connectivity (preservation of the long-range connections while only a low amount of short connections were observed) these findings suggest that sequential spatiotemporal development of connectivity and proper maturation of cerebral cortex most likely play a role in the process of gyrification. Another theory suggests that regionally differential rates of tangential expansions of the CGM, predominantly influenced by different cytoarchitectonic patterns across brain regions, may cause a “pattern-specific folding” (Ronan and Fletcher, 2015). This differential tangential expansion is possibly related to an abundant outgrowth and ingrowth of axonal upper-layer association connections in the second and third trimesters (Kostoviæ and Jovanov-Miloseviæ, 2006; Vasung et al., 2017). In addition, significant areal differences in gene expressions during the second and early third trimesters of pregnancy (Pletikos et al., 2014) might be linked to differential rates of tangential expansions between cortical areas. Therefore, one could speculate that the appearance of pattern-specific cortical folding is determined by conserved genetic mechanisms prenatally. Although we found significantly smaller volumes of CGM in lissencephaly, we did not assess regional differences in cortical volume between groups. Thus, lissencephaly, which is characterized by a reversed order of cortical layers, could provide a diseases model to test these hypotheses in the future.
The cerebellum appeared to be properly foliated in all patients. However, the variation in the voxel size and MRI quality limited the quantitative analysis of cerebellar folia. Involvement of cerebellum in lissencephaly has been associated with the mutations of DCX, TUBA1A, and LIS1 genes, and represents a distinctive heterogeneous group of cortical malformations (Ross et al., 2001). The severity of cerebellar abnormality in lissencephaly ranges from discrete midline hypoplasia to disturbed foliation and volume reduction (Ross et al., 2001), later being most commonly associated with the involvement the TUBA1A (Poirier et al., 2007) and RELN genes (Hong et al., 2000; Chang et al., 2007). RELN gene codes for extracellular matrix glycoprotein Reelin (Ogawa et al., 1995). During the fetal brain development, Reelin is secreted in telencephalon by Cajal–Retzius cells within the marginal zone [where it regulates neuronal migration (Tissir and Goffinet, 2003)] and in the cerebellum by the cells in the external granular layer (where it promotes Purkinje cell migration). Thus, the lack of cerebellar findings in our study could be explained by the lack of patients with identified RELN or TUBA1A mutations. However, this remains to be determined on a larger cohort of patients with lissencephaly.
The average volume of the cerebral cortex of the hemisphere in patients with lissencephaly was two and a half times smaller compared to age-matched controls, and all of our lissencephaly patients had thicker cerebral cortices than normal subjects (>5 mm) (Supplementary Table S3). This altered appearance of the cerebral cortex is most likely related to arrested neuronal migration and altered dendritic arborization of heterotopic pyramidal cells (Fleck et al., 2000). Our qualitative analysis of reconstructed fiber tracts in “thick” (Figure 3 and Supplementary Figures S2, S4) and “thin” (not shown) type of lissencephaly (Di Donato et al., 2017) revealed altered organization and orientation of cortical pathways, located or originating from superior cortical layers (Figure 3 and Supplementary Figure S4, white arrow), while projection pathways seem to preserve their proper orientation and position (Figure 3 and Supplementary Figure S4, white arrow) in both forms of lissencephaly.
In order to confirm whether tractography pathways correspond to axonal fibers, we have correlated our findings with histologically stained sections for neurofilament components. Our results revealed that patients with lissencephaly have altered architecture and orientation of axonal fibers, correlated with tractography pathways. Given that neuronal migration in lissencephaly is altered, especially of those neurons destined to upper cortical layers, improper position of neurons would ultimately lead to failure of proper development of short- to medium-range cortico-cortical association connections predominantly. These results are in agreement with other investigators (Poretti et al., 2013; Kamiya et al., 2014). However, due to the known limitations of diffusion tensor imaging (Jones et al., 2013), a larger study with co-registered histological slices is needed in order to characterize intracortical fibers in patients with various types of lissencephaly.
Finally, the negative association between age and CGM/WM volume suggests that during the development WM, compared to the CGM, grows faster in patients with lissencephaly. In addition, patients with lissencephaly had altered architecture of WM fibers, mostly affecting association fibers connecting upper cortical layers between different cortical areas. As patients with lissencephaly did not show a significant difference in the volume of SGM we suggest that the disproportionate age-related increase in the WM, compared to the CGM, could most likely reflect the age-related increase in the volume of projection fiber system. Thus, our results support the idea that detailed analysis of connectivity in patients with lissencephaly may be useful in future for classification of lissencephaly in relation to the clinical outcome, which has not been shown with the existing lissencephaly classifications (Di Donato et al., 2017). Moreover, given that myelination is somewhat preserved in lissencephaly (Barkovich et al., 1991) and that early brain activity is related to brain volume growth (Benders et al., 2015), about one-third of which is occupied by the WM volume, it is possible that an accelerated growth of the WM in patients with lissencephaly offers a window of opportunity for functional maturation and rehabilitation of survivors. However, this remains to be tested in a larger homogenous group of patients with this disorder.
Although all patients showed some common brain features in this study regardless of the genetic heterogeneity, the small sample size, differences in MRI acquisition parameters, and the genetic heterogeneity of the patients in this series may limit the power of the study with potential confounding. Lastly, due to the limited ex vivo tissue material (tissue blocks), we were not able to identify with certainty specific fiber pathways (such as inferior fronto-occipital fascicle or cerebrospinal tract).
Our results indicate that the severity and spatial distribution of agyria in patients with lissencephaly tend to be linked with identified genetic abnormalities (LIS1 or DCX mutation). Furthermore, patients with lissencephaly had significantly smaller volumes of the white and CGM compared to age-matched control groups. However, there was no significant difference between the groups in the volumes of the SGM. Histological and postmortem MR analyses indicated preserved spatiotemporal distribution of projection pathways, but the absence or few in number of short- to medium-range cortico-cortical association pathways in patients with lissencephaly. Thus, our results indicate that in patients with lissencephaly cortical system is affected more than the subcortical one.
Since this study was retrospective in nature and no identifying information would be requested by the researchers, it was determined that the informed consent would not be sought from the patients due to the low risk this study would present to them. Thus, a waiver of consent, in addition to all other procedures, was approved after due consideration by the BCH Institutional Review Board.
ET, AvdK, and NS collected the data. LV, AR, HY, JS, AP, FC-D, and ET analyzed the data. LV, TS, JL, and ET wrote and edited the manuscript.
The work was supported by the National Institutes of Health (NIH) R01HD078561, R21MH118739, R03NS091587, and R03NS101372 to ET; the NIH P41RR14075 and the P41 Regional Resource was supported by the Biomedical Technology Program of the National Center for Research Resources (NCRR). This work was also involved in the use of instrumentation supported by the NCRR Instrumentation Grant Program (NIH S10RR023401, S10RR019307, S10RR023043, and NIH S10RR016811). LV was supported by the SNSF grant P300PB_167804 and by the Ralph Schlaeger Foundation in Neuroradiology. JL was supported by the Natural Science and Engineering Research Council of Canada’s Canada Research Chair grant (231266), a Canada Foundation for Innovation and Nova Scotia Research and Innovation Trust infrastructure grant (R0176004), and a St. Francis Xavier University research startup grant (grant number R0168020).
The authors declare that the research was conducted in the absence of any commercial or financial relationships that could be construed as a potential conflict of interest.
Dr. Henry Feldman (BCH) provided advice on statistical analyses, Dr. Hart G. Lidov (BCH) provided comments on a previous version of this manuscript, Drs. Anthony Hill and Rongpin Wang (BCH) provided technical assistance, and Mr. Brandon Stevens (Northeastern University) provided editorial support.
The Supplementary Material for this article can be found online at: https://www.frontiersin.org/articles/10.3389/fcell.2019.00124/full#supplementary-material
Andescavage, N. N., du Plessis, A., McCarter, R., Serag, A., Evangelou, I., Vezina, G., et al. (2017). Complex trajectories of brain development in the healthy human fetus. Cereb. Cortex 27, 5274–5283. doi: 10.1093/cercor/bhw306
Armstrong, E., Curtis, M., Buxhoeveden, D. P., Fregoe, C., Zilles, K., Casanova, M. F., et al. (1991). Cortical gyrification in the rhesus monkey: a test of the mechanical folding hypothesis. Cereb. Cortex 1, 426–432. doi: 10.1093/cercor/1.5.426
Barkovich, A. J., Koch, T. K., and Carrol, C. L. (1991). The spectrum of lissencephaly: report of ten patients analyzed by magnetic resonance imaging. Ann. Neurol. 30, 139–146. doi: 10.1002/ana.410300204
Benders, M. J., Palmu, K., Menache, C., Borradori-Tolsa, C., Lazeyras, F., Sizonenko, S., et al. (2015). Early brain activity relates to subsequent brain growth in premature infants. Cereb. Cortex 25, 3014–3024. doi: 10.1093/cercor/bhu097
Catani, M., and Thiebaut de Schotten, M. (2008). A diffusion tensor imaging tractography atlas for virtual in vivo dissections. Cortex 44, 1105–1132. doi: 10.1016/j.cortex.2008.05.004
Chang, B. S., Duzcan, F., Kim, S., Cinbis, M., Aggarwal, A., Apse, K. A., et al. (2007). The role of RELN in lissencephaly and neuropsychiatric disease. Am. J. Med. Genet. B Neuropsychiatr. Genet. 144B, 58–63. doi: 10.1002/ajmg.b.30392
des Portes, V., Pinard, J. M., Billuart, P., Vinet, M. C., Koulakoff, A., Carrié, A., et al. (1998). A novel CNS gene required for neuronal migration and involved in X-linked subcortical laminar heterotopia and lissencephaly syndrome. Cell 92, 51–61. doi: 10.1016/s0092-8674(00)80898-3
Di Donato, N., Chiari, S., Mirzaa, G. M., Aldinger, K., Parrini, E., Olds, C., et al. (2017). Lissencephaly: expanded imaging and clinical classification. Am. J. Med. Genet. A 173, 1473–1488. doi: 10.1002/ajmg.a.38245
Di Donato, N., Timms, A. E., Aldinger, K. A., Mirzaa, G. M., Bennett, J. T., Collins, S., et al. (2018). Analysis of 17 genes detects mutations in 81% of 811 patients with lissencephaly. Genet. Med. 20, 1354–1364. doi: 10.1038/gim.2018.8
Dobyns, W. B. (1987). Developmental aspects of lissencephaly and the lissencephaly syndromes. Birth Defects Orig. Artic. Ser. 23, 225–241.
Fernández, V., Llinares-Benadero, C., and Borrell, V. (2016). Cerebral cortex expansion and folding: what have we learned? EMBO J. 35, 1021–1044. doi: 10.15252/embj.201593701
Fleck, M. W., Hirotsune, S., Gambello, M. J., Phillips-Tansey, E., Suares, G., Mervis, R. F., et al. (2000). Hippocampal abnormalities and enhanced excitability in a murine model of human lissencephaly. J. Neurosci. 20, 2439–2450. doi: 10.1523/jneurosci.20-07-02439.2000
Germanaud, D., Lefèvre, J., Fischer, C., Bintner, M., Curie, A., des Portes, V., et al. (2014). Simplified gyral pattern in severe developmental microcephalies? New insights from allometric modeling for spatial and spectral analysis of gyrification. Neuroimage 102(Pt 2), 317–331. doi: 10.1016/j.neuroimage.2014.07.057
Herculano-Houzel, S., Mota, B., Wong, P., and Kaas, J. H. (2010). Connectivity-driven white matter scaling and folding in primate cerebral cortex. Proc. Natl. Acad. Sci. U.S.A. 107, 19008–19013. doi: 10.1073/pnas.1012590107
Ho, J., Tumkaya, T., Aryal, S., Choi, H., and Claridge-Chang, A. (2018). Moving beyond P values: everyday data analysis with estimation plots. bioRxiv
Hong, S. E., Shugart, Y. Y., Huang, D. T., Shahwan, S. A., Grant, P. E., Hourihane, J. O., et al. (2000). Autosomal recessive lissencephaly with cerebellar hypoplasia is associated with human RELN mutations. Nat. Genet. 26, 93–96. doi: 10.1038/79246
Im, K., Lee, J.-M., Lyttelton, O., Kim, S. H., Evans, A. C., and Kim, S. I. (2008). Brain size and cortical structure in the adult human brain. Cereb. Cortex 18, 2181–2191. doi: 10.1093/cercor/bhm244
Jones, D. K., Knösche, T. R., and Turner, R. (2013). White matter integrity, fiber count, and other fallacies: the do’s and don’ts of diffusion MRI. Neuroimage 73, 239–254. doi: 10.1016/j.neuroimage.2012.06.081
Kamiya, K., Tanaka, F., Ikeno, M., Okumura, A., and Aoki, S. (2014). DTI tractography of lissencephaly caused by TUBA1A mutation. Neurol. Sci. 35, 801–803. doi: 10.1007/s10072-014-1662-3
Kostoviæ, I., and Jovanov-Miloseviæ, N. (2006). The development of cerebral connections during the first 20-45 weeks’ gestation. Semin. Fetal Neonat. Med. 11, 415–422. doi: 10.1016/j.siny.2006.07.001
Kostovic, I., and Rakic, P. (1990). Developmental history of the transient subplate zone in the visual and somatosensory cortex of the macaque monkey and human brain. J. Comp. Neurol. 297, 441–470. doi: 10.1002/cne.902970309
Lohmann, G., von Cramon, D. Y., and Colchester, A. C. F. (2008). Deep sulcal landmarks provide an organizing framework for human cortical folding. Cereb. Cortex 18, 1415–1420. doi: 10.1093/cercor/bhm174
MacDonald, D., Kabani, N., Avis, D., and Evans, A. C. (2000). Automated 3-D extraction of inner and outer surfaces of cerebral cortex from MRI. Neuroimage 12, 340–356. doi: 10.1006/nimg.1999.0534
Mori, S., Crain, B. J., Chacko, V. P., and van Zijl, P. C. (1999). Three-dimensional tracking of axonal projections in the brain by magnetic resonance imaging. Ann. Neurol. 45, 265–269. doi: 10.1002/1531-8249(199902)45:2<265::aid-ana21>3.0.co;2-3
Ogawa, M., Miyata, T., Nakajima, K., Yagyu, K., Seike, M., Ikenaka, K., et al. (1995). The reeler gene-associated antigen on Cajal-Retzius neurons is a crucial molecule for laminar organization of cortical neurons. Neuron 14, 899–912. doi: 10.1016/0896-6273(95)90329-1
Pletikos, M., Sousa, A. M. M., Sedmak, G., Meyer, K. A., Zhu, Y., Cheng, F., et al. (2014). Temporal specification and bilaterality of human neocortical topographic gene expression. Neuron 81, 321–332. doi: 10.1016/j.neuron.2013.11.018
Poirier, K., Keays, D. A., Francis, F., Saillour, Y., Bahi, N., Manouvrier, S., et al. (2007). Large spectrum of lissencephaly and pachygyria phenotypes resulting from de novo missense mutations in tubulin alpha 1A (TUBA1A). Hum. Mutat. 28, 1055–1064. doi: 10.1002/humu.20572
Poretti, A., Meoded, A., Rossi, A., Raybaud, C., and Huisman, T. A. (2013). Diffusion tensor imaging and fiber tractography in brain malformations. Pediatr. Radiol. 43, 28–54. doi: 10.1007/s00247-012-2428-9
Rakic, P. (1972). Mode of cell migration to the superficial layers of fetal monkey neocortex. J. Comp. Neurol. 145, 61–83. doi: 10.1002/cne.901450105
Régis, J., Mangin, J.-F., Ochiai, T., Frouin, V., Riviére, D., Cachia, A., et al. (2005). “Sulcal root” generic model: a hypothesis to overcome the variability of the human cortex folding patterns. Neurol. Med. Chir. 45, 1–17. doi: 10.2176/nmc.45.1
Reiner, O., Carrozzo, R., Shen, Y., Wehnert, M., Faustinella, F., Dobyns, W. B., et al. (1993). Isolation of a Miller-Dieker lissencephaly gene containing G protein beta-subunit-like repeats. Nature 364, 717–721. doi: 10.1038/364717a0
Ronan, L., and Fletcher, P. C. (2015). From genes to folds: a review of cortical gyrification theory. Brain Struct. Funct. 220, 2475–2483. doi: 10.1007/s00429-014-0961-z
Ross, M. E., Swanson, K., and Dobyns, W. B. (2001). Lissencephaly with cerebellar hypoplasia (LCH): a heterogeneous group of cortical malformations. Neuropediatrics 32, 256–263. doi: 10.1055/s-2001-19120
Sherif, T., Rioux, P., Rousseau, M.-E., Kassis, N., Beck, N., Adalat, R., et al. (2014). CBRAIN: a web-based, distributed computing platform for collaborative neuroimaging research. Front. Neuroinform. 8:54. doi: 10.3389/fninf.2014.00054
Takahashi, E., Folkerth, R. D., Galaburda, A. M., and Grant, P. E. (2012). Emerging cerebral connectivity in the human fetal brain: an MR tractography study. Cereb. Cortex 22, 455–464. doi: 10.1093/cercor/bhr126
Tissir, F., and Goffinet, A. M. (2003). Reelin and brain development. Nat. Rev. Neurosci. 4, 496–505. doi: 10.1038/nrn1113
Vasung, L., Lepage, C., Radoš, M., Pletikos, M., Goldman, J. S., Richiardi, J., et al. (2016). Quantitative and qualitative analysis of transient fetal compartments during prenatal human brain development. Front. Neuroanat. 10:11. doi: 10.3389/fnana.2016.00011
Vasung, L., Raguz, M., Kostovic, I., and Takahashi, E. (2017). Spatiotemporal relationship of brain pathways during human fetal development using high-angular resolution diffusion MR imaging and histology. Front. Neurosci. 11:348. doi: 10.3389/fnins.2017.00348
Viot, G., Sonigo, P., Simon, I., Simon-Bouy, B., Chadeyron, F., Beldjord, C., et al. (2004). Neocortical neuronal arrangement in LIS1 and DCX lissencephaly may be different. Am. J. Med. Genet. A 126A, 123–128. doi: 10.1002/ajmg.a.20569
Widjaja, E., Geibprasert, S., Mahmoodabadi, S. Z., Blaser, S., Brown, N. E., and Shannon, P. (2010). Alteration of human fetal subplate layer and intermediate zone during normal development on MR and diffusion tensor imaging. AJNR Am. J. Neuroradiol. 31, 1091–1099. doi: 10.3174/ajnr.A1985
Zilles, K., Armstrong, E., Schleicher, A., and Kretschmann, H. J. (1988). The human pattern of gyrification in the cerebral cortex. Anat. Embryol. 179, 173–179. doi: 10.1007/bf00304699
Keywords: lissencephaly, gyrification, LIS1, DCX mutation, MRI, DTI
Citation: Vasung L, Rezayev A, Yun HJ, Song JW, van der Kouwe A, Stewart N, Palani A, Shiohama T, Chouinard-Decorte F, Levman J and Takahashi E (2019) Structural and Diffusion MRI Analyses With Histological Observations in Patients With Lissencephaly. Front. Cell Dev. Biol. 7:124. doi: 10.3389/fcell.2019.00124
Received: 31 January 2019; Accepted: 26 June 2019;
Published: 11 July 2019.
Edited by:
Kazuhito Toyo-oka, Drexel University, United StatesCopyright © 2019 Vasung, Rezayev, Yun, Song, van der Kouwe, Stewart, Palani, Shiohama, Chouinard-Decorte, Levman and Takahashi. This is an open-access article distributed under the terms of the Creative Commons Attribution License (CC BY). The use, distribution or reproduction in other forums is permitted, provided the original author(s) and the copyright owner(s) are credited and that the original publication in this journal is cited, in accordance with accepted academic practice. No use, distribution or reproduction is permitted which does not comply with these terms.
*Correspondence: Emi Takahashi, RW1pLlRha2FoYXNoaUBjaGlsZHJlbnMuaGFydmFyZC5lZHU=; ZW1pQG5tci5tZ2guaGFydmFyZC5lZHU=
Disclaimer: All claims expressed in this article are solely those of the authors and do not necessarily represent those of their affiliated organizations, or those of the publisher, the editors and the reviewers. Any product that may be evaluated in this article or claim that may be made by its manufacturer is not guaranteed or endorsed by the publisher.
Research integrity at Frontiers
Learn more about the work of our research integrity team to safeguard the quality of each article we publish.