- 1Department of Civil, Chemical, Environmental and Material Engineering, University of Bologna, Bologna, Italy
- 2Istituto Nazionale di Geofisica e Vulcanologia, Osservatorio Sismologico di Arezzo, Arezzo, Italy
The rise of human activities and the constant increase of vehicles traffic in the cities, and in particular of heavy vehicles such as buses and trucks, causes continues ambient vibrations that can detrimentally affect the conservation of built artifacts, especially historical constructions. The effects of urban vibrations on buildings and monuments are far from being fully investigated. In general, peak levels of traffic-induced vibrations are rarely high enough to be the main cause of heavy structural damages. On the other hand, they contribute to the process of deterioration by adding extra stresses—through fatigue damage accumulation occurring as a result of long periods of exposure to low levels of vibration—or by contributing to soil densification—which can lead to the settlement of building foundations. As such, the estimation of threshold levels above which traffic-induced vibrations may cause damages to monumental buildings requires specific studies including long-time monitoring campaigns. Data from experimental campaign can, indeed, be used to extract information on the variation of dynamic properties of buildings, thus providing valuable pieces of information for a complete knowledge to plan effective preservation interventions. The present work aims to identify the effects of traffic induced urban vibrations on the two Towers of Bologna, particularly prone to fatigue-related damages and close to a high transit of vehicles, through a preliminary analysis of data from several dynamic monitoring campaigns conducted during the last years.
Introduction
The assessment of the structural health of historical buildings is fundamental to preserve their cultural integrity. For this purpose, Structural Health Monitoring (SHM) plays a crucial role in providing information both on the dynamic properties of the structures and on the damage caused by earthquakes, impacts or traffic loads. In the last decade, the number of SHM systems designed and implemented on historic structures increased considerably (Gentile and Saisi, 2007; Gentile et al., 2016; Azzara et al., 2017, 2018, 2019a,b; Ubertini et al., 2018). SHM perfectly meets principles and guidelines of Italian and European seismic codes concerning historical buildings, which require the preservation of the structural architectural integrity, promoting removable, non-invasive, and compatible solutions in the knowledge process, restoration, and strengthening [ICOMOS, 2003; ISCARSAH (International Scientific Committee for Analysis and Restoration of Structures of Architectural Heritage), 2003]. The data obtained from a dynamic monitoring system can be used to gather more precise information regarding the fundamental dynamic properties such as frequencies and modes of vibration and modal damping ratios. This information are useful to develop reliable numerical models and help to plan effective strengthening interventions. Since the use of these techniques allows to make measurements without any damage to the building and without interfering with its normal use, they appear particularly suitable for the analysis of structures of historical and monumental interest. Recording vibrations on built structures is an efficient way to empirically estimate their fundamental frequencies of vibration. Furthermore, the wide frequency content of the ambient noise, due to the superimposition of multiple sources, allows to recognize almost all the main modal frequencies in a single step. Vibrations due to anthropic activities are one of the main factors for fatigue-induced damages in monumental buildings (Piyush et al., 2015). For this reason, with the increase of heavy traffic in the cities, the study of the effects of the road traffic vibrations induced on the historical buildings is becoming an important issue (Crispino and D'Apuzzo, 2001; Ivorra and Pallarés, 2006; Ramos et al., 2010; Ma et al., 2011; Saisi et al., 2015; Díaz et al., 2017; Roselli et al., 2017; Ubertini et al., 2017; Gentile et al., 2019). Moreover, continuous monitoring allows to record streams of seismic ambient noise for long time intervals in order to retrieve the temporal evolution of the structural behavior considering the influence of both ambient conditions (temperature, humidity, wind velocity and intensity) and of human activities (traffic loads). In this regard, several monitoring experiments have been performed in 2012, 2013–2014, 2016–2017, and 2018 on the Asinelli and Garisenda Towers, two masonry leaning towers erected in the center of Bologna (Northern Italy). The work presents selected results obtained from the analysis of the whole data set. First, the attention is paid in the identification of the main dynamic properties of the Two Towers and their variation with traffic-induced vibrations. The dynamic properties obtained from the monitoring are then compared with those computed from Finite Element (FE) models, considering both a new FE model of the Garisenda Tower and available FE models of the Asinelli Tower developed in the past by Palermo et al. (2015). Then, an analysis of selected time history is conducted to evidence specific effects due to ambient sources or traffic-induced vibrations. Finally, the results of the analysis of data obtained from the transit of heavy vehicles at the different speeds are given.
Garisenda and Asinelli, the two Towers
The Garisenda and Asinelli Towers (generally known as “The Two Towers”) are the main monuments of the city of Bologna, North Italy (Figure 1). The Asinelli Tower, the taller one (97 m), is the highest leaning tower in Italy (it tilts toward South-West of 2.23 m; Cavani, 1912), built between 1109 and 1119 by the Asinelli family. In the following century it was transferred to the Municipality in the following century to be used for military purposes and as prison. During the Second World War, the Tower was used as a watchtower. Today, under the portico, some craft shops have been relocated to commemorate the commercial function of the medieval “middle market.” From a structural point of view, the external walls were built using solid bricks for the outer skins and rubble masonry fill. The total thickness of the masonry decreases almost linearly from 3.15 m at the base to 0.45 m at the top. Three main discontinuities are present at 11.5, 34.0, and 56.0 m (Figure 1B; Palermo et al., 2015). The nearby Torre Garisenda, older than the previous one, has a height of 48 meters and a large overhang (3.40 toward South-East) due to a strong subsidence of the foundation ground. During the construction phases, in fact, the phenomenon caused a visible tilt of the Tower (Ceccoli et al., 2001) so that between 1351 and 1360 it became necessary to demolish the upper 12 m to prevent the risk of collapse. The Tower cross section reduces with height as the common construction practice at that time (Figure 1C; Francisco, 2000).
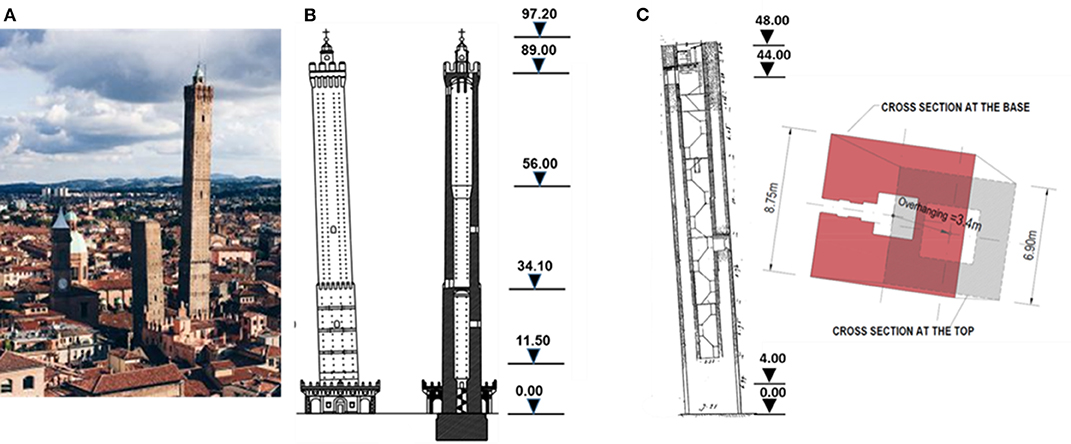
Figure 1. (A) The Two Towers of Bologna. (B) Asinelli Tower elevation with the indication of the main discontinuities. (C) Garisenda Tower elevation and cross sections at two different heights.
The assessment of the evolution along time of the structural health of the towers is a crucial issue in order to preserve these monuments and plan effective conservation interventions. For this reason, at the beginning of the 2011, the Municipality decided to install a static SHM systems in both the Towers with the purpose of monitoring the opening of the main cracks, the inclination, together with environmental parameters (Baraccani et al., 2014, 2017). In addition, starting from 2012, after the Emilia earthquakes (20th May 2012 and 29th May 2012, respectively 5.8 and 5.6 Mw; Ubertini et al., 2017), repeated seismometric monitoring campaigns have been commissioned by the Municipality to the Istituto Nazionale di Geofisica e Vulcanologia (INGV) in conjunction with the University of Bologna with the purpose of obtaining information on the dynamic behavior of the Two Towers.
Data Analyses From Long-Term Monitoring (Ambient Vibration)
In the last 8 years, the following seismometric monitoring campaigns have been conducted (Azzara et al., 2014):
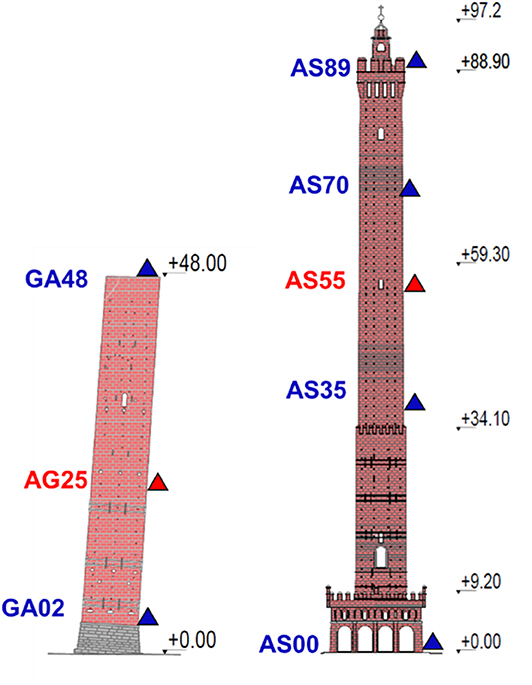
1. From June to September 2012: six seismic stations, 4 in the Asinelli and 2 in the Garisenda (equipped with Lennartz Le3d5s three-axial seismometers coupled to 24-bit Reftek 72A-07/08), were installed along the height of each Towers, see Figure 2 (blue triangles).
2. From September 2013 to March 2014: eight seismic stations, 5 in the Asinelli and 3 in the Garisenda (equipped with Lennartz Le3d5s coupled to 24-bit Reftek 130), were installed along the height of each Towers, see Figure 2 (blue and red triangles).
3. From August to October 2014: three seismic stations (SS20 2Hz seismometer coupled to a SL06 24 bit DAS from Sara Electronics S.r.l.), were installed only on the Asinelli Tower, see Figure 2 (blu triangles, AS00, AS35 and AS89).
4. From November 2016 to February 2017: two seismic stations (Lennartz Le3d5sand Reftek 72A07), were installed on the Asinelli tower (one at the basement and one at the top level).
5. From January to March 2018: three seismic stations (SS20 and SL06 SARA), were deployed inside the Garisenda Tower at the same locations of the 2013 survey.
The seismic stations, synchronized by GPS signals, were set in continuous mode, recording at 100 or 200 sps. The sensors were oriented along the North-South and East-West axes in order to directly compare the signals recorded at the same time inside the Towers. The first two experiments were aimed at evaluating the variation of modal parameters between the warmer season of the year (Summer-2012) and the colder ones (Autumn–Winter 2013-2014). The third experiment was designed in 2014 after the completion of the maintenance works on the road pavement at the base of the Towers to evaluate their effects upon the amplitudes of the traffic induced vibrations. After the second main shock of the Central Italy seismic sequence (October 30th, 2016, Mw = 6.5), the campaign 2016–2017 was designed. During this experiment the seismic sequence occurred in Central Italy on January 18th 2017 (magnitude between 2 and 5.5) was recorded at the top level of Asinelli Tower. The data analysis of the seismic response of the Towers is out of the scope of the present paper and will be part of a future work. Finally, the last experiment in 2018 was carried out on the Garisenda Tower in order to evaluate the potential effects of the degradation of the selenitic base on the modal parameters of the Tower. The interested reader can find some preliminary results on the influence of the material degradation on the static behavior of the Tower in Baraccani et al. (2019).
Fundamental Frequencies From Experimental Data
The average spectra computed over the entire monitoring period of 2013 (second campaign) of the three components (East-West, North-South, and Vertical) as recorded by the top station are shown in Figure 3A for the Asinelli Tower and Figure 3B for the Garisenda Tower. The spectra are obtained averaging the average daily spectra along the entire considered time frame. The average daily spectra are obtained from the individual spectra, each computed on a time interval of 2 min (Azzara et al., 2014).
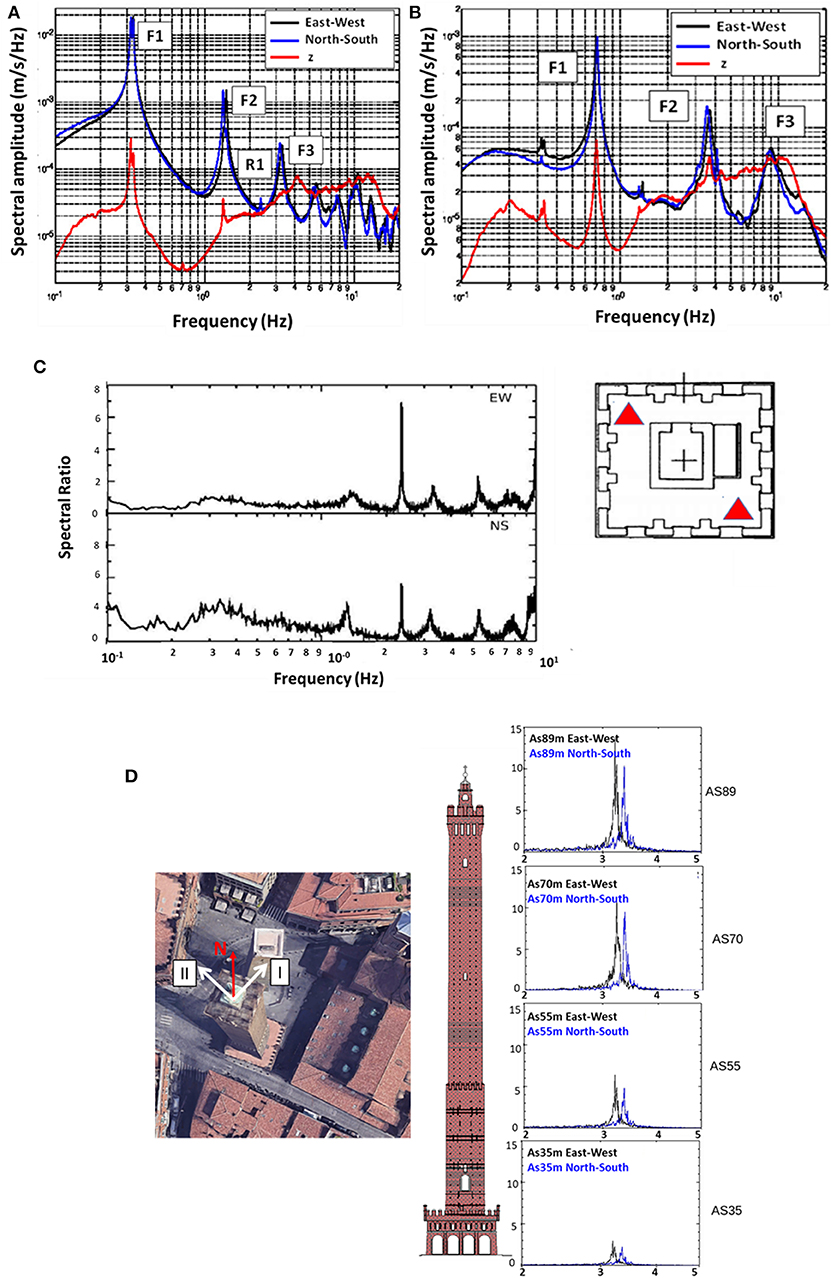
Figure 3. (A) Average spectra computed over the entire monitoring period during 2013 for the top station of Asinelli Tower (B) and Garisenda Tower. (C) Experimental identification of the frequency of the torsional mode for the Asinelli Tower. On the left spectral ratio between horizontal and vertical components and on the right the position of the seismic stations on the terrace at the top of the Asinelli Tower. (D) Splitting of the fundamental frequencies. On the right separation of the horizontal spectral peaks after rotation. On the left, superimposed to an aerial view of the Towers, are shown the main axes of oscillation of the Asinelli Tower.
The first three fundamental flexural frequencies (referred to as F1, F2, F3, in Figure 3A) of the Asinelli Tower fall within the range of 0.32–0.33 Hz, 1.3–1.5 Hz, and 3.0–3.3 Hz (Palermo et al., 2014; Baraccani et al., 2016). The third peak (R1 in Figure 3A) of the spectrum of the horizontal components is associated to a torsional motion. The experimental identification of the torsional mode has been carried out through a spectral ratio technique. Two seismic stations have been installed at opposite corners of the terrace in the upper part of the Asinelli Tower. The phase-opposing components of the horizontal registrations were extracted from the recorded signals. Therefore, since the vertical component was certainly not sensitive to the torsional mode, the ratio between the spectrum of the phase-opposing horizontal components and that of the vertical component was used to emphasize the spectral peak corresponding to the torsional mode (Figure 3C).
The first three fundamental flexural frequencies of the Garisenda Tower fall within the range of 0.71–0.73 Hz, 3.7–4 Hz, and 8.8–9.0 Hz, respectively (Figure 3B; Baraccani et al., 2017).
Note that, for both Towers, the values of the experimental frequencies have been also compared to the ones obtained from finite element models for a further confirmation of the modal shapes associated to the each spectral peak (see next section).
The average spectrum of the Asinelli Tower (Figure 3A) is characterized by the “splitting” of the two fundamental frequencies along the main directions EW and NS. The frequency splitting may be a sign of structural asymmetry or related to the leaning angle of the Towers since a perfectly square and straight tower should theoretically have equal fundamental frequencies of vibrations along the two main directions. The splitting is visible in the spectra of all the seismic stations and for the three flexural modes. Taking into account that the sensors were geographically oriented along NS and EW directions, the two signals have been numerically rotated in order to find the direction of maximum splitting that could allow identifying the principal directions. Table 1 lists the values of the angles of principal directions α (measured clockwise from North, corresponding to axis I) together with the frequency values along the two principal directions (I and II) for the three fundamental flexural modes of the Asinelli and Garisenda Towers. For the Asinelli Tower, the relative discrepancy between the two frequencies related to first flexural mode along the two principal directions does not exceed the 5%. For the Garisenda Tower the splitting phenomenon is practically negligible since the relative discrepancy between the two frequencies related to first flexural mode along the two principal directions does not exceed 1%. Note that the third flexural frequency has not been detected by instrument GA25, thus possibly indicating that the instrument was position around a nodal location for that particular mode. The information collected in Table 1 may give indications regarding the structural asymmetry and modal shapes. For illustrative purpose, Figure 3D shows the results of this analysis for the Asinelli Tower considering the data from 2013 campaign, when the maximum number of seismic stations (four stations along the length) was used.

Table 1. Angle of principal directions α (measured clockwise from North) and measured frequencies along EW and NS directions, for the three fundamental flexural modes of all the stations installed in 2013 inside the Asinelli and Garisenda Towers.
A careful inspection of the spectral response of the Garisenda Tower (Figure 3B) allows to capture a quite interesting phenomenon, that is the presence of two small spectral peaks at frequencies corresponding to the fundamental frequencies of the Asinelli Tower. Such phenomenon can be interpreted as a mutual induction effect of oscillation. The same effect is also visible on the vertical average spectrum of the Asinelli Tower that exhibits in this frequency band the minimum spectral amplitude (Figure 3A).
The seasonal variation of the fundamental frequency (along EW direction) of both Towers is shown in Figure 4. The horizontal axis reports the Julian day, while the ordinates gives the corresponding frequency value. Data are reported for a time interval of 15 min. For the Garisenda Tower, the fundamental frequency tends to decrease from summer to winter, even though the maximum variations are <5%. For the Asinelli Tower, no clear seasonal trend is detected and the maximum variations of the fundamental frequency are around 5–6%.
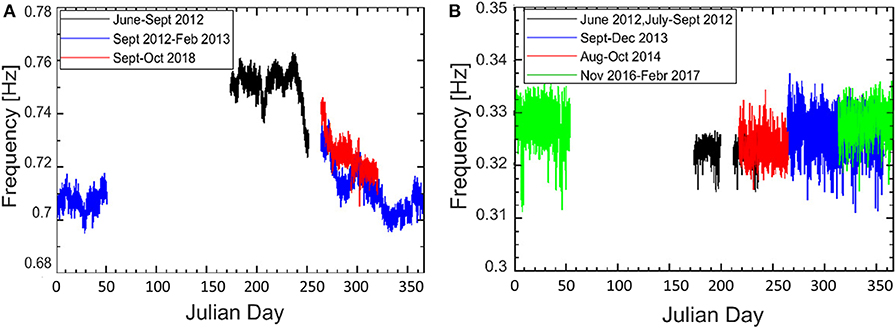
Figure 4. Seasonal trend of the fundamental frequency along EW direction. (A) Garisenda Tower and (B) Asinelli Tower.
Figures 5A,B provide the average horizontal spectra as computed from each experimental campaign in order to highlight eventual changes in the spectral shapes due to seasonal effects.
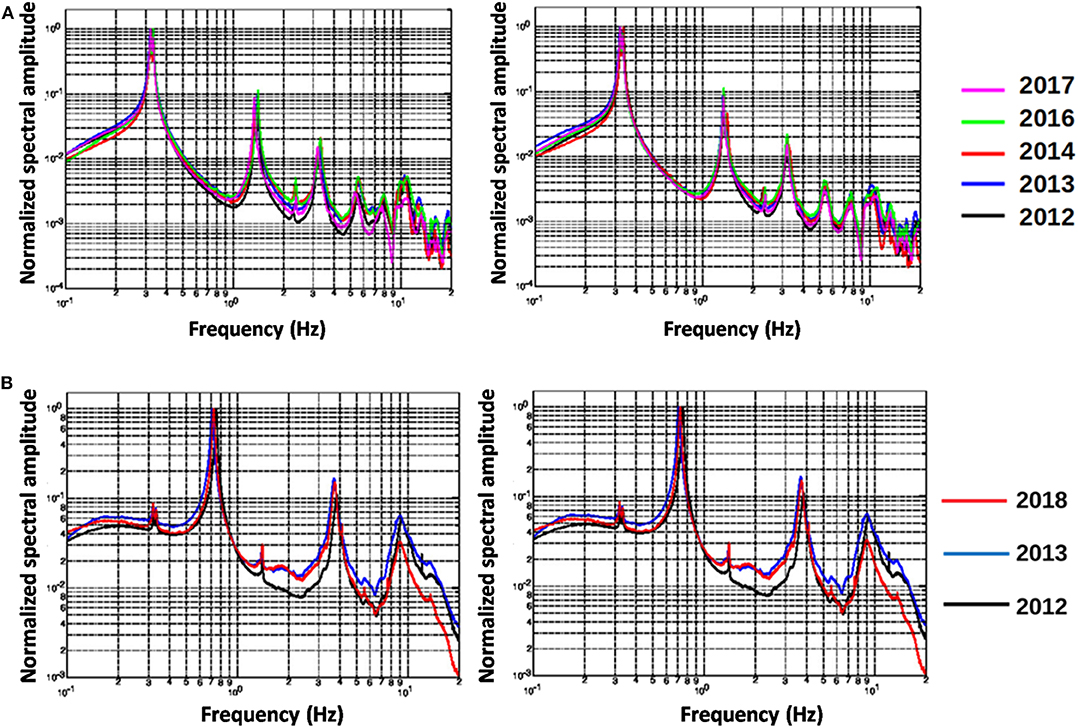
Figure 5. Total average horizontal spectra (EW on the left, NS on the right) computed over the entire monitoring periods performed over several years according to the color legend for (A) Asinelli Tower and (B) Garisenda Tower.
For both Towers, the graphs show an overall stability of the peaks corresponding to the main modes of oscillation. Figures 6A,B show a window of the average spectral shape around the first peak (0.2–0.5 Hz) for each campaign to better highlight the slight variation of the first frequency due to seasonal effects. For both Towers, the variations of the first modal frequencies (which seems to be slightly more evident for the Garisenda Tower) do not exceed 1% of the average value. Furthermore, for the Asinelli Tower, comparing the shapes of the spectra for the different surveys it is possible to recognize a slight variation of the spectral shape between summer and winter.
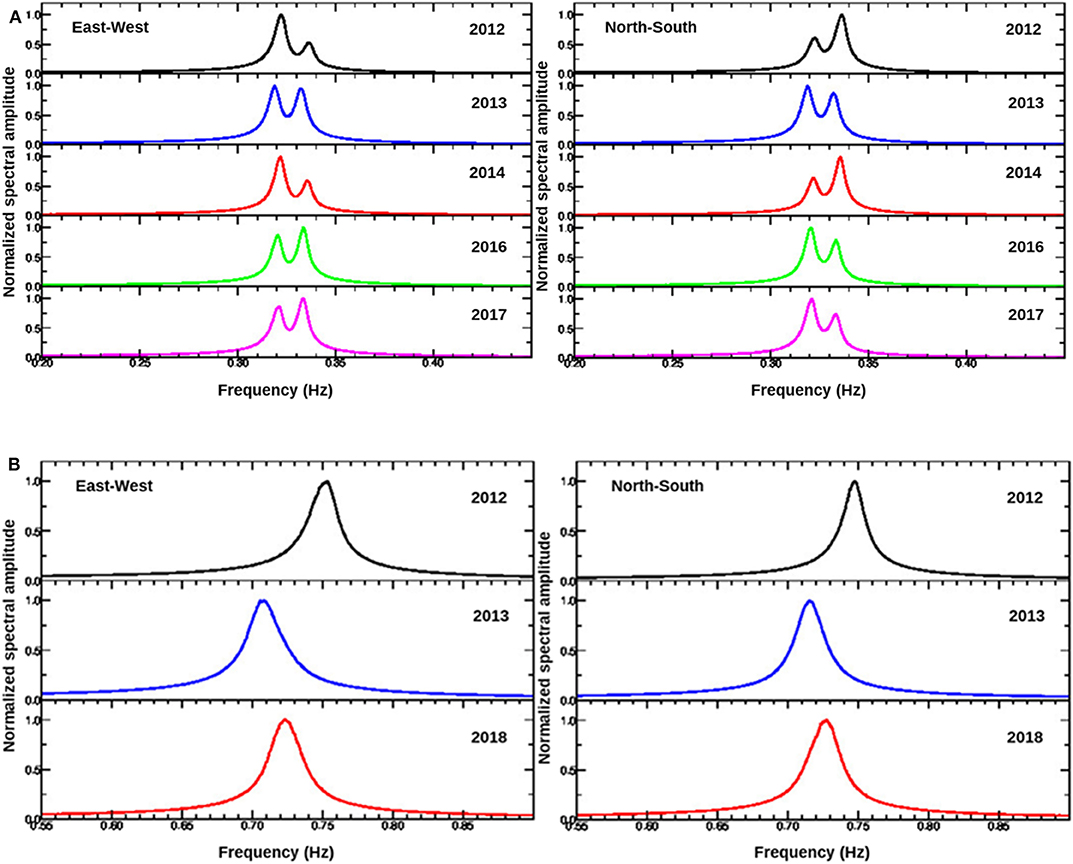
Figure 6. Spectral peak corresponding to the F1 first flexural mode obtained from the data recorded in the different surveys (EW component on the left and NS on the right) for (A) Asinelli Tower and (B) Garisenda Tower.
Fundamental Frequencies From FE Models
The studies and researches available in the literature devoted to the evaluation of structural health of the Two Towers were focused exclusively on the Asinelli Tower, while no specific investigations were conducted to the Garisenda Tower. This is probably due to a potential lager seismic vulnerability of the Asinelli Tower due to its intrinsic geometric characteristics, such as the high slenderness (Carpinteri et al., 2015). In the past, several numerical simulations based on finite element models were carried out to assess the seismic response of the Asinelli Tower (Riva et al., 1998; Invernizzi et al., 2019).
In this regard, some of the authors developed FE models of increasing complexity (mono and bi-dimensional models considering different base conditions) to compare the results of the modal analysis with the frequencies obtained from the first dynamic monitoring campaign (Palermo et al., 2015). The models were built according to the results of few material tests and did not account for the presence of the openings. The results of the work shows that the first flexural periods as obtained from both mono and bi-dimensional FE models and considering a fixed base condition are in the range of 3.37 s (0.3 Hz) and 3.48 s (0.28 Hz) while they increase to values between 3.58 s (0.28 Hz), and 3.69 s (0.27 Hz) when considering the soil-structure interaction. Based on the assumed geometrical and limited material properties used to develop the FE models, it results that the FE models with the fixed base conditions give values of the fundamental period closer to the average experimental values. The frequencies and mode shapes of the first four natural modes of vibrations as obtained from the FE models (reported in Table 6 of Palermo et al., 2015) allows to associate the first, second and fourth experimental frequency to flexural modes, while the third experimental frequency can be associated to a torsional mode (as already noticed in the previous section). It should be noted that none of the available FE models is able to reproduce the observed frequency splitting. This indicates that more accurate FE models are necessary for a more precise match of the experimental frequencies and associated modes of vibration. In this regard, the use of output only modal identification techniques could allow to identify experimental mode shapes to be then compared with those obtained by FE models to evaluate the influence of model parameters and modeling assumptions.
In the present work, FE models of the Garisenda Tower have been developed using the commercial software SAP2000 (CSI), considering the presence of the openings. The soil-structure interaction is not considered. Two different models have been developed: a shell model with walls modeled by mean of 4-nodes isotropic shell elements of around 25 cm side (2D model), and a brick model with walls modeled as solid elements (3D model, Figure 7A).
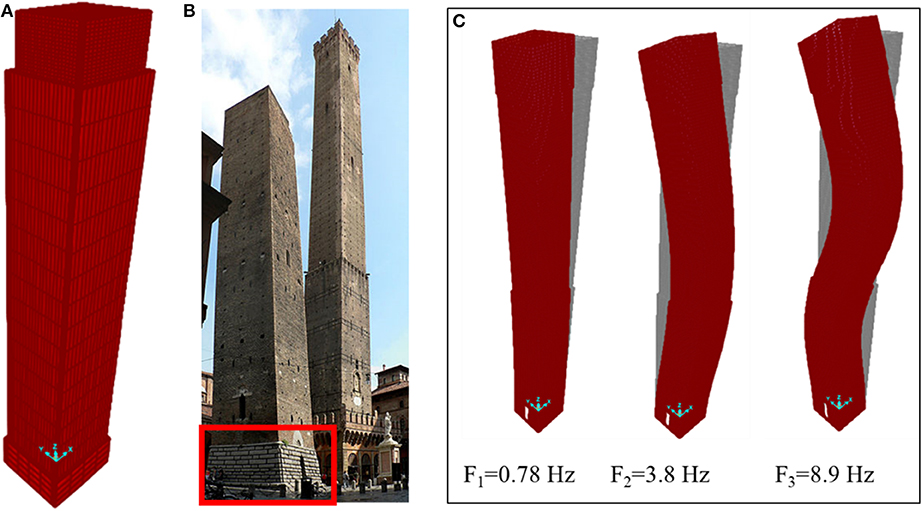
Figure 7. (A) Solid FE model of the Garisenda Tower, (B) external selenitic stones added in the 1889, and (C) first three natural mode shapes of the Garisenda Tower as obtained from the 2D FE model analyses.
The FE models account for the actual sections variation, consider the different typologies of the masonry and the Tower inclination. More in detail, the first 4 meters from the base of the Tower are characterized by an external and internal perimeter of selenitic stones (thickness of around 60 cm) with an internal filling of rubble and mortar (thickness of around 160 cm). In the 1889, a further external selenitic layer was attached to the wall (Figure 7B). Starting from a height of 4 m up to the top of the Tower, the walls are made by two bricks leaves with an internal infill. In the 2D model, the multi-leaves walls have been modeled considering an equivalent homogeneous material whose main properties (specific weight, thickness, elastic modulus, Poisson ratio) are presented in Table 2 (see Palermo et al., 2015 for details regarding the homogenization). For the 3D model, the values of the material properties of each component (brick, mortar and infill and selenitic blocks) are those based on the experimental tests reported in Table 3 of Palermo et al. (2015). Modal analysis has been developed to evaluate the frequencies of vibrations and the mode shapes (Figure 7C). Direction x and y of the FE model are coincident with the E-W and N-S directions of the Tower. The three fundamental frequencies obtained from 2D and 3D FEM models are close to each other and in good agreements with the experimental one.

Table 2. The main geometric characteristic and material properties of the different portions along the height of the Garisenda Tower.
For both Towers, Table 3 compares the experimental values of the first frequency (F1, exp) with the ones obtained according to the simplified analytical formula (F1, an) proposed in the work by Bartoli et al. (2017; Equation 10). Similarly, Table 4 report the main geometrical and mechanical characteristics (elastic modulus E, wall thickness s, Tower height H and side widths a and b) together with the experimental values of the first frequency for selected masonry Towers (Bartoli et al., 2017).

Table 3. Experimental vs. analytical values of the fundamental frequency for the Asinelli and Garisenda Towers.

Table 4. Experimental values of the fundamental frequency for selected masonry towers as available from the scientific literature.
It can be noted the value of the fundamental frequency of the Asinelli Tower is close to that of the Mangia Tower in Siena, that has also mechanical and geometrical properties similar to those of the Asinelli Tower. The value of the fundamental frequency of the Garisenda Tower are, instead, comparable with those of the Ghirlandina Tower in Modena (that however is significantly taller and larger than the Garisenda Tower) and St. Martin Bell Tower in Venice, that has a height comparable to that of the Garisenda even though quite more slender.
Recorded Time-History Responses
Dynamic continuous monitoring, if performed for a sufficient long time frame, can be a useful tool to determine the effects of the ambient parameters on the dynamic response. The first aspect considered in the study is the variation of the amplitude of oscillation with the level of anthropic noise due to the daily vehicular traffic at the base of the Towers. Figures 8A,B show 8 consecutive days of records from the top station of the Asinelli and Garisenda respectively, including working days, holiday, and weekend. Each plot provide the record of an entire day along one direction (E-W, N-S, and Vertical). The signals are filtered between 1 and 20 Hz, (the frequency band where the seismic ambient noise is known to be dominated by “cultural sources,” Bonnefoy-Claudet et al., 2006) since the aim of the analysis is to evaluate the average level of oscillations due to anthropic sources distinguishing working days from holidays. During a typical working day, a sharp increment in the amplitude of the oscillations is observed when the human activity rises (about at 6: am, local time), followed by a gradual reduction in the amplitudes of oscillations during the evening up to an almost absence of vibrations during the night (after the 1.00 a.m. local time). During holidays (indicated in red color), the time interval with larger oscillation amplitudes is concentrated around lunch time (from 11 a.m. to 4 p.m.).
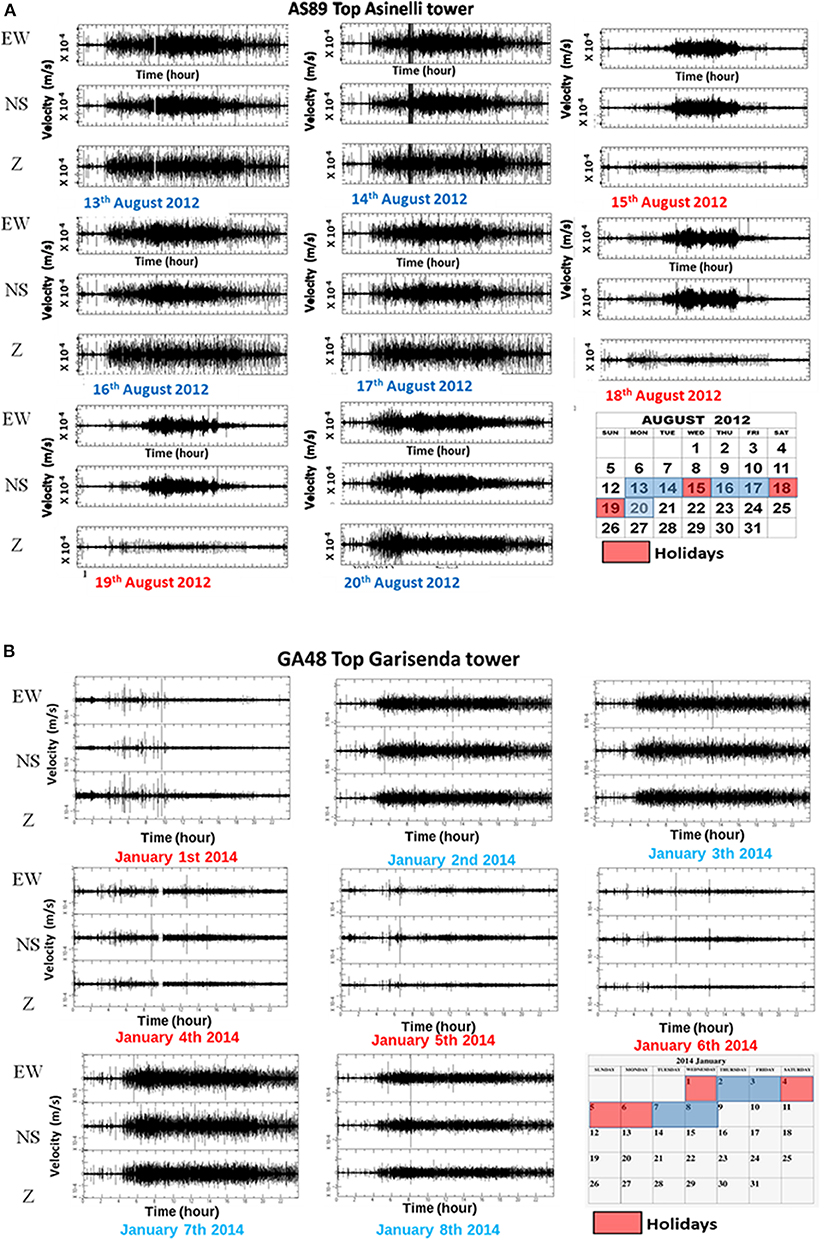
Figure 8. Daily trend of the oscillation recorded by the top station of: (A) The Asinelli Tower from 13th to 20th August 2012; (B) the Garisenda Tower from 1th to 8th January 2014. The signal has been filtered in the 1–20 Hz frequency band, in order to point out the content associated with the anthropic noise surrounding the Tower.
To evaluate the amplitude ratio of the oscillation between night and day and between weekdays and holidays, the trends of the maximum amplitudes of oscillation have been analyzed, considering the hourly peaks. In detail, the average peak is obtained as the average of the hourly peaks within the time frame of interest. The values of the day/night amplitude ratio are between 2 and 6 on weekdays and do not exhibit evident differences between weekday and holidays.
The continuous monitoring allows recognizing the propagation inside the Towers of transients that trigger beatings at the top of the Asinelli Tower. Figure 9A shows the time history of the three components of the signals (duration equal to 200 s) recorded by the three stations. The signals recorded by the station at the top clearly show beatings. The phenomenon was investigated by Palermo et al. (2014) using a simplified eccentric planar model with an equivalent eccentric and torsional stiffness. The results indicate that the values of the equivalent eccentricity appears compatible with some partial wall disconnections due to cracks propagating along the openings or with not efficient connections between orthogonal walls. It could be of interest to model the presence of through cracks or partial connections between orthogonal walls with detailed FE models.
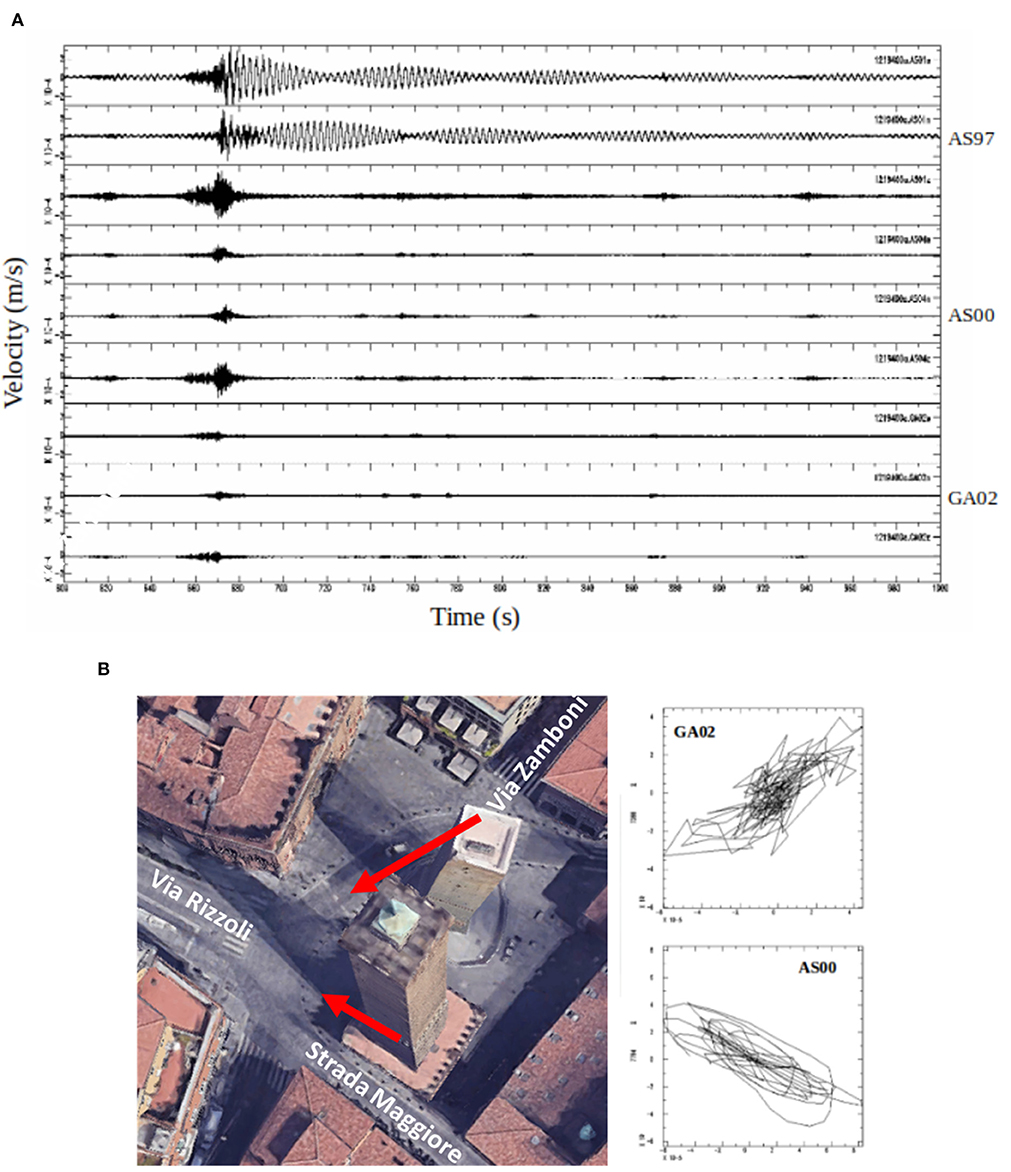
Figure 9. (A) Example of transient propagating inside the Towers and triggering beatings at the Top level of Asinelli Tower. Each set of three signals are the waveforms on the Z, NS, EW directions, from down to top, respectively, for GA02, AS00, and AS97 measurements point. (B) Particle motion analysis along the horizontal directions for the two seismic stations installed at the base of the Two Towers.
In order to identify the possible source of the impulse at the base, a horizontal particle motion analysis of the signal recorded at the base of the Two Towers has been performed. Figure 9B shows that the cross point of the composition of the horizontal components, taking into account the position of the instrumentation inside the Towers, points toward the intersections of roads “Via Rizzoli” and “Strada Maggiore” (as shown by the red arrows), daily traveled by heavy vehicular traffic.
Data Analyses From Heavy-Traffic Campaign
In October 2014, during the execution of some maintenance works along road “Strada Maggiore” requiring the road closure, an experimental test has been performed in order to record the Asinelli Tower vibrations induced by the passage of a heavy truck along the road (Figure 10A). The truck made five passages at different speeds (10, 20, and 30 km/h) with and without “obstacle.” The presence of a sudden discontinuity in the pavement was simulated placing a wooden beam (the “obstacle”) in the direction perpendicular to the road.
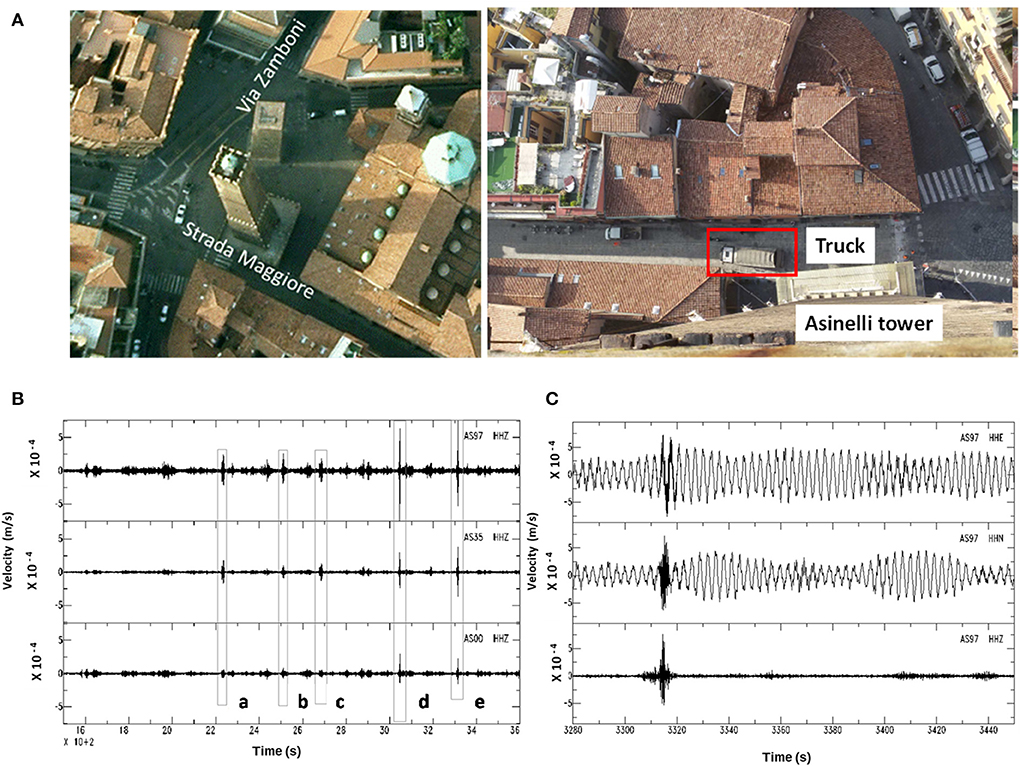
Figure 10. (A) On the left, view of the position of the Two Towers (Google Earth) and on the right, picture of the transit of a truck along Strada Maggiore during the experimental measurements. (B) Vertical component waveforms recorded at the three measurement points during the five passages of the truck. (C) Waveforms recorded during the most energetic test (E) at the top level station, from top to down, respectively, EW, NS, and Z components.
For each measurement, the following tests have been conducted (Figure 10A):
a. truck moving at 20 km/h with no obstacle
b. truck moving at 30 km/h with no obstacle
c. truck moving at 10 km/h in correspondence of the storm drain
d. truck moving at 30 km/h with obstacle
e. truck moving at 10 km/h with obstacle
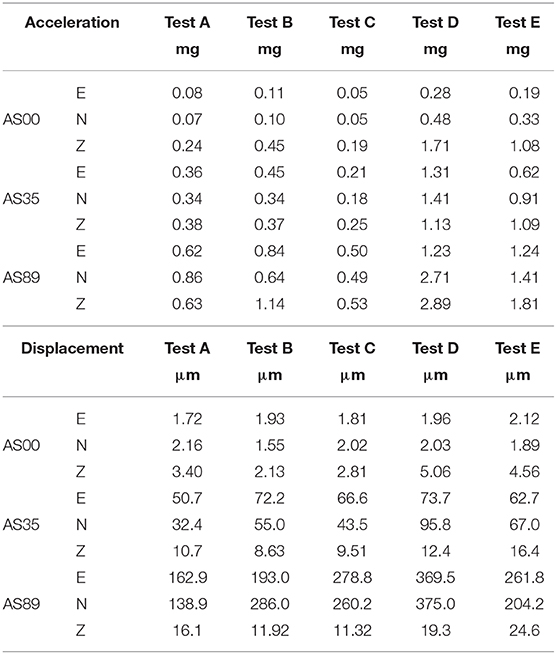
Figure 10B displays the time history of the vertical component of the recorded velocity. During the first three passages (A, B, C) the recorded signal at the base (AS00) did not evidence clear peaks. Nonetheless, the responses of the Tower shows clear evidence of the propagation of the signal at the instant of the transit of the truck. During the last two tests (D and E), the recorded signal at the base shows a clear peak that propagate along the height of the Tower causing an oscillation of significant amplitude. In addition, the impulsive signal caused beatings similar to those observed during the continuous monitoring campaigns (Figure 10C). This observation seems to confirm that the input at the base produced by heavy traffic along the roads surrounding the Towers is responsible for the observed beatings. The acceleration and displacement peak values recorded during the tests are collected in Table 5. For instance, the largest acceleration and displacement peak values, recorded at the top along the horizontal direction (corresponding to tests D, E), are equal to 3 mg and 0.4 mm, respectively.
Conclusions
The present paper analyzed the continuously recorded data obtained from the long term seismometric monitoring of the Two Towers of Bologna. Five different campaigns have been carried out since 2012 to investigate the variation of modal parameters due to the traffic-induced vibrations.
The first result of the whole experimental activity lies in the identification of the average fundamental frequencies of vibrations. For the Asinelli Tower, the first three flexural modes and the first torsional mode are clearly identified. Each fundamental flexural mode shows a “splitting” along the two principal direction of oscillation and the spectral shapes around the first mode seem to be influenced by the seasonal effects. The modal splitting (maximum discrepancy in the fundamental mode of around 5%) and the evaluation of the principal angles may be useful to recognize the modal shapes. For the Garisenda Tower, the first three flexural modes have been recognized. For both Towers, the average values of the fundamental frequencies do not show a significant variation (<1%) within different seasons and during the years. The comparison between the measured frequencies and the frequencies obtained from both the available FE models of the Asinelli Tower and the new ones developed for the Garisenda Tower based on the material properties available from few experimental tests conducted in the past, shows, in general, a good agreement between measured and numerically obtained values. However, the developed FE models cannot capture the modal splitting.
The analysis of the time history records from long-term monitoring clear highlights the correlation between the amplitude of the recorded signal and the intensity of the human activities. In particular, the peck amplitude during the rush hours are between 2 and 6 time larger than those recorded during weekends and holidays. The analyses also allowed recognizing beating phenomena triggered by transient propagating inside the Asinelli Towers. The phenomenon may indicate the presence of through cracks along the opening and/or partially effective connections between the orthogonal walls. Such effects could be investigated more in depth in future studies by modeling the presence of through cracks along the openings and considering partial connections between orthogonal walls through ad-hoc finite element models.
Finally, the analysis of the passage of an heavy truck at different velocities allowed to correlate the peak values of acceleration with the speed of the an heavy vehicle. For a velocity of 50 km/h the peak accelerations may reach, in presence of disruptions in the road, values of 3 mg. In addition, those tests clearly evidenced beatings effects of similar features to those evidenced from the long term monitoring.
In conclusion, the whole amount of data collected during the different experimental campaigns represents a comprehensive dataset on which developing further specific analyses on the influence of anthropic activities on the fatigue strength.
Data Availability Statement
The datasets generated for this study are available on request to the corresponding author, in accordance with the regulations of the Institutes.
Author Contributions
This work makes use of data obtained from a long term seismometric monitoring of the Two Tower of Bologna carried out by RA. SB, MP, and RA contributed in the interpretation and analyses of these data to evaluate the dynamic proprieties, and the effects of urban vibration upon the Towers. SB contributed in the numerical analyses. RA, GG, and TT supervised this work, identifying the general research lines.
Conflict of Interest
The authors declare that the research was conducted in the absence of any commercial or financial relationships that could be construed as a potential conflict of interest.
Acknowledgments
The authors gratefully acknowledge Dr. Ing. Gilberto Dallavalle who provided valuable information on the structural geometries and mechanical properties of the materials. The experimental activities have been partially funded by research agreements between University of Bologna, INGV and Bologna Municipality.
References
Azzara, R. M., Cavaliere, A., Danesi, S., and Morelli, A. (2014). Il monitoraggio sismico della Torre degli Asinelli e della Garisenda. Risultati preliminari dell'analisi dei dati. Report number: 284, Affiliation: Istituto Nazionale di Geofisica e Vulcanologia.
Azzara, R. M., de Falco, A., Girardi, M., and Pellegrini, D. (2017). Ambient vibration recording on the maddalena bridge in borgo a Mozzano (Italy): data analysis. Ann. Geophys. 60:S0441. doi: 10.4401/ag-7159
Azzara, R. M., De Roeck, G., Girardi, M., Padovani, C., Pellegrini, D., and Reynders, E. (2018). The influence of environmental parameters on the dynamic behaviour of the San Frediano bell tower in Lucca. Eng. Struct. 156, 175–187. doi: 10.1016/j.engstruct.2017.10.045
Azzara, R. M., Girardi, M., Iafolla, V., Lucchesi, D. M, Padovani, C, and Pellegrini, D. (2019b). Ambient Vibrations of age-old masonry towers: results of long-term dynamic monitoring in the historic centre of Lucca. Int. J. Archit. Herit. doi: 10.1080/15583058.2019.1695155
Azzara, R. M., Girardi, M., Padovani, C., and Pellegrini, D. (2019a). Experimental and numerical investigations on the seismic behaviour of the San Frediano bell tower in Lucca. Ann. Geophys. 61:SE342. doi: 10.4401/ag-8025
Baraccani, S., Gasparini, G., Palermo, M., Silvestri, S., and Trombetti, T. (2014). A possible interpretation of data acquired from monitoring systems. The Twelfth International Conference on Computational Structures Technology (CST2014) (Naples), 106. doi: 10.4203/ccp.106.100
Baraccani, S., Palermo, M., Azzara, R. M., Gasparini, G., Silvestri, S., and Trombetti, T. (2017). “Structural interpretation of data from static and dynamic structural health monitoring of monumental buildings,” in Key Engineering Materials Vol. 747. doi: 10.4028/www.scientific.net/KEM.747.431
Baraccani, S., Palermo, M., Gasparini, G., Silvestri, S., Trombetti, T., and Azzara, R. M. (2016). “The static and dynamic monitoring of the asinelli tower in Bologna, Italy,” in Proceedings of 8th European Workshop on Structural Health Monitoring (EWSHM).
Baraccani, S., Piccolo, A., Gasparini, G., and Palermo, M. (2019). “An assessment of the structural behaviour of the Garisenda tower in bologna through finite element modelling and structural health monitoring,” in Proceedings of 7th International Conference on Computational Methods in Structural Dynamics and Earthquake Engineering (COMPDYN 2019) (Crete), doi: 10.7712/120119.7314.19061
Bartoli, G., Betti, M., Marra, A. M., and Monchetti, S. (2017). Semiempirical formulations for estimating the main frequency of slender masonry towers. J. Perform. Constr. Facil. 31, 1–10. doi: 10.1061/(ASCE)CF.1943-5509.0001017
Bonnefoy-Claudet, S., Cotton, F., and Bard, P. Y. (2006). The nature of noise wavefield and its applications for site effects studies. A literature review. Earth-Science Rev. 79, 205–227. doi: 10.1016/j.earscirev.2006.07.004
Carpinteri, A., Lacidogna, G., Manuello, A., and Niccolini, G. (2015). A study on the structural stability of the Asinelli Tower in Bologna. Struct. Control Heal. Monit. 23, 659–667. doi: 10.1002/stc.1804
Casarin, F., Modena, C., and Simonato, E. (2009). “Dynamic identification of the St. Martin bell-tower of Burano, Venice,” in Proceedings of 3rd International Operational Modal Analysis Conference (IOMAC 2009) (Portonovo).
Cavani, F. (1912). Sulla Pendenza e Sulla Stabilità Della Torre Degli Asinelli di Bologna. Memorie della R. Accademia delle Scienze dell'Istituto di Bologna, Classe di Scienze Fisiche, Serie VI, Tomo, IX (Bologna), 103–126.
Ceccoli, C., Diotallevi, P., Pozzati, P., Sanpaolesi, L., and Dallavalle, G. (2001). Indagini inerenti le strutture murarie e fondali e consolidamento delle parti in elevazione della Torre Garisenda. Italian Report.
Colapietro, D., Fiore, A., Netti, A., Fatiguso, F., Marano, C. C., De Fino, M., et al. (2013). “Dynamic identification and evaluation of the seismic safety of a masonry bell tower in the south of Italy,” in Proceedings of 4th International Conference on Computational Methods (COMPDYN 2013) (Kos Island), 3459–3470. doi: 10.7712/120113.4751.C1418
Crispino, M., and D'Apuzzo, M. (2001). Measurement and prediction of traffic-induced vibrations in a heritage building, J. Sound Vib. 246, 319–335. doi: 10.1006/jsvi.2001.3648
CSI. (1975). SAP2000 Integrated Software for Structural Analysis and Design. Berkeley, CA: Computers and Structures Inc.
Díaz, J., Ruiz, M., Sánchez-pastor, P. S., and Romero, P. (2017). Urban seismology : on the origin of earth vibrations within a city. Sci. Rep. 7:15296. doi: 10.1038/s41598-017-15499-y
Ferraioli, M., Mandara, A., and Miccoli, L. (2011). “Dynamic identification and seismic safety of masonry bell towers,” in 14th Conference of Seismic Engineering (Bari).
Gentile, C, Guidobaldi, M., and Saisi, A. (2016). One-year dynamic monitoring of a historic tower: damage detection under changing environment. Meccanica 51, 2873–2889. doi: 10.1007/s11012-016-0482-3
Gentile, C., Ruccolo, A., and Canali, F. (2019). Continuous monitoring of the Milan Cathedral: dynamic characteristics and vibration-based SHM. J. Civ. Struct. Heal. Monit. 9, 671–688. doi: 10.1007/s13349-019-00361-8
Gentile, C., and Saisi, A. (2007). Ambient vibration testing of historic masonry towers for structural identification and damage assessment. Constr. Build. Mater. 21, 1311–1321. doi: 10.1016/j.conbuildmat.2006.01.007
ICOMOS (2003). “ICOMOS Charter- Principles for the Analysis, Conservation and Structural Restoration of Architectural Heritage,” in Principles, 3–6, Proceedings of the ICOMOS 14th General Assembly in Victoria Falls (Zimbabwe).
Invernizzi, S., Lacidogna, G., Lozano-Ramírez, N. E., and Carpinteri, A. (2019). Structural monitoring and assessment of an ancient masonry tower. Eng. Fract. Mech. 210, 429–443. doi: 10.1016/j.engfracmech.2018.05.011
ISCARSAH (International Scientific Committee for Analysis and Restoration of Structures of Architectural Heritage) (2003). Recommendations for the analysis, conservation and structural restoration of Architectural Heritage. (Zimbabwe: General Assembly in Victoria Falls; ICOMOS), 3–6.
Ivorra, S., and Pallarés, F. J. (2006). Dynamic investigations on a masonry bell tower. Eng. Struct. 28, 660–667. doi: 10.1016/j.engstruct.2005.09.019
Lancellotta, R., and Sabia, D. (2015). Identification technique for soilstructure analysis of the Ghirlandina tower. J. Archit. Herit. 9, 391–407. doi: 10.1080/15583058.2013.793438
Ma, M., Markine, V., Liu, W. N., Yuan, Y., and Zhang, F. (2011). Metro train-induced vibrations on historic buildings in Chengdu, China. J. Zhejiang Univ. Sci. A. 12, 782–793. doi: 10.1631/jzus.A1100088
Palermo, M., Azzara, R. M., Baraccani, S., Cavaliere, A., Morelli, A., Silvestri, S., et al. (2014). Measurements of the free vibration response of the asinelli tower in bologna and its interpretation. Proceedings of II International Conference on Earthquake Engineering and Seismology (Istanbul), 1–12.
Palermo, M., Silvestri, S., Gasparini, G., Baraccani, S., and Trombetti, T. (2015). An approach for the mechanical characterisation of the Asinelli Tower (Bologna) in presence of insufficient experimental data. J. Cult. Herit. 16, 536–543. doi: 10.1016/j.culher.2014.05.002
Pieraccini, M., Dei, D., Betti, M., Bartoli, G., Tucci, G., and Guardini, N. (2014). Dynamic identification of historic masonry tower through and expeditious and no-contact approach: Application to the ‘Torre del Mangia' in Siena (Italy). J. Cult. Herit. 15, 275–282. doi: 10.1016/j.culher.2013.07.006
Piyush, B., Devangm, V., and Katakiya, M. (2015). Impact of traffic vibration on heritage structures. Int. J. Adv. Technol. Eng. Sci. 3. Available online at: www.ijates.com
Ramos, L. F., Marques, L., Lourenco, P. B., De Roeck, G., Campos-Costa, J., and Roque, A. (2010). Monitoring historical masonry structures with operational modal analysis: two case studies. Mech. Syst. Signal Process. 24, 1291–1305. doi: 10.1016/j.ymssp.2010.01.011
Riva, P., Perotti, F., Guidoboni, E., and Boschi, E. (1998). Seismic analysis of the Asinelli Tower and earthquakes in Bologna. Soil Dyn. Earthq. Eng. 17, 525–550. doi: 10.1016/S0267-7261(98)00009-8
Roselli, I., Fioriti, V., Bellagamba, I., Mongelli, M., Tatì, A., Barbera, M., et al. (2017). Impact of traffic vibration on the temple of minerva medica, rome: preliminary study within the co.B.Ra. project. Int. J. Herit. Archit. Stud. Repairs Maintence 2, 102–114. doi: 10.2495/HA-V2-N1-102-114
Saisi, A., Gentile, C., and Guidobaldi, M. (2015). Post-earthquake continuous dynamic monitoring of the Gabbia Tower in Mantua, Italy. Constr. Build. Mater. 81, 101–112. doi: 10.1016/j.conbuildmat.2015.02.010
Ubertini, F., Cavalagli, N., Kita, A., and Comanducci, G. (2018). Assessment of a monumental masonry bell-tower after 2016 central Italy seismic sequence by long-term SHM. Bull. Earthq. Eng. 16, 775–801. doi: 10.1007/s10518-017-0222-7
Ubertini, F., Comanducci, G., Cavalagli, N., Laura Pisello, A., Luigi Materazzi, A., and Cotana, F. (2017). Environmental effects on natural frequencies of the San Pietro bell tower in Perugia, Italy, and their removal for structural performance assessment. Mech. Syst. Signal Process 82, 307–322. doi: 10.1016/j.ymssp.2016.05.025
Keywords: dynamic identification, structural health monitoring, masonry towers, ambient vibrations, traffic induced effects
Citation: Baraccani S, Azzara RM, Palermo M, Gasparini G and Trombetti T (2020) Long-Term Seismometric Monitoring of the Two Towers of Bologna (Italy): Modal Frequencies Identification and Effects Due to Traffic Induced Vibrations. Front. Built Environ. 6:85. doi: 10.3389/fbuil.2020.00085
Received: 08 November 2019; Accepted: 08 May 2020;
Published: 12 June 2020.
Edited by:
Luigi Di Sarno, University of Liverpool, United KingdomReviewed by:
Michele Betti, University of Florence, ItalyAnna Karatzetzou, Aristotle University of Thessaloniki, Greece
Filippo Ubertini, University of Perugia, Italy
Copyright © 2020 Baraccani, Azzara, Palermo, Gasparini and Trombetti. This is an open-access article distributed under the terms of the Creative Commons Attribution License (CC BY). The use, distribution or reproduction in other forums is permitted, provided the original author(s) and the copyright owner(s) are credited and that the original publication in this journal is cited, in accordance with accepted academic practice. No use, distribution or reproduction is permitted which does not comply with these terms.
*Correspondence: Simonetta Baraccani, c2ltb25ldHRhLmJhcmFjY2FuaTImI3gwMDA0MDt1bmliby5pdA==
 Simonetta Baraccani
 Riccardo M. Azzara
 Michele Palermo
 Giada Gasparini1
 Tomaso Trombetti